1. Introduction
Polymer matrix composites (PMCs) containing fibres continue to receive significant attention from industries like the automotive, aerospace, and agricultural sectors due to their improved mechanical and tribological behaviors over unreinforced polymers [
1]. Among the different kinds of PMCs, polytetrafluoroethylene (PTFE) matrix composites show more improved mechanical and tribological behaviors than neat PTFE matrix. They are used as tribological components in some sectors as a result of their high strength and better tribological behaviors [
2]. PMCs have indicated important enhancements in tribological behaviors, such as abrasive and sliding wear resistance [
3]. Therefore, more attention has been channeled towards reinforcing polymer matrices for tribological applications in lightweight, load bearing, and tribological conditions. For tribological applications, it has been shown that it PMCs are potential candidates in abrasive conditions [
4,
5]. For PTFE matrix composites, it is generally agreed that increasing the fibre content might improve or weaken its tribological behaviors [
6,
7]. PMCs with better tribological behaviors are used as brakes and clutches in automobiles and aircrafts [
8,
9]. PTFE continues to receive attention in tribological conditions for its low coefficient of friction, ease of processability, chemical inertness, low density, and low cost [
10,
11].
A frequent problem that occurs in industries is abrasive tribology. Many authors have experimentally studied the abrasion of polymer matrices and PMCs. For example, Kunigal and Kumar [
4] added nano-clay and discontinuous carbon fibre to a PA66/PP matrix. Different behaviors were observed on the addition of the reinforcements. Nano-clay-reinforced PA66/PP composite indicated better abrasion compared to carbon-reinforced PA66/PP composite [
4]. Shipway and Ngao [
12] studied the abrasion behaviors of different polymers and found that the polymers exhibited different abrasion behaviors. Moreover, it was revealed that distance was the most significant parameter influencing the abrasion behavior [
12]. Suresha, Ravi, Suresha, and Venkataramareddy [
13] investigated the abrasive wear of vinyl/ester matrices reinforced with glass and carbon fabric reinforcements. The results showed that vinyl/ester strengthened with carbon fabric demonstrated a lower tribological rate than glass-reinforced vinyl/ester composite [
13]. As reported by Liu et al., in particles filled with ultra-high molecular weight polyethylene (UHMWPE) matrix composites, the improvement of the abrasion property was attributed to the particles’ stiffness; in terms of the experimental parameter, it was found that applied load was the most significant parameter [
14]. In their study of the coefficient of the friction and abrasion behavior of epoxy reinforced with betelnut filler, Yousif, Nirmal, and Wong [
15] found that sliding the composites against coarser grains led to the maximum tribological rate. Similarly, mass loss increased when sliding velocity maximum [
15].
The above illustrates experimental studies that seem to be tedious and cumbersome. Thus, the design of experiment (DOE), a statistical tool that minimizes and simplifies experiments, thereby saving cost, time, and energy [
16], was introduced. A commonly used DOE method is the Taguchi orthogonal array (OA). It is an efficient, simple, and cheap method of optimization. It has been widely applied in the optimization of the tribological behaviors of PMCs, as will be illustrated in the following sections. Sudarash, Varadarajan, and Rajendra optimized the tribological parameters of PMCs, and the results showed that applied load was the most influential factor affecting the wear rate [
17]. Ramesh and Suresha arranged the significance of factors influencing the abrasion behaviors of reinforced carbon epoxy composites as filler content > grit size > filler type [
18]. Similar findings were obtained in the study of graphite and silicon carbide reinforced composites under dry conditions [
19]. Cho Pogosian and Bahadur reported that particle content was the most influential factor influencing the tribological rate of polyphenylene sulfide matrix composites [
20]. Chauhan and Thakur (2013) optimized the friction and sliding wear of submicron size cenosphere particle-reinforced vinyl ester composites [
21]. Cenosphere filler was the most influential parameter on coefficient of friction and wear rate, as seen in the analysis of variance (ANOVA) results [
21]. In his study of PTFE-filled composites, Şahin established that grit size was the most significant parameter, followed by load, distance, and flexural strain [
22]. Sudarshan looked into the influence of filler content, load, and distance on the abrasive wear property of epoxy-reinforced matrix composite. According to the findings, it was demonstrated that sliding distance was the most influential factor affecting the wear rate [
23]. Darshan, Suresha, and Jamadar [
24] studied the effect of parametric wear rate of Hallosyte nanotube reinforced basalt/silk epoxy composite. Four parameters viz abrading distance, amount of filler, applied load, as well as silica sand size at three levels were considered. The results showed that abrading distance was the most influential control factor that affected the wear rate [
24]. The Taguchi method establishes single parameter significance. Consequently, to establish multiple significance, the Taguchi method has been coupled with grey relational analysis (GRA). Dharmalingam, Subramanian, and Kok [
25] combined the Taguchi approach with GRA to optimize the abrasive tribological property of aluminum hybrid metal composites. It was found that grit size and applied load were the most significant parameters affecting the wear rate and coefficient of friction, respectively, of the composites [
25]. Based on the mean response Taguchi–GRA results, Sylajakumar, Ramakrishnasamy, and Palaniappan [
26] found that load at 60 N, a speed of I ms
−1, and a distance of 1000 m were the optimal control factors. ANOVA revealed that distance gave the highest contribution of 61.05% to the wear rate of the C4 composites. An improvement of 35% in the grey relational grade was achieved on validation [
26]. Savaran and Thanigaivelan [
27] used the same approach hybridized with principal component analysis (PCA) for the optimization of the laser parameters of the dimple geometry of stainless steel. It was found that that optimal GRG peak value of 0.2642 was obtained at an average power of 12 W, pulse duration of 1500 ns, and a frequency of 15 Hz. ANOVA showed that average power was the most significant parameter, while depth was of little or no importance [
27].
The prediction of the abrasive tribological behaviors of PMCs is not an inconsequential role, and the departure from generality behaviors are common. Generally, it is difficult to predict the tribological behaviors of PMCs due to the interdependencies among the process variables. Tribological modelling usually entails a significant number of experiments together with analytical modeling and/or numerical simulation, leading to high costs, time consumption, and energy losses. As a panacea to this, the use of machine learning to build predictive models that can function with relatively small datasets and are capable of drawing conclusions regarding nonlinear, complex, and noisy data is essential. Different artificial intelligence (AI) models, such as artificial neural networks (ANN), adaptive neuro-fuzzy inference systems (ANFIS), and support vector regression (SVR) models, have been applied in different aspects of tribology. Velten, Reinicke, and Friedrich [
28] employed ANN to predict the wear rate of a PTFE matrix strengthened with discontinuous carbon and glass fibre composites. The prediction accuracy of the models was also influenced by the amount of training. The ANN results showed better agreement with the trial results [
28]. ANNs were also used by Zhang, Friedrich, and Velten [
29] to predict the volume loss and coefficient of friction of glass-reinforced polyamide matrix composites. To search for the optimal model, five different learning algorithms were tried. The learning algorithm results showed that the Levenberg–Marquardt algorithm was the optimum, having a prediction capacity of 87.59%. The predicted outputs showed reasonable agreement with the measured outputs [
29]. Equally, ANNs were used to predict the tribological and mechanical properties of behaviors and the mechanical properties of short-fibre PMCs [
30,
31]. The prediction performance of the ANN model was compared with the ANFIS model by Haghigat, Semnani, and Nouri in the specific wear loss prediction of graphite-, carbon-, and nano-TiO
2-filled PTFE matrix composites. After trying different learning algorithms for ANN, the LM algorithm was the best, while for the ANFIS model, the trapezoidal membership function was the best. The comparative results showed superior prediction performance to the ANN model [
32]. Taguchi–ANN has been used to optimize and predict the abrasion of industrial waste and glass-filled polyester matrix composites. The combination of optimal parameters for minimum wear was found to be 1.8 ms
−1-10 N-15 %-80 m for industrial waste, and for glass-reinforced polyester matrix composite, the combination was s 2.10 ms
−1-10 N-15 %-70 m for the speed, load, filler amount, and distance, respectively. The ANN predictions showed better performance than the linear regression model [
33]. The SVR model was used in the prediction of the tool flank wear performance of machine surface [
34], the tool wear face milling of mild steel [
35], and the diameter of PCL/gelatin [
36]. The ANN model was compared with the Harris Hawk optimization (HHO) model in the optimized prediction of the abrasive tribological behavior of ultra-high-strength martensitic steel. The prediction results of the models revealed that the ANN–HHO model gave better prediction than the ANN as a single model [
37].
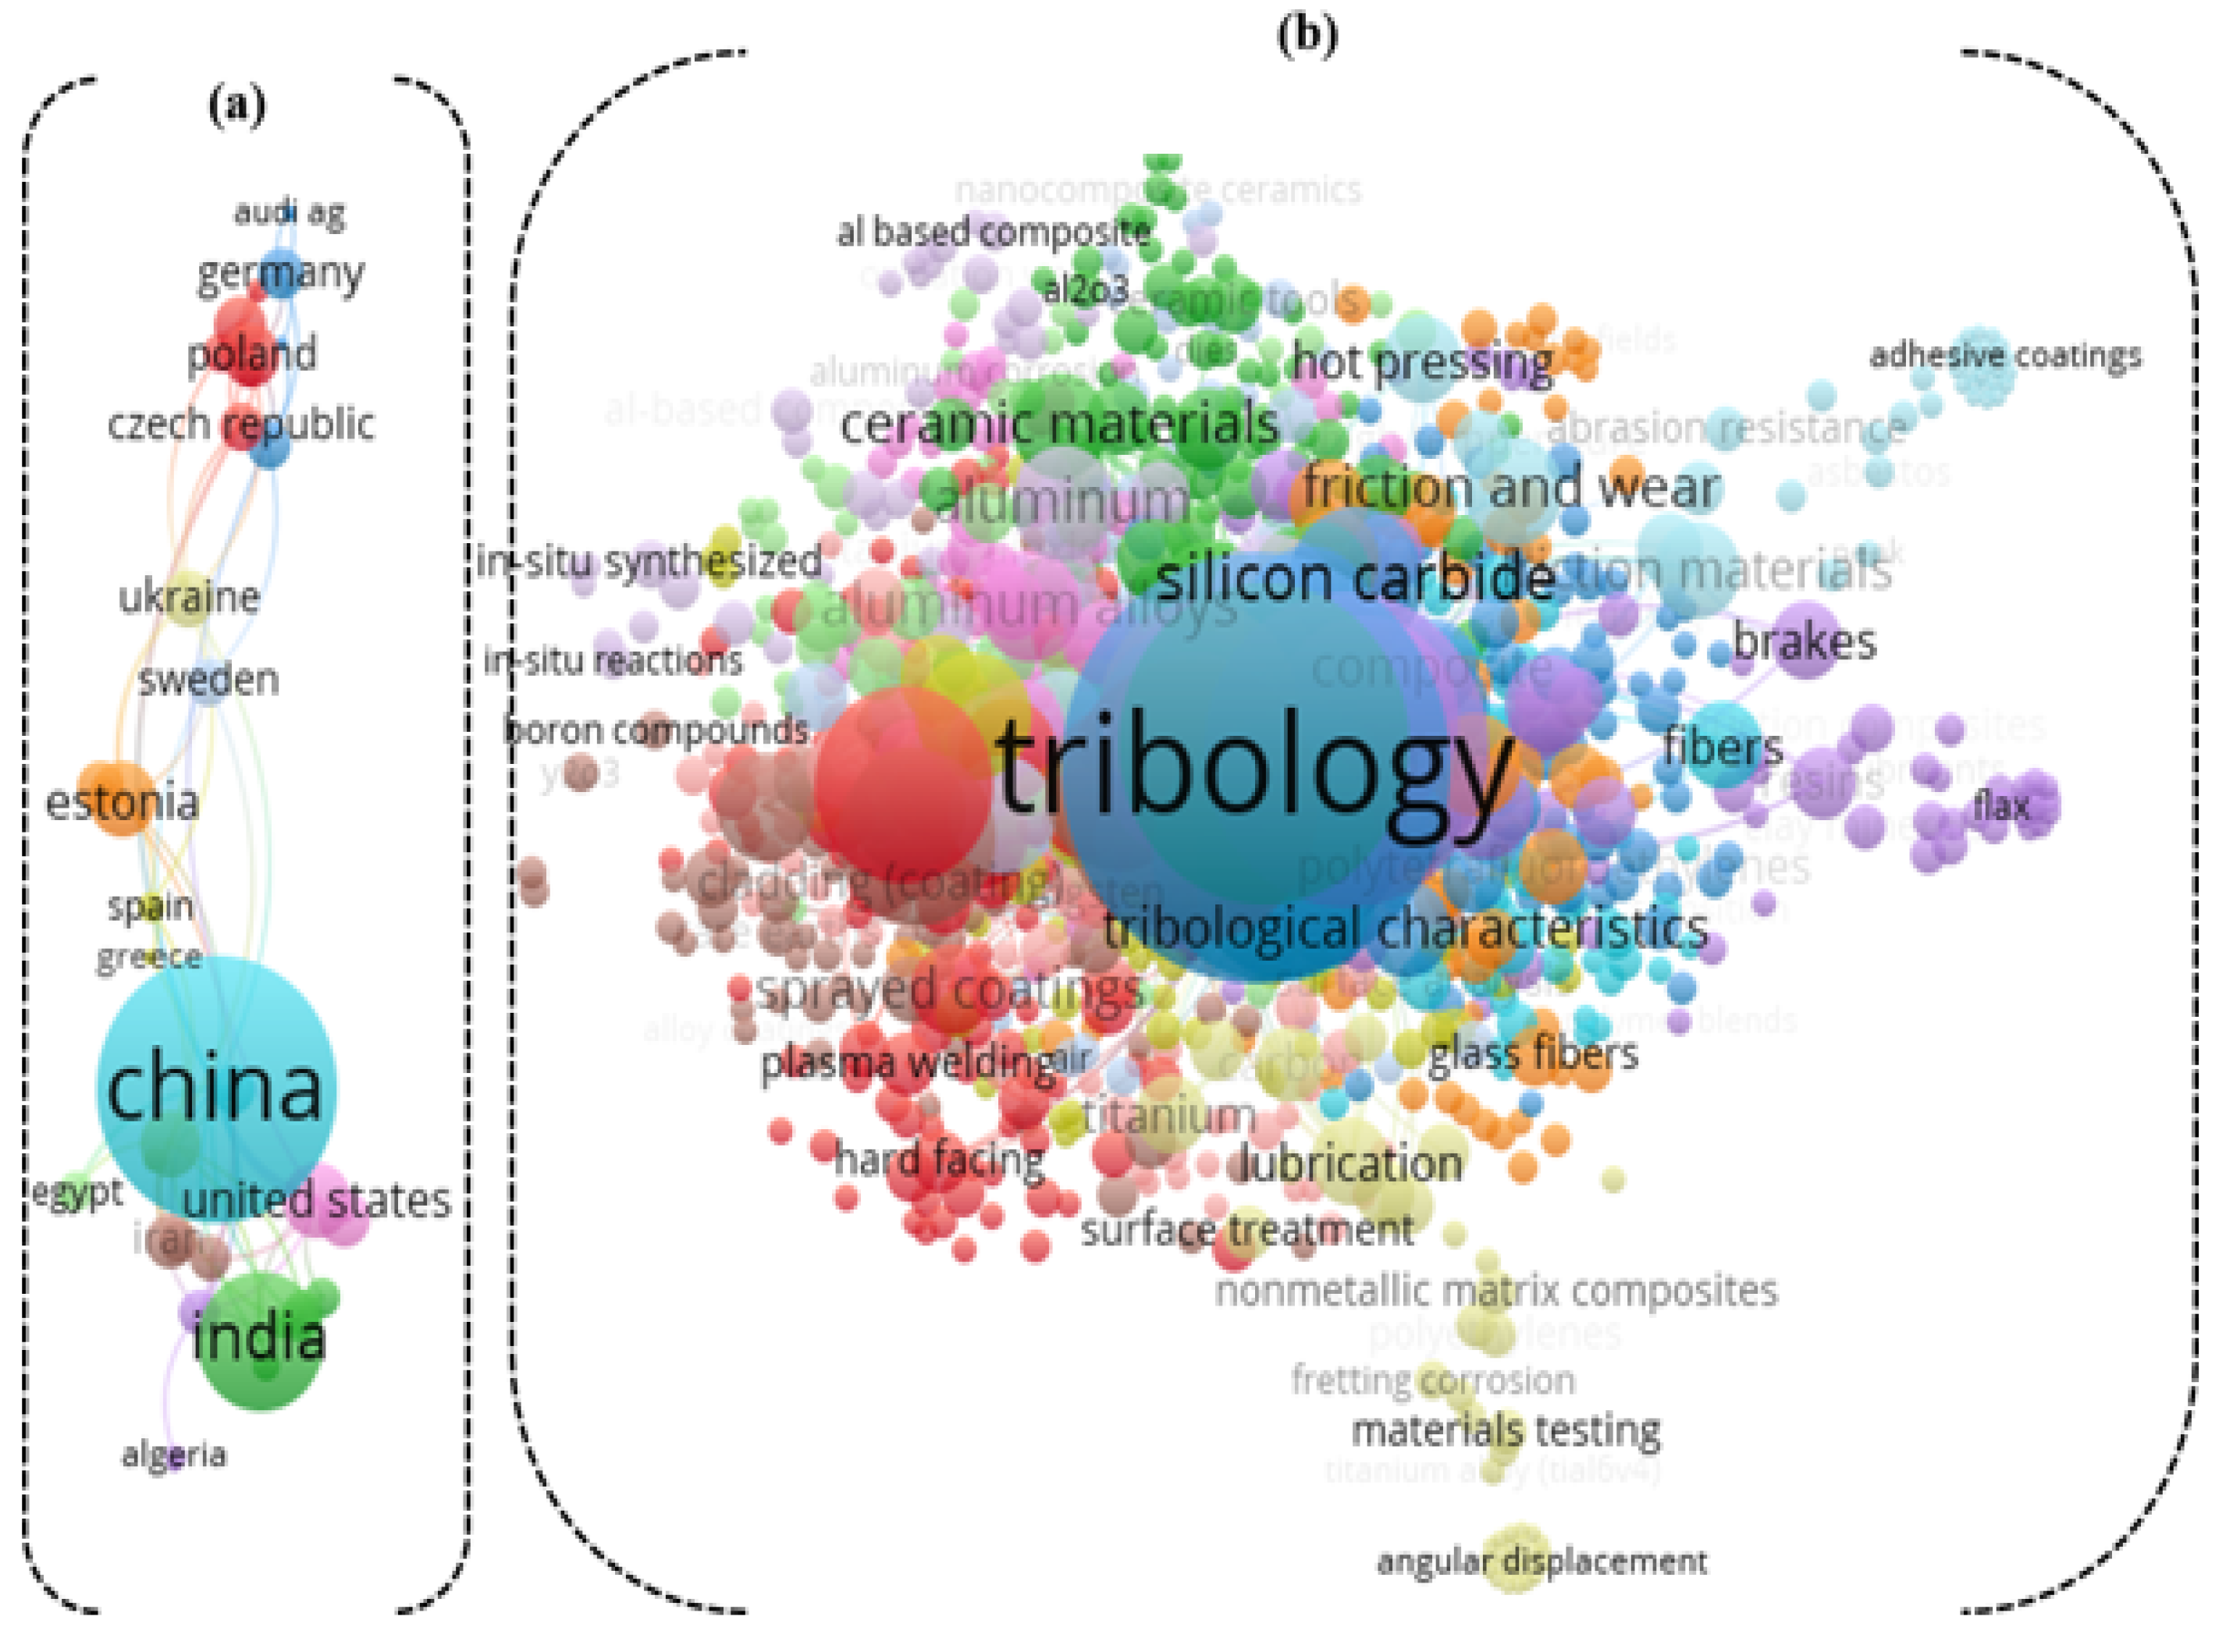
Although AI models indicate practical and promising capabilities in the field of material sciences, they are still associated with certain limitations and challenges such as numerous and qualitative data, which serve as the prerequisite requirements. Even though various material characteristic databases are accessible, discrepancies in the data provided by different parties make machine learning algorithms difficult to apply effectively. Machine learning models are also known to break the principles of physical science, because they are frequently driven solely by the data provided and do not take into account any chemistry/physics-based knowledge. A survey of the reported literature on the database Scopus yielded the finding that there were 450 peer-reviewed papers, from 1989 to date, focusing on the abrasive tribological behaviors of PTFE matrix composites, indicating the wide range of interest in this topic.
Figure 1b shows 388 keywords that occurred among those studies, indicating the deep interest and implementation in this field. In addition, the popularity of this study topic was investigated in different regions throughout the world, with the bulk of the countries producing output being China, the United States, and India (
Figure 1a). The motivation of this study demonstrated excellent AI models for the prediction of the abrasive tribological behaviors of PTFE matrix composites. Generally, each study progressed to a higher degree of accuracy for observations and efficiency at a deeper level than the previous one. To the best knowledge of the authors, no study published in technical literature has predicted the abrasive tribological behaviors of PTFE matrix composites employing this approach. As a result, the goal of this work is to perform multi-response optimization and to predict the abrasive tribological behaviors of PTFE matrix composites using hybridized Taguchi and novel AI hybridized SVR models, respectively.
4. Discussion
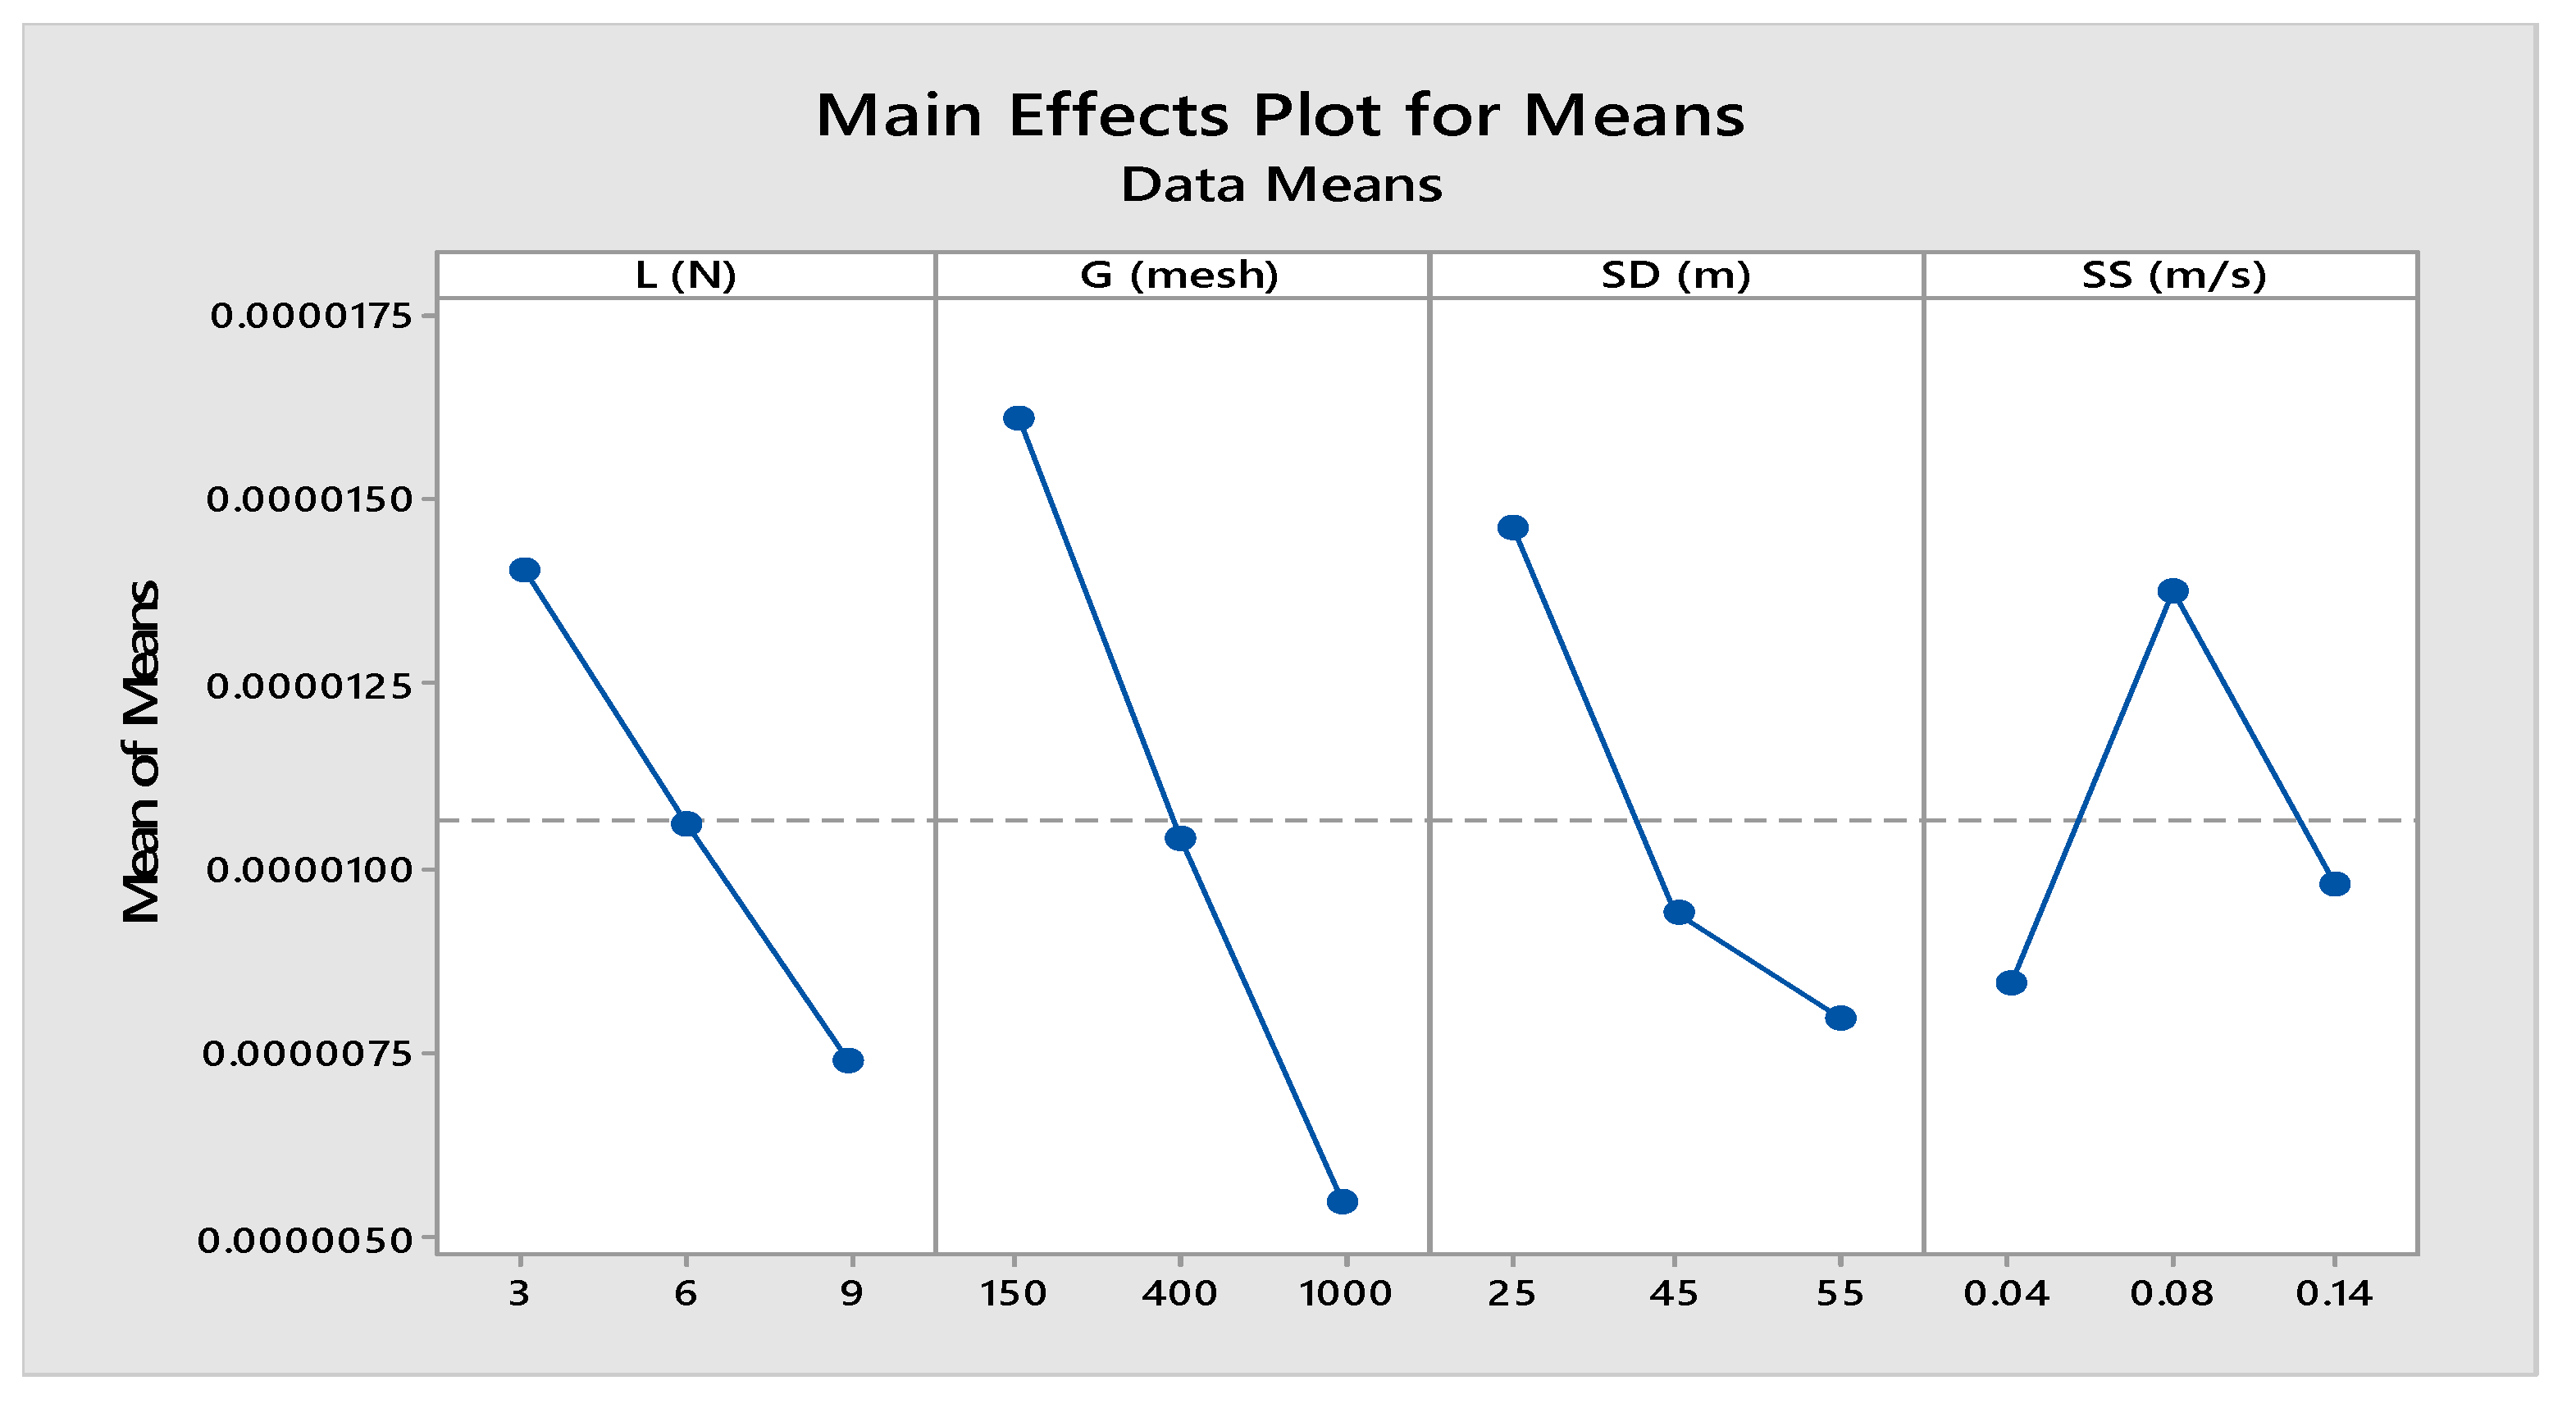
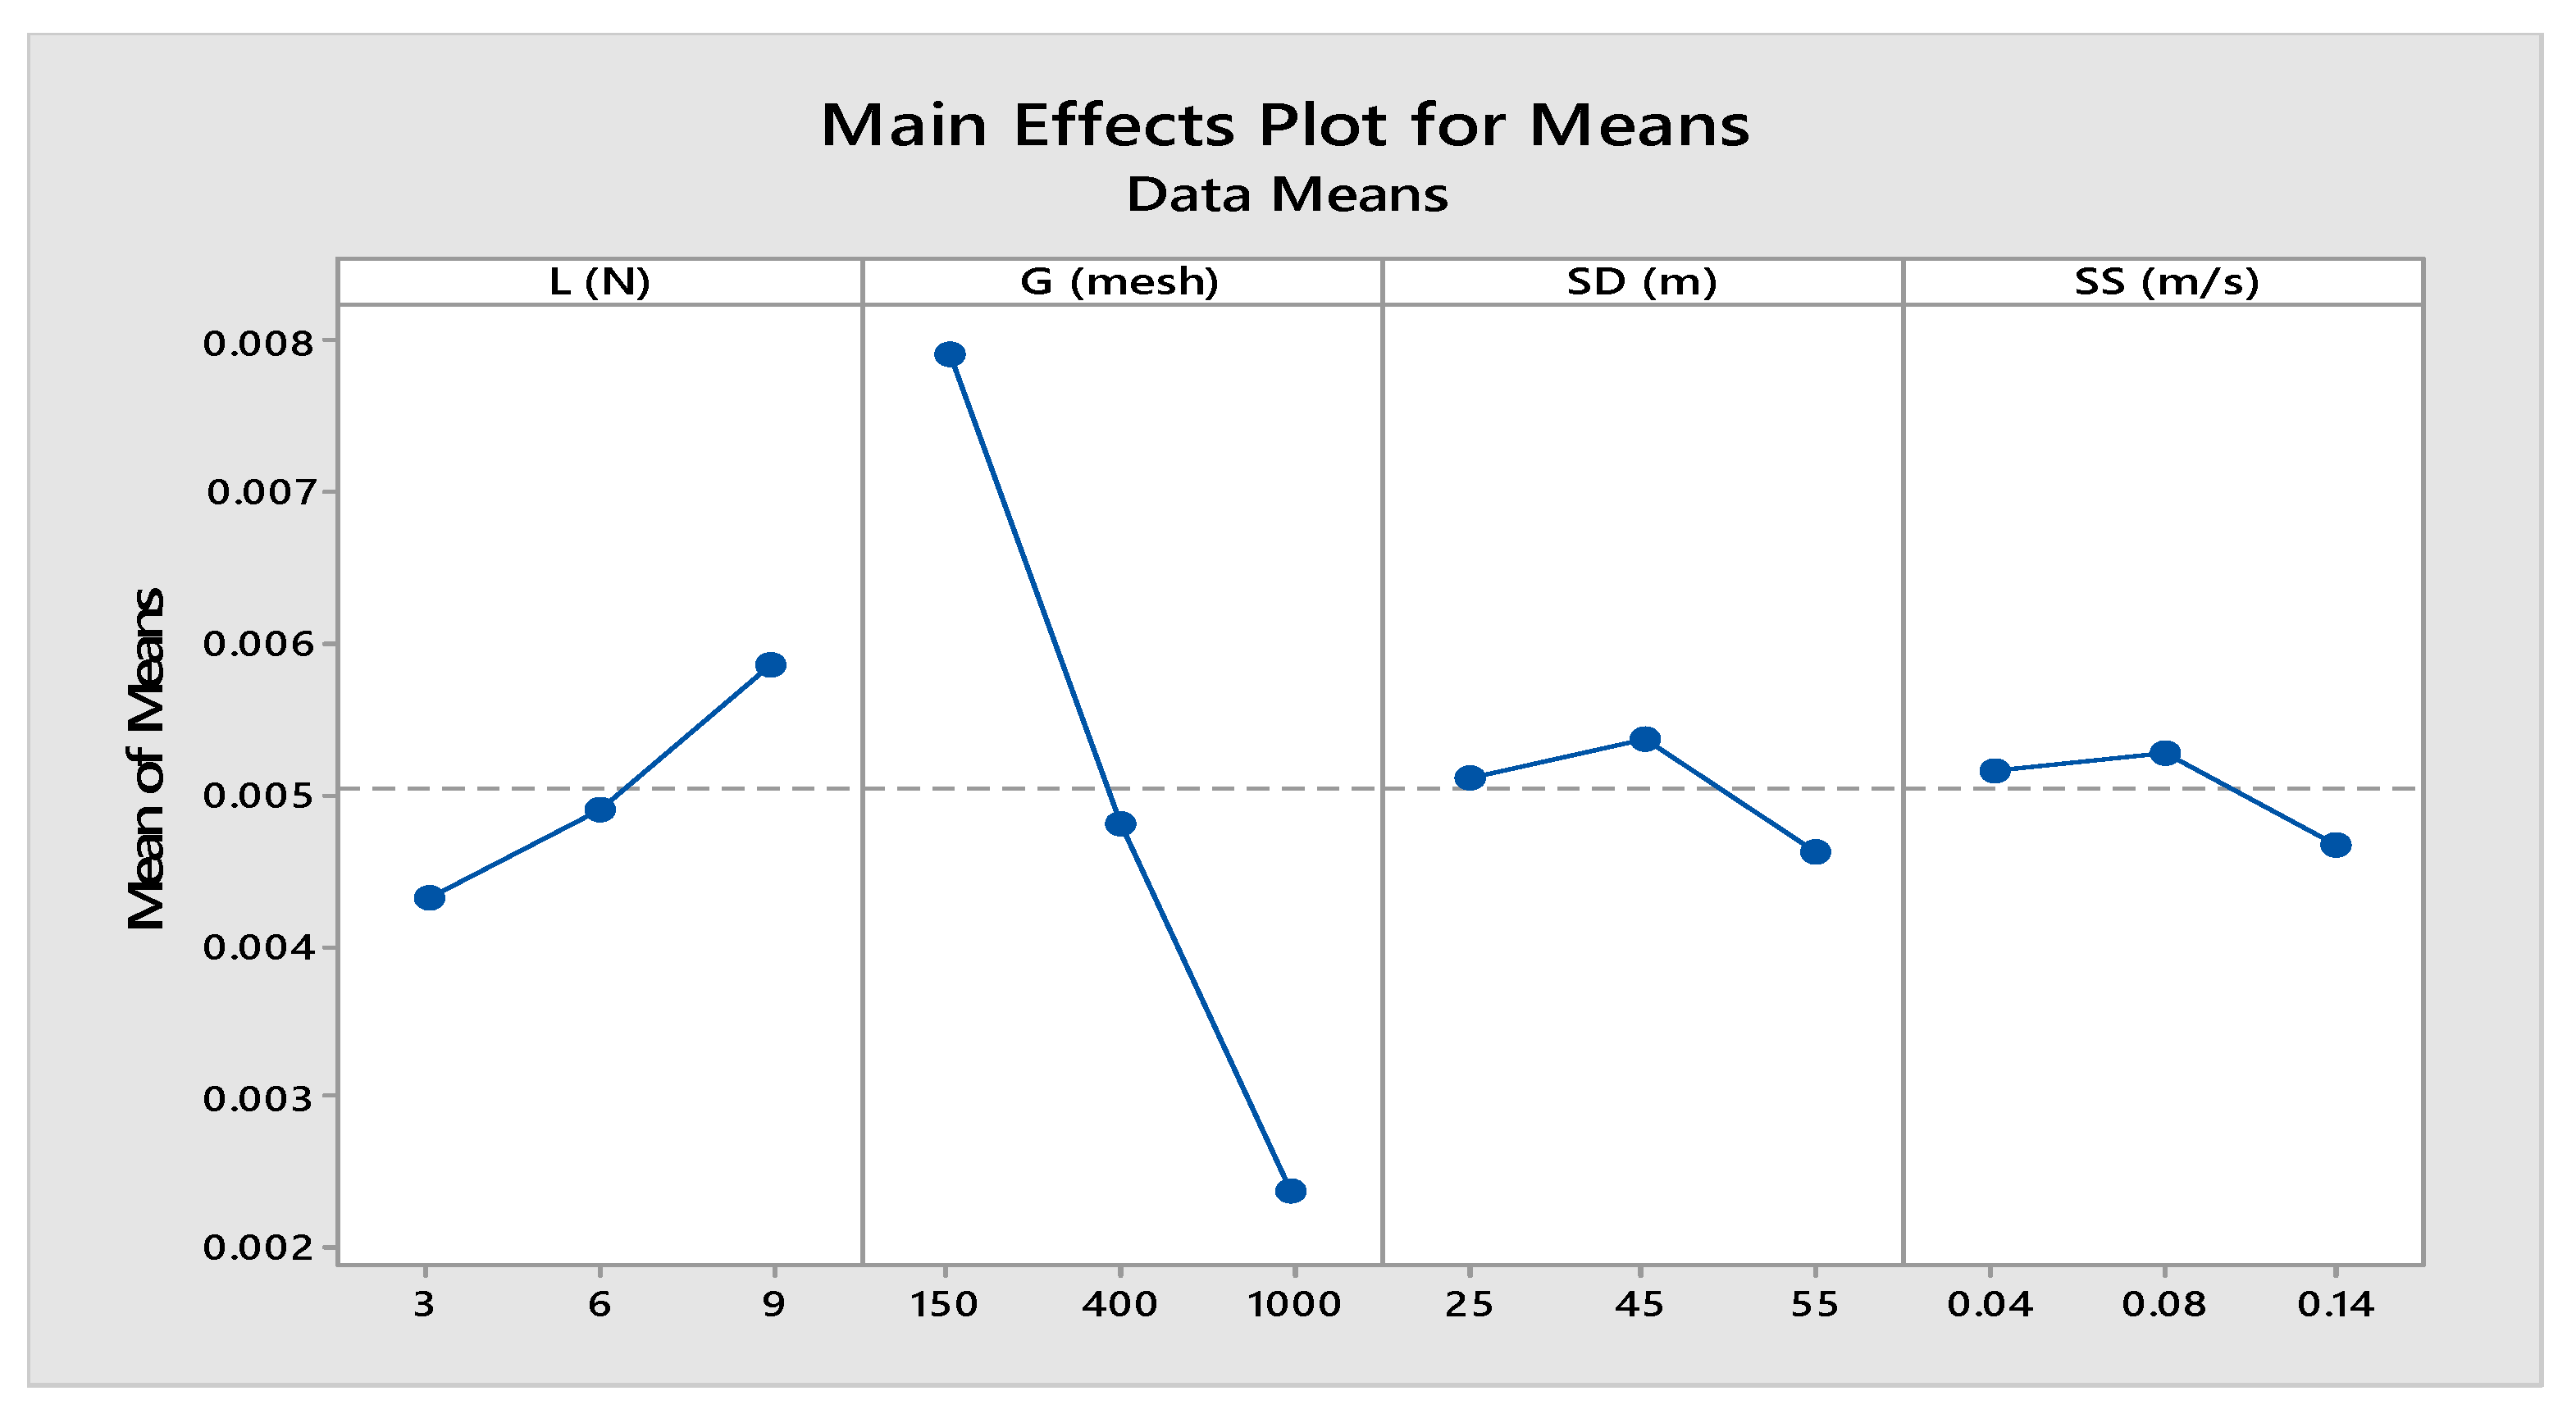
In
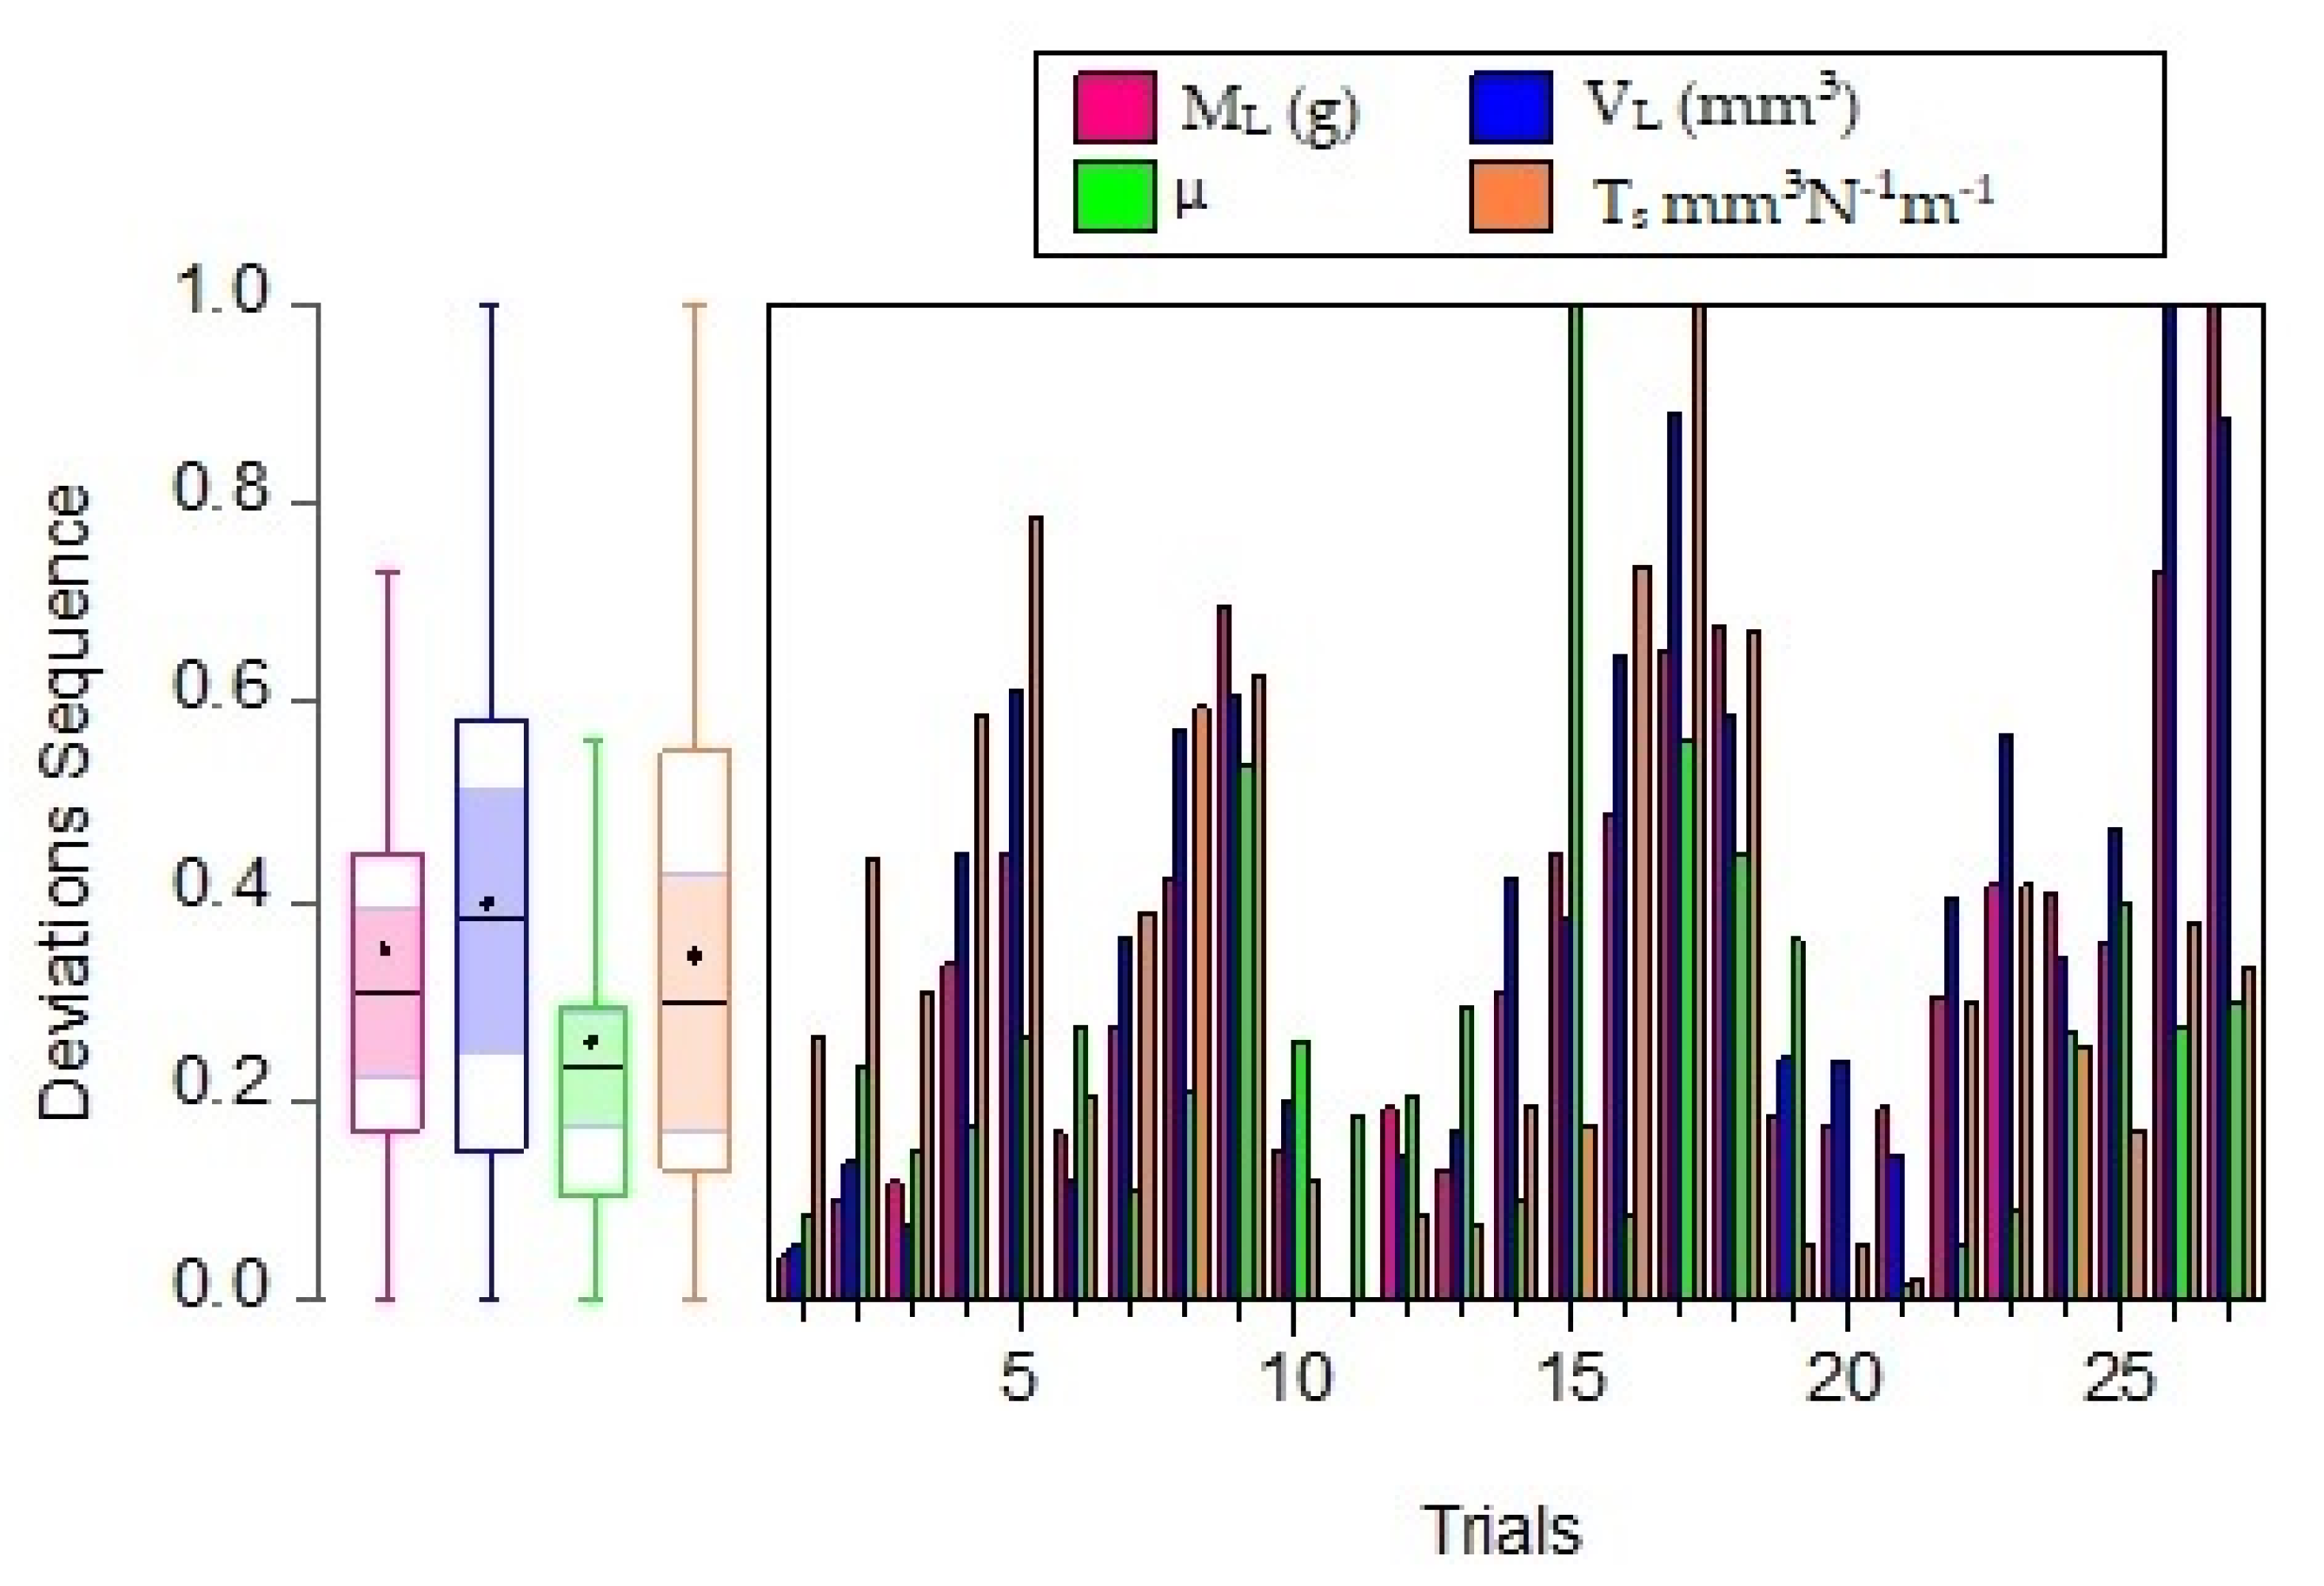
Figure 7, it can be seen that increasing the load increased the mass loss of the materials. The ability of composite materials to resist wear relies on the composites forming adherent, uniform, and thin transfer film on the counter wheel [
43,
44]. The transfer film along the counter wheel stops the direct interaction between the materials (PTFE matrix composites) and metal counter wheel face, preventing abrasive action and hence leading to reduced mass loss. Therefore, the reason for the increase in mass loss due to an increase in the load is attributed to the high load breaking the tribolayer between the composites and the counterface. Moreover, the decrease in the mass loss due to an increase in speed, distance, and grit size is related to the formation of an adherent, thin, and uniform tribolayer. The insignificant lower mass loss of the CF25 composite compared to the BF40 composite was connected to the carbon fiber’s inherent properties. This finding tallies with [
19,
43,
45]. The decrease in volume loss due to an increase in the sliding distance and speed is attributed to an increase in temperature at high speed, forming a layer preventing direct contact with the counter wheel face. The CF25 composite exhibited the best and worst volume loss at run 6 and 26, respectively. The minimum volume loss is related to the lower grit size, while the maximum was as a result of a higher grit size and the highly brittle nature of carbon fiber.
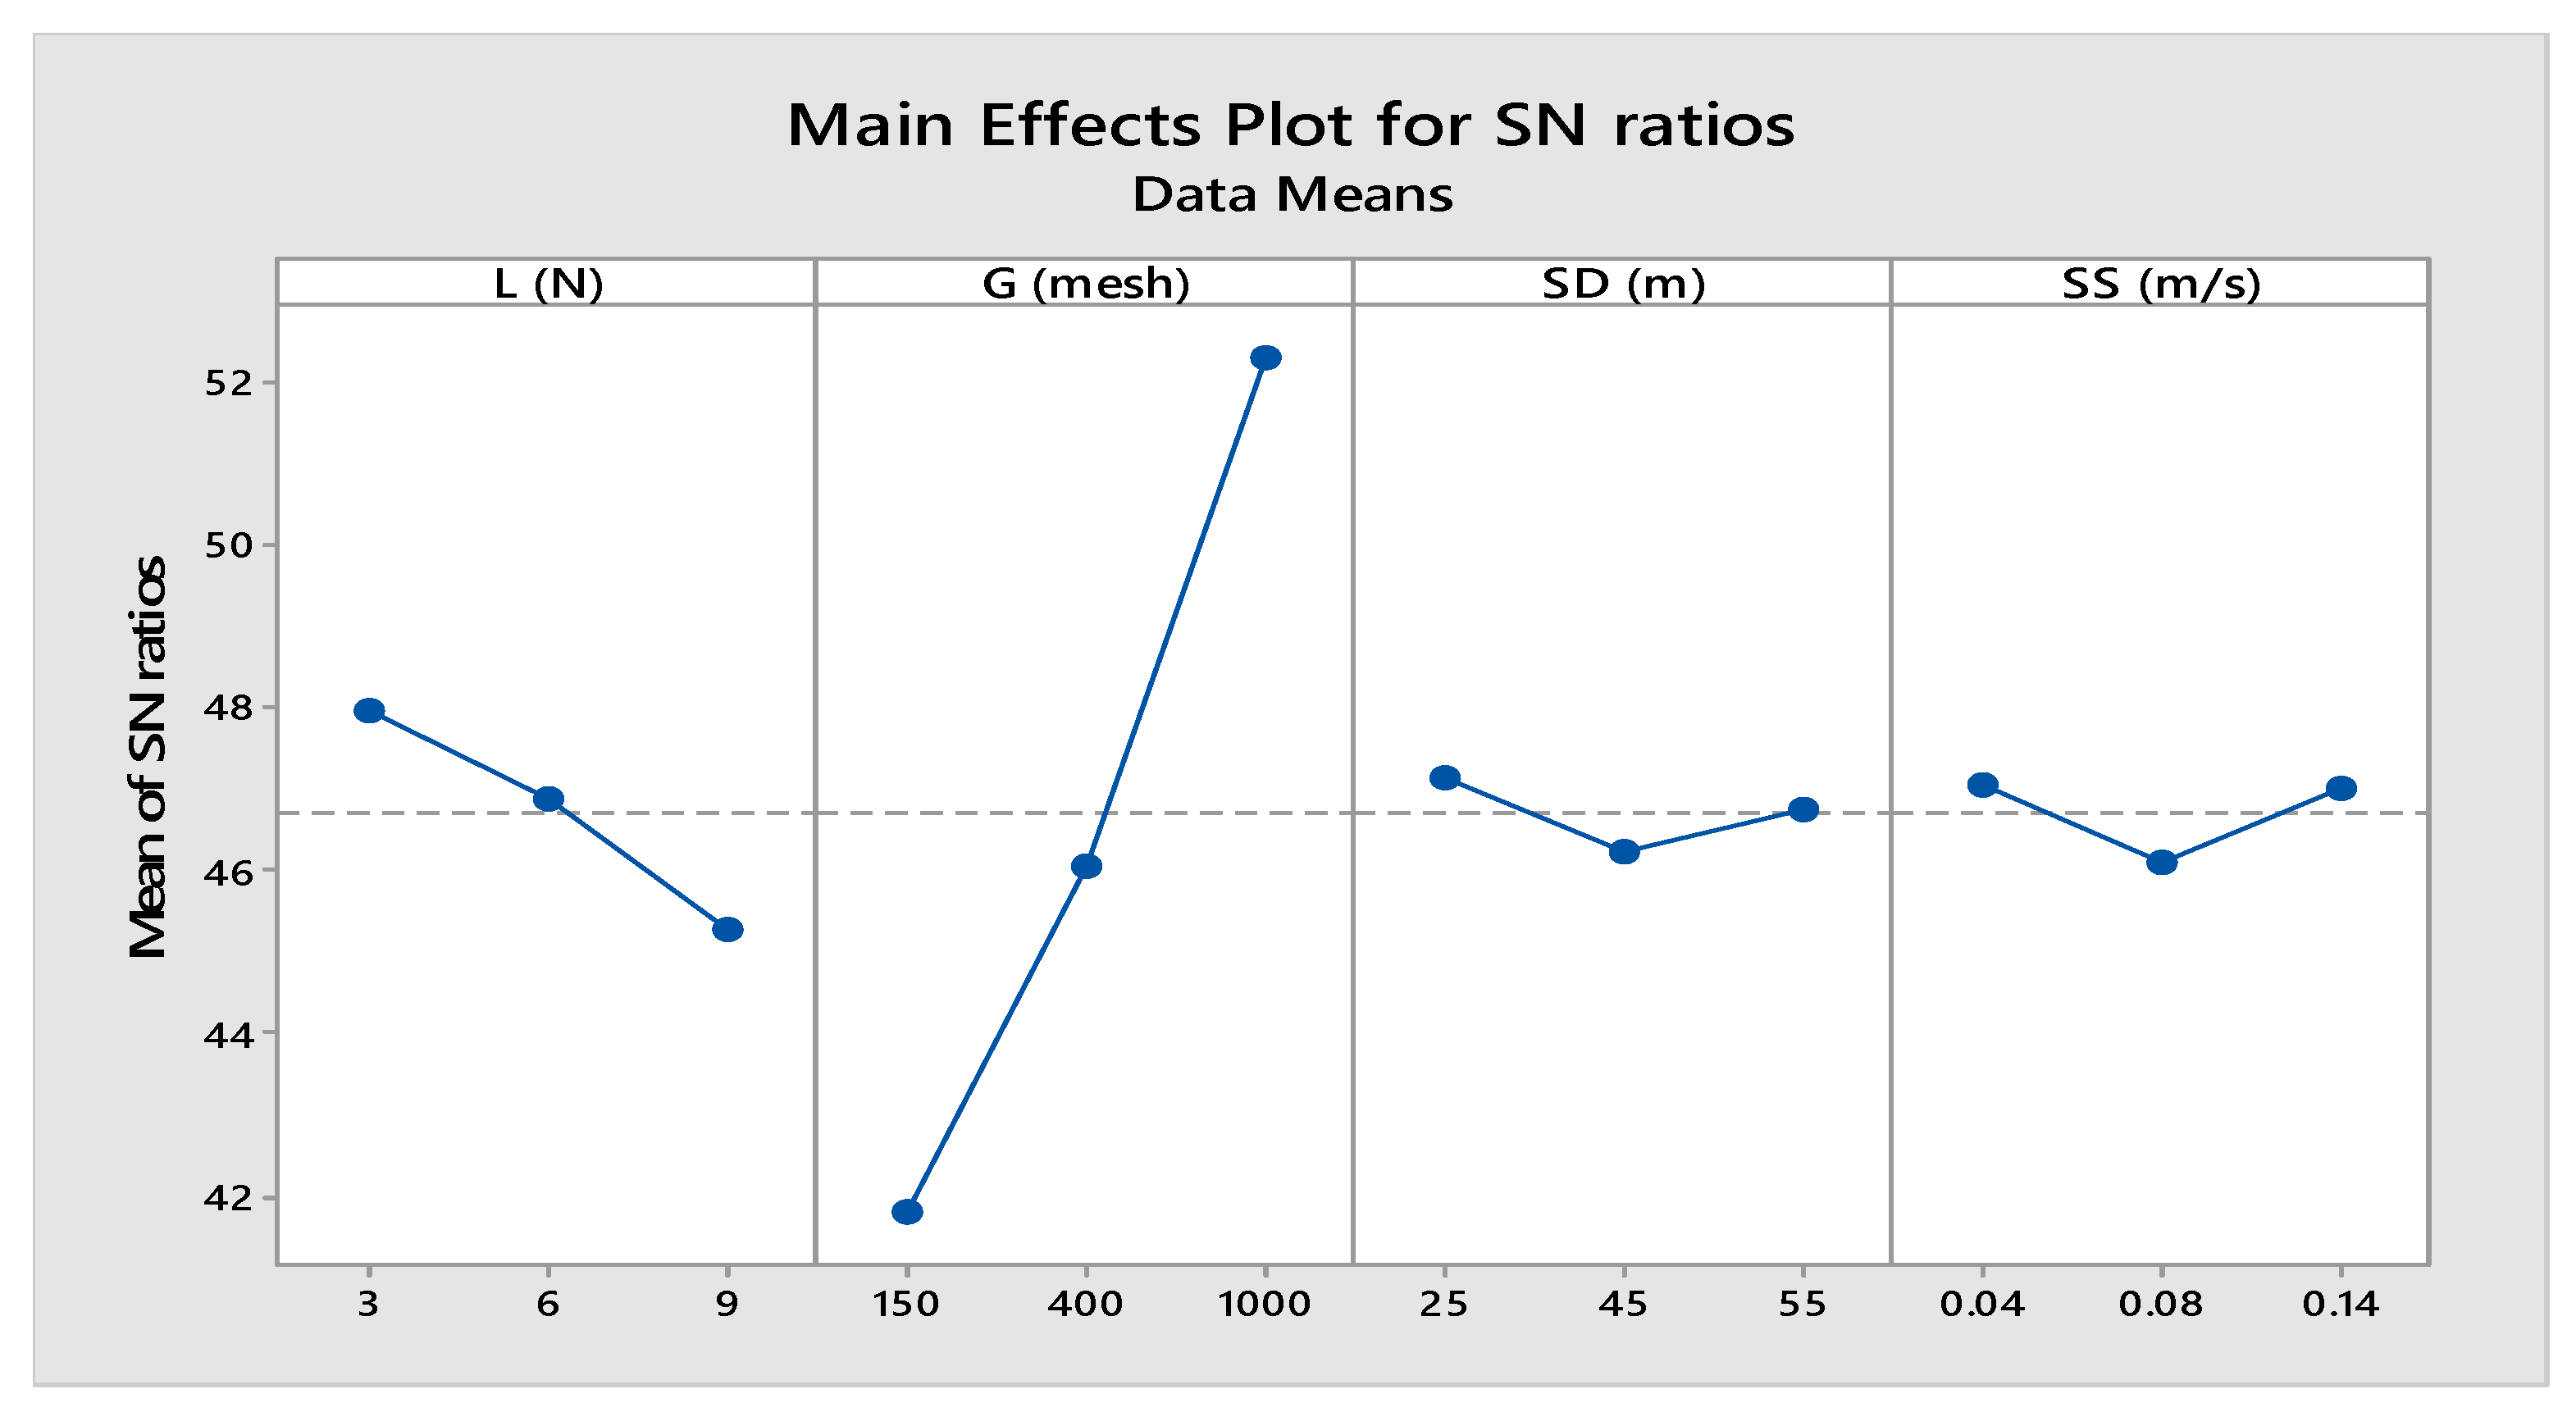
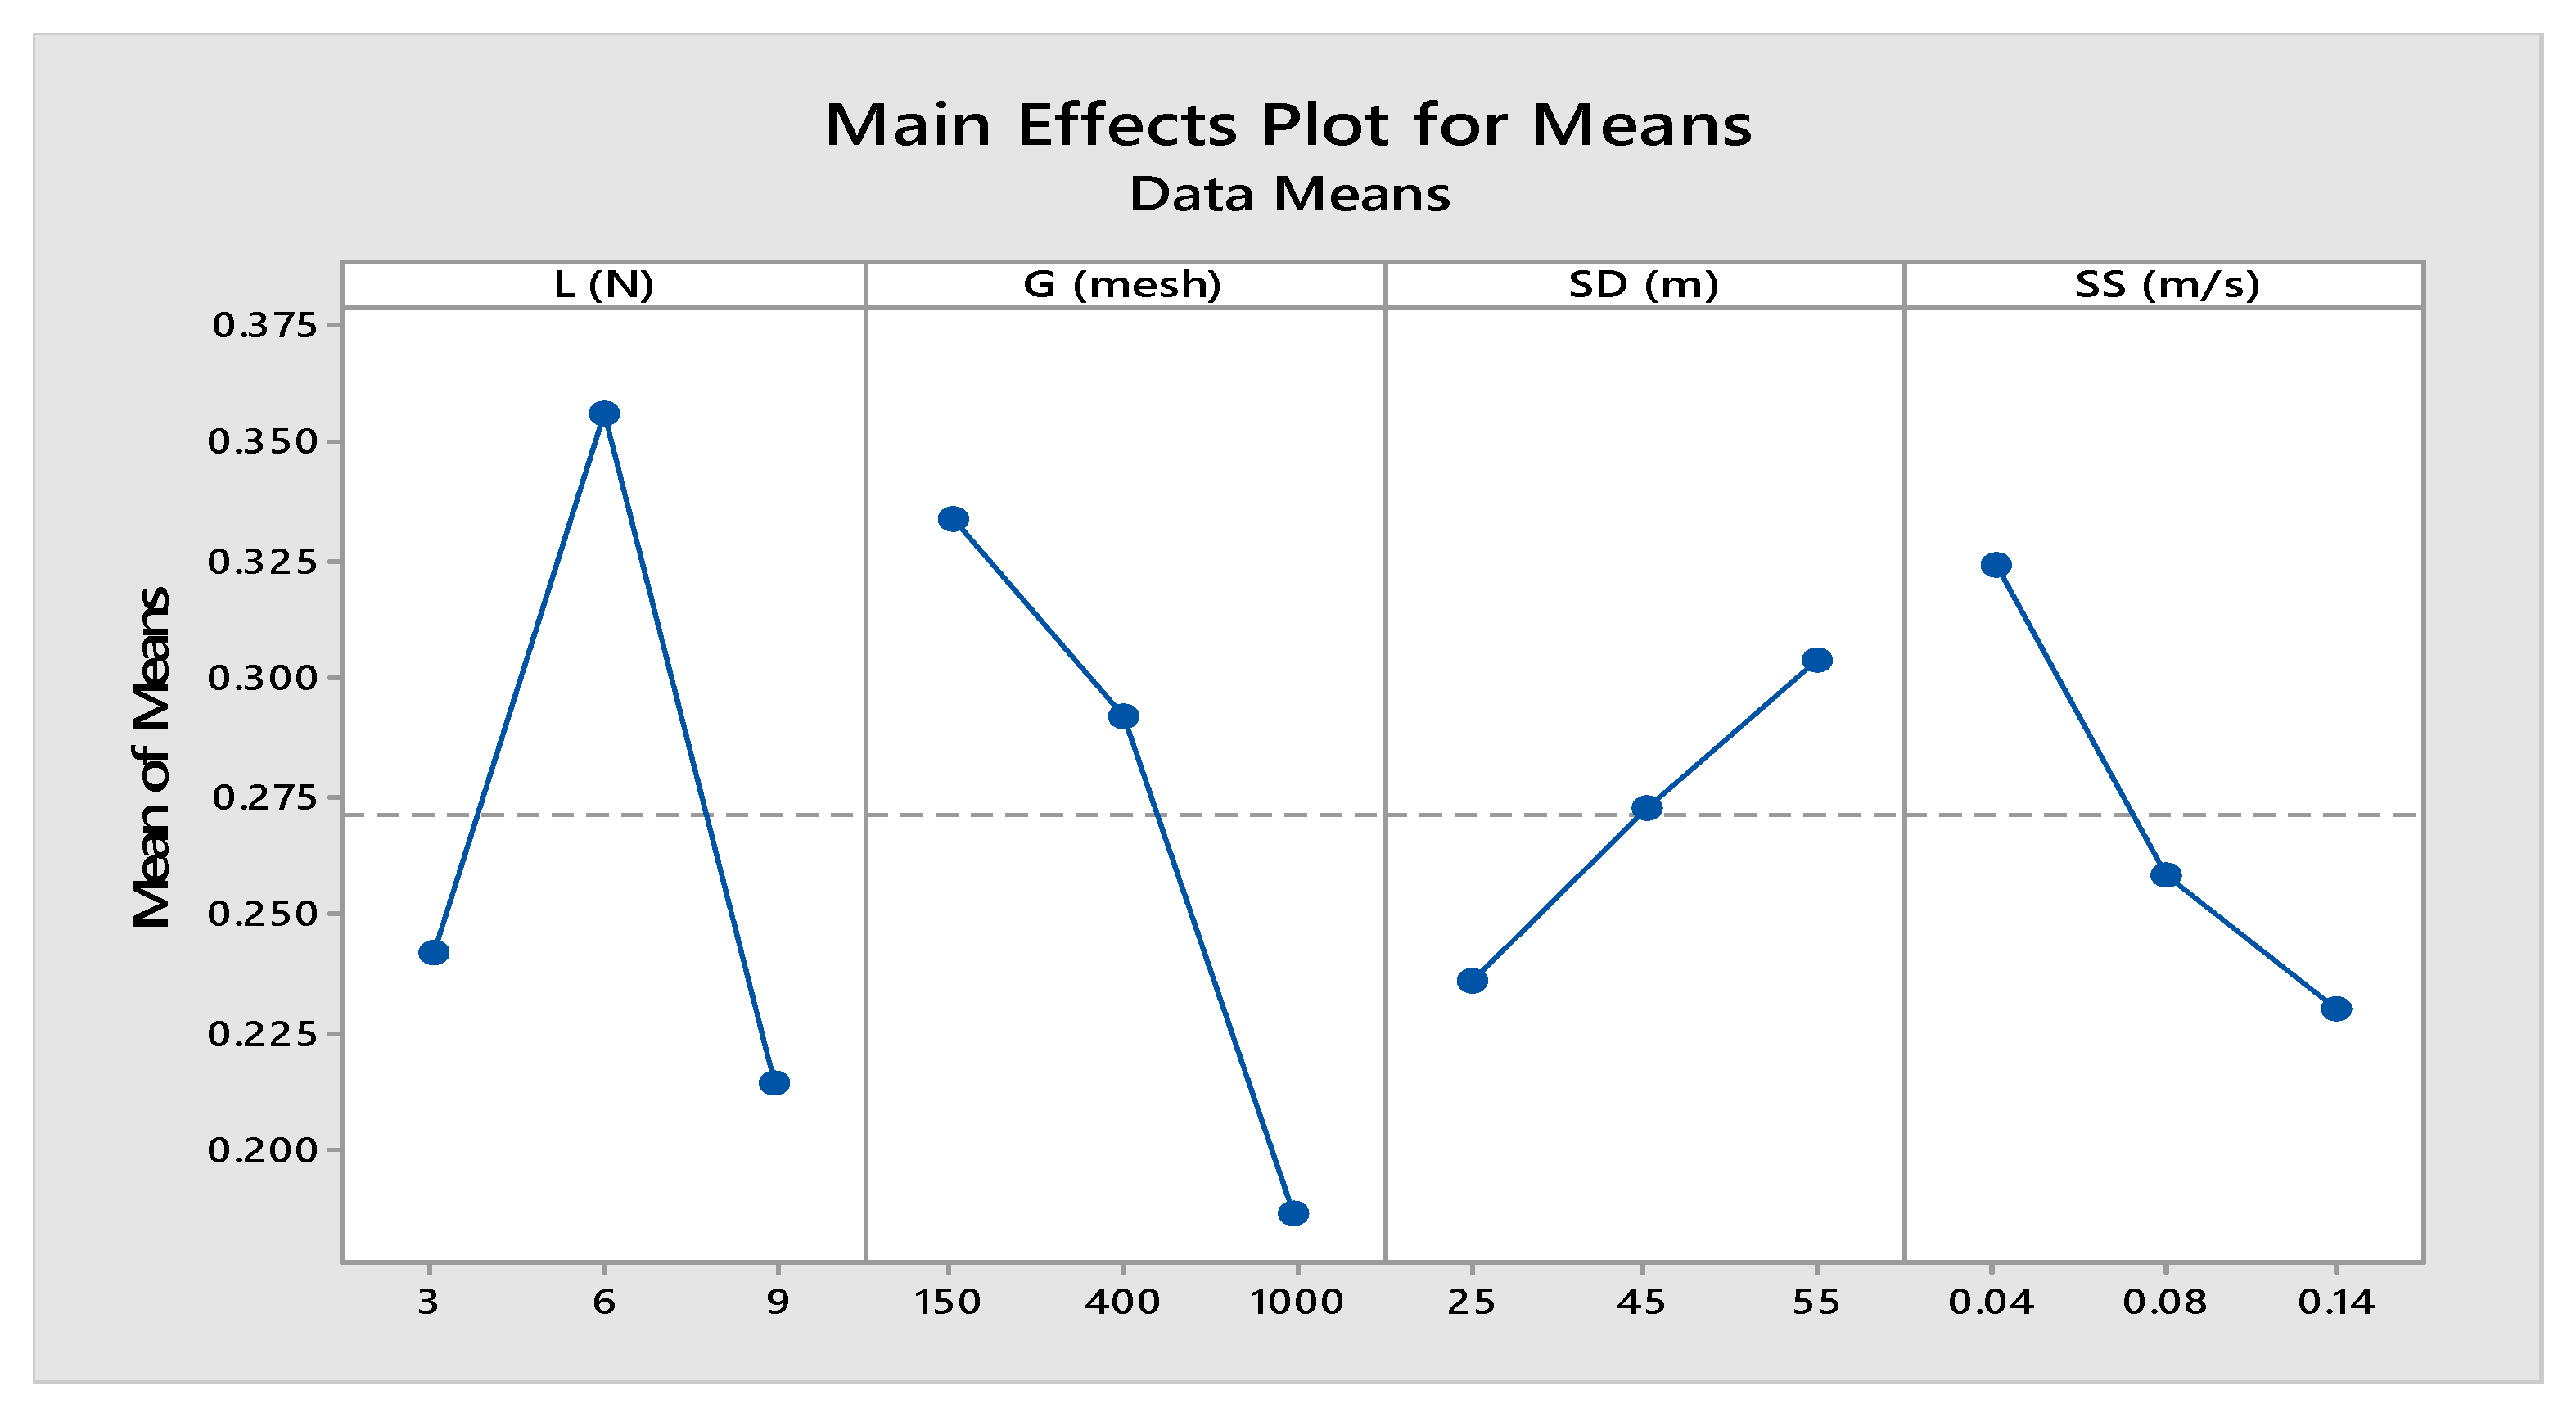
As noticed in
Figure 9, the lowest μ was attained at 9 N. The reason for this is the formation tribolayer at the interacting state, as well as the temperature and visco-elastic-related behaviors of the PTFE matrix composites. This layer prevented the PTFE matrix composites from coming into direct contact with the abrasive surface, thus minimizing μ. Similar observations were made by [
46]. The high μ at 6 N was perhaps due to the tearing of the transfer film at the contact region. This finding was contrary to the results obtained by [
47]. High μ at 150 mesh is related to the high roughness of the SiC paper that offered a significant amount of resistance, while the low μ at 1000 mesh is attributed to the smoothness of the abrasive paper that offered little resistance to the samples—all due to the formation of the protective layer at the contact surface. The high friction due to an increase in the sliding distance is explained on the basis that the distance acted as a lubricant to the rubbing surfaces. Thus, when the distance is increased, the lubrication is lost, thereby leading to excessive wear. The reason for the lower μ owing to an increase in the sliding speed is attributed to the adhesion between the matrix and the fibers as a result of the elevation in temperature. This is because when the sliding speed increases, the materials’ strength is reduced, but their adhesion (tribolayer) is enhanced due to the elevated temperature. The low μ due to the increase in speed is related to the decrease in the contact time of the abrasives due to the high speed, thereby reducing the intensity of the tangential forces.
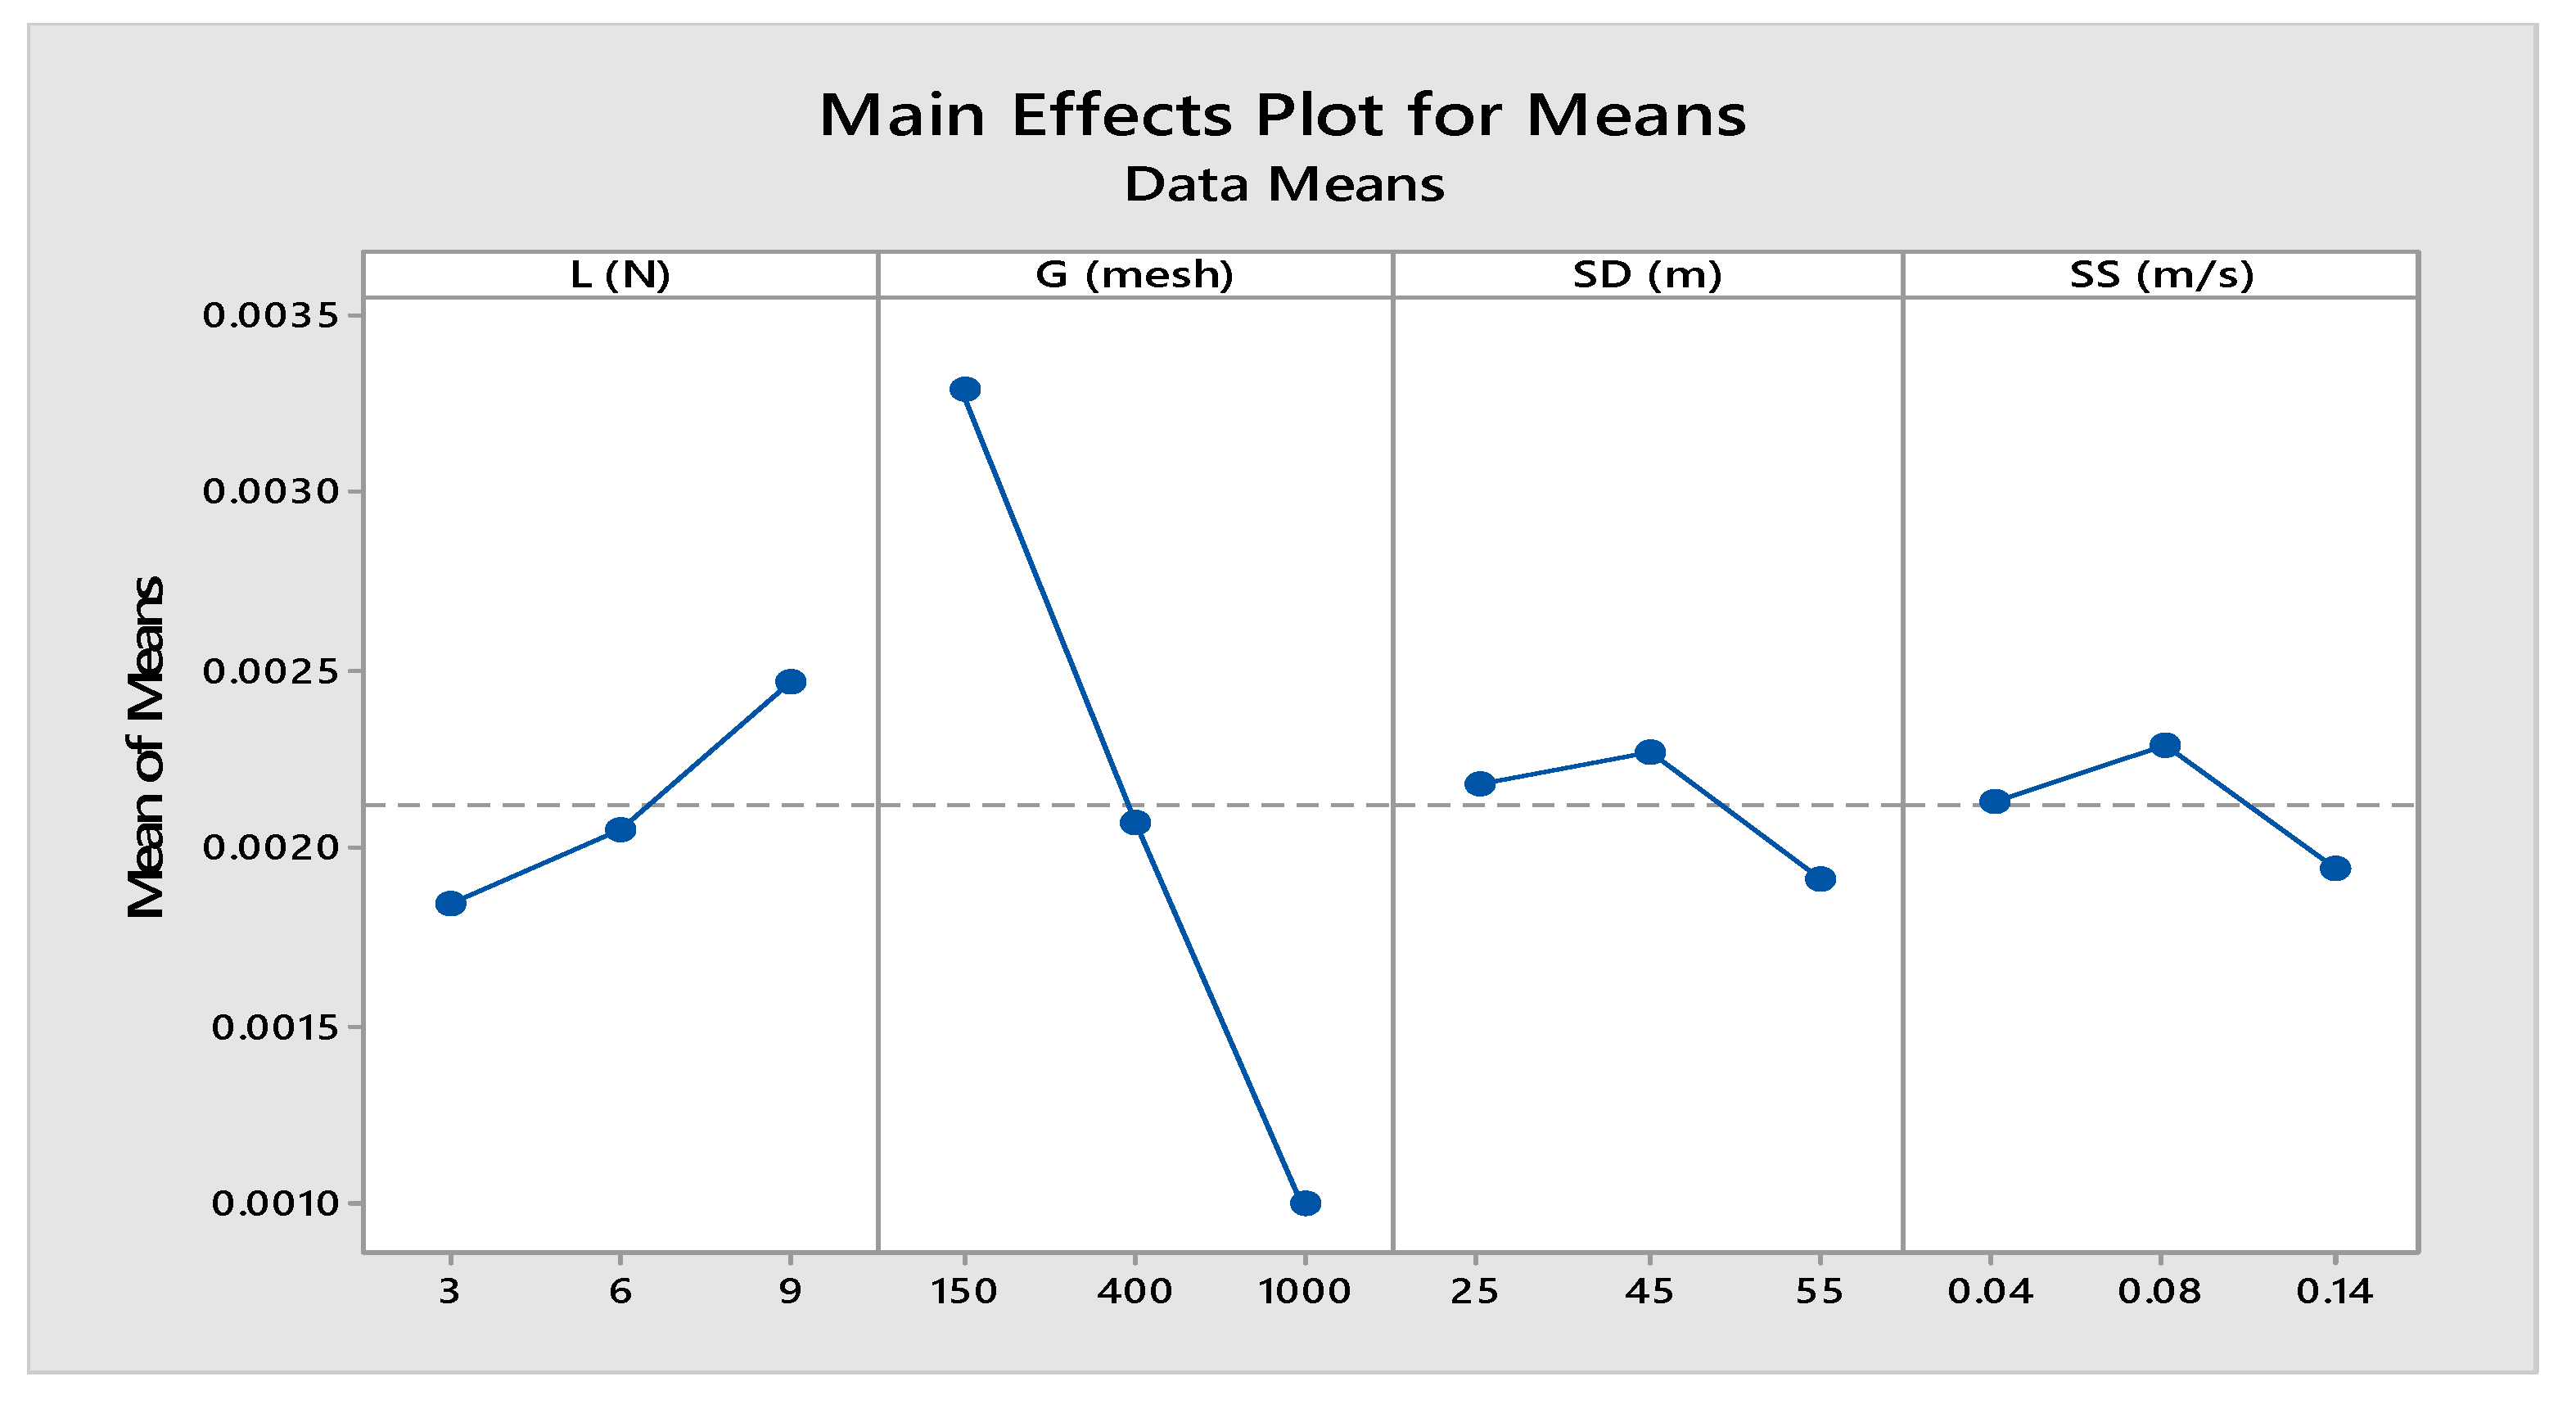
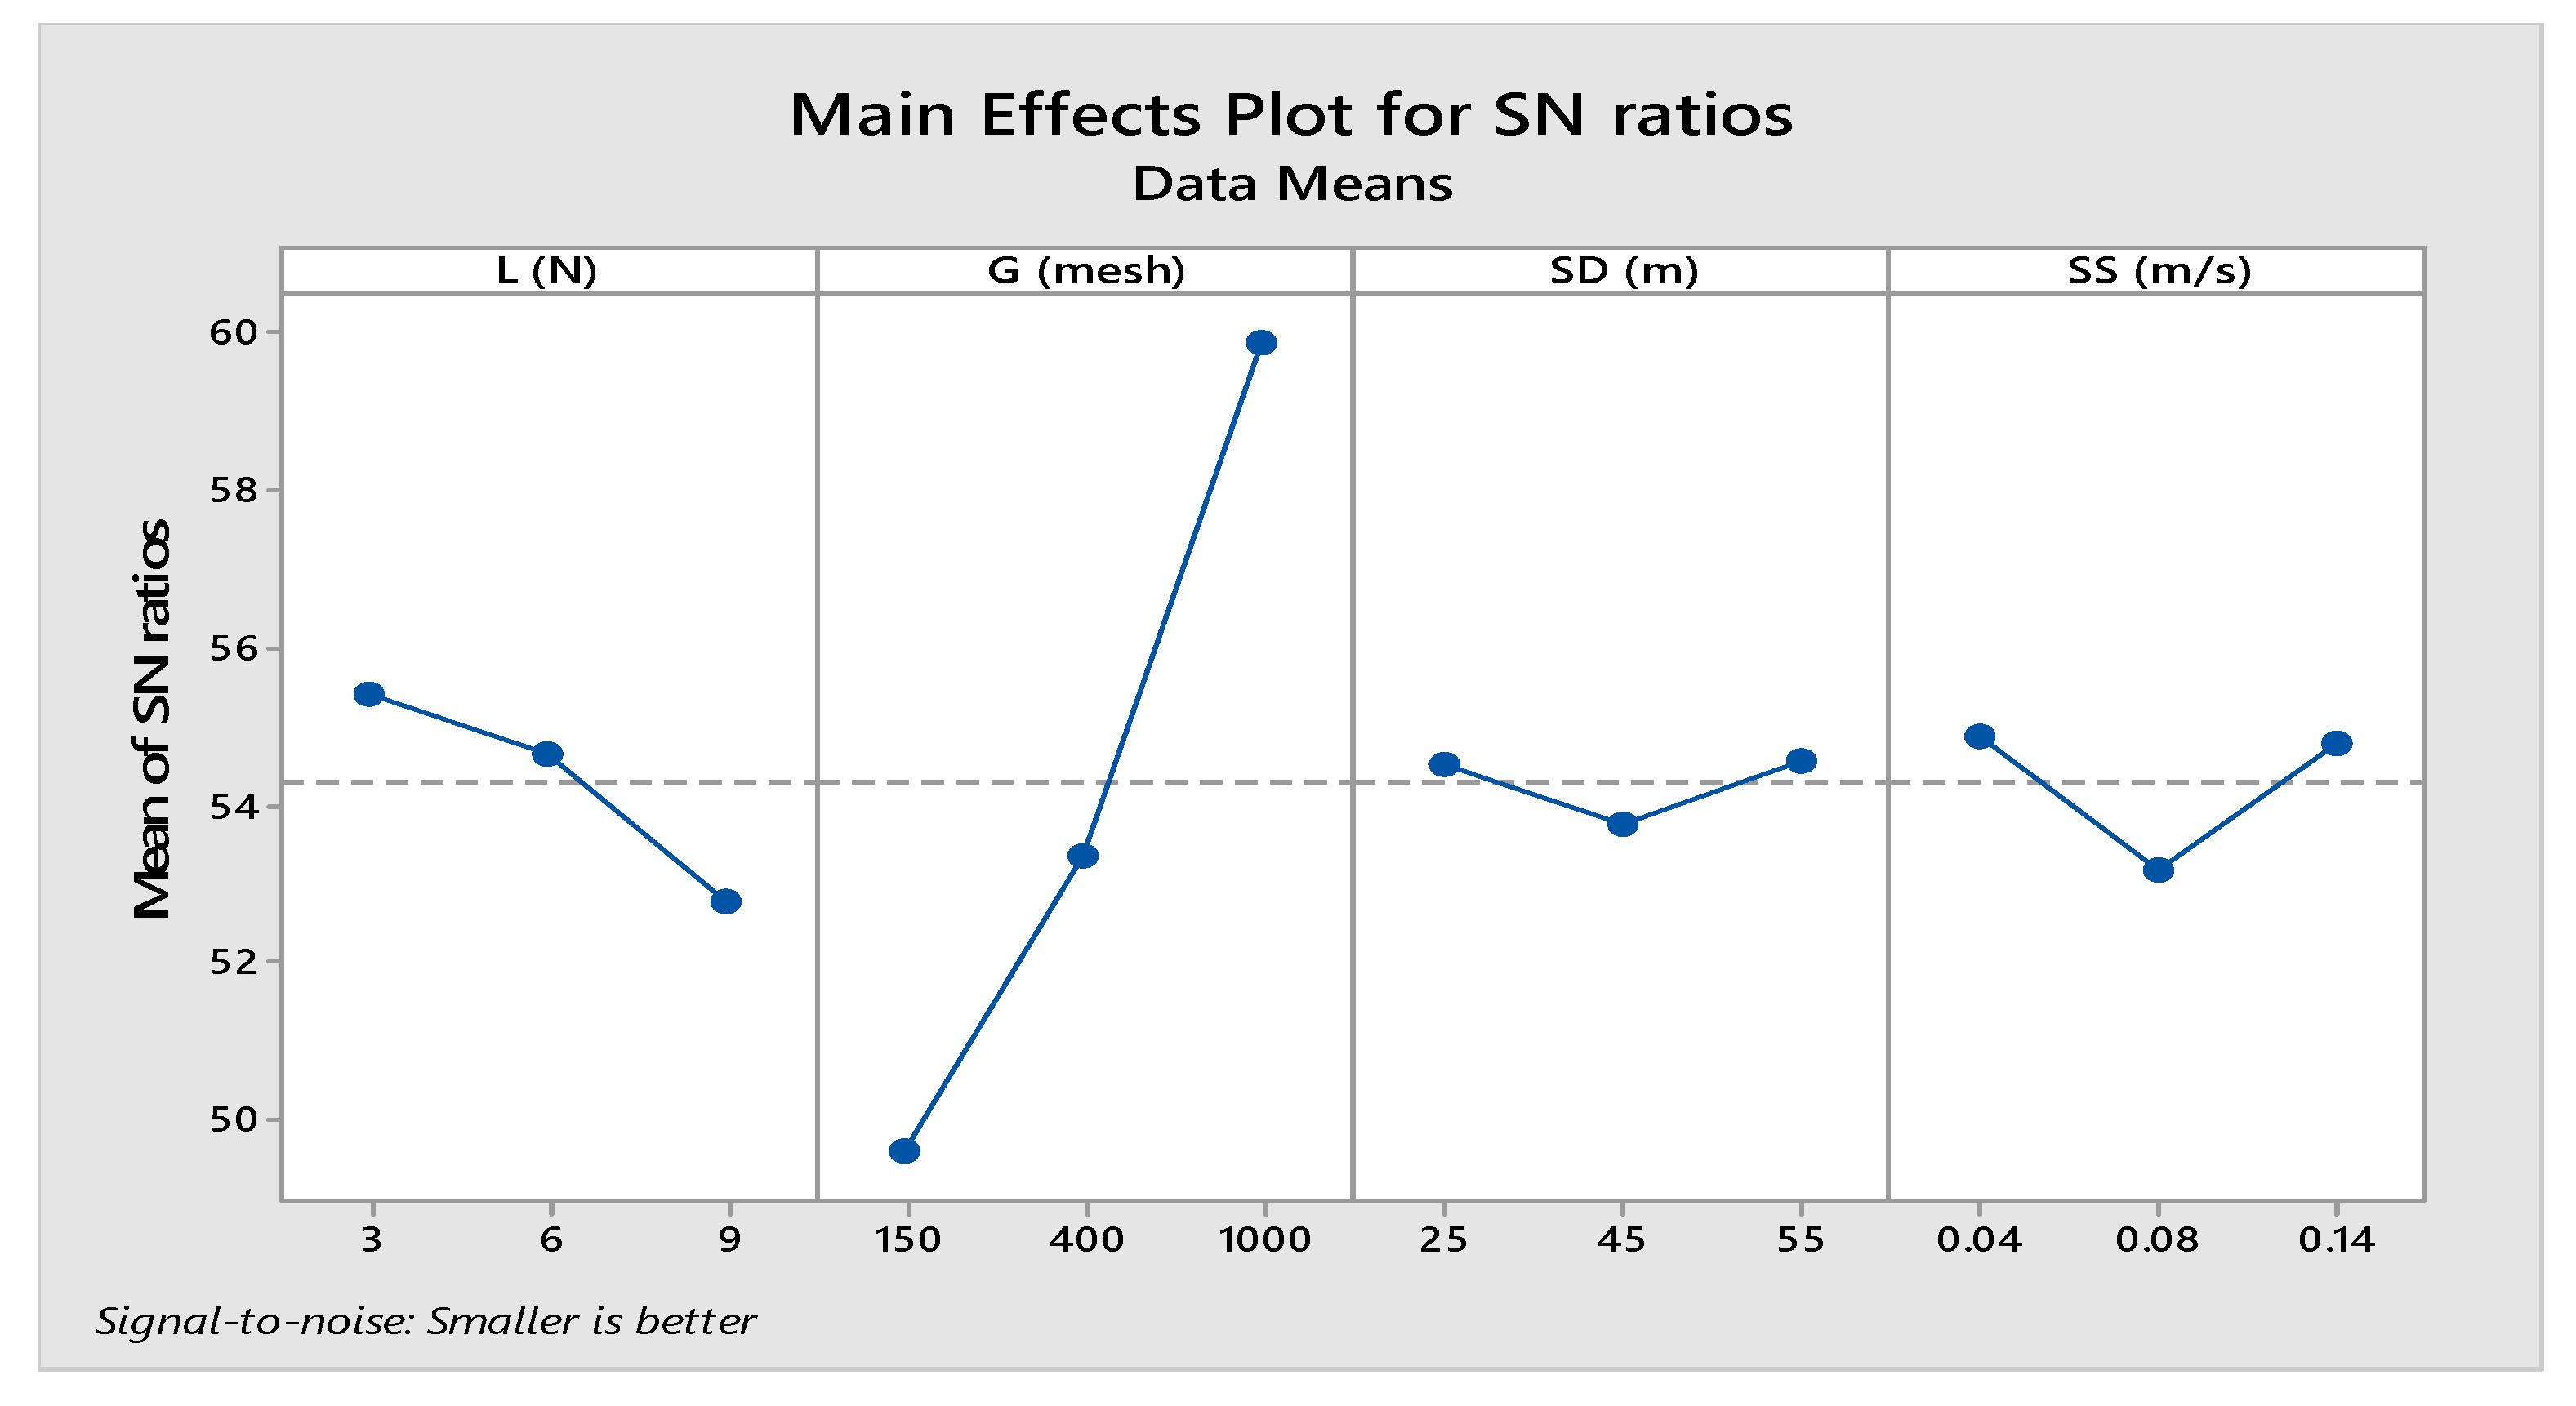
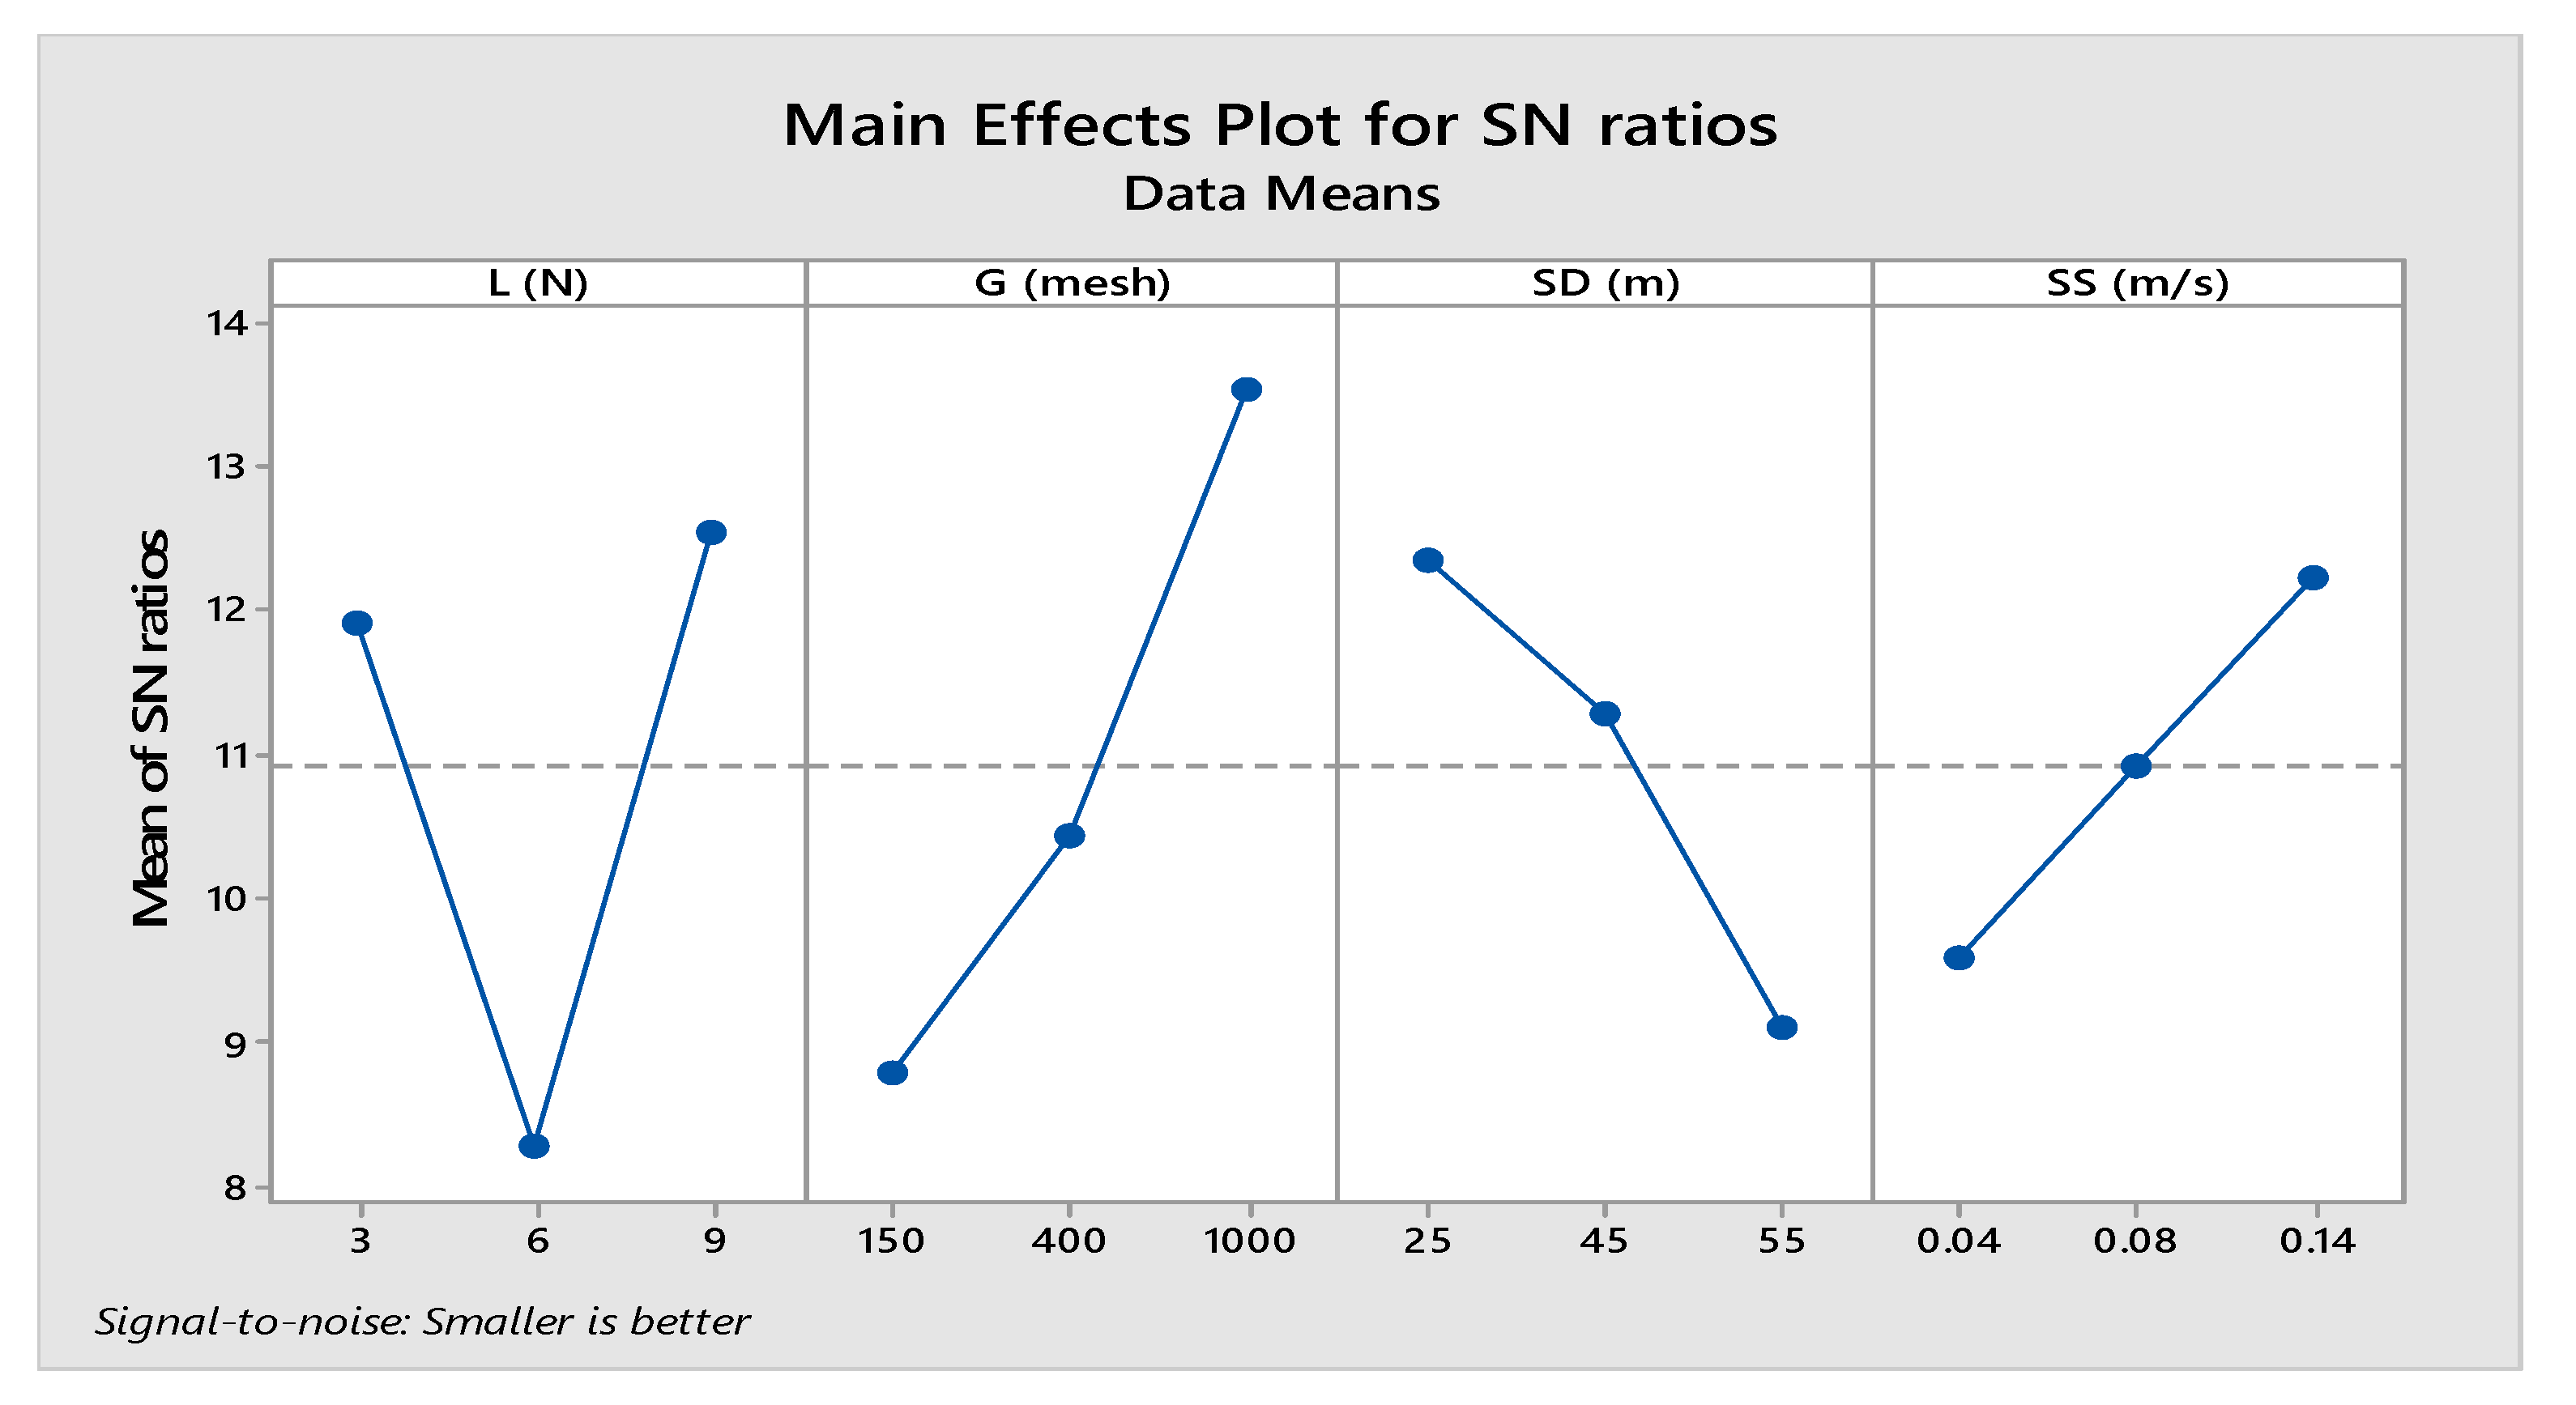
As presented in
Figure 10, T
s decreased with an increase in the load, grit size, sliding distance, and sliding speed. The low T
s at high load (9 N) was because of the significant increase in the apparent contact area at high load, thereby leading to an increase in the contact area, permitting a large number of particles to meet at the interface and share the stress. This, in turn, reduced the abrasive tribological rate. The decrease in the tribological rate due to the increase in the abrasive size is related to clogging of the wear track with wear debris and a reduction in the cutting efficiency of the abrasives due to transfer. T
s reduction due to the increase in the sliding distance is attributed to the pull out or fracture of the abrasives as a result of the presence of tough carbon and bronze fibers. Additionally, wear debris is transferred to the counterface from the PTFE, causing reduced abrasion. Lower T
s due to increasing sliding is because the increase in speed increases the momentum transfer in the perpendicular direction, thus increasing the upward force upon the sample surface due to rotational inertia. Additionally, the travelling time is depreciated due to the increasing sliding speed. This minimizes wear debris generation, causing a reduced wear rate. Besides, at higher sliding speeds, plastic deformation becomes more difficult, causing less extensive damage compared to lower sliding speeds. Moreover, abrasive particle cracking increased at higher speeds, thereby decreasing the cutting efficiency of the abrasives and blunting the sharp edges of the abrasive particles.
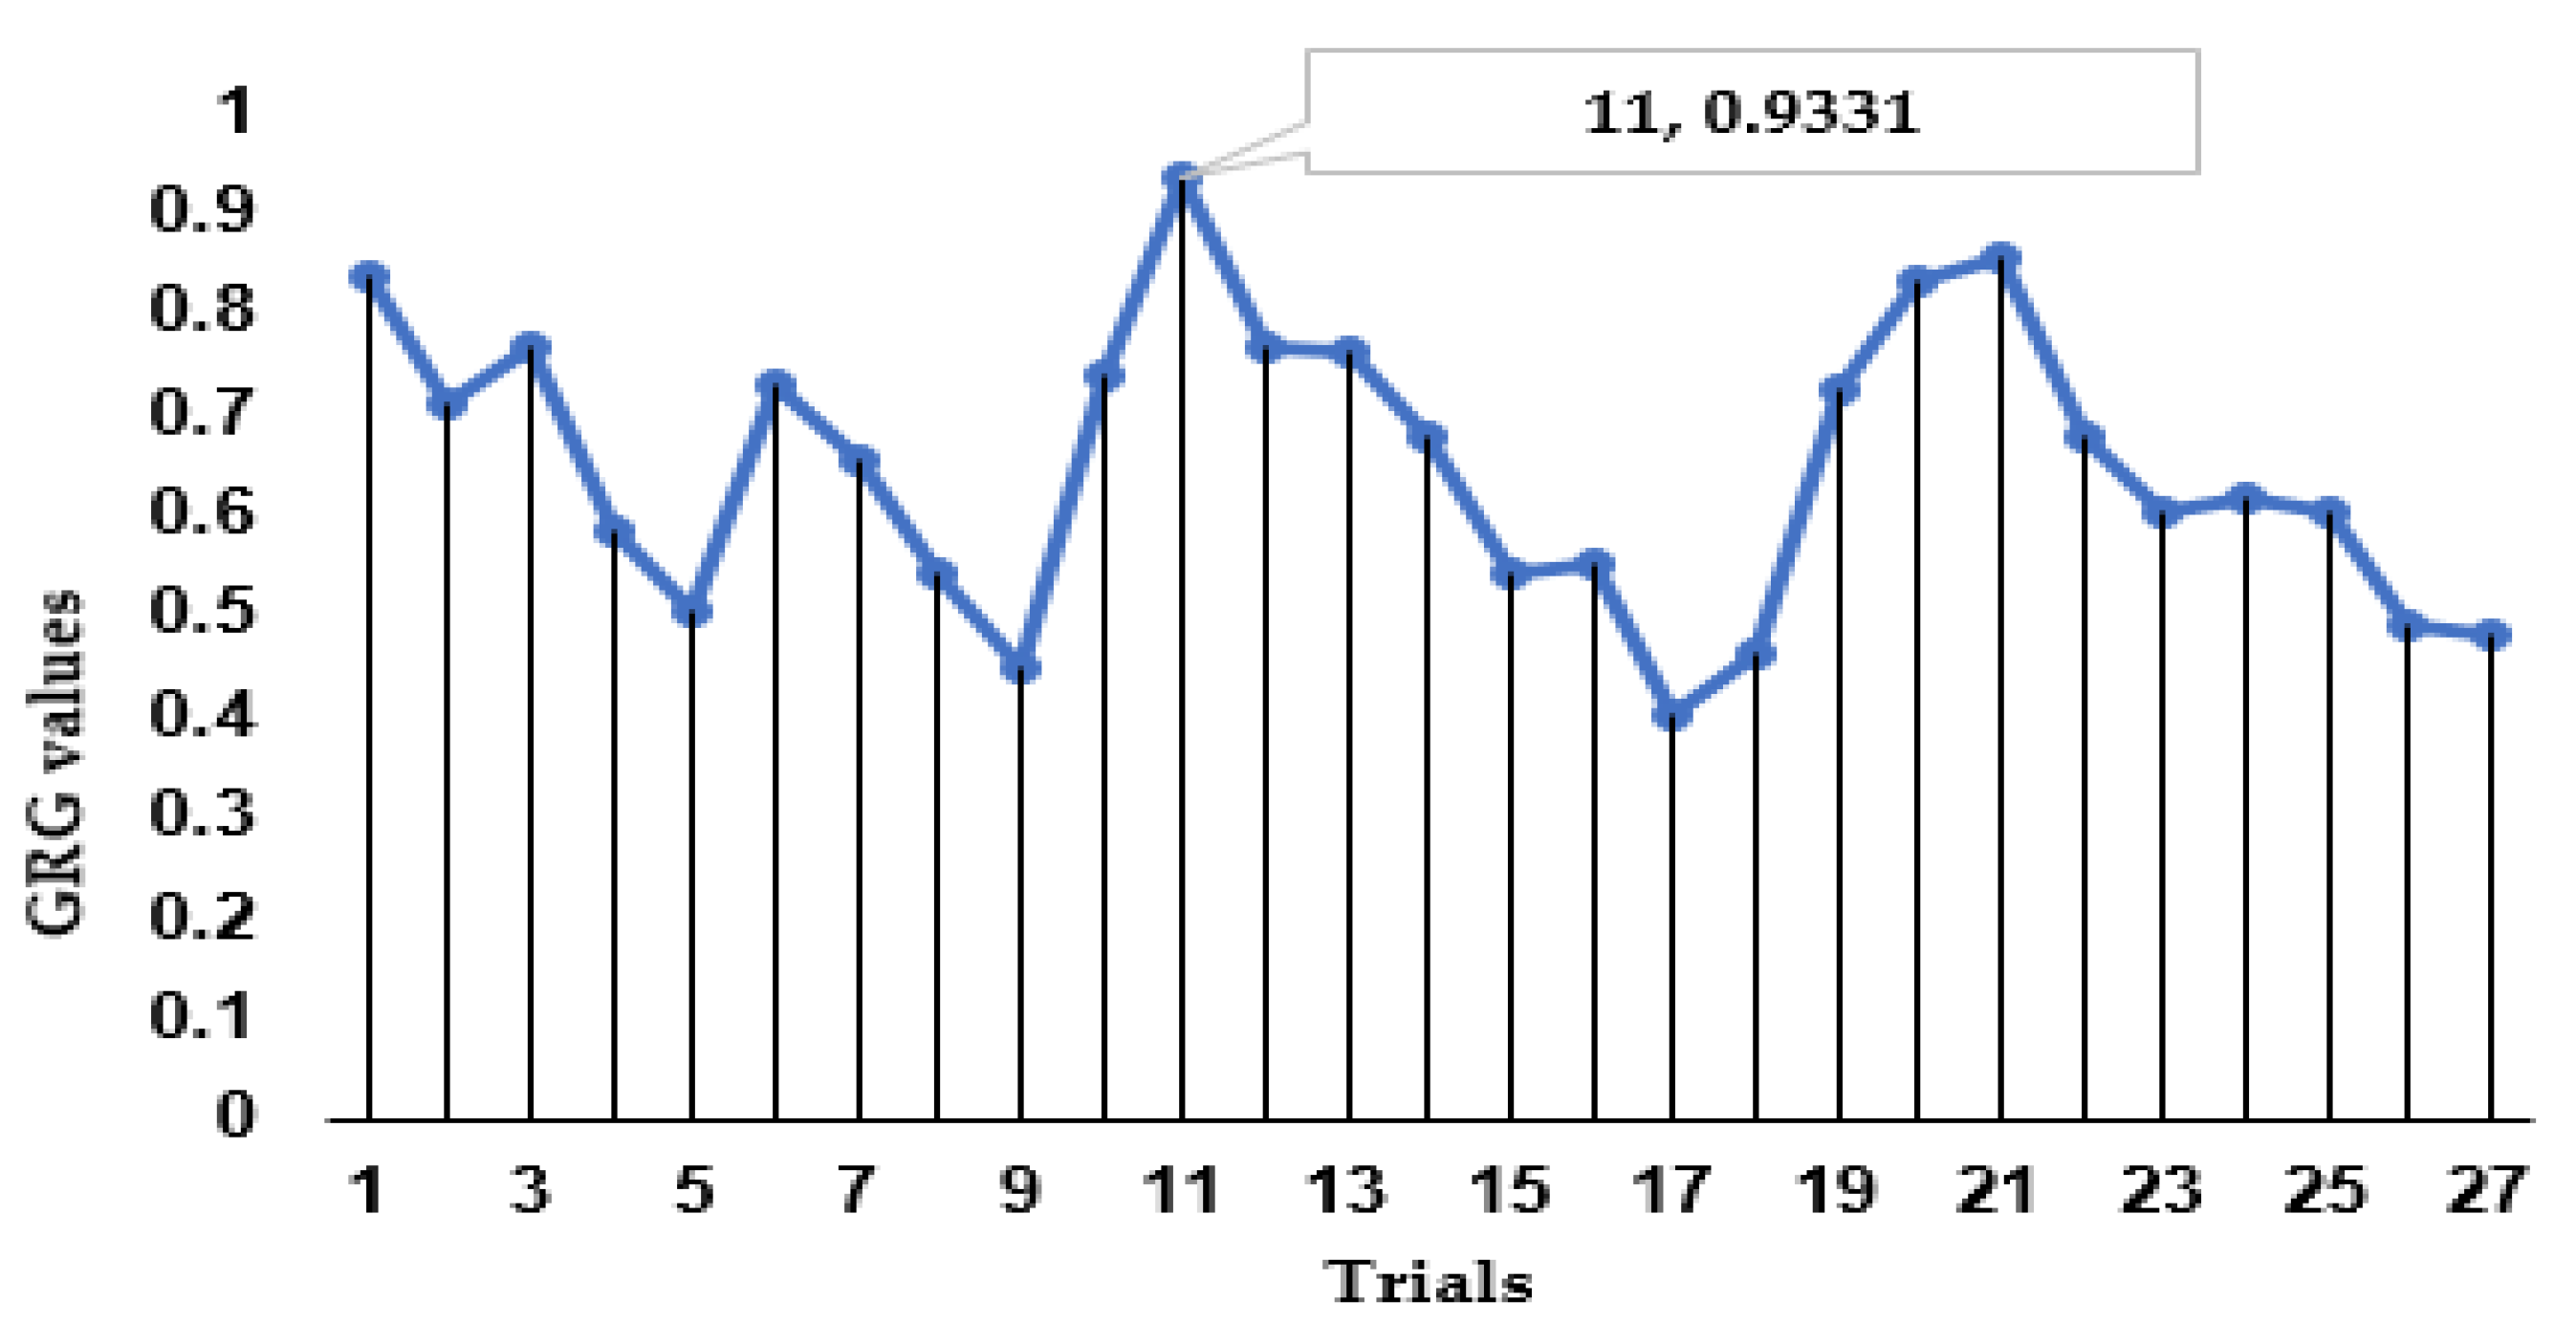
The results of the single and multi-response optimization and ANOVA revealed different behaviors, implying that different tribological mechanisms might have been involved. In both the optimizations and ANOVA, grit size was the most influential parameter. This is attributed to the maximum inclination of the grit size compared to the load, distance, and speed. Similar results were obtained by Sahin [
22]. From the confirmatory test, it was found that there was performance enhancement (52%) in the GRG over the initial design parameters. This improvement is explained by the fact that the GRA has added its sterling optimization features to those of the Taguchi technique, which cannot deal with multiple outcomes simultaneously. This confirms the validity of the Taguchi technique coupled with GRA for studying the abrasive tribological performance of PTFE matrix composites.
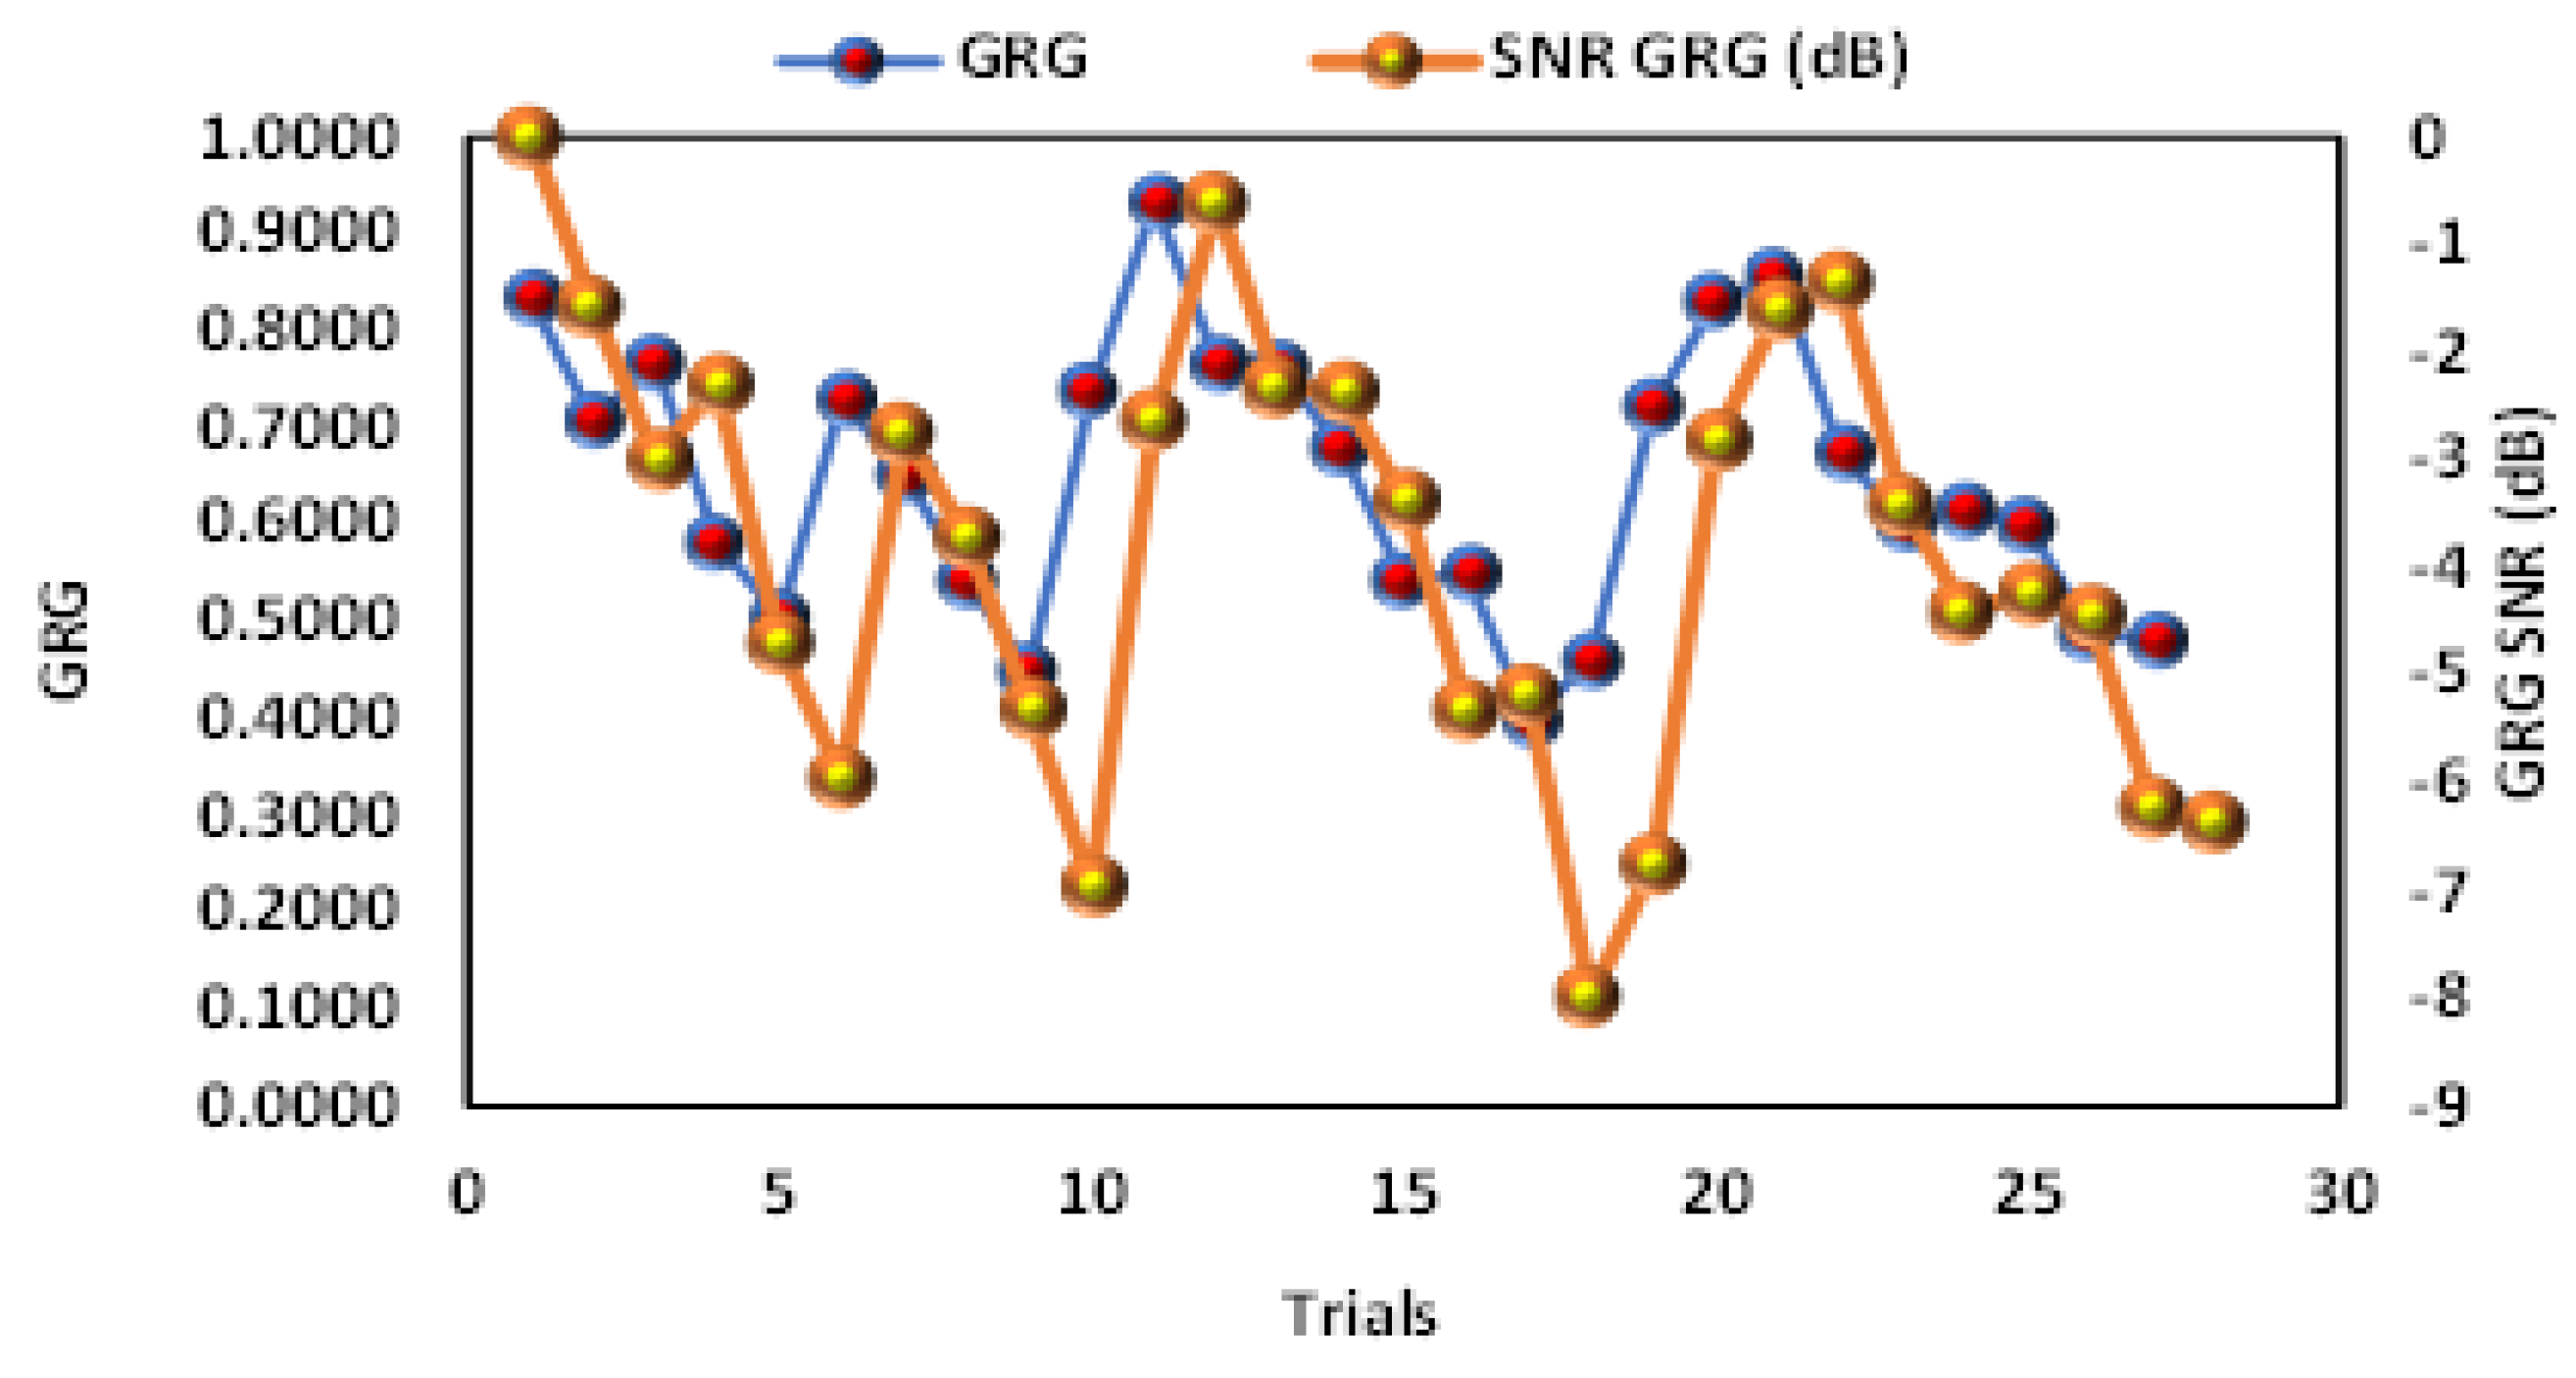
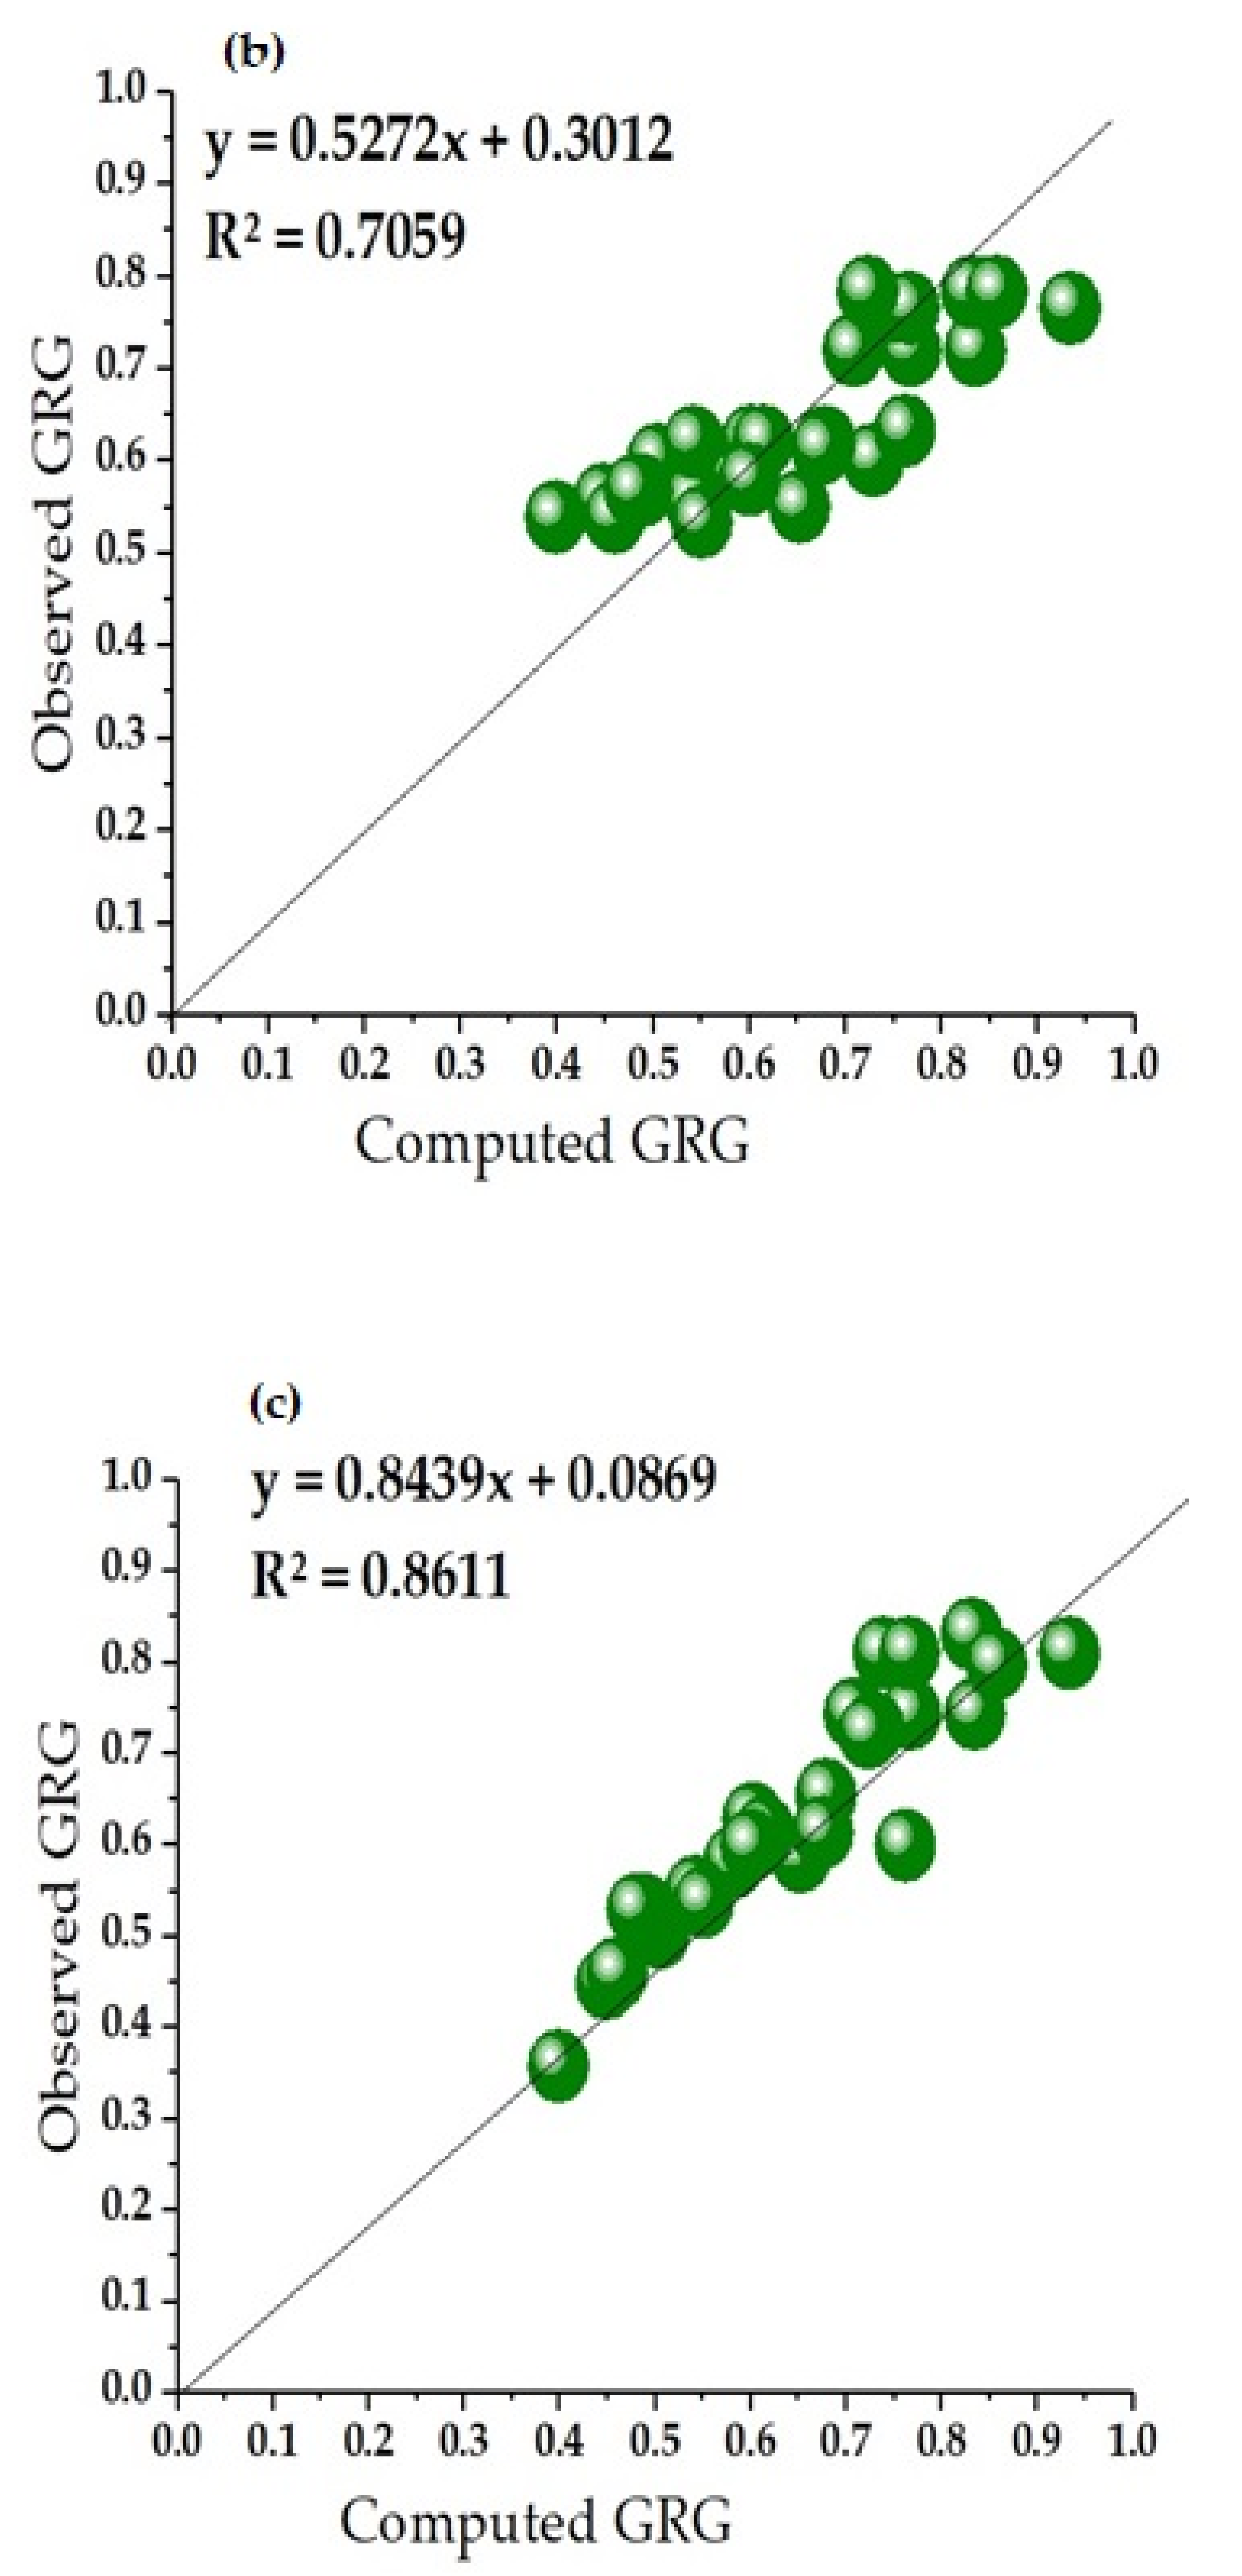
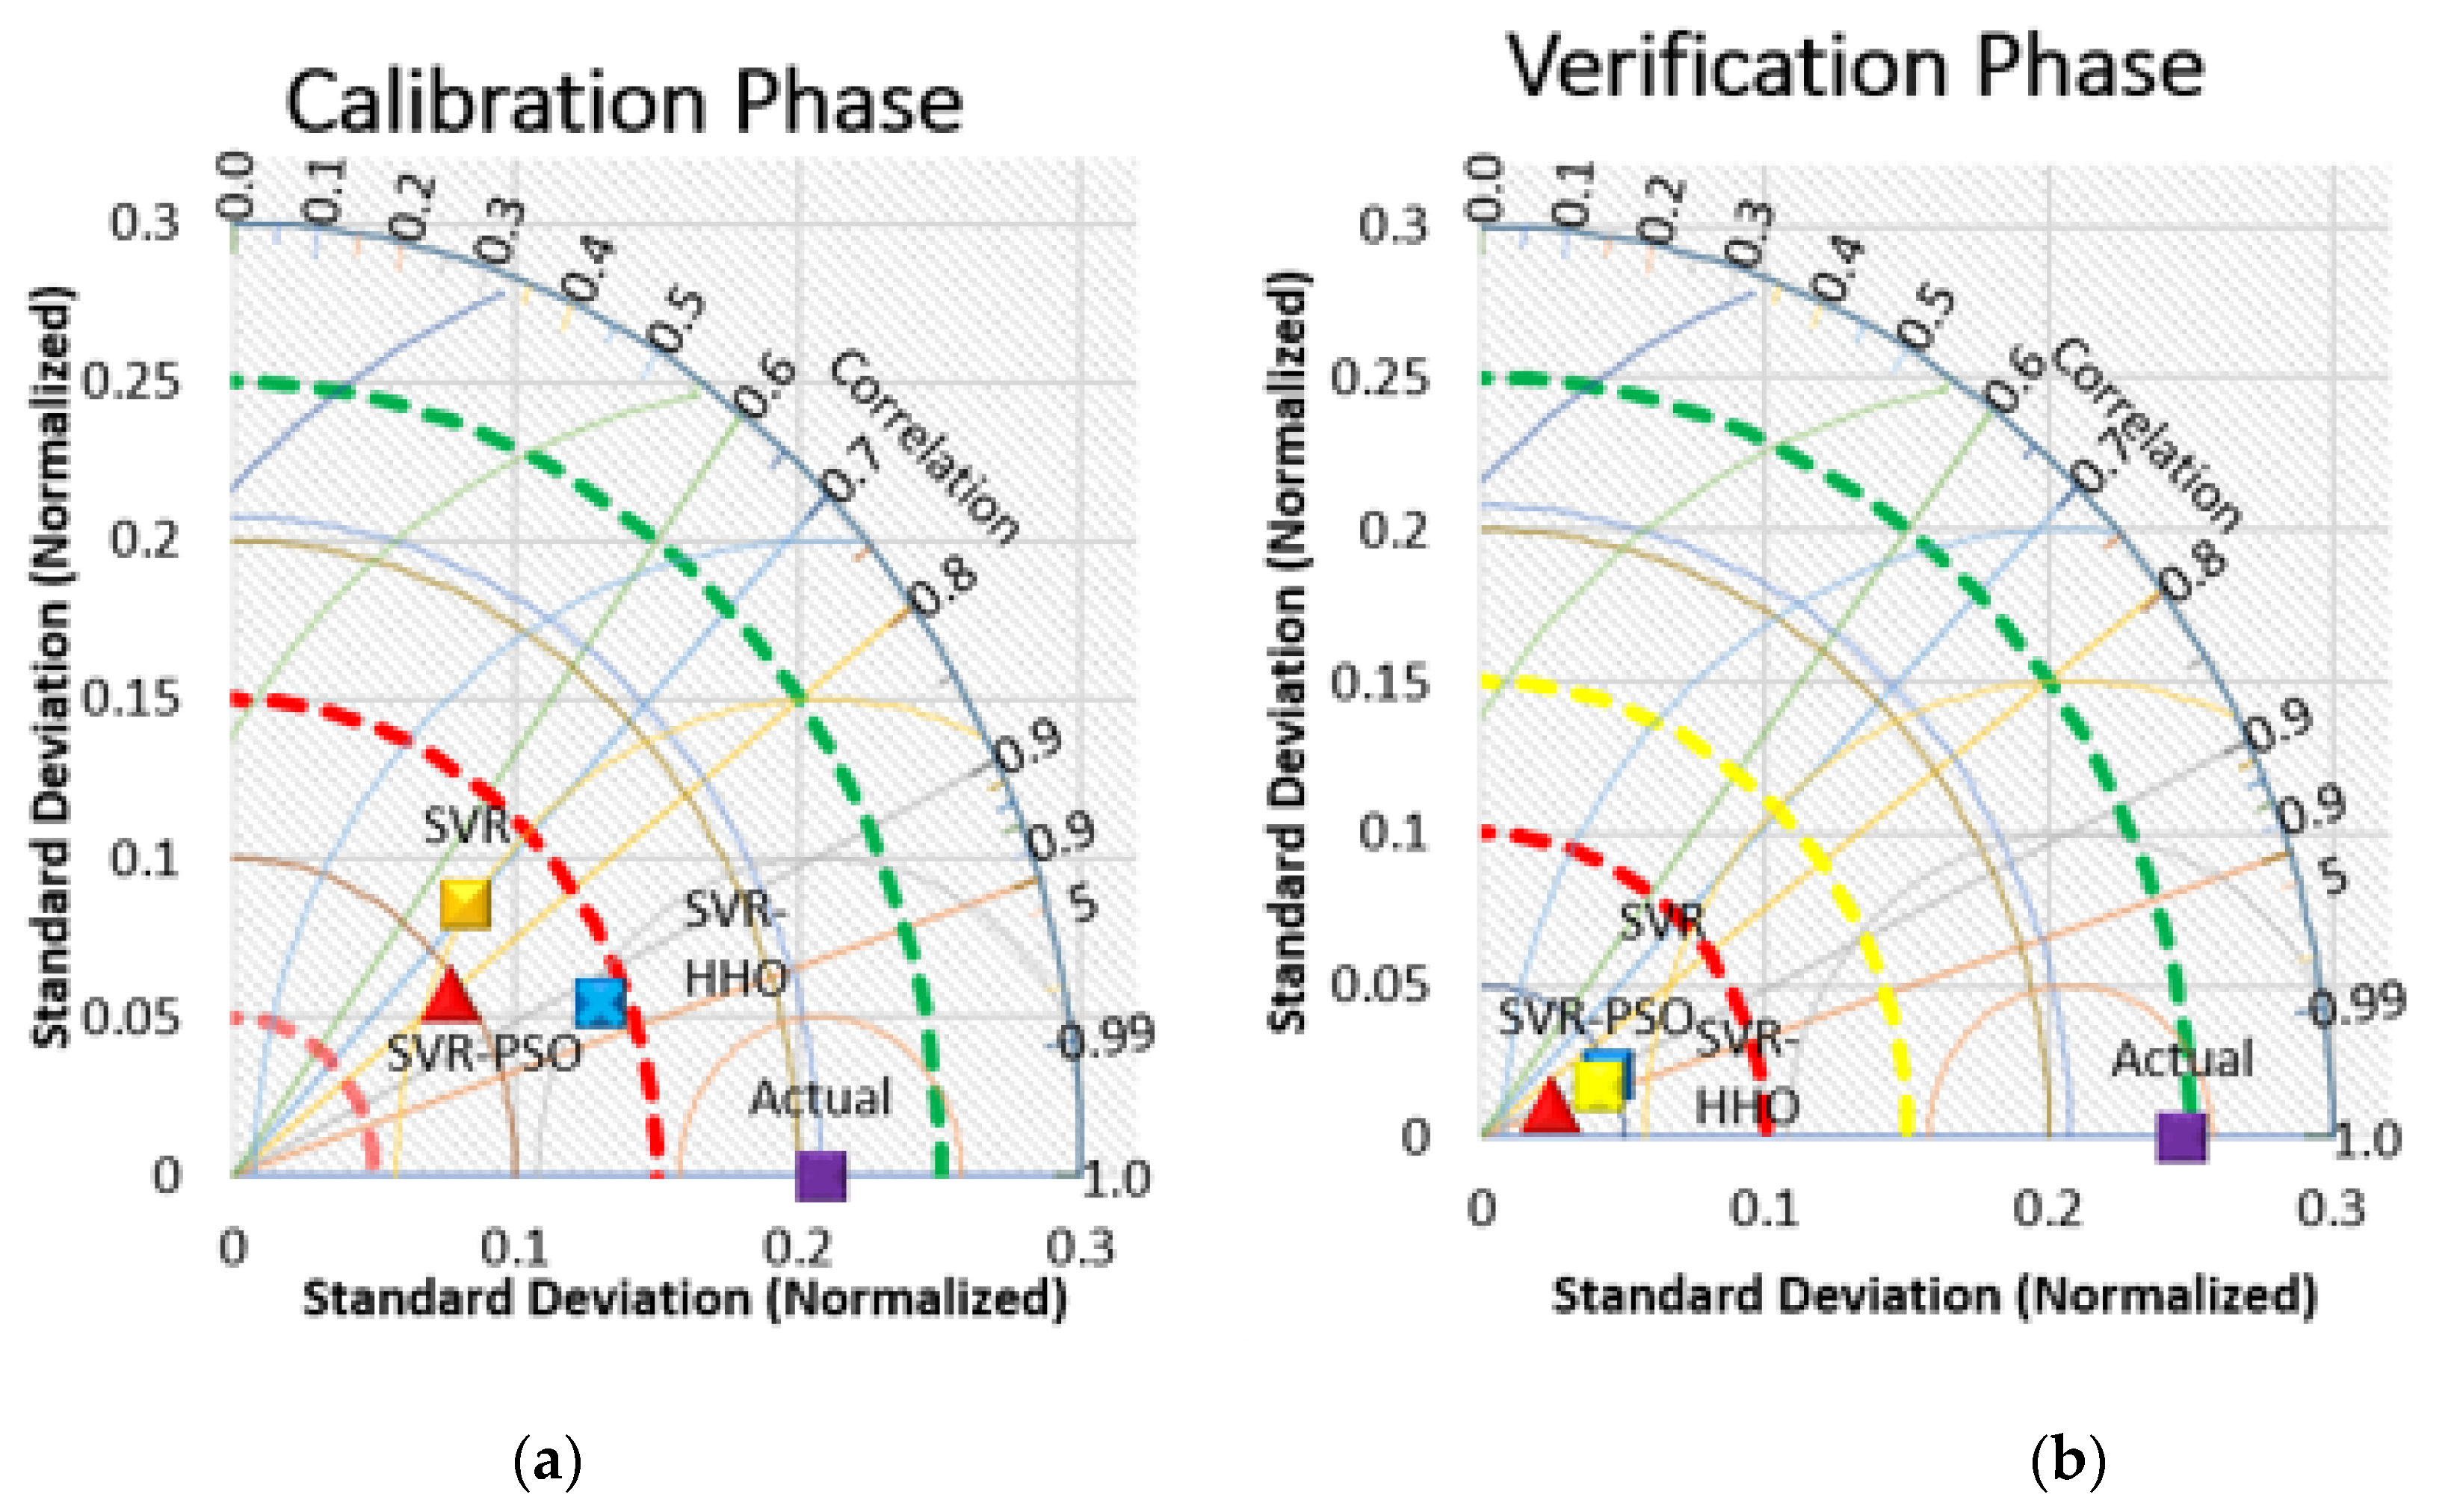
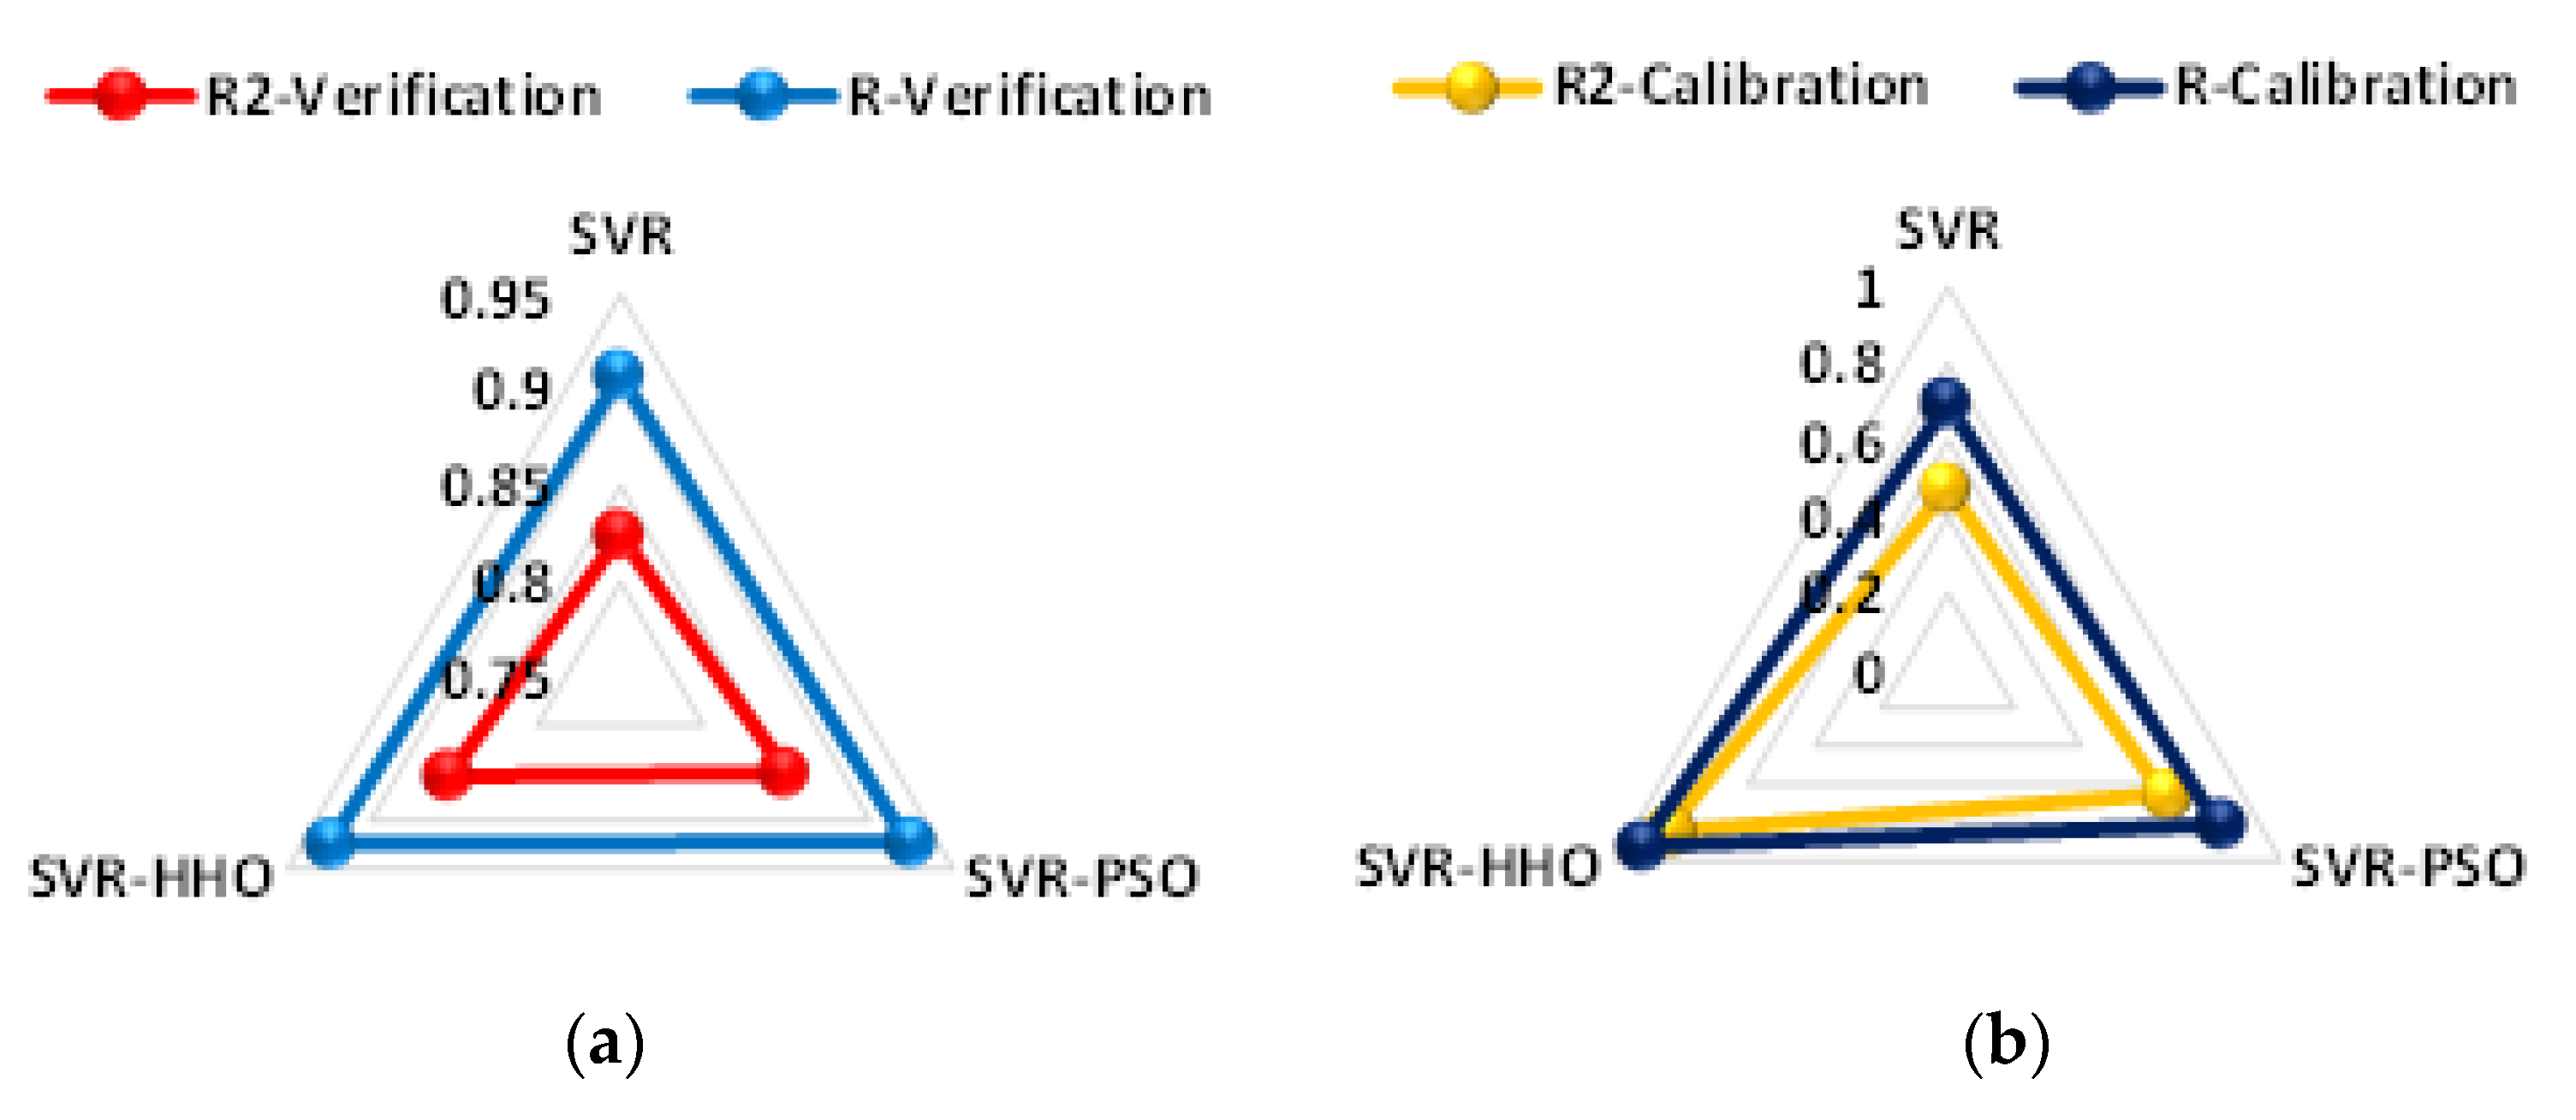
With respect to the prediction ability of the SVR, SVR–PSO, and SVR–HHO models, it was found that the SVR model was not good enough at calibrating and verifying the GRG of the PTFE matrix composites. The reason for the poor performance of the SVR model compared to its hybrids might be due to the highly complex and nonlinear nature of the data. Fundamentally, it should be considered that the promising prediction occurred in the course of the training phase, which is originally used to precisely measure the model based on known inputs and outputs. Nevertheless, the verification stage is significant in appraising the efficacy of the models, since it closely inspects the models’ prediction efficiency based upon unknown magnitudes. This advantage is not enjoyed by the training phase of the SVR model. Consequently, a robust model should possess a determinate and balanced performance in both its training and testing stages. In general, the optimization algorithms showed promising ability when compared with a single model. The exceptional performance of the hybrid models is attributed to their ability to reduce errors and complexities. The slightly higher performance of the SVR–HHO model in comparison to the SVR–PSO model related to its cooperative mechanism and hunting behavior. Furthermore, the R values of the models were determined to be > 80%, supporting the conclusions drawn by [
38,
48,
49] that values > 70% are considered acceptable. Consequently, the outcomes of all of the optimization models are acceptable (
Table 10). The predictive superiority of the HHO model over the others is in concordance with the results obtained by [
50].
In spite of the availability of ample metaheuristic models, there is no particular model that can guarantee consistent optimal performance in addressing various types of issues. Yet, the latest research on unique population-based and nature-inspired optimization paradigm (HHO) models indicated better adequacy in establishing optimal solutions to problems in multi-objective forms. The statistical analysis outcomes and comparisons revealed that the SVR–HHO model yielded promising and often competitive outcomes compared with well-established metaheuristic models.


 ,
, 


