Article

Estimation of Forest Ecosystem Climate Regulation Service Based on Actual Evapotranspiration of New Urban Areas in Guanshanhu District, Guiyang, Guizhou Province, China

1
School of Geography and Environmental Science, Guizhou Normal University, Guiyang 550001, China
2
Guizhou Provincial Key Laboratory of Mountain Resources and Environment Remote Sensing Application, Guiyang 550025, China
3
Ecological Security and Protection Key Laboratory of Sichuan Province, Mianyang Normal University, Mianyang 621000, China
4
School of Earth Sciences and Resources, China University of Geosciences, Beijing 100083, China
*
Author to whom correspondence should be addressed.
These authors contributed equally to this work.
Sustainability 2022, 14(16), 10022; https://doi.org/10.3390/su141610022
Submission received: 4 July 2022 / Revised: 6 August 2022 / Accepted: 8 August 2022 / Published: 12 August 2022
(This article belongs to the Special Issue Managing Forest and Plant Resources for Sustainable Development)

Abstract

:
Suburban forest ecosystems have a great influence on local climate, especially for mitigating urban heat island effects and dry island effects. To quantify the climate regulation value of forest ecosystem, and provide a reference for regional ecosystem accounting and scientific land management, a new estimation method based on actual evapotranspiration (AET) is proposed and applied in this work. Based on remote sensing, meteorological, and soil data in the years 2000, 2010, and 2020, the annual AET of the forest ecosystem and its dynamic changes were calculated in the new urban area, Guanshanhu District, Guiyang, Guizhou Province, SW China. The climate regulation value is derived from differences in the annual AET of forest ecosystems relative to impervious surfaces. The results showed that: (1) the area of forest ecosystem in Guanshanhu District increased from 2000 to 2010 as a result of ecological engineering but decreased from 2010 to 2020 due to the establishment and expansion of the new urban area, while the area of the impervious surface increased rapidly; (2) the differences in annual AET of forest ecosystem relative to the impervious surface were calculated and subdivided according to different forest types. In 2000, 2010, and 2020, coniferous forests contributed the most to the annual AET difference, followed by coniferous and broad-leaved mixed forests, broad-leaved forests, shrubs, and other forests, respectively; (3) the total climate regulation value of forest ecosystem showed an increasing trend, on the whole, the estimation results were ¥8.78 × 10⁸ in 2000, ¥12.62 × 10⁸ in 2010, and ¥14.75 × 10⁸ in 2020; (4) The average per unit area climate regulation value of all types of forests in the area, based on electricity price in the year 2000, was ¥8.06 × 10⁴/ha in 2000, ¥8.11 × 10⁴/ha in 2010, and ¥10.58 × 10⁴/ha in 2020, the highest portion of per unit area climate regulation value was of coniferous forest, as ¥8.59 × 10⁴/ha in 2000, ¥9.28 × 10⁴/ha in 2010, and ¥11.05 × 10⁴/ha in 2020. This study is a beneficial exploration of forest ecosystem climate regulation value estimation in Guanshanhu District, and the results can provide references for ecological construction in new urban areas.

1. Introduction

Ecosystems provide many benefits to human society. The evaluation of ecosystem services and ecosystem assets is widely applied in integrated regional or national accounting both in China and overseas [1,2]. The forest ecosystem is the main body of the terrestrial ecosystem. Forest ecosystems in urban areas provide many significant ecosystem services for local residents, such as offsetting carbon emission [3], removing air pollutants [4], reducing noise, regulating microclimate [5], and recreation and amenity [6]. Estimating forest ecosystem service value is a way to implement regional or national ecosystem accounting, inform scientific land management and promote environmental awareness.
The climate regulation value of forest ecosystems in urban areas has long been overlooked in ecosystem accounting. Although the climate regulation service provided by urban forests has important implications for maintaining a favorable microclimate, critical to citizens’ comfort, health, and energy consumption [7], the related studies are limited. During urbanization, human activities significantly change the Earth’s surface; and local weather patterns are radically disrupted. Urban constructions and transportation are usually agglomerated; such spatial pattern leads to urban heat island and dry island effects [8,9]. The heat emitted from urban industrial processes and heating systems, along with reduced evaporation and transpiration caused by increased impervious surfaces (surfaces through which water cannot infiltrate the soil, including roads, driveways, sidewalks, parking lots, buildings, and so on) [10], contributes to extreme heat events and altered rainfall in large cities, causing discomfort and extra energy consumption for cooling, heating, or moisturizing the living space [11,12]. Forests in an urban area often help to regulate and mitigate such negative outcomes [13]. The influence of forests on local microclimate is complex, including modification of solar radiation, wind speed changes, air temperature, relative humidity, etc. [14,15,16,17,18].
To estimate the value of urban forest climate regulation services, and to inform comprehensive ecosystem accounting and scientific land use management, different methodological approaches have been developed in the past few decades based on empirical studies. Notable differences exist between western and Chinese studies, which reflect the differences in characteristics of the urban forest, market mechanism, and value judgment [19].
Studies in western countries mainly focus on energy savings, which can be caused by urban forest climate regulation effects on annual heating and cooling consumption in low-density residential neighborhoods [20,21,22,23,24,25,26,27,28,29,30,31,32,33]. The emphasis is put on shading, air-temperature regulation, and windspeed reducing effects provided by city trees placed near and in the right direction of buildings. Several forest-related indicators such as leaf area index (LAI, defined as the ratio of leaf surface area to the land area of green cover), tree density, potential evapotranspiration rate, albedo, and land surface emissivity are involved in the estimating process [20,21,22,23,24,25,26,27,28,29,30,31,32,33,34].
Meanwhile, the methodology of estimating the climate regulation service of the forest ecosystem in Chinese studies usually focuses on the evapotranspiration effect at the city level [35]. This results from the attributes of forests in the study area. The tree-shading effect in high-density residential areas of Chinese cities is nearly negligible because the multistory and tightly packed buildings can easily overwhelm tree-shading or related cooling effects. Besides, trees placed in the concrete canyon of buildings lead to a decrease in urban roughness, which inhibits turbulent energy exchange and increases air temperature during daytime [36,37]. Moreover, in Chinese cities, major forest ecosystems are typically distributed in the peripheral or suburban areas, with small patches of greenspace scattered in the urban core. Therefore, the capability of the microclimate regulation function provided by these forest ecosystems depends mainly on evapotranspiration [38,39,40].
Evapotranspiration (ET) is the combination of evaporation from soil and plant surface and transpiration during photosynthesis, in which liquid water transfers into vapor [41,42,43]. Evapotranspiration is the vital link between exchanges of water, carbon, and surface energy. It has a strong impact on regulating local and global climate [44,45,46]. During evapotranspiration, ambient air temperature cools down due to latent heat transfer from the surface to the atmosphere [47,48]. For example, in the optimal condition, one fully-grown tree can transpire 450 L of water per day, absorbing 1000 megajoules (MJ) of heat during the process [49]. Evapotranspiration can also promote low-level cloud cover, which changes regional albedo and affects the amount of energy reaching the surface [50]. Apart from energy regulation, evapotranspiration also redistributes water and increases atmospheric moisture, directly affecting regional rainfall and water availability [51].
In former Chinese studies estimating forest climate regulation value, evapotranspiration from an urban forest is calculated according to the evapotranspiration rate and leaf area index of major tree species in the city [19,35]. Then the latent heat absorbed by urban forests during the process is estimated based on Yang’s (1996) equations [52]. The value of climate regulation service is calculated as cooling energy savings during the summer season.
Leng et al. (2004) estimated that the climate regulation value of urban forests in Beijing (Northeast China) was ¥934,579.2/day and ¥93.5 × 10⁶/year; the calculation was based on the assumption that electrical power had to be consumed to achieve the same cooling effect on 100 summer days each year [53]. In the study by Chen (2006), the climate regulation value of urban forests in Guangzhou (Southeast China) was estimated as total cooling energy savings of the summer season; the result was ¥573.5 × 10⁶ in 2000, or an average of ¥7792/ha [19]. Chen et al. (2006) estimated that the vegetation cover in the Wuhan Iron and Steel Company, which was located in Wuhan (Central China), absorbs around 1.8 × 10¹² kJ/year of heat energy through evapotranspiration during the summer season; the monetary value derived from the estimation was ¥163.3 × 10⁶/year [54]. Zhang et al. (2006) estimated the climate regulation value of 2789 ha of urban forests in Lanzhou (Northwest China) as summer cooling energy savings at ¥6.83 × 10⁶/year [55].
However, one major problem in the methodological approaches mentioned above is that the measurement of total heat transferred during evapotranspiration based on evapotranspiration rate and leaf area index of major tree species may not be in line with reality. This is because the scale of evapotranspiration of urban forests is affected by multiple factors, such as temperature, precipitation, undergrowth vegetation, solar radiation, regional water availability, etc. [56].
In this study, we propose a modified methodology based on actual evapotranspiration (AET) to estimate the climate regulation value of forest ecosystems. AET is the actual amount of water transferred during the evapotranspiration process; it is calculated using the Modified-Hargreaves method [57,58] and Budyko curve [59,60] based on remote sensing data, meteorological data, and soil data. The calculation process involves multiple factors such as precipitation, extraterrestrial radiation, daily maximum and minimum temperature, available plant water content, etc. Therefore, AET can better reflect the actual capacity of water and energy regulation of the forest ecosystem, which enables its cooling and moisturizing effect. Because the daily temperature variation (which is influenced by albedo and land surface emissivity) is included in the calculation process, AET is also indicative of albedo and land surface emissivity change in different land use types [61].
This approach is carried out in a new urban area, Guanshanhu District of Guiyang City, Guizhou Province, Southwest China, to estimate and depict changes in the climate regulation value of forest ecosystems due to land use changes in the area from 2000 to 2020. Since its establishment in 2012, the human construction area in Guanshanhu District has been expanding rapidly, converting natural ecosystem land and affecting microclimate patterns. We selected three key epochs: 2000, 2010, and 2020. The dynamic changes in the spatial pattern of ecosystems in the Guanshanhu District were interpreted via eCognition software and object-oriented image classification technology based on multi-source remote sensing data. Instead of calculating cooling energy savings in the summer season, the monetary value of forest climate regulation service is derived from the differences in annual accumulated AET of forest ecosystem relative to impervious surface. We calculated the accumulated AET of twelve months to represent the biophysical regulation effects (like cooling, moisturizing, and changing albedo) of the whole year, which continuously contributes to human comfort, moisture convection, local weather pattern, and crop productivity in all four seasons. We based the valuation on the differences in annual AET of forest ecosystem relative to impervious surfaces, so the results represent the extra regulation effects that forest ecosystem provides for human society, and more importantly, the results can be reflective of land use change which is quite influential to the local climate. The empirical results of applying the new estimation method to the new urban area of the Guanshanhu District can deepen our understanding of the effects of land use change, stress the importance of the urban forest in urban ecological security, provide a reference for ecosystem accounting, and inform ecological sustainable development planning of new urban areas.

2. Materials and Methods
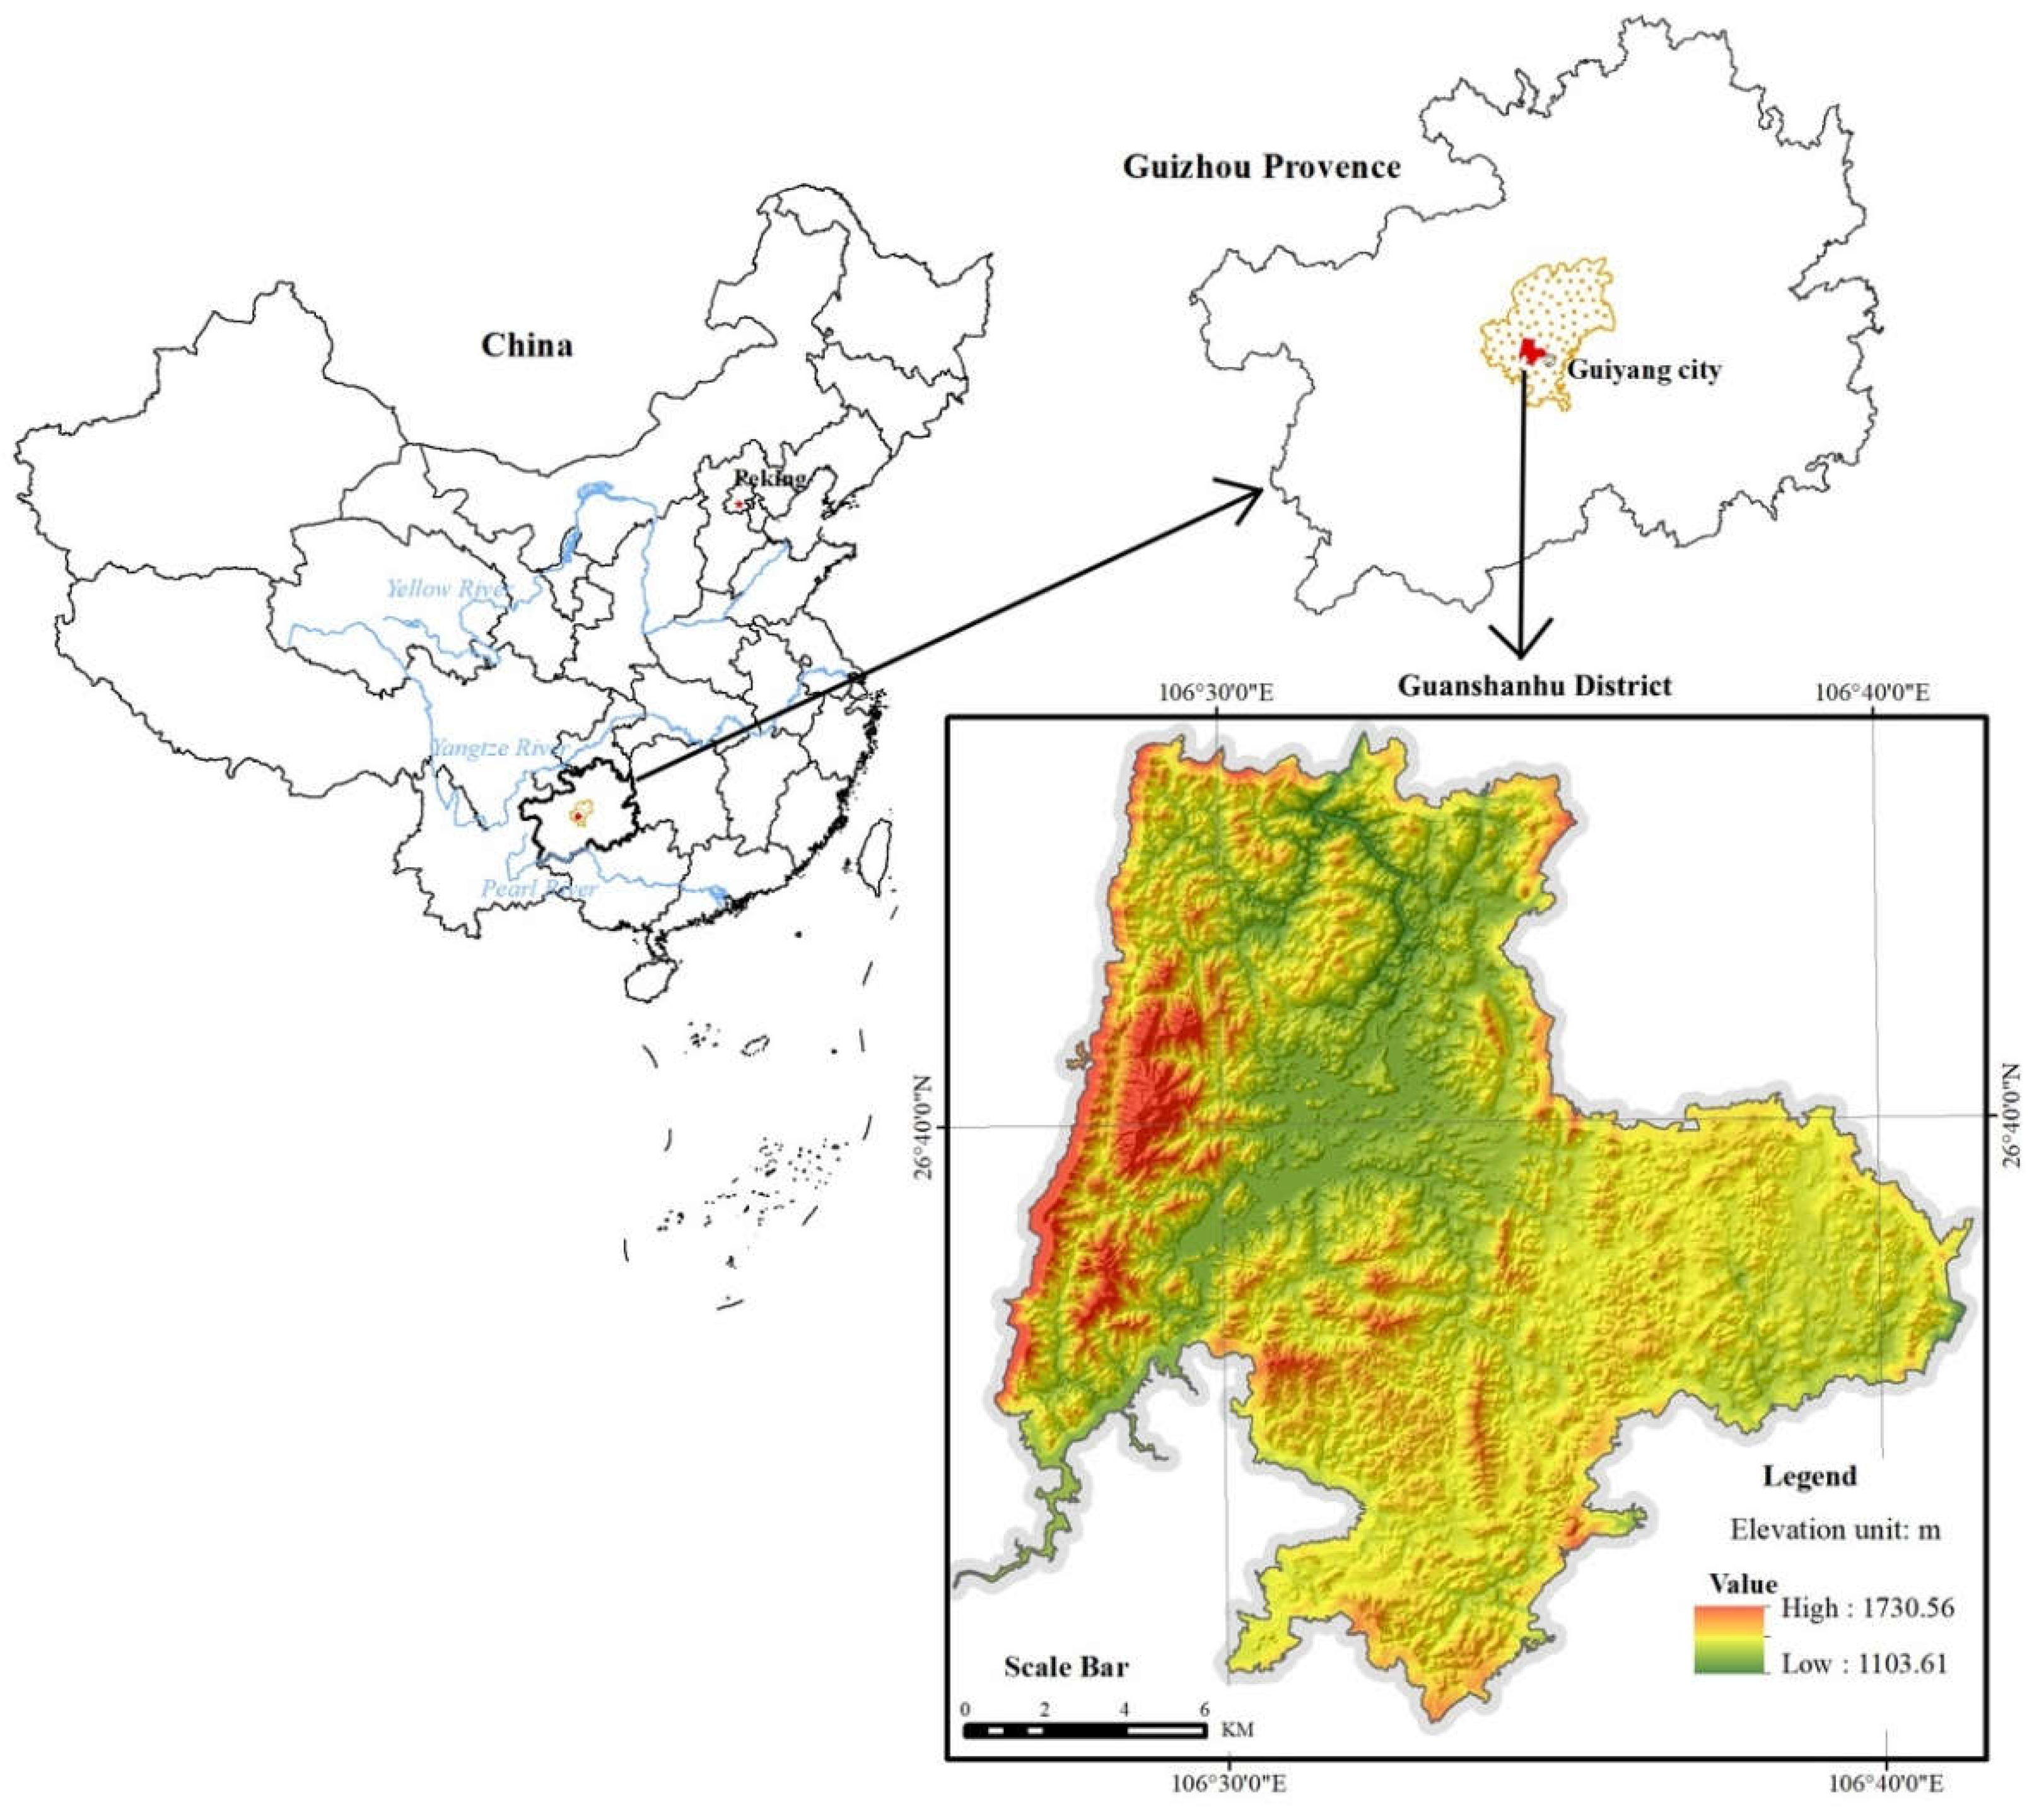
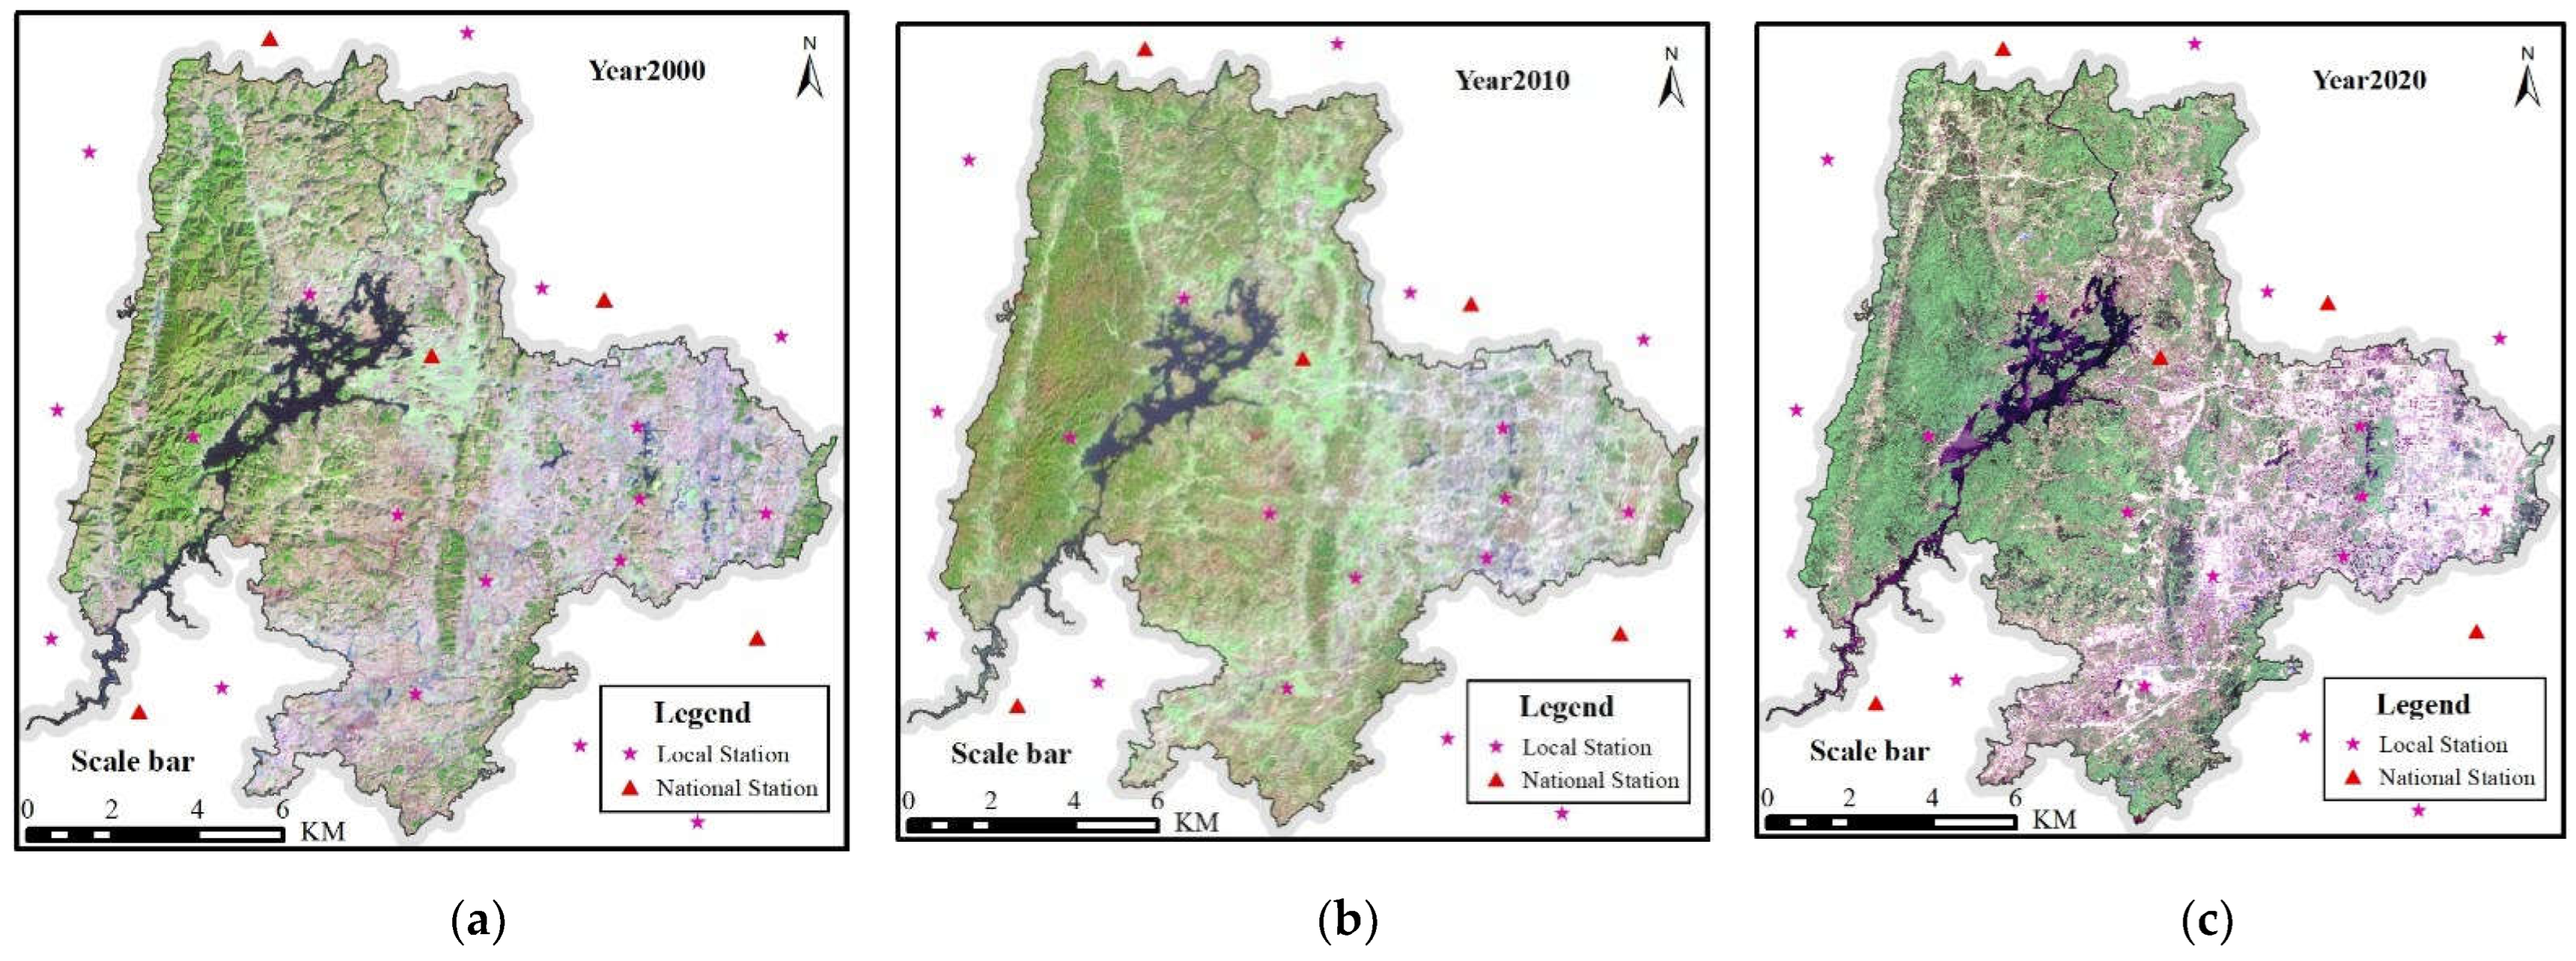
2.1. Study Area

Guanshanhu District is located in the central karst zone of Qianzhong Mountain, northwest of Guiyang City, Guizhou Province, China. The total area of the district is nearly 30,700 ha, with a permanent population of 0.65 million by 2020 [62]. The District was newly established in 2012, before which the area was rural and sparsely populated. The area is part of the Maotiao River and the Nanming River watershed in the upper reaches of the Yangtze River [63]. The area is in the subtropical monsoon zone with a warm temperate climate, the annual average air temperature is 15.1 °C, and annual precipitation ranges from 1200 to 1400 mm [62]. The area’s karst background resulted in a variety of landforms. Hills, basins, valleys, and depressions are interlaced, revealing a spatial distribution pattern of half the landscape and half the city (Figure 1). In this area, there are a diverse range of ecosystems. The forest, farmland, and freshwater ecosystems in the west occupy nearly half of the total area in the District, providing crucial ecological services, such as climate regulation, air purification, soil and water conservation, biodiversity habitats, and cultural, historical, or recreational benefits. These environmental services are important not only to the residents in the district but also to the entire city of Guiyang [64].

2.2. Materials and Method

The remote sensing data of Guanshanhu District was obtained from the national geographic information monitoring cloud platform (http://www.dsac.cn/DataProduct/Index/1002, accessed on 10 September 2021), including Landsat TM (30 m), ETM+ (30 m), Gaofen2 (4 m) and other multivariate moderate or high-resolution remote sensing images. The images were taken in the growing season. The meteorological data were obtained from the National Meteorological Information Center of China (http://data.cma.cn/, accessed on 22 April 2021). The meteorological data include extraterrestrial radiation ( R A ), daily precipitation (P), the daily maximum temperature ( T D max ), and daily minimum temperature ( T D min ). The meteorological data were collected from multiple national and local meteorological stations. The locations of meteorological stations in or surrounding the Guanshanhu District are shown in Figure 2. The percentage contents of sand, silt, clay, and organic carbon in soil were obtained from the China Soil Database (http://vdb3.soil.csdb.cn/, accessed on 26 June 2021).

2.3. Methodological Approach

  • Actual evapotranspiration ( A E T ) calculation method. A E T cannot be obtained directly. Here we apply the Budyko curve to calculate it [59,60].
A E T P = 1 + ω R 1 + ω R + 1 R
A E T : actual evapotranspiration; P : precipitation in mm per month; ω : the ratio of plant accessible water storage and the expected precipitation; R : Budyko dryness index of an ecosystem, as the ratio of potential evapotranspiration ( E T 0 ) to precipitation.
The calculation formula of R is:
R = ( K × E T 0 ) / P
E T 0 : Potential annual evapotranspiration in mm; K : crop or plant coefficient. The value of K is obtained from InVEST 3.2.0 User’s Guide; the number ranges between 0 to 1.5, according to different land cover types [65,66]; P : precipitation in mm per month.
Potential evapotranspiration ( E T 0 ) was calculated using a Modified-Hargreaves method [57,58]:
E T 0 = 0.0013 × 0.408 × R A × ( T a v g + 17.0 ) × ( T D 0.0123 P ) 0.76
R A : extraterrestrial radiation (MJ m−2 d−1): T a v g : average daily temperature (°C) defined as the average of the mean daily maximum temperature ( T D max ) and mean daily minimum temperature ( T D min ); T D (°C): the temperature range, computed as the difference between mean daily maximum and mean daily minimum temperature: P : precipitation in mm per month.
The calculation formula of ω in Formula (1) is:
ω = Z × ( A W C / P )
A W C : plant available water content (%); Z : Zhang coefficient, which reflects the rainfall characteristics in the region, in this paper we use a value of 3.172 [67]; A W C is calculated by a nonlinear estimation model [37]:
A W C ( % ) = 54.509 0.132 × ( S A N % ) 2 0.055 × S I L % 0.006 × ( S I L % ) 2 0.738 × C L A % + 0.007 × ( C L A % ) 2 2.688 × C % + 0.501 × ( C % ) 2
A W C ( % ) : plant available water content (%); S A N % , S I L % , C L A % , C % are the percentage of sand, silt, clay, and organic carbon respectively.
The calculation formula of actual annual evapotranspiration (AETa) is:
A E T a = i = 1 n A E T m
AETa: annual actual evapotraspiration; AETm: monthly actual evapotraspiration calculated by Formula (1); n = 12.
b.
Calculation of climate regulation service. The climate regulation value of the forest ecosystem is estimated based on actual annual evapotranspiration in the year.
Firstly, differences in annulling the AET of a forest ecosystem relative to the impervious surface is calculated as:
E D = A E T a   f o r e s t A E T a   i m p e r v i o u s   s u r f a c e  
ED: evapotranspiration difference (mm); AETa forest: annual AET of forest ecosystem; AETa impervious surface: annual AET of impervious surface.
Evaporation of 1 g of water can take away heat of 2.44 KJ [68]. And 1 kwh = 1000 watts × 60 min ×60 s = 3,600,000 J. Therefore, the calculation formula is as follows:
E Q = 1,000,000 × A × E D × 2.44 ÷ 3,600,000
E Q : electricity quantity regulated by forest ecosystem (kwh); A : area of the forest ecosystem (m2); E D : difference in evapotranspiration (mm).
The market value method is applied to estimate the value of the forest ecosystem climate regulation service. The formula is:
V c r = E Q × P e
V c r : ecosystem climate regulation value (¥); P e : electricity price (¥/kWh).
c.
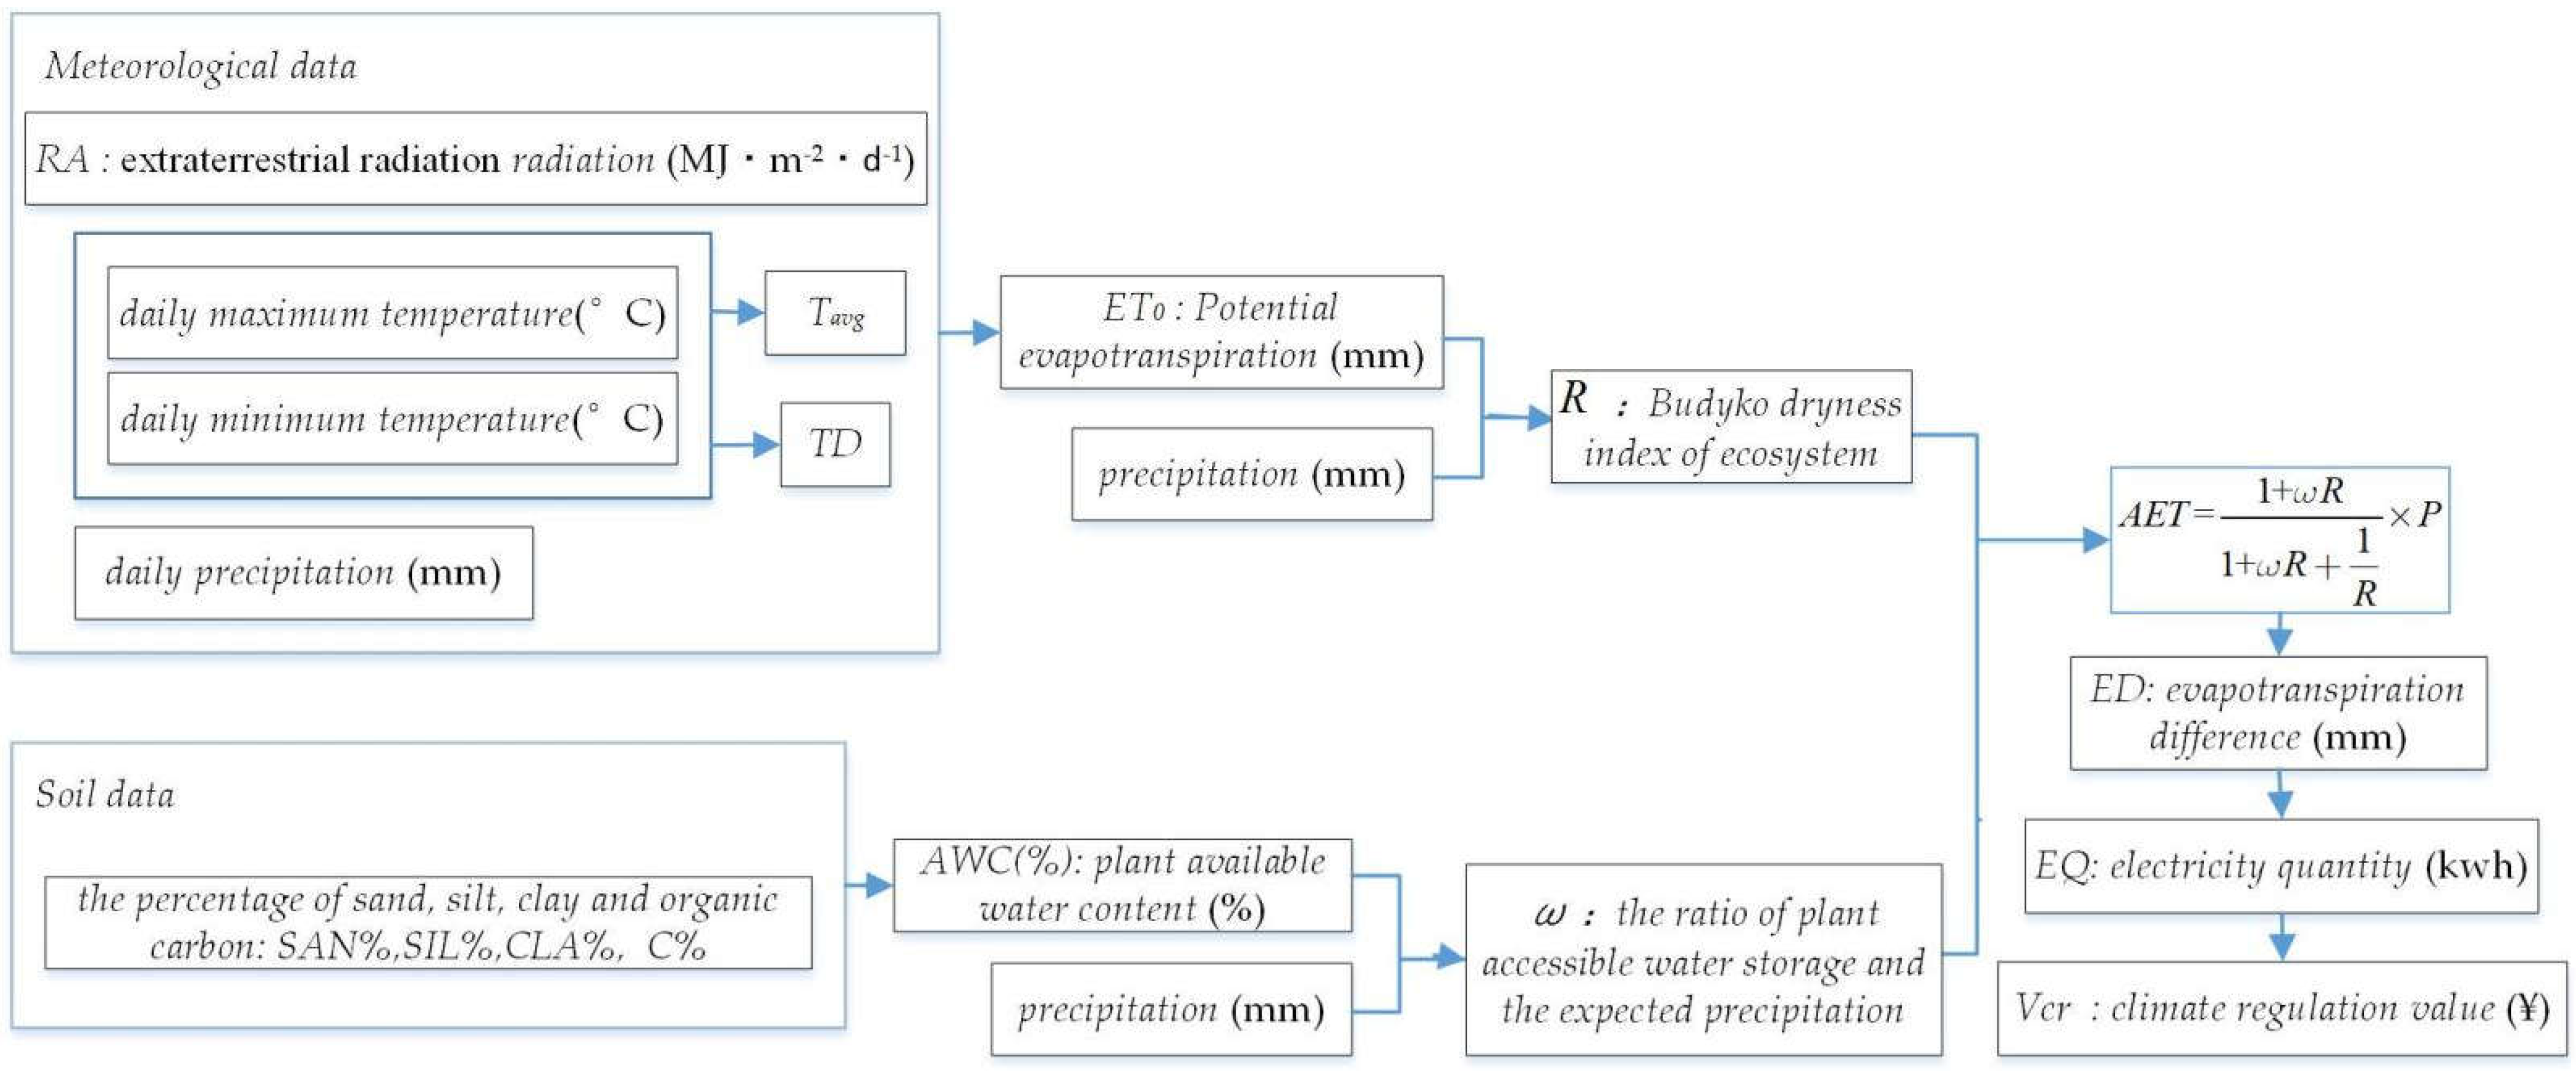
The calculation flowchart. The forest ecosystem’s climate regulation value calculating flowchart is shown in Figure 3.

3. Results

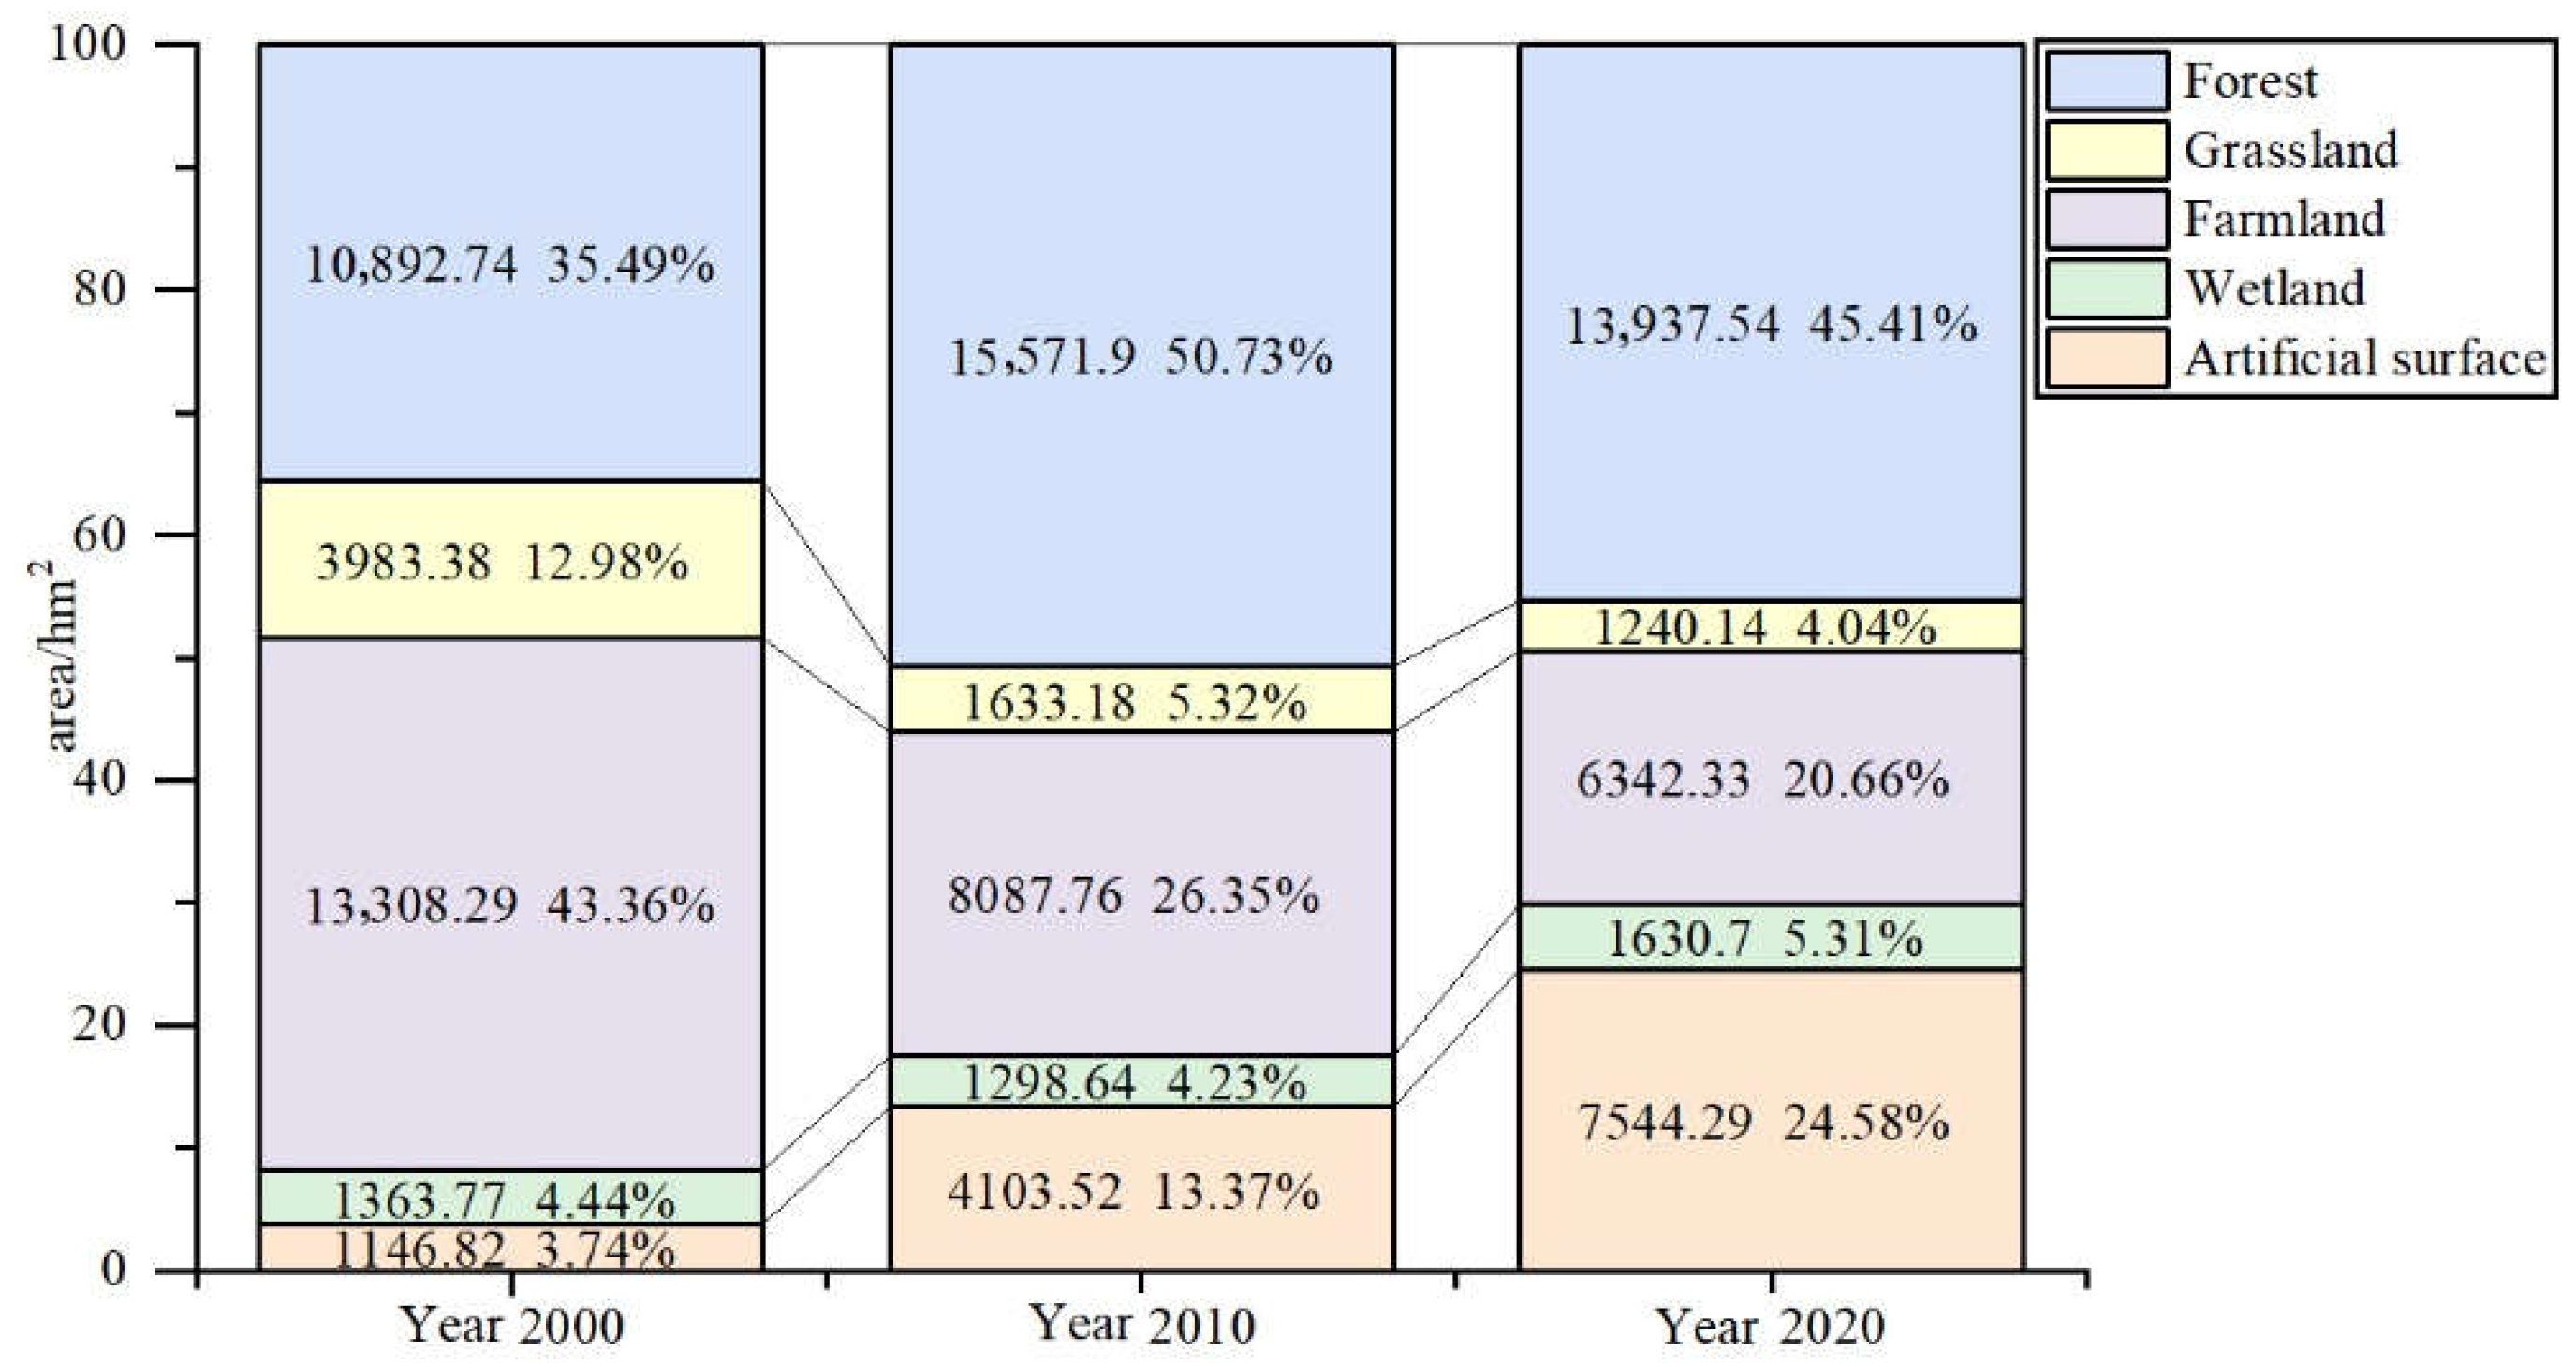
3.1. Changes in Spatial Pattern and Structure of Ecosystem

Using automatic and human-computer interaction remote sensing image processing based on multi-source data, the dynamic changes of ecosystem spatial patterns in Guanshanhu District in 2000, 2010, and 2020 were analyzed and are shown in Figure 4.
According to the attribute statistics in Figure 4, the dynamic changes in the ecosystem structure in the Guanshanhu District in 2000, 2010, and 2020 were analyzed and are shown in Figure 5.
The Natural Forest Protection Program (NFPP) [69] and the Conversion of Cropland to Forest Project (CCFP) [70,71] were carried out around 2000 in China in the wake of the worst flooding disaster in 1998. And the Comprehensive Control Project of Rocky Desertification (CCPRD) [72] in the karst area was launched in 2007. The implementation of these ecological projects has greatly changed the land cover. As a result, the area of the forest ecosystem in Guanshanhu District increased from 10,892.74 ha to 15,571.90 ha in the time interval between 2000 and 2010. The net increase was 4679.16 ha, and the increase ratio was 15.24%. However, since the establishment of Guanshanhu District in 2012, the expansion of urban sprawl has caused the area of the forest ecosystem to decrease. By 2020, it had decreased to 13,937.54 ha, showing a net decrease of 1634.36 ha compared to 2010.
The construction of new urban areas caused the impervious surface to grow rapidly. Impervious surfaces are anthropogenic features through which water cannot infiltrate the soil, including roads, driveways, sidewalks, parking lots, rooftops, buildings, and so on. The increase of impervious surfaces often leads to enhanced urban runoff, which reduces evaporation and transpiration [73,74], therefore affecting the meteorological conditions and microclimate patterns. The causation of urban heat island effects and dry island effects is closely connected to the agglomeration of impervious surfaces [75,76]. In the study area, the impervious surface occupied 1146.82 ha, accounting for 3.74% of the total area in 2000. The impervious surface area had increased to 7544.29 ha, accounting for 24.58% in 2020. The development of new urban areas mostly occupied farmlands at relatively low elevations. The total area of the farmland ecosystem decreased from 13,308.29 ha in 2000 to 6342.33 ha in 2020, and its proportion decreased from 43.36 to 20.66%.

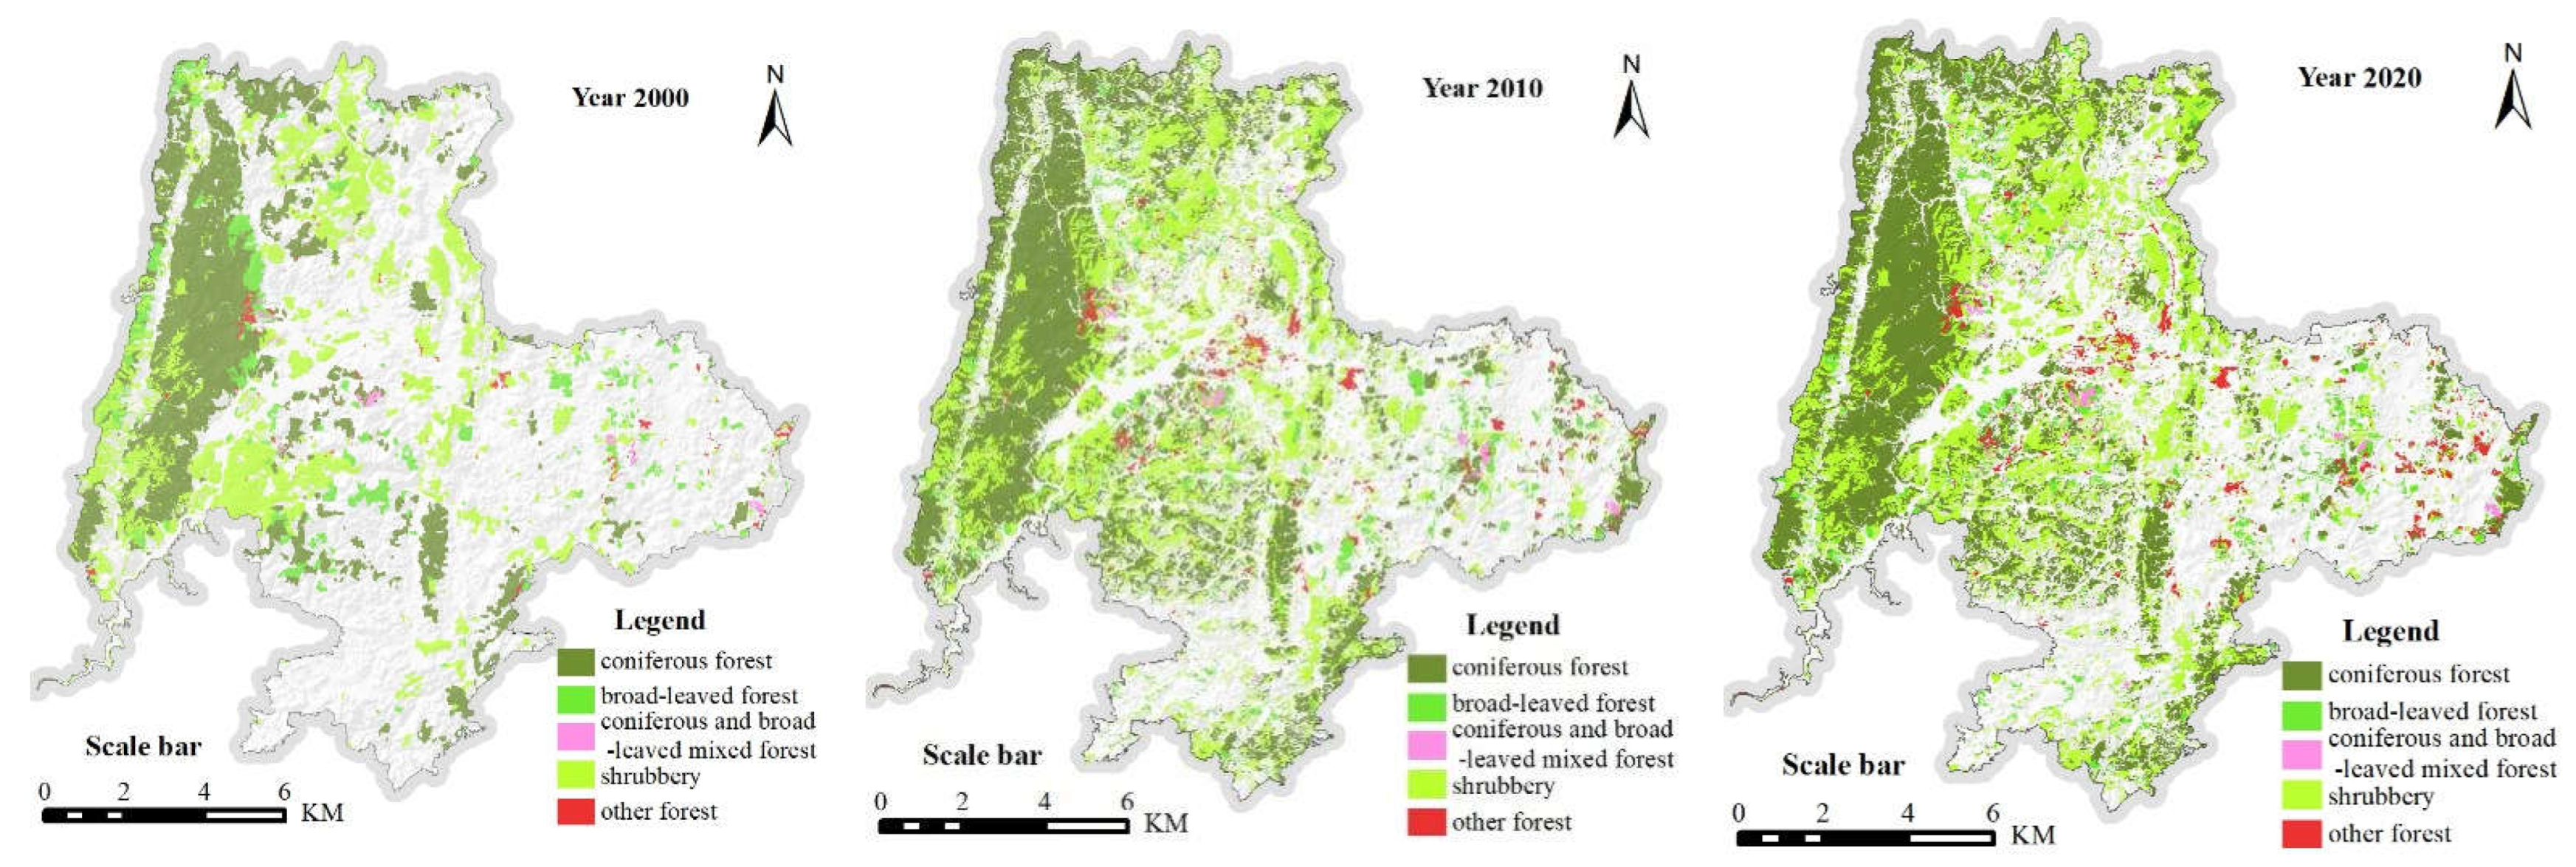
3.2. Changes in Spatial Pattern and Structure of Forest Ecosystem

The dynamic changes in forest ecosystem spatial distribution in Guanshanhu District in 2000, 2010, and 2020 are shown in Figure 6.
According to the attribute statistics in Figure 6, dynamic changes in the forest ecosystem structure in Guanshanhu District in 2000, 2010, and 2020 are shown in Table 1.
In the forest ecosystem of Guanshanhu District, the coniferous forest is the largest component. In 2000, 2010, and 2020, the area of coniferous forest was 4690.55 ha, 7466.22 ha, and 7322.37 ha, and the total area ratio was 15.28, 24.32, and 23.86%, respectively. The second large component is the shrubs, accounting for 12.30, 20.52, and 13.60%, respectively. The total proportion of the broad-leaved forest, the coniferous and broad-leaved mixed forest, and other forests maintained below 10.00%. Overall, under the double influence of the implementation of ecological engineering projects and the acceleration of urban expansion, the forest ecosystem in Guanshanhu District has changed greatly since the millennium. With future urban development, the area of the forest ecosystem in this district is likely to follow a decreasing trend.

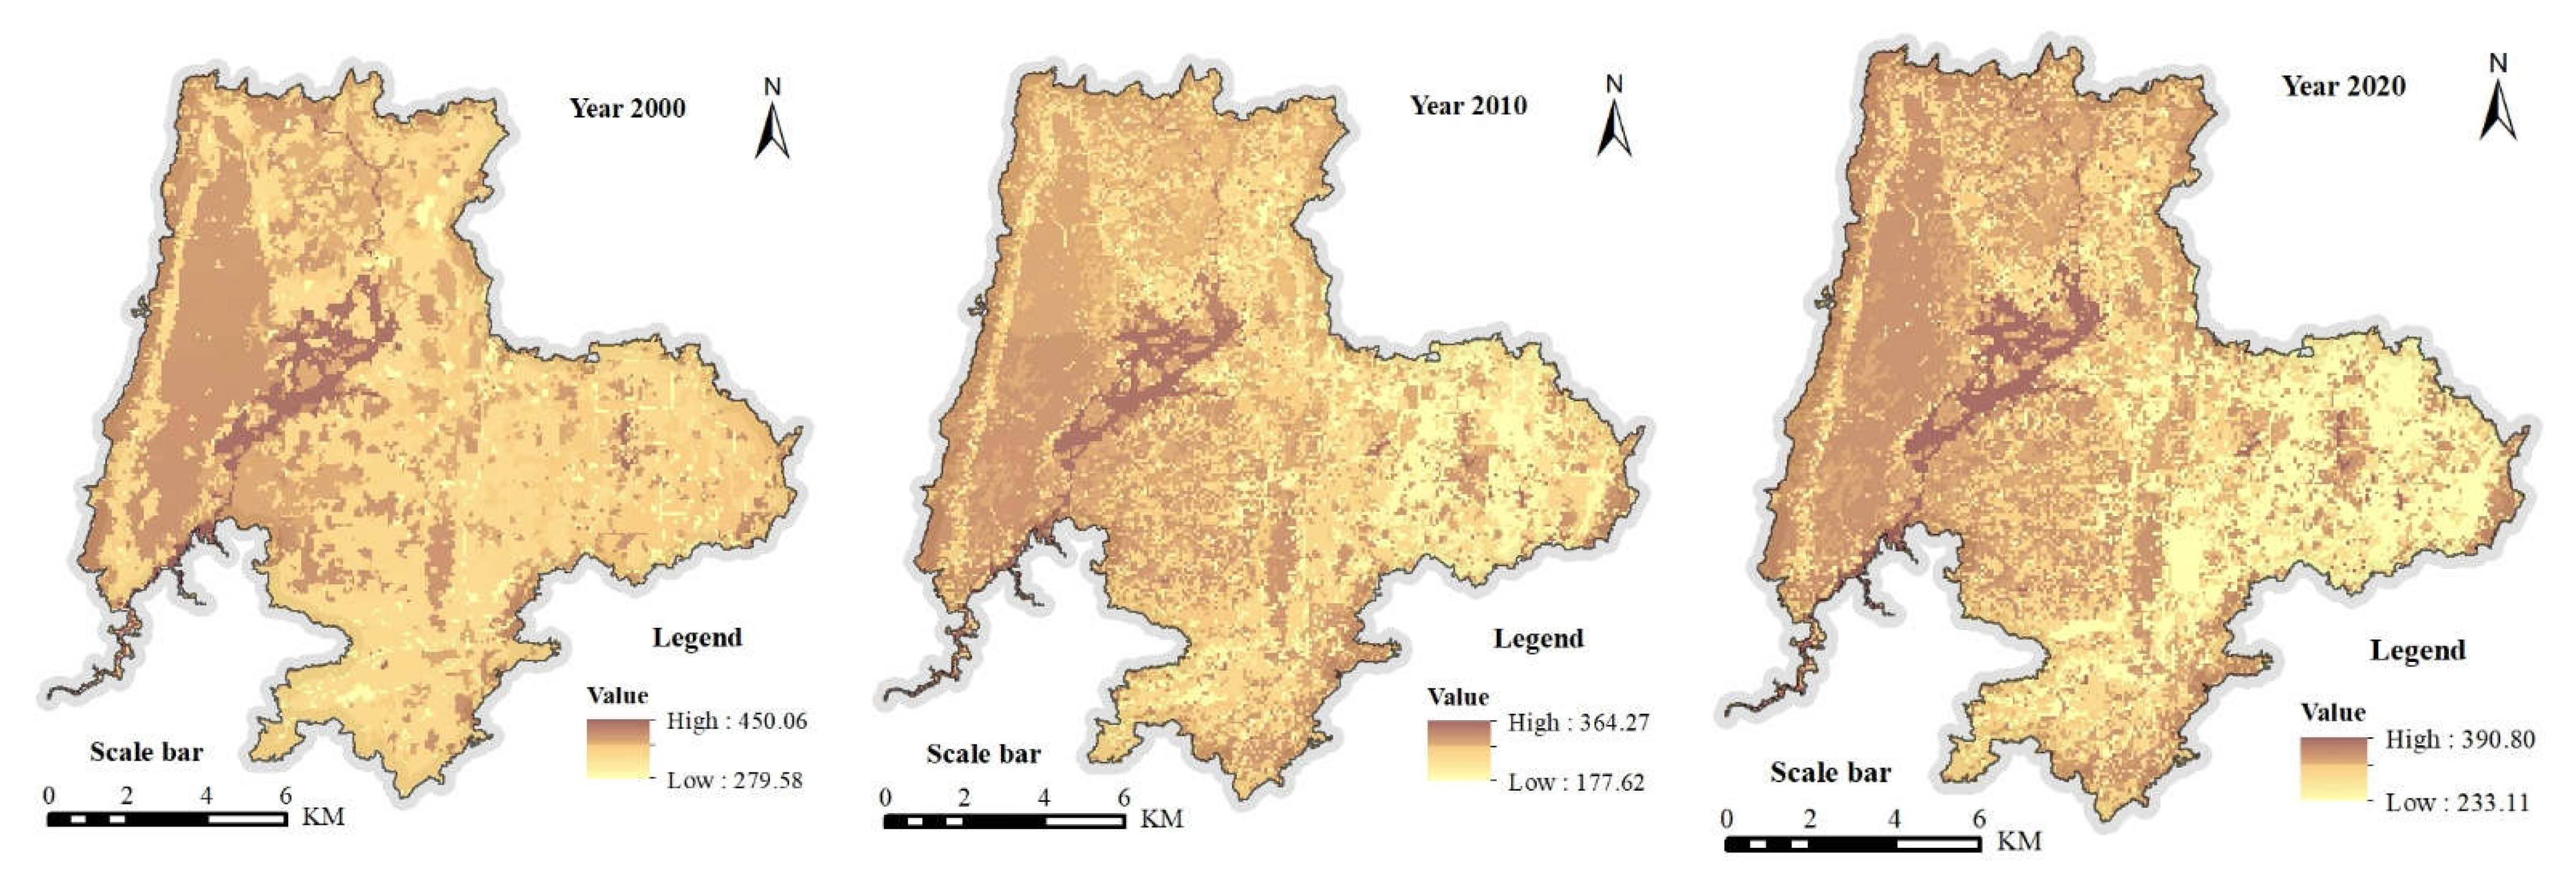
3.3. Actual Evapotranspiration of Forest Ecosystem and Its Climate Regulation Value

  • The spatial distribution of actual evapotranspiration and its heterogeneity
According to the actual evapotranspiration calculation method mentioned above, the annual AET of different ecosystems in the District in 2000, 2010, and 2020 are calculated by ARCGIS spatial modeling, and the spatial distribution patterns are shown in Figure 7.
According to Formulas (7) and (8), annual AET differences of forest ecosystems relative to impervious surfaces are extracted (Table 2). Annual AET differences are converted into the heat dissipation difference, and then the heat dissipation difference is converted into electricity quantity (EQ).
According to Table 2, in each of the three epochs, coniferous forests contributed the most to the total evaporation difference of the forest ecosystem. This may partly be attributed to its wide distribution. The second is the coniferous and broad-leaved mixed forest, followed by the broad-leaved forest, the shrubs, and other forests.
With the development of the new urban area, the actual evapotranspiration differences between forest ecosystems and impervious surfaces have increased. The increase elucidates that urban forest plays an increasingly important role in local climate regulation. Impervious surfaces newly built during the development have reduced evaporation and transpiration, whereas vegetation cover in suburban areas contributes to significant heat losses and moisture convection through evapotranspiration.
b.
Forest climate regulation value based on evapotranspiration difference
The value of the forest climate regulation service was estimated according to Formulas (8) and (9) mentioned above. To facilitate the comparison of the ecological service value in 2000, 2010, and 2020, the comparable price reduced by the price index is used in the calculation. The electricity prices were ¥0.40/kWh in 2000, ¥0.50/kWh in 2010, and ¥0.61/kWh in 2020. The calculation results are shown in Table 3.
According to Table 3, in each of the three epochs, the per unit area climate regulation value of the coniferous forest was the highest, followed by the coniferous and broad-leaved mixed forests, the broad-leaved forests, shrubs, and other forests, respectively. The per unit area climate regulation value of the coniferous forest was ¥8.73 × 10⁴/ha in 2000, ¥8.90 × 10⁴/ha in 2010, and ¥11.82 × 10⁴/ha in 2020, showing an increasing trend. The average per unit area climate regulation value of all types of forests was ¥8.06 × 10⁴/ha in 2000, ¥8.11 × 10⁴/ha in 2010, and ¥10.58 × 10⁴/ha in 2020, also showing an increasing trend.
The value of the climate regulation service of the forest ecosystems in Guanshanhu District displays an overall growing trend. The total value was ¥8.78 × 10⁸ in 2000, ¥12.62 × 10⁸ in 2010, and ¥14.75 × 10⁸ in 2020. Among them, the climate regulation value of the coniferous forest ecosystem was the largest, which was ¥4.10 × 10⁸ in 2000, ¥6.65 × 10⁸ in 2010, and ¥8.65 × 10⁸ in 2020, showing an increasing trend. The shrubs ecosystem also played an important role in climate regulation; however, its total climate regulation value was ¥2.85 × 10⁸ in 2000, ¥4.63 × 10⁸ in 2010, and ¥3.83 × 10⁸ in 2020, showing a decreasing trend, resulting from the decrease in the total area from 2010 to 2020. The overall climate regulation value of the broad-leaved forest ecosystem, the coniferous and broad-leaved mixed forest, and other forests was relatively lower.

4. Discussion

In our work, we proposed a new methodological approach to estimate the climate regulation value of the forest ecosystem based on actual evapotranspiration. As previous studies have illustrated, terrestrial ecosystems usually regulate climate through biogeochemical (greenhouse-gas regulation) and biophysical (regulation of water and energy) mechanisms [77,78]. Both biogeochemical and biophysical factors contribute meaningfully to estimating climate regulation value, but the results can be highly variable by the spatial-temporal scale. Solid studies have pointed out that while estimating global scale climate regulation for longer periods, biogeochemical factors are more important, but when focusing on the local scale and within a relatively short period (T ≤ 20 years), the biophysical impacts can dwarf biogeochemical impacts [78,79,80,81,82,83]. Therefore, in estimating the climate regulation value of the local forest ecosystem, studies typically base their estimation solely on the biophysical processes.
In western studies, the climate regulation value of urban greenspace is calculated as energy savings of cooling and heating consumption caused by the existence of city trees. The evaluation process usually consists of 4 steps [84]: defining prototypical buildings (construction vintage, usage, insulation); simulating the base case heating and cooling energy use for each prototype; simulating the energy-saving effects by quantifying tree regulations of shading, evapotranspiration, and wind resistance; integrating and tabulating the total energy savings by ranges of annual heating and cooling days and according to the fuel type (natural gas or electricity).
A study by McPherson, E.G. (1994b) [26] concluded that increasing tree cover by 10% or planting three trees per building lot saves annual heating and cooling costs by an estimated $50 to $90 per dwelling unit due to the biophysical regulating effects. Further study in the US indicates that the potential annual energy savings of $6.3 M in cooling and heating energy consumption could be realized by the existence of urban greenspace in Baton Rouge, LA; the potential annual energy savings in Sacramento, CA, USA is estimated at $12.8 M; and the potential annual energy savings in Salt Lake City, UT, is estimated at $1.5 M [33]. Akbari (2002) [85] estimated that in Los Angeles, CA, USA, urban trees could potentially save $93 M of energy use per year by regulating air temperature.
However, in western studies, the amount and type of energy savings associated with city trees are not only highly site-specific but also highly speculative. The estimated savings are sensitive to the location of planting sites and building characteristics, and the actual energy consumption for cooling and heating demand is highly affected by other factors like location of buildings, preference for indoor air temperature, energy efficiency of cooling or heating equipment, paying ability, etc. [19,32,35]. More importantly, the results of the estimations are highly conditional and time-sensitive because the conditions of prototypical buildings change over time. Former estimation results can hardly be referred to reflect the effects of land use change when urban greenspace or human constructions increase or decrease and by which the characteristics of urban trees (like species composition, plant age, location to building, etc.) also change.
The situation can be partly simplified when estimating the climate regulation value of forest ecosystems in densely built cities where, as mentioned before, the climate regulation function mainly relies on evapotranspiration. This concept has been explored in former studies conducted in China [19,35]. The methodology can also be modified by using actual evapotranspiration (AET) as the comprehensive indicator for energy regulation, moisture emission, and albedo alteration of different land cover types. In the new methodology we proposed, the actual evapotranspiration of impervious surfaces is calculated, too. Various research asserted that increasing impervious surfaces during urban development could signal a decline in ecosystem functions [86,87], and enhance local temperature, heat island effect, and dry island effect [74,88,89]. The changes in land cover type during the development of new urban areas exert a crucial influence on local climate, so the relative importance of climate regulation function of local forest ecosystem should be examined along with considerations for impervious surface areas, too. In the new methodology, we proposed, the value of climate regulation service provided by forest ecosystem is calculated based on the difference in annual AET of forests relative to impervious surface, so the more the urban sprawl (roads, parking lots, buildings) expands, the more important the climate regulation service of local forest ecosystem will be.
The results of applying the new approach in the new urban area of Guanshanhu District confirmed the considerable value of climate regulation service provided by the suburban forest ecosystem and its changing pattern. In 2000, the impervious surface area in the District was relatively small (1146.82 ha, 3.74% of the total area), the farmland ecosystem occupied 43.36% of the total area, and the per unit area climate regulation value of the forest ecosystem was ¥8.06 × 10⁴/ha. In 2010, the impervious surface increased to 4103.52 ha, 13.37% of the total area, the farmland ecosystem area shrunk, the forest ecosystem increased to occupy 50.73% of the total area, and the per unit area climate regulation value of the forest ecosystem was ¥8.11 × 10⁴/ha. In 2020, the impervious surface increased to 7544.29 ha, 24.58% of the total area, the farmland ecosystem continuously reduced to 20.66% of the total area, and the forest ecosystem reduced, too, so the per unit area climate regulation value of the forest ecosystem increased to ¥10.58 × 10⁴/ha. The results demonstrated the influence that land use change exerted on climate regulation value, which has not been discussed quantitatively in earlier studies.
However, there are still certain limitations in the estimation method we proposed in this study. Firstly, the estimation of forest climate regulation value based solely on actual evapotranspiration can only apply to densely built urban areas with multistory buildings, where the major forest is located in the peripheral or suburban areas, so the shading effect and wind-shielding effect of trees can be left out of consideration. Secondly, this estimation method can be fallacious when applied to arid or semi-arid areas where enhanced evapotranspiration might increase pressure on water availability [90,91]. In our research area, located in the subtropical monsoon zone, enhanced evapotranspiration resulting from large-scale reforestation can promote atmospheric moisture recycling and offset the effects of higher runoff peaks and total volume of runoff in receiving waters caused by an impervious surface increase in the watershed [81], thus reducing risks of flooding events downstream during rainy seasons when the precipitation is usually heavy and concentrated [92].
The estimated results of the climate regulation value of the forest ecosystem in the new urban area of Guanshanhu District reflected the increasingly significant role of the forest ecosystem for ecological compensation, ecological construction, and ecological civilization.

5. Conclusions

The objective of this study is to propose a new methodological approach for estimating the climate regulation value of forest ecosystems in urban areas based on actual evapotranspiration (AET). The new approach was carried out in Guanshanhu District of Guiyang City, Guihzou Province, Southwest China, to estimate and depict the changes in forest climate regulation value in 2000, 2010, and 2020. The results show that:
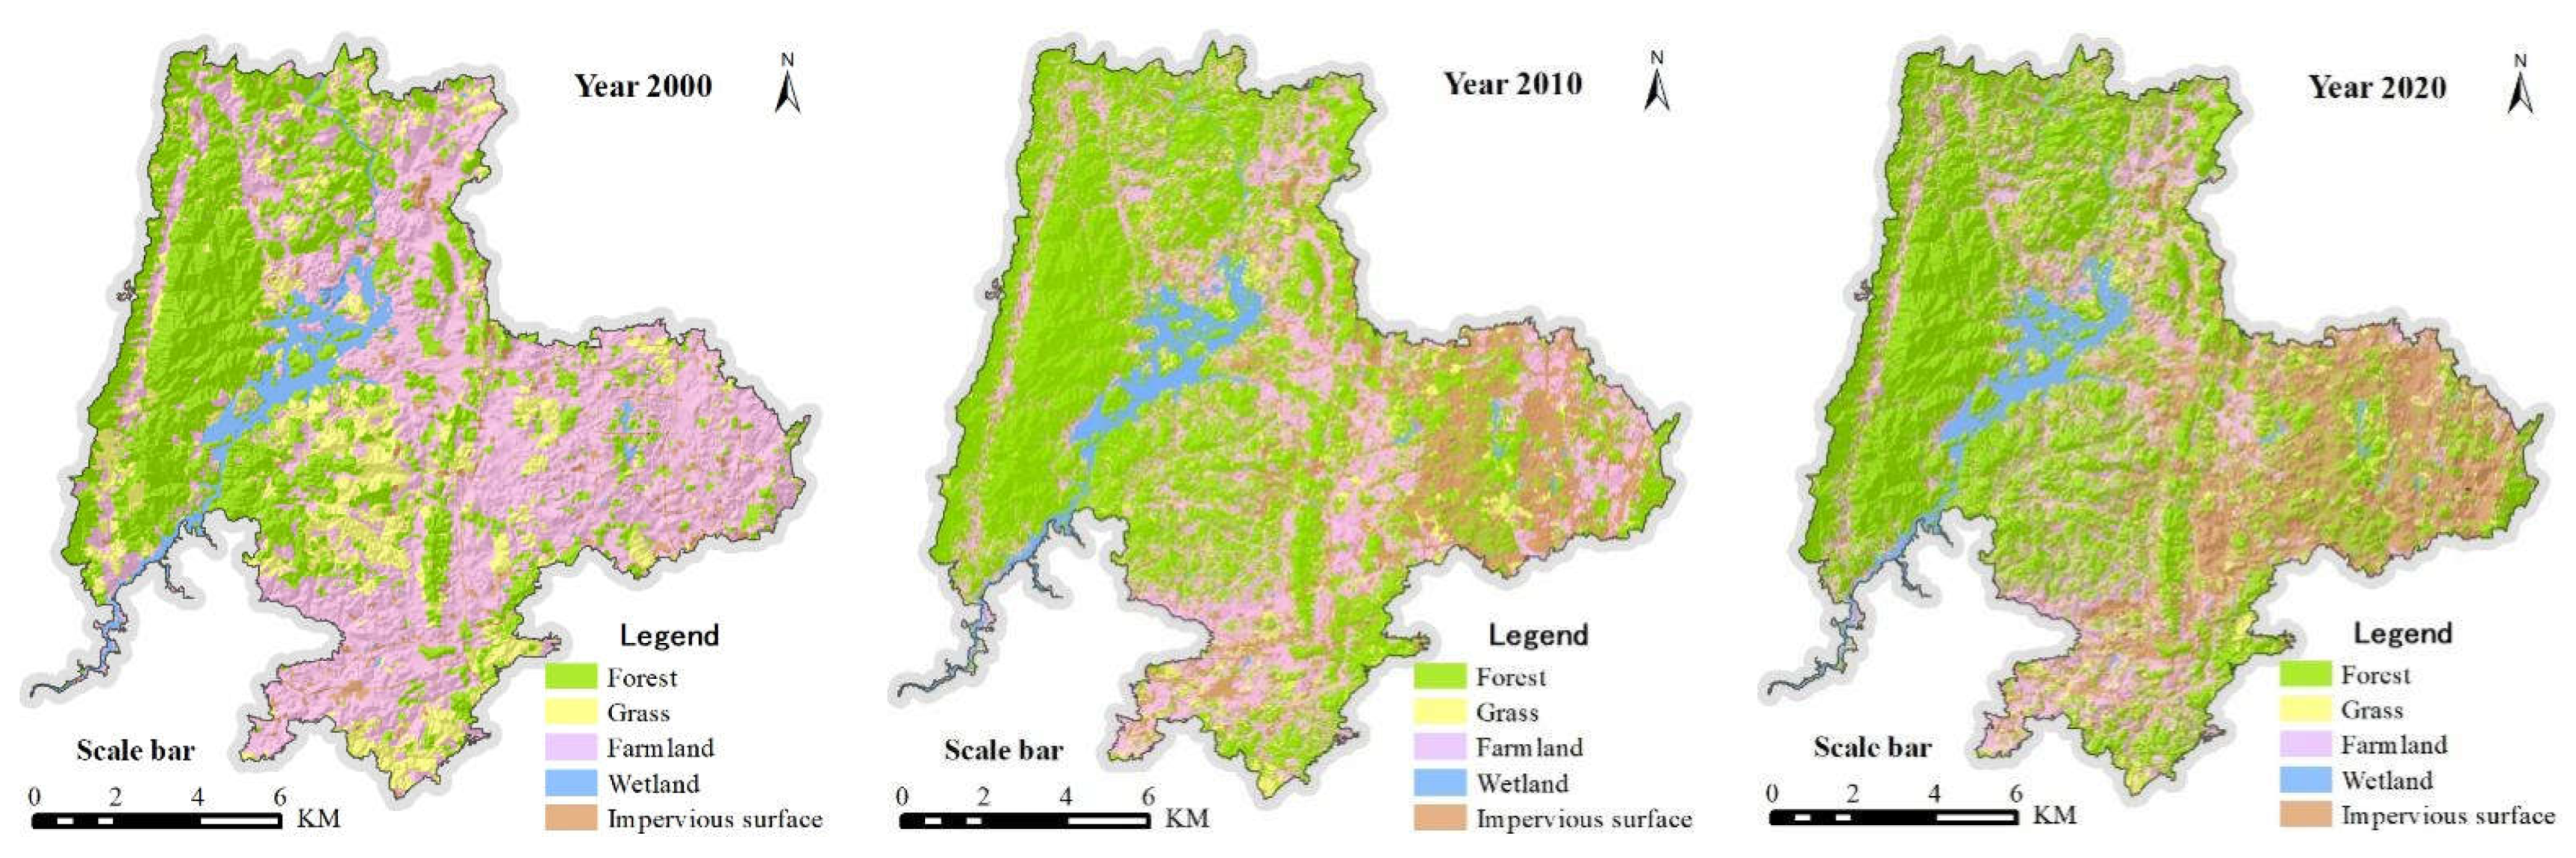
  • The area of forest ecosystem in Guanshanhu District increased in the first decade since the millennium due to ecological engineering, then decreased in the following decade due to the establishment of the new urban area. In 2000, the area of forest ecosystem in the study region was 10,892.74 ha, accounting for 35.49% of the total area. In 2010, the area of the forest ecosystem was 15,571.90 ha, accounting for 50.73%. In 2020, the area of the forest ecosystem was 13,937.54 ha, accounting for 45.41%. The impervious surface area kept increasing rapidly, from 1146.82 ha, accounting for 3.74% in 2000, to 4103.52 ha, accounting for 13.37% in 2010, to 7544.29 ha, accounting for 24.58% in 2020.
  • The forest structure in Guanshanhu District remained relatively constant. In 2000, 2010, and 2020, the coniferous forest was the largest component of the forest ecosystem, accounting for 15.28, 24.32, and 23.86%, respectively. The shrub forest is the second large component, accounting for 12.30, 20.52, and 13.60%, respectively. The total proportion of the broad-leaved forest, the coniferous and broad-leaved mixed forest, and other forests maintained below 10.00%.
  • Comparing to impervious surfaces of the new urban area allowed the differences in actual evapotranspiration of forest ecosystems to be derived. In 2000, 2010, and 2020, the coniferous forest contributed the most to the total evaporation difference of the forest ecosystem, followed by the coniferous and broad-leaved mixed forest, the broad-leaved forest, the shrubs, and other forests.
  • The climate regulation value of the forest ecosystem in Guanshanhu District was estimated based on actual evapotranspiration differences compared to impervious surfaces. The results revealed an increasing trend. Based on electricity price in 2000, the value of the forest ecosystem climate regulation service was ¥8.78 × 10⁸ in 2000, ¥12.62 × 10⁸ in 2010, and ¥14.75 × 10⁸ in 2020.
  • The average per unit area climate regulation value of the forests of the Guanshanhu District was ¥8.06 × 10⁴/ha in 2000, ¥8.11 × 10⁴/ha in 2010, and ¥10.58 × 10⁴/ha in 2020. The highest per unit area climate regulation value was provided by the coniferous forest, which was ¥8.73 × 10⁴/ha in 2000, ¥8.90 × 10⁴/ha in 2010, and ¥11.82 × 10⁴/ha in 2020. The coniferous and broad-leaved mixed forest followed as the second, and the broad-leaved forest ecosystem as the third. The lowest per unit area climate regulation value was provided by other forests, which was ¥6.42 × 10⁴/ha in 2000, ¥6.49 × 10⁴/ha in 2010, and ¥8.97 × 10⁴/ha in 2020.
The estimation based on actual evapotranspiration can well illustrate the spatial-temporal differentiation in climate regulation services of the forest ecosystem in the Guanshanhu District. The results depict the dynamic changes in forest ecosystems from 2000 to 2020, and also reflect the importance of the forest ecosystem’s contribution to local climate regulation. This study is a beneficial exploration of forest ecosystem climate regulation value estimation. The results can be incorporated into the decision-making process of regional land use planning and sustainable development in new urban areas.

Author Contributions

Conceptualization, O.D., R.L., Y.L.; methodology, O.D., R.L., Y.L., G.Y.; software, Y.L., G.Y.; validation, Y.L., G.Y.; formal analysis, O.D., R.L., Y.L.; investigation, O.D., Y.L.; resources, O.D.; data curation, O.D., Y.L.; writing—original draft preparation, O.D., R.L.; writing—review and editing, Y.L., R.L.; visualization, O.D.; supervision, Y.L.; project administration, O.D.; funding acquisition, O.D., Y.L. All authors have read and agreed to the published version of the manuscript.

Funding

This work was funded by the Science and Technology Program of Guizhou Province (2019 1222); the Science and Technology Program of Guizhou Province (2020 1Z031); the Joint Fund of the National Natural Science Foundation of China and the Karst Science Research Center of Guizhou province (Grant No. U1812401); the open project of Ecological Security and Protection Key Laboratory of Sichuan Province (ESP201304); the Science and Technology Program of Guizhou Province (2019 1218).

Institutional Review Board Statement

Not applicable.

Informed Consent Statement

Not applicable.

Data Availability Statement

All data in this study were correctly referenced. The meteorological datasets were obtained from the National Meteorological Information Centre of China (http://data.cma.cn/, accessed on 15 September 2020). The Landsat TM, ETM+, Gaofen2 data source was obtained from the national geographic information monitoring cloud platform (http://www.dsac.cn/DataProduct/Index/1002, accessed on 20 July 2020). The soil datasets were obtained from China Soil Database (http://vdb3.soil.csdb.cn/, accessed on 20 October 2020). The SRTM 90 m DEM data can be found on this website (http://srtm.csi.cgiar.org, accessed on 12 July 2020).

Acknowledgments

The authors thank the editors and anonymous reviewers for their constructive comments and helpful suggestions.

Conflicts of Interest

The authors declare no conflict of interest.

References

  1. Birkin, F. Ecological accounting: New tools for a sustainable culture. Int. J. Sustain. Dev. World Ecol. 2003, 10, 49–61. [Google Scholar] [CrossRef]
  2. Zhou, Z.; Ou, J.; Li, S. Ecological Accounting: A Research Review and Conceptual Framework. J. Environ. Prot. 2016, 7, 643–655. [Google Scholar] [CrossRef]
  3. Jo, H.K. Impacts of urban greenspace on offsetting carbon emissions for middle Korea. J. Environ. Manag. 2002, 64, 115–126. [Google Scholar] [CrossRef] [PubMed]
  4. Manning, W.J.; Feder, W.A. Biomonitoring Air Pollutants with Plants; Applied Science: London, UK, 1980; p. 142. [Google Scholar]
  5. Grimmond, S.; Souch, C.; Grant, R.; Heisler, G. Local scale energy and water exchange in a Chicago neighborhood. In Chicago’s Urban Forest Ecosystem: Results of the Chicago Urban Forest Climate Project; McPherson, E.G., Nowak, D.J., Rowntree, R.A., Eds.; USDA, Forest Service: Washington, DC, USA, 1994; Volume NE-186, pp. 41–62. [Google Scholar]
  6. Hayward, D.G.; Weitzer, W. The public’s image of urban park, past amenity, present ambivalence, uncertain future. Urban Ecol. 1984, 8, 243–268. [Google Scholar] [CrossRef]
  7. Miller, R.W. Urban Forestry—Planning and Managing Urban Greenspaces; Prentice-Hall: Englewood Cliffs, NJ, USA, 1988; p. 404. [Google Scholar]
  8. Bai, X.; McPhearson, T.; Cleugh, H.; Nagendra, H.; Tong, X.; Zhu, T.; Zhu, Y. Linking Urbanization and the Environment: Conceptual and Empirical Advances. Annu. Rev. Environ. Resour. 2017, 42, 215–240. [Google Scholar] [CrossRef]
  9. Lokoshchenko, M.A. Urban Heat Island and Urban Dry Island in Moscow and Their Centennial Changes. J. Appl. Meteorol. Climatol. 2017, 56, 215–240. [Google Scholar] [CrossRef]
  10. Lu, D.; Weng, Q. Use of impervious surface in urban land-use classification. Remote Sens. Environ. 2006, 102, 146–160. [Google Scholar] [CrossRef]
  11. Yang, L.; Qian, F.; De-Xuan, S.; Ke-Jia, Z. Research on urban heat-island effect. Procedia Eng. 2016, 169, 11–18. [Google Scholar] [CrossRef]
  12. Deilami, K.; Kamruzzaman, M.; Liu, Y. Urban heat island effect: A systematic review of spatio-temporal factors, data, methods, and mitigation measures. Int. J. Appl. Earth Obs. Geoinf. 2018, 67, 30–42. [Google Scholar] [CrossRef]
  13. Ellison, D.; Morris, C.E.; Locatelli, B.; Sheil, D.; Cohen, J.; Murdiyarso, D.; Gutierrez, V.; Van Noordwijk, M.; Creed, I.F.; Pokorny, J.; et al. Trees, forests and water: Cool insights for a hot world. Glob. Environ. Chang. 2017, 43, 51–61. [Google Scholar] [CrossRef]
  14. Heisler, G.M. Effects of individual trees on the solar radiation climate of small buildings. Urban Ecol. 1986, 9, 337–359. [Google Scholar] [CrossRef]
  15. Heisler, G.M. Mean wind speed below building height in residential neighborhoods with different tree densities. ASHRAE Trans. 1990, 96, 1389–1396. [Google Scholar]
  16. Gómez, F.; Tamarit, N.; Jabaloyes, J. Green zones, bioclimatics studies and human comfort in the future development of urban planning. Landsc. Urban Plan. 2001, 55, 151–161. [Google Scholar] [CrossRef]
  17. Luvall, J.C.; Quattrochi, D.A.; Rickman, D.; Estes, M. Urban forests cool hot cities. J. For. 2000, 98, 149–150. [Google Scholar]
  18. Barradas, V.L. Energy balance and transpiration in an urban tree hedgerow in Mexico City. Urban Ecosyst. 2000, 4, 55–67. [Google Scholar] [CrossRef]
  19. Chen, W.Y. Assessing the Services and Value of Green Spaces in Urban Ecosystem: A Case of Guangzhou City. Ph.D Thesis, The University of Hong Kong, Hong Kong, China, 2006. [Google Scholar]
  20. Chen, W.Y.; Jim, C.Y. Assessment and valuation of the ecosystem services provided by urban forests. In Ecology, Planning, and Managements of Urban Forests; Carreiro, M.M., Song, Y., Wu, J., Eds.; Springer: New York, NY, USA, 2008; pp. 53–83. [Google Scholar]
  21. Huang, J.; Akbari, H.; Taha, H.; Rosenfeld, A. The potential of vegetation in reducing summer cooling loads in residential buildings. J. Clim. Appl. Meteorol. 1987, 26, 1103–1116. [Google Scholar] [CrossRef]
  22. Akbari, H.; Taha, H. The impact of trees and white surfaces on residential heating and cooling energy use in four Canadian cities. Energy 1992, 17, 141–149. [Google Scholar] [CrossRef]
  23. Akbari, H.; Pomerantz, M.; Taha, H. Cool surfaces and shade trees to reduce energy use and improve air quality in urban areas. Solar Energy 2001, 70, 295–310. [Google Scholar] [CrossRef]
  24. Akbari, H.; Rosenfeld, A.H.; Taha, H. Summer heat islands, urban trees, and white surfaces. ASHRAE Trans. 1990, 96, 1381–1388. [Google Scholar]
  25. McPherson, E.G. Cooling urban heat islands with sustainable landscapes. In The Ecological City: Preserving and Restoring Urban Biodiversity; Platt, R.H., Rowntree, R.A., Muick, P.C., Eds.; University of Massachusetts Press: Boston, MA, USA, 1994; pp. 151–171. [Google Scholar]
  26. McPherson, E.G. Using urban forests for energy efficiency and carbon storage. J. For. 1994, 92, 36–41. [Google Scholar]
  27. McPherson, E.G. Energy-saving potential of trees in Chicago. In Chicago’s Urban Forest Ecosystem: Results of the Chicago Urban Forest Climate Project; McPherson, E.G., Nowak, D.J., Rowntree, R.A., Eds.; USDA, Forest Service: Washington, DC, USA, 1994; Volume NE-186, pp. 95–113. [Google Scholar]
  28. McPherson, E.G.; Nowak, D.; Heisler, G.; Grimmond, S.; Souch, C.; Grant, R.; Rowntree, R. Quantifying urban forest structure, function, and value: The Chicago Urban Forest Climate Project. Urban Ecosyst. 1997, 1, 49–61. [Google Scholar] [CrossRef]
  29. McPherson, E.G.; Simpson, J.R. Potential energy savings in buildings by an urban tree planting programm in California. Urban For. Urban Green. 2003, 2, 73–86. [Google Scholar] [CrossRef]
  30. Simpson, J.R.; McPherson, E.G. Potential of tree shade for reducing residential energy use in California. J. Arboric. 1996, 22, 10–18. [Google Scholar] [CrossRef]
  31. Simpson, J.R.; McPherson, E.G. Simulation of tree shade for reducing residential energy use for space conditioning in Sacramento. Atmos. Environ. Urban Atmos. 1998, 32, 69–74. [Google Scholar] [CrossRef]
  32. Simpson, J.R. Urban forest impacts on regional cooling and heating energy use: Sacramento county case study. J. Arboric. 1998, 24, 201–214. [Google Scholar] [CrossRef]
  33. Konopacki, S.; Akbari, H. Energy savings calculation for urban heat island mitigation strategies in Baton Rouge, Sacramento and Salt Lake City. In Proceedings of the 2000 ACEEE Summer Study on Energy Efficiency in Buildings, Pacific Grove, CA, USA, 2000; American Council for an Energy Efficient Economy: Washington, DC, USA, 2000; Volume 9, p. 215. [Google Scholar]
  34. Schwarz, N.; Bauer, A.; Haase, D. Assessing climate impacts of planning policies—An estimation for the urban region of Leipzig (Germany). Environ. Impact Assess. Rev. 2011, 31, 97–111. [Google Scholar] [CrossRef]
  35. Jim, C.Y.; Chen, W.Y. Ecosystem services and valuation of urban forests in China. Cities 2009, 26, 187–194. [Google Scholar] [CrossRef]
  36. Meili, N.; Manoli, G.; Burlando, P.; Carmeliet, J.; Chow, W.T.; Coutts, A.M.; Fatichi, S. Tree effects on urban microclimate: Diurnal, seasonal, and climatic temperature differences explained by separating radiation, evapotranspiration, and roughness effects. Urban For. Urban Green. 2021, 58, 126970. [Google Scholar] [CrossRef]
  37. Yu, Y.; de Dear, R.; Chauhan, K.; Niu, J. Impact of wind turbulence on thermal perception in the urban microclimate. J. Wind. Eng. Ind. Aerodyn. 2021, 216, 104714. [Google Scholar] [CrossRef]
  38. Qiu, G.; Li, H.; Zhang, Q.; Chen, W.; Liang, X.; Li, X. Effects of evapotranspiration on mitigation of urban temperature by vegetation and urban agriculture. J. Integr. Agric. 2013, 12, 1307–1315. [Google Scholar] [CrossRef]
  39. Ye, H.; Zhang, T.; Yi, G.; Li, J.; Bie, X.; Liu, D.; Luo, L. Spatio-temporal characteristics of evapotranspiration and its relationship with climate factors in the source region of the Yellow River from 2000 to 2014. Acta Geogr. Sin. 2018, 73, 2117–2134. (In Chinese) [Google Scholar]
  40. Liu, H.T. Urban Forestry in China: A Biogeographical Study in Guangzhou City. Ph.D. Thesis, The University of Hong Kong, Hong Kong, China, 1998; p. 296. [Google Scholar]
  41. Pereira, L.S.; Perrier, A.; Allen, R.G.; Alves, I. Evapotranspiration: Concepts and future trends. J. Irrig. Drain. Eng. 1999, 125, 45–51. [Google Scholar] [CrossRef]
  42. Labedzki, L. (Ed.) Evapotranspiration; BoD–Books on Demand: Stockholm, Sweden, 2011. [Google Scholar]
  43. Abtew, W.; Melesse, A. Climate change and evapotranspiration. In Evaporation and Evapotranspiration; Springer: Dordrecht, The Netherlands, 2013; pp. 197–202. [Google Scholar]
  44. Wang, K.; Dickinson, R.E. A review of global terrestrial evapotranspiration: Observation, modeling, climatology, and climatic variability. Rev. Geophys. 2012, 50, RG2005. [Google Scholar] [CrossRef]
  45. Shukla, J.; Mintz, Y. Influence of land-surface evapotranspiration on the earth’s climate. Science 1982, 215, 1498–1501. [Google Scholar] [CrossRef]
  46. Katul, G.G.; Oren, R.; Manzoni, S.; Higgins, C.; Parlange, M.B. Evapotranspiration: A process driving mass transport and energy exchange in the soil-plant-atmosphere-climate system. Rev. Geophys. 2012, 50, RG3002. [Google Scholar] [CrossRef]
  47. Bowler, D.E.; Buyung-Ali, L.; Knight, T.M.; Pullin, A.S. Urban greening to cool towns and cities: A systematic review of the empirical evidence. Landsc. Urban Plann. 2010, 97, 147–155. [Google Scholar] [CrossRef]
  48. Gill, S.; Handley, J.F.; Ennos, A.R.; Pauleit, S. Adapting cities for climate change: The role of the green infrastructure. Built. Environ. 2007, 33, 115–133. [Google Scholar] [CrossRef]
  49. Bolund, P.; Hunhammar, S. Ecosystem Services in Urban Areas. Ecol. Econ. 1999, 29, 293–301. [Google Scholar] [CrossRef]
  50. Pielke, R.; Avissar, R.; Raupach, M.; Dolman, A.; Zeng, X.; Denning, A. Interactions between the atmosphere and terrestrial ecosystems: Influence on weather and climate. Glob. Chang. Biol. 1998, 4, 461–475. [Google Scholar] [CrossRef]
  51. Van der Ent, R.J.; Savenije, H.H.; Schaefli, B.; Steele-Dunne, S.C. Origin and fate of atmospheric moisture over continents. Water Resour. Res. 2010, 46, W09525. [Google Scholar] [CrossRef]
  52. Yang, S. Urban Ecology; Science Press: Beijing, China, 1996; p. 141. (In Chinese) [Google Scholar]
  53. Leng, P.; Yang, X.; Su, F.; Wu, B. Economic valuation of urban greenspace ecological benefits in Beijing city. J. Beijing Agric. Coll. 2004, 19, 25–28. (In Chinese) [Google Scholar]
  54. Chen, F.; Zhou, Z.; Xiao, R.; Wang, P.; Li, H.; Guo, E. Estimation of ecosystem services of urban green-land in the workshop area of the Wuhan Iron and Steel Company. Acta Ecol. Sin. 2006, 26, 2229–2236. (In Chinese) [Google Scholar]
  55. Zhang, W.; Zhang, F.; Yan, Z.; Zhang, Z. Initial analysis on the ecological service value of the greening land in Lanzhou city. Pratacult. Sci. 2006, 23, 98–102. (In Chinese) [Google Scholar]
  56. Rijtema, P.E. An Analysis of Actual Evapotranspiration; Pudoc: San Vicente, TX, USA, 1965. [Google Scholar]
  57. Hargreaves, G.H.; Allen, R.G. History and evaluation of Hargreaves evapotranspiration equation. J. Irrig. Drain. Eng. 2003, 129, 53–63. [Google Scholar] [CrossRef]
  58. Droogers, P.; Allen, R.G. Estimating reference evapotranspiration under inaccurate data conditions. Irrig. Drain. Syst. 2002, 16, 33–45. [Google Scholar] [CrossRef]
  59. Budyko, M.I. Climate and Life; Academic: San Diego, CA, USA, 1974; pp. 508–510. [Google Scholar]
  60. Gentine, P.; D’Odorico, P.; Lintner, B.R.; Sivandran, G.; Salvucci, G. Interdependence of climate, soil, and vegetation as constrained by the Budyko curve. Geophys. Res. Lett. 2012, 39, L19404. [Google Scholar] [CrossRef]
  61. Mattar, C.; Franch, B.; Sobrino, J.A.; Corbari, C.; Jiménez-Muñoz, J.C.; Olivera-Guerra, L.; Mancini, M. Impacts of the broadband albedo on actual evapotranspiration estimated by S-SEBI model over an agricultural area. Remote Sens. Environ. 2014, 147, 23–42. [Google Scholar] [CrossRef]
  62. Guiyang Open Government Data Platform. Available online: www.guanshanhu.gov.cn (accessed on 28 July 2022).
  63. Lu, S.; Tang, X.; Guan, X.; Qin, F.; Liu, X.; Zhang, D. The assessment of forest ecological security and its determining indicators: A case study of the Yangtze River Economic Belt in China. J. Environ. Manag. 2020, 258, 110048. [Google Scholar] [CrossRef]
  64. Fan, S. Construction of Circular Economy Ecological Urban Agglomeration in Urban History of Central Guizhou; Guizhou People’s Publishing House: Guiyang, China, 2015; pp. 12–16. [Google Scholar]
  65. Sharp, R.; Tallis, H.T.; Ricketts, T.; Guerry, A.; Wood, S.A.; Chapin-Kramer, R.; Nelson, E.; Ennaanay, D.; Wolny, S.; Olwero, N.; et al. InVEST 3.2.0 User’s Guide; The Natural Capital Project, Stanford University: Stanford, CA, USA; University of Minnesota: Minneapolis, MN, USA; The Nature Conservancy: Arlington County, VA, USA; World Wildlife Fund: Gland, Switzerland, 2015. [Google Scholar]
  66. Donohue, R.J.; Roderick, M.L.; McVicar, T.R. Roots, storms and soil pores: Incorporating key ecohydrological processes into Budyko’s hydrological model. J. Hydrol. 2012, 436, 35–50. [Google Scholar] [CrossRef]
  67. Zhang, C.; Li, W.; Zhang, B.; Liu, M. Water yield of Xitiaoxi River Basin based on INVEST modeling. J. Resour. Ecol. 2012, 3, 50–54. [Google Scholar]
  68. North, G.R.; Erukhimova, T.L. Atmospheric Thermodynamics: Elementary Physics and Chemistry; Cambridge University Press: Cambrige, UK, 2009. [Google Scholar]
  69. Yang, H. China’s Natural Forest Protection Program: Progress and Impacts; The Forestry Chronicle: Beijing, China, 2017; pp. 113–117. [Google Scholar]
  70. Wang, X.; Bennett, J. Policy analysis of the conversion of cropland to forest and grassland program in China. Environ. Econ. Policy Stud. 2008, 9, 119–143. [Google Scholar] [CrossRef]
  71. Gutiérrez Rodríguez, L.; Hogarth, N.J.; Zhou, W.; Xie, C.; Zhang, K.; Putzel, L. China’s conversion of cropland to forest program: A systematic review of the environmental and socioeconomic effects. Environ. Evid. 2016, 5, 21. [Google Scholar] [CrossRef]
  72. Jiang, Z.; Lian, Y.; Qin, X. Rocky desertification in Southwest China: Impacts, causes, and restoration. Earth-Sci. Rev. 2014, 132, 1–12. [Google Scholar] [CrossRef]
  73. Grimmond, C.S.B.; Oke, T.R. Turbulent heat fluxes in urban areas: Observations and a local-scale urban meteorological parameterization scheme (LUMPS). J. Appl. Meteorol. 2002, 41, 792–810. [Google Scholar] [CrossRef]
  74. Nowak, D.J.; Greenfield, E.J. Tree and impervious cover change in US cities. Urban For. Urban Green. 2012, 11, 21–30. [Google Scholar] [CrossRef]
  75. Li, X.; Li, W.; Middel, A.; Harlan, S.L.; Brazel, A.J.; Turner, B.L. Remote sensing of the surface urban heat island and land architecture in Phoenix, Arizona: Combined effects of land composition and configuration and cadastral-demographic-economic factors. Remote Sens. Environ. 2016, 174, 233–243. [Google Scholar] [CrossRef]
  76. Arnfield, A.J. Two decades of urban climate research: A review of turbulence, exchanges of energy and water, and the urban heat island. Int. J. Climatol. 2003, 23, 1–26. [Google Scholar] [CrossRef]
  77. Bonan, G.B. Forests and climate change: Forcings, feedbacks, and the climate benefits of forests. Science 2008, 320, 1444–1449. [Google Scholar] [CrossRef]
  78. Chapin, F.I.; Randerson, J.; McGuire, A.; Foley, J.; Field, C. Changing feedbacks in the climate–biosphere system. Front. Ecol. Environ. 2008, 6, 313–320. [Google Scholar] [CrossRef]
  79. Anderson-Teixeira, K.J.; Snyder, P.K.; Twine, T.E.; Cuadra, S.V.; Costa, M.H.; DeLucia, E.H. Climate-regulation services of natural and agricultural ecoregions of the Americas. Nat. Clim. Chang. 2012, 2, 177–181. [Google Scholar] [CrossRef]
  80. Pielke, R.A.; Marland, G.; Betts, R.A.; Chase, T.N.; Eastman, J.L.; Niles, J.O.; Niyogi, D.S.; Running, S.W. The influence of land-use changes and landscape dynamics on the climate system: Relevance to climate-change policy beyond the radiative effect of greenhouse gases. Philos. Trans. R. Soc. Lond. A 2002, 360, 1705–1719. [Google Scholar] [CrossRef] [PubMed]
  81. Loarie, S.R.; Lobell, D.B.; Asner, G.P.; Mu, Q.; Field, C.B. Direct impacts on local climate of sugar-cane expansion in Brazil. Nat. Clim. Chang. 2011, 1, 105–109. [Google Scholar] [CrossRef]
  82. Meir, P.; Cox, P.; Grace, J. The influence of terrestrial ecosystems on climate. Trends Ecol. Evol. 2006, 21, 254–260. [Google Scholar] [CrossRef] [PubMed]
  83. Foley, J.A.; Costa, M.H.; Delire, C.; Ramankutty, N.; Snyder, P. Green surprise? How terrestrial ecosystems could affect earth’s climate. Front. Ecol. Environ. 2003, 1, 38–44. [Google Scholar]
  84. Akbari, H.; Konopacki, S. Calculating energy-saving potentials of heat-island reduction strategies. Energy Policy 2005, 33, 721–756. [Google Scholar] [CrossRef]
  85. Akbari, H. Shade trees reduce building energy use and CO2 emissions from power plants. Environ. Pollut. 2002, 116, S119–S126. [Google Scholar] [CrossRef]
  86. Shuster, W.D.; Bonta, J.; Thurston, H.; Warnemuende, E.; Smith, D.R. Impacts of impervious surface on watershed hydrology: A review. Urban Water J. 2005, 2, 263–275. [Google Scholar] [CrossRef]
  87. Arnold, C.; Gibbons, J. Impervious surface coverage: The emergence of a key environmental indicator. J. Am. Plan. Assoc. 1996, 62, 243–258. [Google Scholar] [CrossRef]
  88. Oke, T.R. The micrometeorology of the urban forest. Philos. Trans. R. Soc. Lond. B 1989, 324, 335–349. [Google Scholar]
  89. Heisler, G.M.; Brazel, A.J. The urban physical environment: Temperature and urban heat islands. In Urban Ecosystem Ecology (Agronomy Monograph); Aitkenhead-Peterson, J., Volder, A., Eds.; Soil Science Society of America: Madison, WI, USA, 2010; pp. 29–56. [Google Scholar]
  90. Hoek van Dijke, A.J.; Herold, M.; Mallick, K.; Benedict, I.; Machwitz, M.; Schlerf, M.; Teuling, A.J. Shifts in regional water availability due to global tree restoration. Nat. Geosci. 2022, 15, 363–368. [Google Scholar] [CrossRef]
  91. Hutley, L.B.; O’Grady, A.P.; Eamus, D. Evapotranspiration from Eucalypt open-forest savanna of Northern Australia. Funct. Ecol. 2000, 14, 183–194. [Google Scholar] [CrossRef]
  92. Yin, H.; Li, C. Human impact on floods and flood disasters on the Yangtze River. Geomorphology 2001, 41, 105–109. [Google Scholar] [CrossRef]
Figure 1. Location and DEM of Guanshanhu District.
Sustainability 14 10022 g001
Figure 2. Remote sensing images of Guanshanhu District (a) Landsat TM image of Guanshanhu District in 2000 (b) Landsat ETM+ image of Guanshanhu District in 2010 (c) Gaofen2 image of Guanshanhu District in 2020.
Sustainability 14 10022 g002
Figure 3. The forest ecosystems climate regulation value calculating flowchart.
Sustainability 14 10022 g003
Figure 4. Spatial pattern of ecosystems in Guanshanhu District in 2020, 2010, and 2020.
Sustainability 14 10022 g004
Figure 5. Ecosystem structure of Guanshanhu District in 2000, 2010, and 2020.
Sustainability 14 10022 g005
Figure 6. Spatial pattern of forest ecosystem in Guanshanhu District in 2000, 2010, and 2020.
Sustainability 14 10022 g006
Figure 7. Distribution of actual annual evapotranspiration and its variation in 2000, 2010, and 2020.
Sustainability 14 10022 g007
Table 1. Forest ecosystem structure of Guanshanhu District in 2000, 2010, and 2020.
Forest TypesYear 2000Year 2010Year 2020
Area/haTotal Area
Ratio/%
Area/haTotal Area
Ratio/%
Area/haTotal Area
Ratio/%
Coniferous forest4690.5515.287466.2224.327322.3723.86
Broad-leaved forest2197.107.161193.913.891180.013.84
Coniferous and broad-leaved mixed forest86.970.28154.320.50165.420.54
Shrubs3775.4212.306299.8020.524173.6413.60
Other forest142.700.46457.661.491096.103.57
Total10,892.7435.4915,571.9050.7313,937.5445.41
Table 2. Statistics table of annual AET difference and its electric quantity.
Forest TypesYear 2000Year 2010Year 2020
E D / mm E Q / 10 8   kwh E D / mm E Q / 10 8   kwh E D / mm E Q / 10 8   kwh
Coniferous forest32.2010.2434.8117.6241.4220.56
Broad-leaved forest28.204.2030.232.4533.212.65
Coniferous and broad-leaved mixed forest31.340.1830.810.3336.190.41
Shrubs27.777.1128.7312.2732.219.11
Other forest23.720.2325.730.8031.332.33
Total 21.95 33.45 35.06
Note: E D : annual AET difference (mm); E Q : forest ecosystem regulating electricity (kwh).
Table 3. Statistics table of forest climate regulation value.
Forest TypesYear 2000Year 2010Year 2020
Per Unit Area Value/104 ¥ per haTotal Value/108 ¥Per Unit Area Value/104 ¥ per haTotal Value/108 ¥Per Unit Area Value/104 ¥ per haTotal Value/108 ¥
Coniferous forest8.734.108.906.6511.828.65
Broad-leaved forest7.641.687.710.929.421.11
Coniferous and broad-leaved mixed forest8.180.078.080.1210.340.17
Shrubs7.542.857.364.639.173.83
Other forest6.420.096.490.308.970.98
Average8.06 8.11 10.58
Total 8.78 12.62 14.75
Publisher’s Note: MDPI stays neutral with regard to jurisdictional claims in published maps and institutional affiliations.

