Article

A Game-Theoretic Approach to Design Solar Power Generation/Storage Microgrid System for the Community in China

1
School of Economics and Management, Guizhou Normal University, Guiyang 550003, China
2
School of Management, Shanghai University, Shanghai 200444, China
*
Author to whom correspondence should be addressed.
Sustainability 2022, 14(16), 10021; https://doi.org/10.3390/su141610021
Submission received: 8 July 2022 / Revised: 10 August 2022 / Accepted: 11 August 2022 / Published: 12 August 2022
(This article belongs to the Section Energy Sustainability)

Abstract

:
The utilization of solar power generation/storage microgrid systems has become an important approach, transforming the energy structure of China in order to achieve the emission peak and carbon neutrality. Meanwhile, the commercialization of household photovoltaic (PV) systems is also at the transitional period between its beginning to its maturity. This study considers developers intending to invest in building community microgrids with the concept of sustainable development, and focuses on the relationship between the developers and residential users. Firstly, an operation framework considering the autonomous behavior patterns of stakeholders is proposed. Then, a two-level mathematical programming model based on the leader–follower game is established in this paper. In the upper level, the developer decides the capacity size and the system price of the microgrid system in order to maximize profit. In the lower level, the residential users in the community optimize their power consumption behaviors in the microgrid system taking into account both benefit and fairness. They need to decide whether to support the construction of a microgrid system by comparing their electricity bills before and after participating in a microgrid system. Through solving the model and analyzing the relationship between the two sides of the game, it can be seen that only by designing the optimal system configuration and coordinating with weather conditions in terms of better sunshine intensity can the developer and all kinds of users benefit from the project under the current market data. Meanwhile, the users with higher power consumption benefit more from the microgrid system among different types of residents. Under the market structure dominated by developer, the government’s PV subsidy will greatly increase the revenue of system developer. However, it does not increase the installed capacity of system, nor does it bring more benefits to residential users. Moreover, compared with the independent operation mode, the centralized management mode can bring more benefits to both sides and encourage the developer to build larger installations.

1. Introduction

1.1. Background

To promote the innovation and the application of low-carbon technologies, China has released a series of relevant support policies to boost the scale of China’s installed photovoltaic (PV) power generation capacity to reach first place worldwide [1]. Over recent years, the implementation of household distributed PV power systems in China has not matched up to what was anticipated, in contrast to the rapid development of centralized PV stations [2]. The main reason is the low generation efficiency caused by the inherent intermittency and randomness of PV power generation, which leads to a significantly high usage cost of energy storage facilities.
Since the 1980s, urban communities in China have been managed mainly by community residents, uniting various social organizations in the community to jointly participate in the management of community affairs. A number of governmental actions in cities have been gradually transformed into autonomous actions of the public in contemporary society. Furthermore, the community resident committees for self-management have been developed in many urban communities. Residents elect representatives of community members to discuss and deliberate on important affairs in the community, forming a community residents’ self-governance system focusing on democratic elections, democratic decision making, and democratic management [3]. Taking Shanghai as an example, there are currently 4628 community resident committees and about 13,000 residential communities in the city. The size of these communities varies from hundreds and thousands to tens of thousands of people depending on the type of house and design. The largest residential community holds up to 100,000 residents. Moreover, the city’s residential electricity consumption in Shanghai reaches 27.797 billion kWh annually, with an average annual consumer domestic electricity consumption of 2655.72 kWh/year per household. Figure 1 shows a low carbon community installed in Shanghai and displays the basic spatial distribution of the residential solar power system.
On the other side, different regions in China charge different tariffs for residential electricity consumption. The Guangdong region differentiates between tariffs in summer and non-summer. Districts such as Shanghai and Zhejiang adopted a step-by-step time-of-use tariff. There are also areas, such as Tibet, that directly use fixed tariffs. Therefore, deploying the solar power generation/storage microgrid system and designing a fair distribution mechanism of profit and a commercial operation strategy are of practical significance to popularize the application of renewable energy in the construction of new communities or the renovation of old communities. It can help facilitate the emission peak and achieve carbon neutrality as early as possible.

1.2. Literature Review

The academic research in the field of the microgrid has been accelerated in recent years. Studies related to this article can be mainly divided into three categories. The first type regards the microgrid system as an individual entity and examines the interest relationship of the microgrid when it is involved in electricity trading in external electricity markets. Manshadi & Khodayar (2016) [4] proposed a power market hierarchy that had the microgrid compete in the distribution market through introducing load aggregators, and applied the game equilibrium model to examine the behavior of each market participant. Fang et al. (2020) [5] presented a multi-intelligent microgrid model with an auction-based electricity market to ensure the efficiency of the microgrid whilst balancing the interests of market competitors. A two-stage energy management model was conducted by Wang et al. (2018) [6]; the mean–variance Markowitz theory was applied to assess the cost risk of microgrid operations in the first stage, and the balance of the electricity market was maintained to the maximum extent in the second stage. Huang et al. (2018) [7] considered the impact of power exchange among microgrids on the life-cycle cost of each microgrid, and proved that the suggested optimal size based on the collaborative operation can improve the economic efficiency. Ju et al. (2021) [8] designed a three-stage optimization model with multiple game states for the optimization problem of micro energy grids bidding against utility energy grids. Mohammadi et al. (2012) [9] considered the entire microgrid as an agent to incorporate a bidding process into the distribution grid electricity market, and conducted a comparative analysis of operating results under two different tariff determination mechanisms. Akbary et al. (2019) [10] proposed a reserve pricing scheme to provide all market participants with the appropriate signals to modify their offers according to the system operator requirements. Ghadimi et al. (2018) [11] proposed a two-stage forecast engine with a feature selection technique for electricity load forecasting. The master–slave game method is adopted to explore the energy trading problem in a multi-level integrated power system that consists of multiple energy suppliers and end users [12,13,14]. Apparently, the above literature concentrates on energy trading mechanisms that maximize the benefits of the microgrid and external multi-stakeholders; however, competition and cooperation among users in the microgrid are not considered.
The second category of the related literature focuses on the microgrid itself to achieve stability in the economy at the system level. The energy storage inverter control model is considered as the core to maintain the transient stability of the microgrid in the disturbance of island mode [15]. Zhao et al. (2013) [16] optimized the parameters of energy storage devices during microgrid operation and analyzed the economic operation scheme of the microgrid under the specified energy storage charging and discharging strategy. Chen et al. (2019) [17] investigated the impact of stochastic prediction errors on the operational stability of energy storage systems from the state of charge perspective and proposed a new model for the propagation and accumulation of stochastic prediction errors. Grover et al. (2018) [18] and Wang et al. (2018) [19] evaluated the impact of environmental factors and demand response on distributed generation technology to optimize the operating costs of microgrids. Tushar et al. (2015) [20] presented a distributed real-time power allocation scheme based on a non-cooperative game to tackle the high intermittency of energy and the unpredictability of electric vehicles within the microgrid. Furthermore, Zamani et al. (2016) [21] proposed a virtual power plant formed by a virtual demand response integrator and generators, using forecast data for day-ahead dispatch and making time forward dispatch correction based on actual occurrence data. In terms of research on the impact of energy storage technology within the microgrid, Wang et al. (2019) [22] and Kalavani et al. (2019) [23] confirmed that an appropriate scheduling of energy storage systems allowed for a significant reduction in the operating costs of the microgrid system. Zhao et al. (2018) [24] used cooperative games to reduce the risk of outages in microgrids as well as to raise economic revenue. Moreover, it was stated that the scale and the extent of the driving force of electricity trading between microgrids and external entities were considerably below the degree of trading among users within the microgrid [25]. In the research on electrical energy trading within microgrids, Long et al. (2018) [26] established a multi-stage incentive model for microgrid program development to pursue optimal government subsidies and optimal cooperation incentives for energy suppliers. Lastly, Dehghani et al. (2021) [27] proposed a secured policy architecture based on the block-chain to keep the security of the data exchanged among distributed generation agents.
The last category of the literature focuses on the load control strategies for smart households. Zhang et al. (2015) [28] put forward a smart community consisting of power generation, battery energy storage, electric vehicles, and smart home appliances, and developed a mixed-integer linear programming model to minimize the cost in accordance with the short-time predicted values of new energy generation. He et al. (2021) [29] proposed an electricity–hydrogen hybrid power sharing system and simulated the smart tides of vehicle grid interaction and electrolytic cells to further enable seasonal stability and annual cost savings of the grid. Wang et al. (2018) [30] employed a robust optimization approach to build a household load scheduling model that provides customers with complete robust scheduling while accounting for uncertain parameter disturbances. Samedi et al. (2014) [31] developed an optimization strategy of single user power consumption behavior based on the goal of minimizing the electricity consumption cost of community users. On the contrary, Alilou et al. (2020) [32] addressed the issue of the joint scheduling of electricity consumption behaviors in a smart community with multiple individual users, assuming that all users were intelligent entities who could automatically respond in accordance with electricity prices. Moreover, to achieve the overall optimization of the user’s electric vehicles, Olsen et al. (2018) [33] suggested a household energy management system capable of extending the life of transformers and reducing the operating cost of the distribution network; Sarker et al. (2017) [34] advanced a centralized smart charging strategy for household loads to reduce transformer aging; Ma et al. (2021) [35] developed an incentive demand response model for loads under a power constraint and a demand response constraint to minimize the customer’s electricity consumption cost and the power fluctuation of electricity purchase. Furthermore, Wang et al. (2015) [36] raised a robust index approach to address uncertainty challenges caused by customer behavior in order to minimize the comfort conflicts within household load scheduling. Additionally, Khodaei et al. (2018) [37] used the optimization technique to minimize electrical power consumption for the industrial sector with renewable sources.

1.3. Motivations and Main Contributions

The majority of the above studies regard the microgrid as a single entity competing in the market, and lack any investigation into the interest relationship among users inside the microgrid. Additionally, the listed studies about users’ electricity loads mainly regard users’ households as the aggregation of smart appliances for joint scheduling, without considering the impact of users’ subjective behavior as human beings on the overall system. Hence, we intend to investigate the benefit/cost of different participants in the real application of the microgrid system in a community in China.
The main contributions are shown as follows.
(1)
This paper emphasizes the individual preferences and electricity consumption behaviors of different users. Then, the business mode and the operation strategy of the microgrid system are shown from two perspectives, the developer and community users. Therefore, it can enable all stakeholders to proactively support the construction of the microgrid project and the operation of low carbon communities.
(2)
A mathematical model is established for the game between the developer and community users. Particularly, the detailed measurements of community users are expressed with formulas for the first time, including the pricing module, demand response module, and electricity expenditure module.
(3)
Different scenarios with real data are analyzed and compared in numerical experiments. The conclusions are not only useful for the developers and residential users in different locations, but also can provide support for policy makers in the government when promoting the development of the PV industry.

1.4. Paper Structure

The rest of the paper is structured as follows. Section 2 outlines the core stakeholders, vital element combinations, and subsequent mechanisms of the microgrid. Section 3 establishes relevant models to characterize the operation of the microgrid. Section 4 analyzes case studies in various scenarios to show the key factors impacting the system performance. Section 5 further discusses the remarkable conflicts and difficulties in developing a community microgrid. Finally, the conclusions and future works are presented in Section 6.

2. Problem Description

2.1. Problem Formulation

This subsection firstly outlines the specific configuration of the solar power generation/storage microgrid system in community, which is illustrated in Figure 2. The microgrid system built by the community developer consists of a distributed photovoltaic power generation system (PV system) and an energy storage system, including PV arrays, PV controllers, inverters, storage batteries, AC distribution cabinets, and PV mounts. In terms of the reality of community life, this study adopts one PV system with a direct grid connection on the user side, which is connected to the grid of a lower voltage level and does not feed into a high-voltage grid. The surplus power generated by the PV system is stored locally instead of sinking into the external grid in order to avoid causing the disturbance to the public grid. Nonetheless, considering the inherent intermittency and randomness of PV power generation, the microgrid system designed in this paper remains the interface to the external public grid for supplying electricity to residents in order to ensure that the residents’ electricity demand can always be fulfilled at all times.
This study takes the developer with the mission of building low-carbon communities and community users with potential purchase intentions as the research objects. Instead of investigating the technical problems about the hardware of whole system, we intend to explore the design of the configuration from the system level and focus on the benefit/cost analysis from an economic aspect. Note that the capital of the community microgrid is a commercial behavior between a company and the residential users. Thus, it is necessary to analyze the commercial operation strategy of solar power generation/the storage microgrid system, which in essence is to study the transaction problem and the later operation mechanism between the community developer and residential users.
The core of establishing an effective and pervasive business pattern for a community microgrid is developing a fundamental comprehension of how each of its components and models fit together. Therefore, the problem studied in this paper contains two critical aspects. One is the developer, who is interested in how much money needs to be invested and how to earn profit from this project. The other is residential users, who are interested in how much benefit can be obtained from this project and how the generated solar power can be allocated fairly among the users. The detailed formulation for each side is shown as follows.
The calculation of the initial capital cost of the microgrid system is essential for the developer. Given that the components of the microgrid have a coupling relationship, two core variables are the most important in determining the capital cost: the installed size of the PV system ( N PV ) and the size of the battery ( N B ). It means that the capital cost can be derived if these two variables are determined, which is shown in detail in Section 3.1. Then, after the facilities of the microgrid system are completed, the developer achieves profitability by charging a selling price P f for the microgrid system. On one hand, this price is required to at least cover the construction cost of the microgrid system. On the other hand, considering that the devices of the microgrid are public facilities of the community, it is necessary to guarantee that all residents in the community would be willing to participate in the project so as to avoid conflicts among residents.
Once the microgrid system is sold to the residential users, the property rights of the microgrid will be shifted to its residential users. The community resident committee is elected among users to operate their own utilities. To centrally schedule the customer demand for PV power generation, the community resident committee distributes PV power generation equally based on the overall residential electricity demand and total PV power generation during each time period. Users pay fees to the community resident committee according to their PV electricity consumption; at the end of the year, the community resident committee distributes the surplus funds to residential users equally in the form of dividends after paying maintenance expenses. Moreover, the committee sets flexible real-time PV tariffs to guide users’ electricity consumption behaviors, aiming at enhancing the utilization of PV power on one side and reducing users’ electricity consumption costs on the other side. Finally, the individual user will compare electricity costs before and after participating in the microgrid so as to decide whether to support the project or not. The detailed calculations for residential users are shown in Section 3.2.

2.2. Game between Two Sides

From the above analysis, we find that the model of the developer and the model of the residential users are correlated. The developer prefers a smaller sized system and a higher selling price to increase the profit margin. However, this will be harmful to the residential users’ benefit and reduce the approval rating of the residents. Therefore, the transaction is actually a game between the two sides. Since the community developer is surprisingly strong in China, the relationship between the developer and users forms a leader–follower landscape in the master–slave game.
It is necessary to find a pragmatic solution to unify the transaction issue of microgrid systems and the design of subsequent operation mechanisms. Then, a bi-level mathematical programming model based on a master–slave game is established. In the upper level, the developer acting as game master bears the construction expense of the microgrid system, and determines the price and the installation scale of the microgrid system with the aim of maximizing profit. In the lower level, residential users decide whether to be involved in the microgrid project by assessing the difference in electricity costs before and after participating in the microgrid project.
The community microgrid can only be installed successfully if a Nash equilibrium point in the game can be obtained, in which both two sides are profitable. In order to search for this point, we need to solve the corresponding mathematical model to find the optimal solution. Consequently, the solution approach obtains residential users’ decision information by resolving the lower-level model and reflects it back to the upper-level model, then finds the optimal scale of the microgrid system and the highest selling price of the system for the developer.

3. Mathematical Model

3.1. The Upper-Level Optimization Model

In order to fulfill the goal of maximizing total profit, the developer has to determine a reasonable selling price and an optimal installation scale of solar power generation/the storage microgrid system. Meanwhile, it is necessary for the developer to attract as many users as possible to participate in the microgrid project. There are three decision variables in the upper-level model, including the installation scale of the PV system N PV , the installation scale of the battery N B , and the selling price of the microgrid system P f (per unit). The values of these three decision variables not only directly determine the construction expenditures and the developer’s total profit, but also influence the number of customers who decide to join in the microgrid project. Additionally, two 0–1 variables are set to reflect the information of users’ decisions. y k = 1 when the user k chooses to pay P f ; otherwise, y k = 0 . y = 1 when all users are willing to pay for joining in the microgrid project; otherwise, y = 0 . The mathematical description of the upper-layer optimization model is expressed as follows.
Max   P R = y × ( P f × n ) C T o t a l
s . t .   y y k , 1 k n
y k = g ( P f , N PV , N B )
y , y k = 0 / 1
Equation (1) denotes the objective function of the upper-level model, in which P R represents the developer’s profit from building the microgrid project, n denotes the total number of residential users, and C T o t a l denotes the total construction cost of project. Equations (2) and (4) indicate that the project is invalidated as long as one user declines to join. Equation (3) represents the mapping relationship of users’ decision information that feeds back to the upper-level model after solving the lower-level optimization model.
The cost of building microgrid project C T o t a l is divided into two parts: cost of the PV system and cost of the energy storage system (mainly consisting of storage batteries). The cost of each component is calculated in different ways since the quantity of inverters depends on the number of households and the installed scale of PV arrays hinges on the scale of the microgrid system’s construction. Further, each single component in the microgrid system needs to be matched with each other in terms of type and specification so as to maintain the feasibility and stability of the system operation. Given that, the construction cost of the microgrid project is calculated as shown in Equations (5)–(11).
C T o t a l = C PV + C inv + C SE + C B + C AF + C PVC
C PV = N PV × p PV
C inv = n × p inv
C SE = n × p SE , AC
C B = N B × p B
C AF = p AF , 1 × N PV + p AF , 2 × n + p AF , 3 × n × [ N PV / ( N PV u n i t × n ) 1 ]
C PVC = p PVC × n
Equation (5) shows the segmentation of C T o t a l , covering the cost of PV power arrays, inverters, PV controllers, distribution cabinets, batteries and PV accessories. Equation (6) represents the cost of PV array C PV , in which p PV represents the unit price of the PV array. C inv in Equation (7) is the inverter cost and p inv denotes the unit price of the inverter. Equation (8) indicates the cost of distribution equipment C SE , in which p SE , AC is the unit cost of AC distribution cabinet. Equation (9) states the cost of energy storage system C B that is determined by the storage battery’s capacity, in which p B means the unit cost of the storage battery. Equation (10) refers to the cost of ancillary facilities C AF , which is divided into three main categories. p AF , 1 denotes the cost of accessories which depends on PV system’s installed capacity, p AF , 2 denotes the cost of accessories determined by the number of users, p AF , 3 denotes the cost of connecting wires among the PV panels, and N PV u n i t denotes the monolithic power of the PV panels. Equation (11) refers to the cost of the PV controller, in which p PVC represents the unit cost of the PV controller.

3.2. The Lower-Level Optimization Model

In the lower-level optimization model, the selling price and the installation scale of the microgrid system are considered as known parameters. Then, users need to make two decisions: (a) by comparing the net present value of electricity expenses before and after engaging in the microgrid system, users have to judge whether to join the project; (b) users choosing to participate in the microgrid system are motivated by the PV tariff to engage in demand response activities and optimize their daily electricity consumption behaviors. Additionally, the planning horizon of the PV system in the proposed implementation is a 25 year lifetime. As a result, the inner-layer optimization model can be expressed as Equations (12)–(15).
y k = g ( P f , N PV , N B ) = { 1 , N P V k S o l a r < N P V k 0 , N P V k S o l a r N P V k
N P V k = l = 1 25 C k FC ( 1 + η r a t e ) l
N P V k S o l a r = l = 1 25 C k l ( 1 + η r a t e ) l + P f
C k FC = ( i = 1 24 D i k × P FR i ) * 365
Equation (12) denotes the decision whether user k pays to participate in the microgrid system. In Equation (13), N P V k is defined as the net present value of electricity consumption expenditure over the whole lifetime of the project if user k does not join in the microgrid project. At this time, all the domestic electricity demanded by user k is acquired from the public grid with an annual average electricity payment C k FC . In Equation (14), N P V k S o l a r refers to the net present value of electricity consumption expenditure over 25 years after user k takes part in the microgrid project, in which the electricity consumption cost C k l paid at the end of each year and the current selling price of microgrid system P f are necessary to be calculated. Moreover, η r a t e illustrates the average annual discount rate for the following 25 years. From Equation (12), it can be seen that user k will be willing to pay for the microgrid project only when N P V k S o l a r < N P V k . Conversely, user k will not consider paying for the microgrid project.
Since the usage of PV generation is not involved, Equation (15) directly deduces the calculation process of C k FC . D i k refers to the electricity demand per day when user k is not involved in the microgrid program, and P FR i denotes the real-time electricity tariff from the public grid. Because it involves daily operation of the microgrid, the electricity expense paid by customer k at the end of each year C k l in Equation (14) needs to be derived through the integrated modelling of the following three sub-modules.

3.2.1. PV Power Generation Pricing Sub-Module

According to the daily scale of solar power generation, local PV feed-in tariffs and real-time electricity tariffs of the public grid, the community resident committee sets flexible PV tariffs for each time period of the following day to promote the utilization of solar generated power in time. Users adjust their electricity acquisition strategy and consumption behavior on the following day in response to PV tariffs, consequently shifting the usage of flexible loads to time periods with lower electricity prices. Moreover, a time interval of hours is applied in this study. Set i = 1 , 2 , , 24 ( h ) ; j = 1 , 2 , , 365 ( d a y ) .
Since the intensity of solar radiation exhibits some variation across the day, consequent fluctuations of PV power generation in the microgrid will occur. Therefore, the principles for designing PV tariffs are as follows.
  • Principle I: PV electricity prices at any given time should be lower than the benchmark electricity prices of the local public grid (the price of household electricity P FR i ).
  • Principle II: The PV electricity tariff in any time period should be lower than the local PV feed-in tariff p s e l l .
  • Principle III: The PV electricity price is lower during the time period when more solar power is generated.
Based on above principles, the mathematical description of the PV power generation pricing sub-module is as follows.
E i , j , l = P PV i , j , l × Δ t = ρ × η DCAC × r a d i , j r a d stc × N PV × ( η ) l × Δ t ; i , j , l
P RT i , j , l = M a x { M i n { p s e l l , P FR i } η e i × ( E i , j , l / E avg j , l ) , 0 }
In Equation (16), the total amount of the microgrid’s PV power generation per unit time period E i , j , l is established as a linear function of the actual solar radiation intensity r a d i , j , PV system scale N PV , inverter efficiency η DCAC , and deteriorating coefficient ρ . P PV i , j , l is the overall real-time PV generated power output of the microgrid system. Δ t is the period step. r a d i , j represents the actual solar radiation intensity at each time in a typical meteorological year; r a d stc is the radiation intensity in each period under the standard condition. η denotes the attenuation of the electricity generation performance of the PV module during usage. Equation (17) shows the calculation of PV tariffs within the community, in which E avg j , l is the average power generation per hour and η e i is the decline coefficient which represents the price reduction in electricity based on the smaller one between p s e l l and P FR i .

3.2.2. Demand Response Sub-Module

This study considers two types of household loads, namely fixed loads and flexible loads. Flexible loads can be subdivided into reducible loads and shifting loads. Specifically, type A refers to fixed loads that must keep running independent of price (e.g., computers, hair dryers, refrigerators, lights, microwave ovens, TV sets); type B refers to shifting loads that are highly influenced by the electricity prices and can be adjusted for the time (e.g., rice cookers, washing machines, etc., in which the total amount of electricity used within the day remains constant); type C refers to variable loads that can be adjusted for the amount of electricity consumed during a fixed usage period, such as fans and air conditioners. The electricity demand of customers is expressed as follows.
D i , j , l = k = 1 n D i , j , l k = k = 1 n ( D i , j , l k , A + D i , j , l k , B + D i , j , l k , C )
In Equation (18), D i , j , l k denotes the electricity requirement in each time period of user k, which comprises the electricity requirement of various kinds of domestic loads ( D i , j , l k , A , D i , j , l k , B , D i , j , l k , C ). D i , j , l represents the overall electricity demand of the community with n customer households in each time period.
Additionally, in the demand response mechanism of this study, the usage time of household flexible loads is driven by P RT i , j , l only. The usage time of shifted loads B is moved to the time period with the lowest average PV tariff during the respective usage time. The electricity consumption of variable loads C is determined by the relationship between P RT i , j , l and the public grid tariff, which is shown as D i , j , l k , C = D i , j , l k , C _ M a x × ( α + β × P FR i P RT i , j , l P FR i ) , in which D i , j , l k , C _ M a x refers to the electricity demand of variable loads C without the consideration of the demand response. α + β = 1 , in which α and β denote the coefficients for adjusting the customer’s comfort and the economy of electricity consumption, respectively. Fixed loads A are not affected by the PV tariff.

3.2.3. Residential Users’ Electricity Expenditure Sub-Module

This sub-module calculates users’ annual electricity consumption expenditure based on their electricity demand, the microgrid system’s generation capacity, and the energy storage level for each time period after users participating in demand response. Since PV tariffs are kept under a lower level than the public grid tariff at any time, residential users have priority when using solar generated power. Thus, it is necessary to discuss whether the total amount of electricity generated by the microgrid system can satisfy users’ electricity demand; if not, it is vital for users to acquire electricity from the public grid. Further, the electricity produced and used by each customer’s household PV system is not independent, but coordinated and dispatched by the committee. When the total amount of PV power generation E i , j , l plus battery storage level at the beginning stage S i , j , l is smaller than the total demand for electricity from users D i , j , l , the demand for electricity generated by PV system from customers is regulated uniformly and fairly by setting PV power usage coefficient θ i , j , l .
θ i , j , l = S i , j , l + E i , j , l D i , j , l × 100 %
The community resident committee distributes all the electricity generated by the PV system to each customer equally and proportionally in accordance with θ i , j , l . The formulas for calculating the daily electricity consumption expenditure of customer k, the amount of PV power usage, and the amount of electricity purchased from the public grid are as follows.
D i , j , l k , s o l a r = { D i , j , l k × θ i , j , l , S i , j , l + E i , j , l < D i , j , l D i , j , l k , S i , j , l + E i , j , l D i , j , l
D i , j , l k , MG = { D i , j , l k × ( 1 θ i , j , l ) , S i , j , l + E i , j , l < D i , j , l 0 , S i , j , l + E i , j , l D i , j , l
Equations (20) and (21) represent the calculation of the amount of PV power used by user k and the amount of electricity acquired from the public grid. When S i , j , l + E i , j , l < D i , j , l , the amount of PV power allocated to customer k is D i , j , l k × θ i , j , l , which cannot cover user k’s own electricity needs. At this moment, user k needs to purchase electricity from the public grid with the electricity purchased amount D i , j , l k , MG = D i , j , l k × ( 1 θ i , j , l ) . When S i , j , l + E i , j , l D i , j , l , there is no need for users to purchase electricity from the public grid; at this point, user k’s share of PV generated power is D i , j , l k .
According to the above operational framework, the annual electricity expenditure of each customer C l k is expressed in the following formulas.
P s l = { j = 1 365 i = 1 24 k = 1 n D i , j , l k , s o l a r × P RT i , j , l N PV × P f i x PV N B × p B , l = l B , 2 * l B , j = 1 365 i = 1 24 k = 1 n D i , j , l k , s o l a r × P RT i , j , l N PV × P f i x PV , e l s e
C l k = j = 1 365 i = 1 24 ( D i , j , l k , s o l a r × P RT i , j , l + D i , j , l k , MG × P FR i ) ( P s l / n ) , l = 1 , 2 , , 25
In Equation (22), P s l denotes the overall pool size for annual subsidies and P f i x PV represents the unit maintenance cost of the PV system. Moreover, when the time period approaches k × l B , k = 1 , 2 , 3 ... , it means that the storage battery has reached its service life and requires replacement. In Equation (23), C l k equals to the sum of the PV electricity bill paid to the community resident committee (first term) and the cost of purchasing electricity from the public grid (second term), minus the dividend distributed equally by the community at the end of the year (third term). Moreover, the recursive equation of the initial energy storage level (electrical energy balance constraint) is shown as follows.
S i , j , l = min { max { S i 1 , j , l + E i 1 , j , l D i 1 , j , l , 0 } , N B }

4. Numerical Analysis

For the sake of maximizing the developer’s profit, all of the case studies listed in Section 4 were implemented in Visual Studio Community 2019 software to conduct computational simulations. Table 1 shows the key parameter settings with corresponding data sources used in numerical experiments, whilst the rest of the parameters and market prices of the microgrid system’s components are displayed in Appendix A. Specifically, to ensure an adequate capacity of the PV system for each household, the residential community adopted in this paper is designed as a type of row house with low floors and few households, based on the average size of residential communities in Shanghai. Therefore, the number of users in a newly built residential community is set to 200, in which each household represents one unit of residential users. Further, Figure 3 shows the level of daily radiation in the Shanghai area, and the data for this graph were derived from the US National Renewable Energy Laboratory database and the US National Solar Radiation Database.

4.1. Scenario I—Residential Community in Shanghai

The first scenario uses a new residential community in Shanghai to analyze the application of the business mode and operation mechanism established in Section 3.
The optimal solution is obtained within the setting interval of decision variables, and the results are given in Table 2. The optimal selling price of the microgrid system is CNY 12,088.59 per household, and developer’s overall profit under this selling price reaches CNY 1,080,000 with a profit margin of 44.67%. The optimal installed scale of the PV system and the battery capacity for each household are 1.4 kWp and 216.67 Ah on average, respectively (the battery output voltage in this paper is set to 12V, thus, 216.67 Ah × 12 V/1000 = 2.6 kWh). The average benefit to the user is CNY 4552.33 (user’s benefit = N P V k S o l a r N P V k , which refers to the net present value of electricity expenses that can be saved), and the average user return ratio (average user’s benefit/single household selling price of the microgrid system) approaches 37.66%.
In this paper, the variability among households is expressed by setting random numbers for the power-saving coefficient and family members. Therefore, the benefits of participation in the microgrid project may differ for distinct user groups. In Table 3, it is apparent that customers with more family members and higher electricity demand gain more benefits from joining the microgrid project. Similar findings are also reflected in Table 4. These findings can be mainly attributed to the pricing principles; the internal community PV tariffs were set to stay lower than the public grid tariff at all times. Although this paper has already enhanced fairness by setting PV usage factors to equally divide users’ demand for PV-generated electricity and by restricting the occurrence of excessively low PV tariffs, the situation still remains that the more customers use PV, the more they benefit.

4.2. Scenario II—Residential Community in Shanghai with PV Subsidies in Consideration

The second scenario considers a residential microgrid project that receives PV subsidies. Meanwhile, this case study maintains the rest factors and mechanisms consistent with Section 4.1. The subsidy for residential PV power used in scenario ΙΙ originates from the local subsidy policy in Shanghai. For each kWh of PV power produced by user, the community is considered as an entire entity to receive the PV subsidy of CNY 0.4/kWh [49], then it is equally distributed to each user. In other words, in order to raise the utilization rate of solar-generated electricity, this paper calculates the subsidy from the perspective of electricity usage rather than the perspective of generation.
The optimal solutions obtained from data experiment are as follows. The optimal selling price of the microgrid system is CNY 17,280.10 per household, and the overall profit of developer at this selling price reaches CNY 1760,000 with a profit margin of 50.90%. The optimal installed scale of the PV system and battery capacity for each household are 1.8 kWp and 316.67 Ah, respectively. The average benefit of user is CNY 5052.16, and the average user return ratio is 29.24%. Table 5 compares the numerical experimental results of this scenario with those of Section 4.1. In contrast to Section 4.1, the optimal values of almost all the listed indexes in this case are significantly improved except the average user return ratio, which exhibits a lower level. The decline in user’s yield originates from the fact that N P V k stays constant, while N P V k S o l a r shows a sharp increase with the raise in selling price of the microgrid system. Apparently, the developer acting as the master in master–slave gambling gains the majority of the PV subsidy benefit, whereas residential users receive less benefit from the subsidy.

4.3. Scenario III—Independent Operation of Each User

The third scenario considers that users’ microgrid systems are no longer centrally operated, but rather are small, independent, household-distributed self-generation entities for each resident. Thus, there is no game relationship among residents. In this scenario, the community resident committee continues to formulate PV tariffs and to use price incentives to engage users in the demand response. After joining in the microgrid project, each user consumes his own PV-generated electricity without sending the surplus electricity online, and then pays an annual fee to maintain the microgrid. At this point, the committee no longer separates PV electricity fairly, and users no longer pay PV electricity bills to the community resident committee. Thus, the internal PV tariffs only work as a price signal to induce users’ electricity consumption in the demand response activities.
The results in this scenario are as follows. The optimal selling price of microgrid system is CNY 10,171.84 per household, and the overall profit of developer at this selling price reaches CNY 1,000,000 with a profit margin of 49.16%. The optimal installed scale of the PV system and the battery capacity for each household are 1.0 kWp and 166.67 Ah, respectively. Moreover, the average benefit of user is CNY 3940.98, and the average user return ratio is 38.74%.
The comparison of the results in scenario ΙΙΙ with those in Section 4.1 is shown in Table 6. It is noticeable that microgrid’s installed scale in the independent operation mechanism of each user is reduced compared to the centralized management mechanism in Section 4.1, and the optimal selling price of microgrid system, developer’s profit, and users’ revenue also decline dramatically. The main reason is the solar power generated by PV system cannot be shared among different users, making the demand for the size of PV power system smaller for users with fewer family members and less electricity consumption.

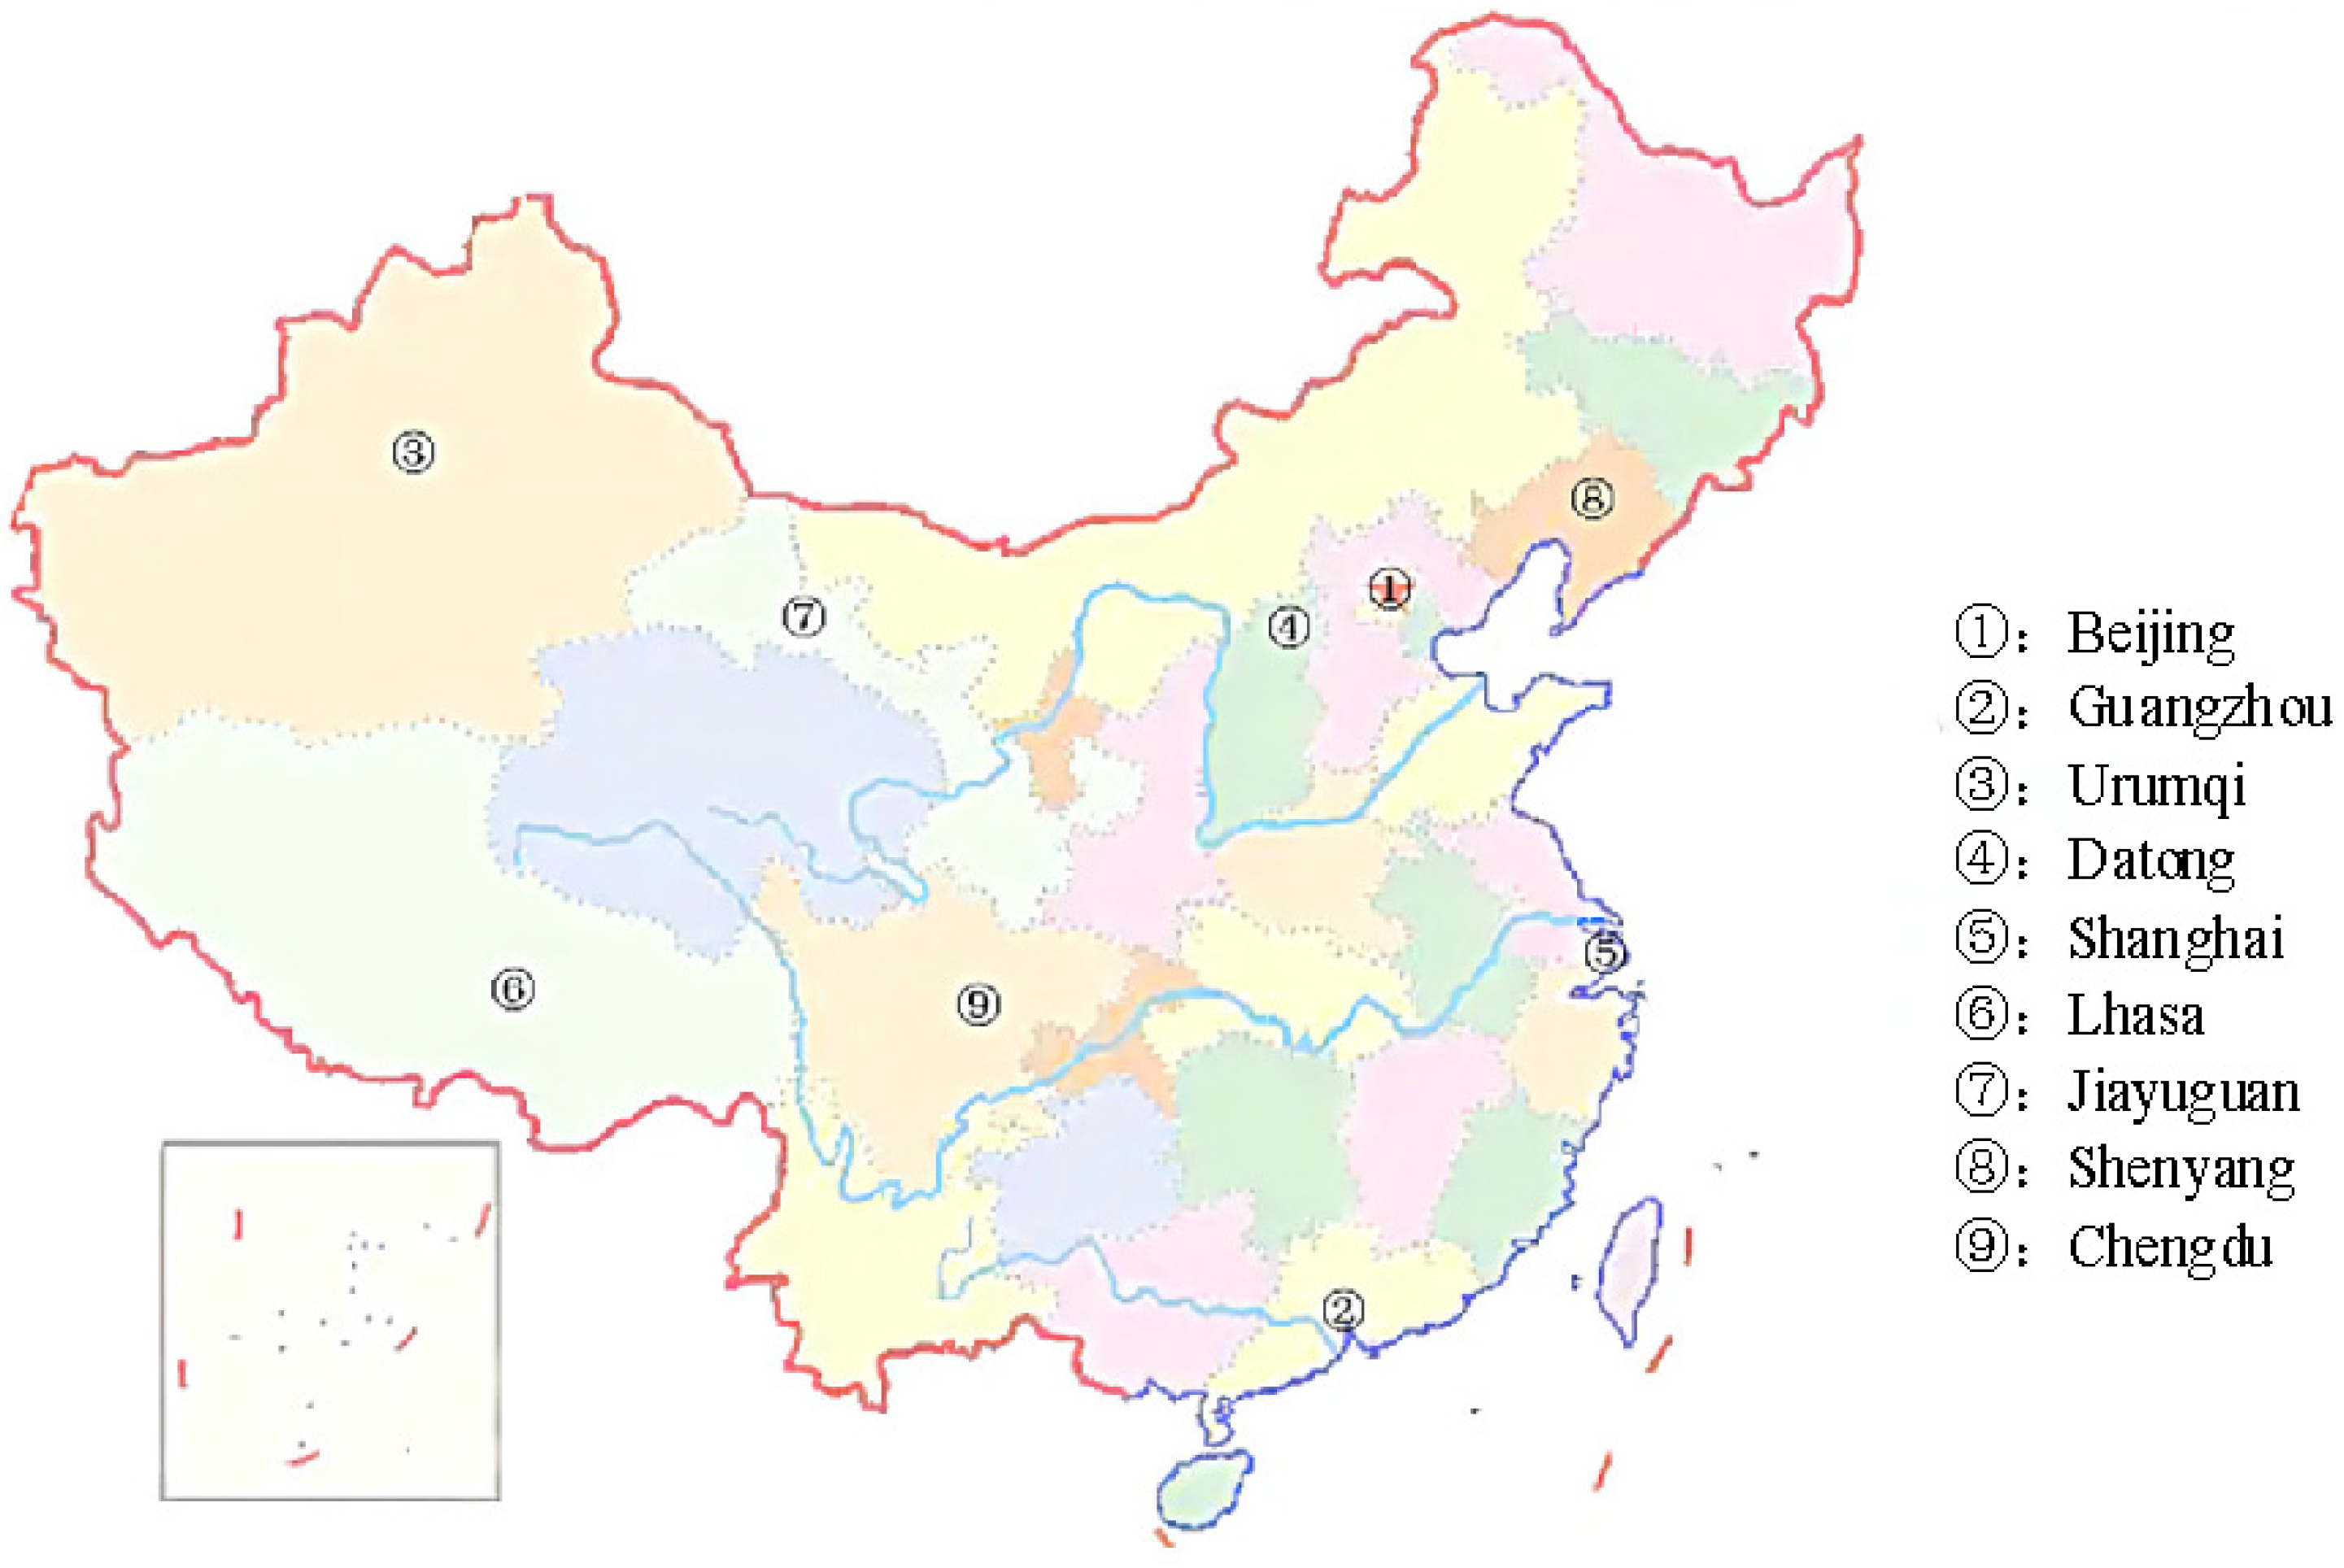
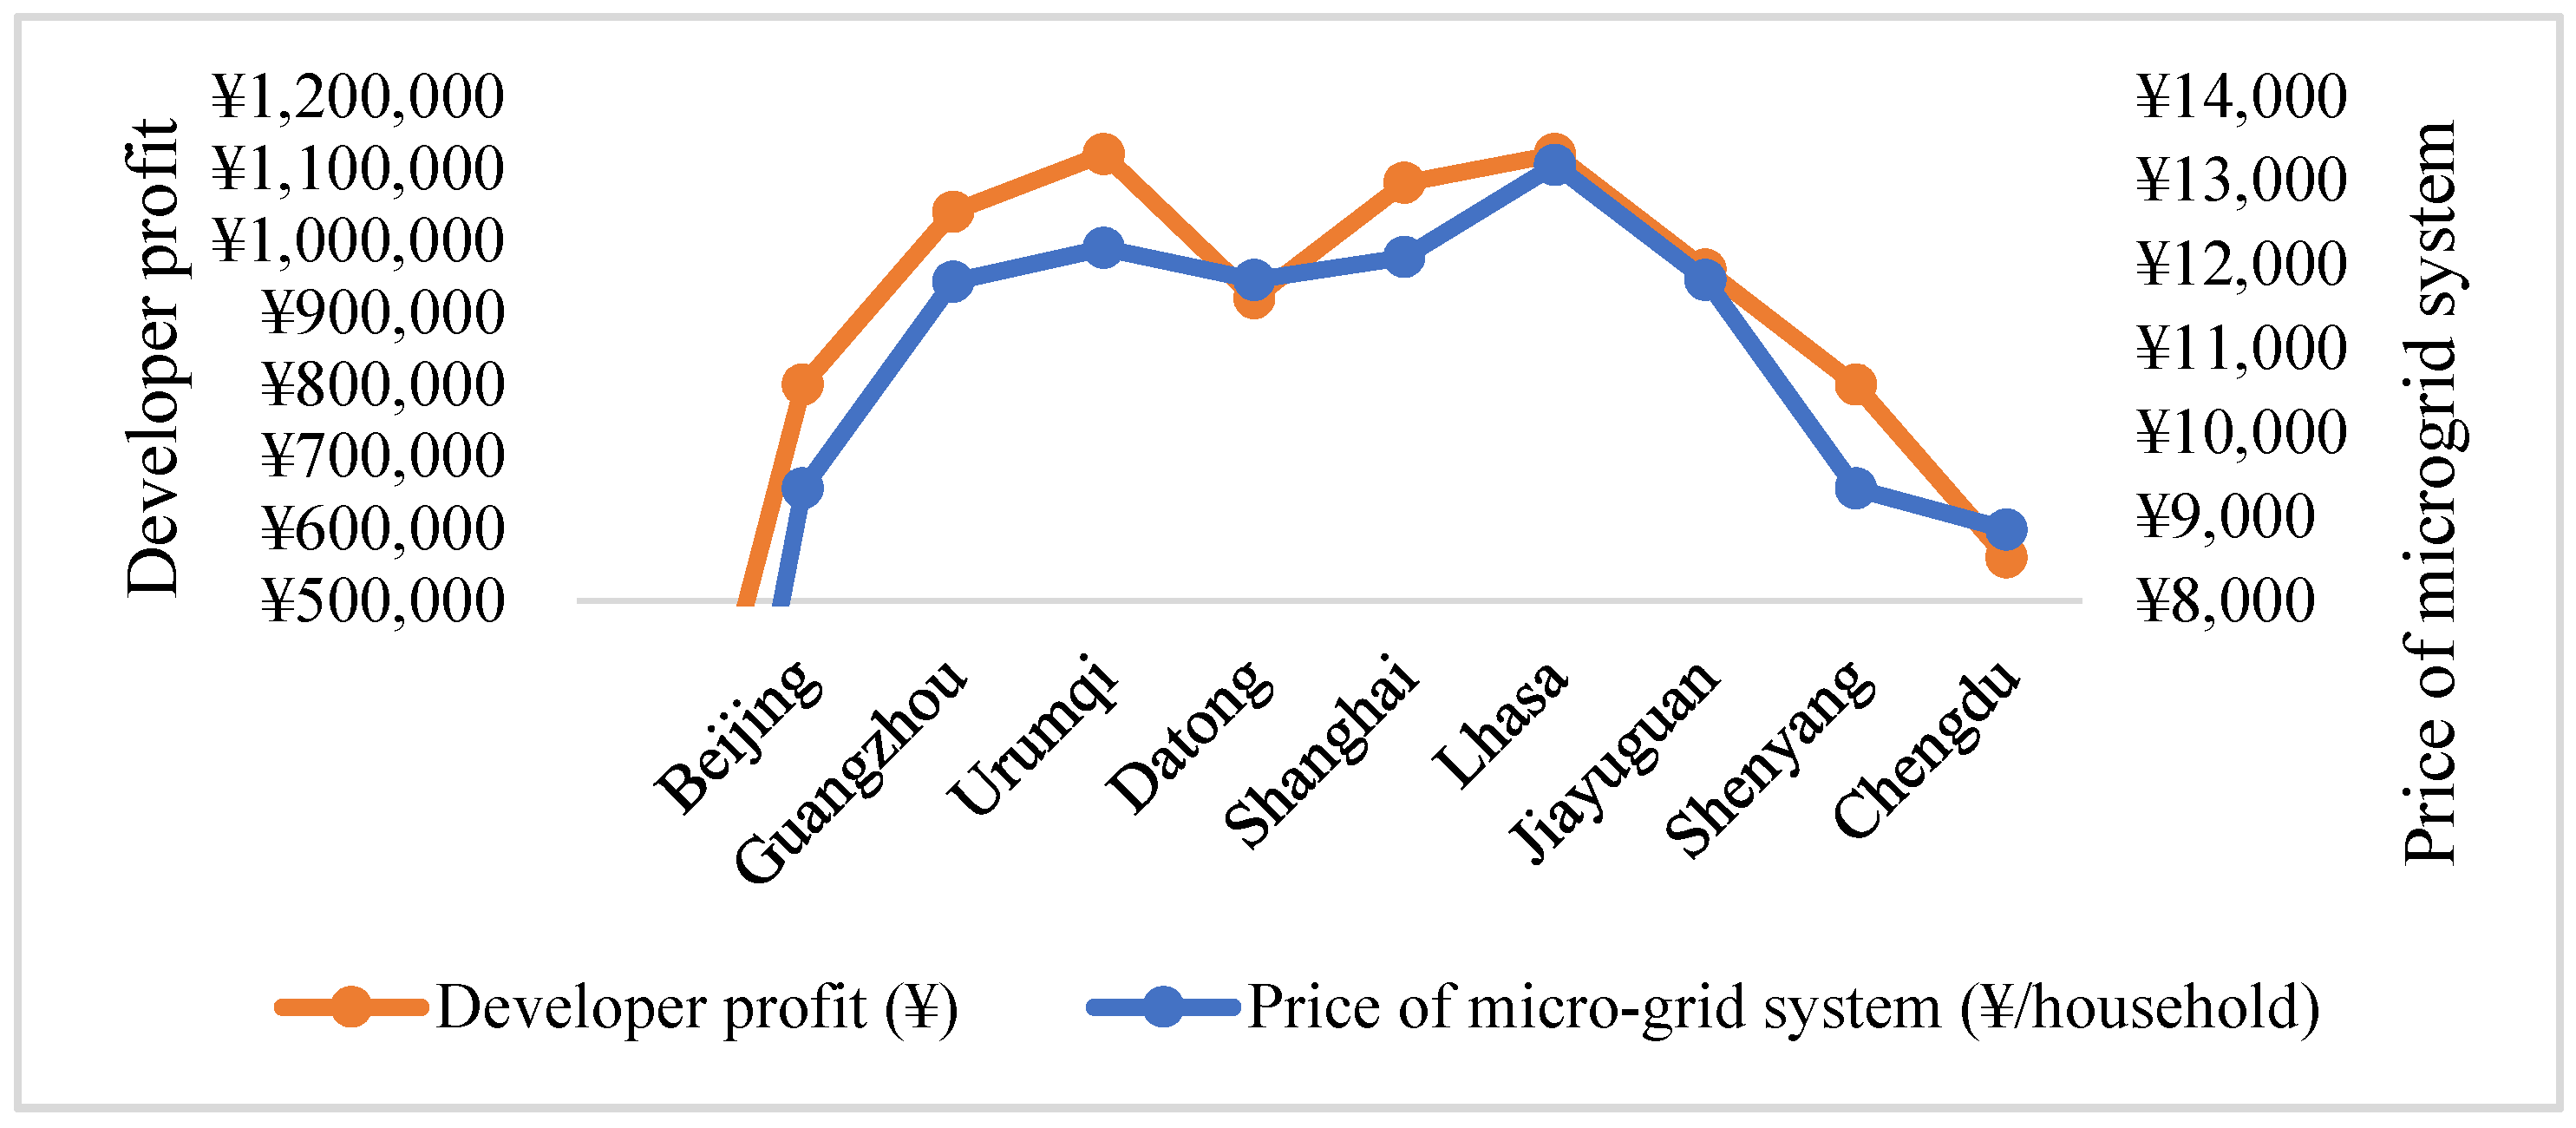
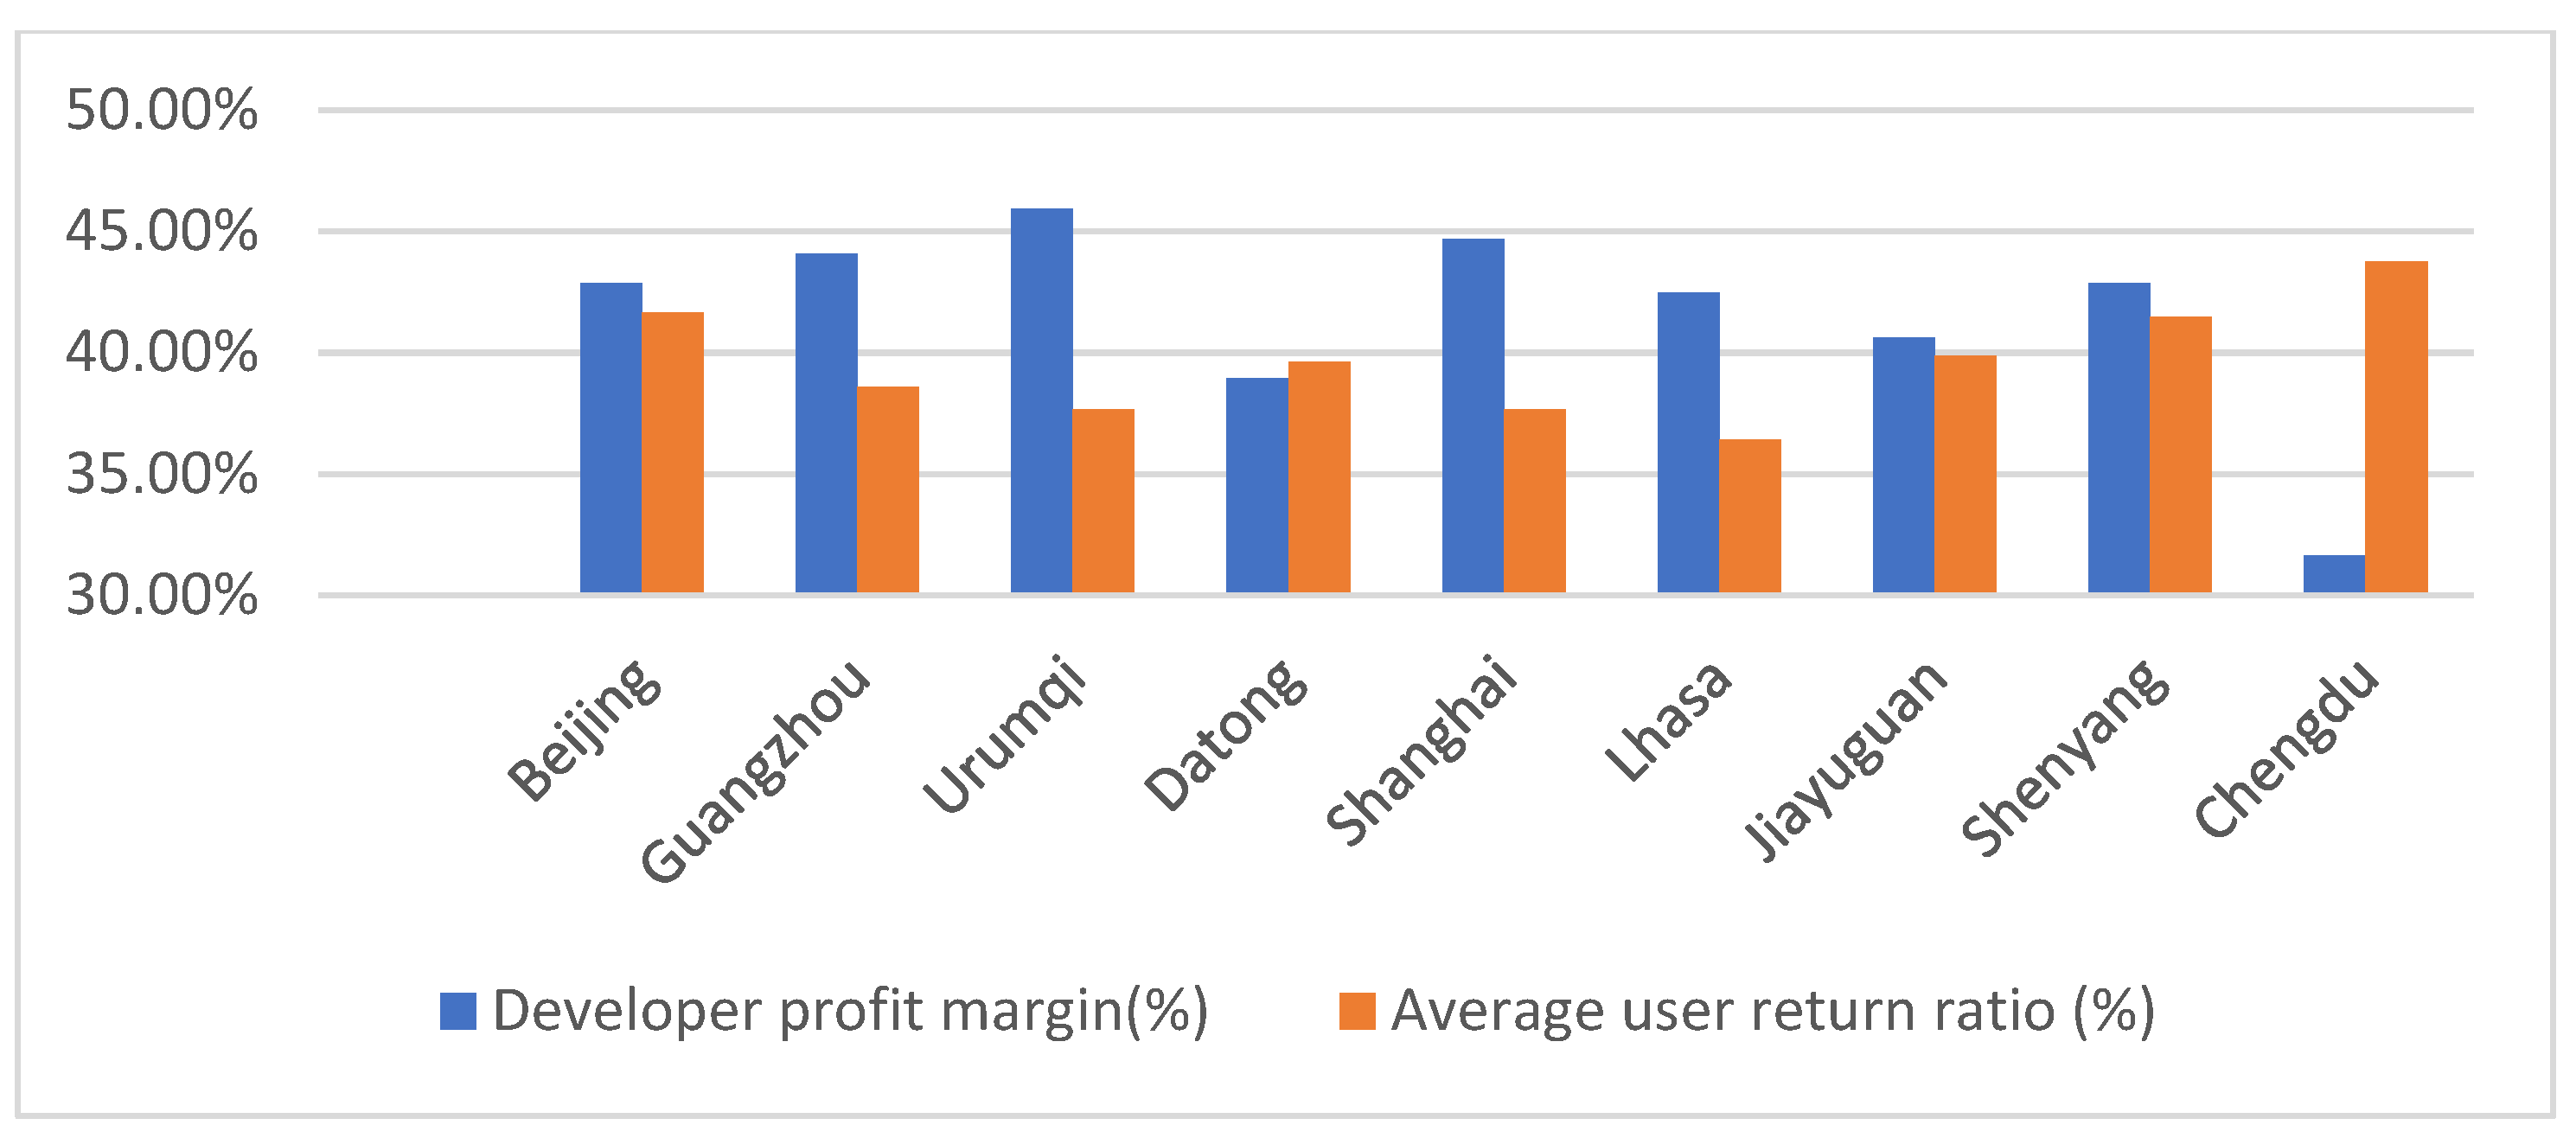
4.4. Scenario IV—Residential Community in Different Regions

Because of the considerable variance in PV policies and the electricity consumption mechanisms among different regions, only the impact of differences in solar radiation intensity is analyzed. The rest of parameter settings are kept consistent with Section 4.1. Apart from the selected region in Section 4.1, eight cities with relatively diverse and typical solar radiation are adopted in this scenario (displayed in Figure 4). They are Lhasa, Jiayuguan, Datong, Urumqi, Beijing, Guangzhou, Shenyang, and Chengdu. In particular, Lhasa has the highest intensity of solar radiation in China. Guangzhou area suffers from the comparatively less difference in solar radiation intensity across the four seasons. As shown in Figure 4, Chengdu is located in the Sichuan basin and has more rain, more fog, fewer sunny days and poorer solar radiation. Jiayuguan, Datong, and Urumqi have relatively excellent light conditions. Beijing and Shenyang are located in Northern China, where light levels peak earlier in the year (May).
Table 7 demonstrates the experimental results of listed cities in this scenario. The main reason for the weak performance of Chengdu is poor solar radiation, leading to the lowest values of indicators on the developer’s side. Datong and Jiayuguan are suffering in terms of light from the influence of larger PV system’s installed scale, which causes the total profit and profit margin of the developer to be smaller than those of Shanghai region. Furthermore, the corresponding values of average user’s revenue in the above cities (except for the regions in higher latitudes or in Sichuan basin) is maintained at a relatively constant level.
According to Figure 5, the relatively prominent lighting resource in Lhasa area results in the highest selling price of the microgrid system among the listed cities, whilst Lhasa shares first place in terms of total developer’s profit with Urumqi. Remarkably, it can be indicated by Figure 6 that the optimal installed scale of the PV system in the mentioned cities remains stable in the range of 1.2 kWp to 1.6 kWp on average under the current market prices. Additionally, Figure 6 shows the Lhasa area also occupies the largest installed scale of both the PV system (reaches 1.6 kWp/per household) and the storage battery (reaches 266.67 Ah/per household). Conversely, the results of data experiments in Beijing and Shenyang demonstrate that the business mode proposed in this paper encounters more obvious obstacles in northern areas with higher latitudes, because both cities’ average revenue per user are ranked at the bottom of the list due to their smaller installed scale of PV system and battery capacity. As a result, it can be seen that the selling price of the microgrid system, total profit, and profit margin of the developer are highly influenced by the variance of solar radiation intensity through Figure 5 and Figure 7. Particularly, owing to the larger installed PV system and the higher construction costs for the microgrid project, areas with better solar radiation conditions have suffered a decline in total profits and profit margins of the developer compared to the areas with smaller construction scales, such as Shanghai.

4.5. Scenario V—Comparison between Two Common Patterns

The business mode mentioned in previous sections belongs to the build-sell pattern, for which the developer builds the microgrid system and then sells for profit. The initial cost for each user is the selling price of a single microgrid system, then the daily costs of maintaining microgrid system paid by the community resident committee ought to be shared afterwards. This section further explores the build-hold pattern in which the developer holds the system instead of selling it. Then, developer realizes revenue through selling solar generated electricity to residential users, and shoulders the maintenance expense during the system’s operation. Therefore, in the integrated modeling for the build-hold pattern, it is necessary to implement the setting of the PV tariff as part of the developer’s decision variables. Meanwhile, the PV generation pricing sub-module and the residential users’ electricity expenditure sub-module are used as part of developer’s decision model, and the two-way correlation between developer and users is accomplished through the demand response sub-module.
In light of the developer’s side, the whole structure of the microgrid system and the derivation formulas of each cost ( C T o t a l ) in build-hold pattern remain basically the same as those in build-sell pattern. However, rather than recovering the cost in a lump sum by selling the system, the developer operates the microgrid system and earns revenue annually by selling solar-generated electricity to residential users, and covers the system maintenance costs as the operator of the microgrid system afterwards. On the long-term strategic level, the developer needs to make decisions about the installed scale of the PV system N PV and the capacity of storage battery N B . On the daily operational level, the developer has to set flexible real-time PV tariffs (equal to the set price reduction coefficient η e i ) which are below the local public grid tariffs so as to successfully sell solar-generated electricity to users. At this point, the annual revenue value of developer can be derived through calculating PV tariffs, total sold amount of solar electricity, and annual maintenance cost. Precisely, the value of electricity sold in each time period hinges on user’s demand response, which needs to be fed back by solving the lower-level optimization model. Furthermore, in the operation of the microgrid, relationships between PV efficiency and battery storage levels in the build-hold pattern are still expressed in the same way as in the build-sell pattern.
As for the user’s side, residential users are not required to pay a lump fee for the facilities in the initial period or to share in the system’s later maintenance costs, but only need to adjust their own electricity consumption behavior according to the published real-time PV tariffs, and shift their flexible loads to time periods with low PV tariffs. As a result, each user will benefit from the existence of the microgrid system. Hence, it is not necessary to establish a model to calculate the net present value of electricity consumption expenses under different situations, but only to figure out the relationship among PV generation scale, battery storage level, and electricity purchased by each user at each time period under the joint effects of multiple residential users.
The results of the data experiment are shown in Table 8, in which a new residential community in the Shanghai area is simulated for commercial application in a build-hold pattern. When η e i = 0 , namely the internal PV tariffs are set to equal the external public grid’s time-of-use tariffs, developers can maximize their profits by scheduling the appropriate installed scale of the microgrid project. Furthermore, it can be observed that all the indexes of the specific configuration of the microgrid project in the build-hold pattern are noticeably lower than those in the build-sell pattern, including developer’s profit, developer’s profit margin, and the optimal installed scale of the PV system and battery capacity for each household. Apparently, it can be proved through this scenario that under current market prices, the developer’s revenue derived from the build-hold pattern is far less than that of the build-sell pattern. This means developers have to devote more time to waiting for the return of funds. The downfall of the build-hold pattern can be attributed to the fact that developer’s discounted profit obtained annually in build-hold pattern is far less than the relatively large amount of developer’s profit obtained by selling microgrid systems at the initial stage of the build-sell pattern. Furthermore, due to the master–slave game model employed in build-sell pattern, the developer acquires the majority of profits in the game structure under the premise of no loss to residential users, which is not available to the developer in build-hold pattern.

5. Discussions

The two-level mathematical model based on the master–slave game is presented clearly in Section 3, which is from the viewpoint of theoretical study and thus useful for all system developers in different locations. Furthermore, in order to validate this business mode and provide managerial insights for real applications, we also conducted a lot of numerical experiments using the solar radiation data from different regions to investigate the interest relationship between both sides of the game. Based on the analysis in Section 4, we find that the current development of household-distributed PV power systems in the community faces the following problems.
(1)
Under the current market data, including the price of solar power components and the electricity price of residents drawing from the main grid, the business mode is only applicable in some cities with a good amount of sunshine. Shanghai is a representative city with large number of communities, advanced perception of sustainable development, and good sunshine in China. Therefore, it is easier to promote this mode in Shanghai.
(2)
Under the market dominated by the system developer, the PV subsidy supported by government cannot easily reach its expected result. Accordingly, the government should introduce a series of related policies along with the subsidy policy, and strive to change the game structure of both sides in the market so as to enable the residents to truly benefit from the subsidy.
(3)
Although the government prefers to execute the build-hold pattern to avoid disputes after the transaction, the system developer is less motivated for this pattern due to the low return on investment. Most Chinese developers currently favor accelerated development cycles, in which higher turnover models are more popular and capital chains are less vulnerable to breakage. Therefore, more pointed policies need to be made in order to promote the build-hold pattern.
(4)
As for the operations management method of the microgrid system, it can be found that the benefit of centralized management is much better than that of independent management. It should be noticed that the advocated centralized management brings a lot of pressure to the community resident committee, who must monitor the whole system and manage the joint account of all residents.
(5)
For residents, households with higher electricity demand gain more benefit through participating in the microgrid system. This phenomenon is inevitable although the fairness has already been considered in the model. Nonetheless, in the developer-dominated microgrid project, the majority of the benefits from installing the microgrid are gained by the developer instead of the residential users.

6. Conclusions

This study proposes a business mode of solar power generation/storage microgrid system for community developers and residential users. We establish a two-layer mathematical model based on the master–slave game and construct a complete microgrid operation framework after the transaction between developers and residential users. In the upper-level model, the developer decides the service selling price and scale of the microgrid system, and seeks to maximize the profit of building the microgrid. In the lower-level optimization model, residential users decide whether to engage in the microgrid system by comparing the electricity cost changes before and after participation, and optimize their own electricity consumption behaviors according to the PV tariffs. The business mode of residential microgrids in this paper is universal and can be used to analyze the impact of various government regulation means on the commercialization of microgrid systems, which provides a theoretical basis for predicting the commercial development direction of microgrid systems in communities.
Through model solving and numerical experiments, it is found that only developers in areas with better sunshine in China can obtain better returns by optimizing the selling price and the scale setting of the microgrid system based on existing market data. The key factors affecting the performance of this business mode are analyzed, such as the government’s subsidy, the community’s location, and the microgrid’s management method. It is indisputable that community microgrids will be installed in more and more locations since the prices of solar power components are becoming lower with the development of techniques. Given China’s massive population and extremely promising market potential, the solar-powered microgrid business mode in this study could contribute to changing China’s energy mix as well as reducing carbon emissions worldwide.
There are two directions that can be expanded in the future based on the research in this paper. One is to investigate the overall optimal decision and the stakeholder analysis of the scenario that considers the cooperative game between developers and community residents under the domination of government departments; secondly, on the basis of the solar power generation/storage microgrid system designed in this study, the intelligent maintenance strategy balancing the economy and system reliability can be further investigated in combination with the opportunity maintenance strategy.

Author Contributions

Conceptualization, W.C.; Methodology, W.C. and X.Z.; Software, X.Z. and J.S.; Validation, J.S.; Writing—original draft, X.Z. and J.S. All authors have read and agreed to the published version of the manuscript.

Funding

This research was funded by Shanghai 2022 “Science and Technology Innovation Action Plan” soft science research projects, grant number 22692113800.

Data Availability Statement

The data that support the findings of this study are available from the corresponding author upon reasonable request.

Conflicts of Interest

The authors declare no conflict of interest. The funder had no role in the design of the study; in the collection, analyses, or interpretation of data; in the writing of the manuscript, or in the decision to publish the results.

Appendix A

Table A1. Parameter settings and data sources for the numerical experiment.
Parameter ListParameter DefinitionValueData Source
r a d i , j Sunlight intensity for
each hour of the year
/NREL (National Renewable Energy Lab)
r a d stc Sunlight intensity under
standard conditions
1 kW/m2Report from China Photovoltaic Industry Association [35]
N P V a v g ( N PV / n ) Enumeration range of the installed scale of PV system per household0–4 kWphttp://www.meonsolar.com/
(accessed on 1 December 2021)
n u n i t Average household population in Shanghai area2.32 persons/householdShanghai Seventh National Population Census Main Data Bulletin
E y e a r u n i t Average annual electricity consumption per resident1214.655
kWh/person
Statistical Bulletin of National Economic and Social Development of Shanghai in 2020
Table A2. Parameters of main components in the community optical storage microgrid.
ComponentsTypeSpecificationPrice
InverterPSN-4000W4 kWCNY 590/unit 1
AC distribution cabinetPZ30-12/CNY 127/unit
Storage batteriesLead-acid colloid200 AhCNY 1099/unit
PV arrayMono-crystalline silicon200 W/unitCNY 425/unit
PV mountAluminum alloyWithstand two pieces of
50–200 W electric plate
CNY 328/unit
PV controller12V/24V12V60ACNY 349/unit
1 The prices are obtained from online commercial website (Jd.com (accessed on 11 December 2021)).
Table A3. Parameters of PV accessories in the community optical storage microgrid.
AccessoriesSpecificationPrice
4P red & black 5 m line5 m/stemCNY 78/stem
Y-type 3-way connection cableMC4CNY 32/stem
Battery connection cable0.4 m/stemCNY 32/stem
Controller connection cable1.5 m/stemCNY 39/stem

References

  1. General Institute of Hydro-power Planning and Design of China. China Renewable Energy Development Report 2020. Available online: http://16j.powerchina.cn/art/2021/6/30/art_5173_1163554.html (accessed on 20 October 2021).
  2. Luo, X.; Liu, J. Economic analysis of residential distributed solar photovoltaic. Front. Eng. Manag. 2015, 2, 125–130. [Google Scholar] [CrossRef]
  3. Yin, H.X.; Liu, Z.Y. Research on the Function Performance Deviations of China’s Urban Community Residents Committees and Its Countermeasures. In Proceedings of the 11th International Conference on Public Administration, Bandung, Indonesia, 9–11 December 2015; Volume 2, pp. 311–316. [Google Scholar]
  4. Manshadi, S.D.; Khodayar, M.E. A hierarchical electricity market structure for the smart grid paradigm. In Proceedings of the IEEE Transactions on Smart Grid, Boston, MA, USA, 17–21 July 2016; IEEE: Manhattan, NY, USA, 2016; Volume 7, pp. 1866–1875. [Google Scholar]
  5. Fang, X.H.; Wang, J.K.; Song, G.R.; Han, Y.H.; Zhao, Q.; Cao, Z. Multi-agent reinforcement learning approach for residential microgrid energy scheduling. Energies 2020, 13, 123. [Google Scholar] [CrossRef]
  6. Wang, D.; Qiu, J.; Reedman, L.; Meng, K.; Lai, L.L. Two-stage energy management for networked microgrids with high renewable penetration. Appl. Energy 2018, 226, 39–48. [Google Scholar] [CrossRef]
  7. Huang, Y.; Yang, L.; Liu, S.; Wang, G. Cooperation between Two Micro-Grids Considering Power Exchange: An Optimal Sizing Approach Based on Collaborative Operation. Sustainability 2018, 10, 4198. [Google Scholar] [CrossRef]
  8. Ju, L.W.; Huang, L.I.; Lin, H.L.; Tan, Z.F. An interactive dispatching strategy for micro energy grids considering multi-energy flexible conversion based on the three-level optimization perspective. Sustain. Cities Soc. 2021, 64, 102504. [Google Scholar] [CrossRef]
  9. Mohammadi, M.; Nafar, M.; Nasiraghdam, H.; Azadbakht, B. Micro-grid optimization as grid-connected in pool-based power market under pay-as-bid and uniform pricing. Int. Rev. Electr. Eng. 2012, 7, 4236–4248. [Google Scholar]
  10. Akbary, P.; Ghiasi, M.; Pourkheranjani, M.R.R.; Alipour, H.; Ghadimi, N. Extracting Appropriate Nodal Marginal Prices for All Types of Committed Reserve. Comput. Econ. 2019, 53, 1–26. [Google Scholar] [CrossRef]
  11. Ghadimi, N.; Akbarimajd, A.; Shayeghi, H.; Abedinia, O. Two stage forecast engine with feature selection technique and improved meta-heuristic algorithm for electricity load forecasting. Energy 2018, 161, 130–142. [Google Scholar] [CrossRef]
  12. Wei, F.; Jing, Z.X.; Wu, P.Z.; Wu, Q.H. A Stackelberg game approach for multiple energies trading in integrated energy systems. Appl. Energy 2017, 200, 315–329. [Google Scholar] [CrossRef]
  13. Luo, X.; Liu, Y.; Liu, J.; Liu, X. Energy scheduling for a three-level integrated energy system based on energy hub models: A hierarchical Stackelberg game approach. Sustain. Cities Soc. 2020, 52, 101814. [Google Scholar] [CrossRef]
  14. Zhang, X.S.; Bao, T.; Yu, T.; Yang, B.; Han, C.J. Deep transfer Q-learning with virtual leader-follower for supply-demand Stackelberg game of smart grid. Energy 2017, 133, 348–365. [Google Scholar] [CrossRef]
  15. Xu, Z.H.; Zhang, P.; Wang, Q.P. The key technology research on transient stability control of micro-grid. In Proceedings of the 2012 China International Conference on Electricity Distribution, Shanghai, China, 14 September 2012. [Google Scholar]
  16. Zhao, B.; Zhang, X.; Chen, J.; Wang, C.S.; Guo, L. Operation optimization of standalone microgrids considering lifetime characteristics of battery energy storage system. In IEEE Transactions on Sustainable Energy; IEEE: Manhattan, NY, USA, 2013; Volume 4, pp. 934–943. [Google Scholar]
  17. Chen, Y.; Deng, C.; Yao, W.; Liang, N.; Xia, P.; Cao, P.; Dong, Y.; Zhang, Y.-A.; Liu, Z.; Li, D.; et al. Impacts of stochastic forecast errors of renewable energy generation and load demands on micro grid operation. Renew. Energy 2019, 133, 442–461. [Google Scholar] [CrossRef]
  18. Grover-Silva, E.; Heleno, M.; Mashavekh, S.; Cardoso, G.; Girard, R.; Kariniotakis, G. A stochastic optimal power flow for scheduling flexible resources in microgrids operation. Appl. Energy 2018, 229, 201–208. [Google Scholar] [CrossRef]
  19. Wang, Y.; Huang, Y.; Wang, Y.; Li, F.; Zhang, Y.; Tian, C. Operation Optimization in a Smart Micro-Grid in the Presence of Distributed Generation and Demand Response. Sustainability 2018, 10, 847. [Google Scholar] [CrossRef]
  20. Tushar, M.H.K.; Assi, C.; Maier, M. Distributed Real-Time Electricity Allocation Mechanism for Large Residential Microgrid. IEEE Trans. Smart Grid 2015, 6, 1353–1363. [Google Scholar]
  21. Zamani, A.G.; Zakariazadeh, A.; Jadid, S. Day-ahead resource scheduling of a renewable energy based virtual power plant. Appl. Energy 2016, 169, 324–340. [Google Scholar] [CrossRef]
  22. Wang, S.D.; Mao, Y.R.; Jia, G.Y.; Song, H.; Qiu, J.; Ding, T. Optimal configuration of optical storage microgrid under demand-side response based on cooperative game. J. Phys. Conf. Ser. 2019, 1187, 022065. [Google Scholar] [CrossRef]
  23. Kalavani, F.; Mohammadi-Ivatloo, B.; Karimi, A.; Kalavani, F. Stochastic optimal sizing of integrated cryogenic energy storage and air liquefaction unit in microgrid. Renew. Energy 2019, 136, 15–22. [Google Scholar] [CrossRef]
  24. Zhao, M.; Shen, C.; Li, S.X. Coalitional game theoretic method to study multi-microgrids cooperation condition considering outage risk. Control Theory Appl. 2018, 35, 688–698. [Google Scholar]
  25. Mashavekh, S.; Stadler, M.; Cardoso, G.; Heleno, M. A mixed integer linear programming approach for optimal DER portfolio, sizing, and placement in multi-energy microgrids. Appl. Energy 2017, 187, 154–168. [Google Scholar] [CrossRef]
  26. Long, Y.; Wang, Y.; Pan, C. Incentive Mechanism of Micro-grid Project Development. Sustainability 2018, 10, 163. [Google Scholar] [CrossRef]
  27. Dehghani, M.; Ghiasi, M.; Niknam, T.; Kavousi-Fard, A.; Shasadeghi, M.; Ghadimi, N.; Taghizadeh-Hesary, F. Blockchain-Based Securing of Data Exchange in a Power Transmission System Considering Congestion Management and Social Welfare. Sustainability 2021, 13, 90. [Google Scholar] [CrossRef]
  28. Zhang, Y.; Zhang, T.; Wang, R.; Liu, Y.J.; Guo, B. Optimal operation of a smart residential micro grid based on model predictive control by considering uncertainties and storage impacts. Sol. Energy 2015, 122, 1052–1065. [Google Scholar] [CrossRef]
  29. He, Y.D.; Zhou, Y.K.; Yuan, J.; Liu, Z.X.; Wang, Z.; Zhang, G.Q. Transformation towards a carbon-neutral residential community with hydrogen economy and advanced energy management strategies. Energy Convers. Manag. 2021, 249, 114834. [Google Scholar] [CrossRef]
  30. Wang, J.; Li, P.; Fang, K.; Zhou, Y. Robust Optimization for Household Load Scheduling with Uncertain Parameters. Appl. Sci. 2018, 8, 575. [Google Scholar] [CrossRef]
  31. Samadi, P.; Mohsenian-Rad, H.; Wong, V.W.; Schober, R. Utilizing renewable energy resources by adopting DSM techniques and storage facilities. In Proceedings of the IEEE International Conference on Communications, Sydney, Australia, 14 October 2014; IEEE: Manhattan, NY, USA, 2014. [Google Scholar]
  32. Alilou, M.; Tousi, B.; Shayeghi, H. Home energy management in a residential smart micro grid under stochastic penetration of solar panels and electric vehicles. Sol. Energy 2020, 212, 6–18. [Google Scholar] [CrossRef]
  33. Olsen, D.J.; Sarker, M.R.; Ortega-Vazquez, M.A. Optimal penetration of home energy management systems in distribution networks considering transformer aging. IEEE Trans. Smart Grid 2018, 9, 3330–3340. [Google Scholar] [CrossRef]
  34. Sarker, M.R.; Olsen, D.J.; Ortega-Vazquez, M.A. Co-optimization of distribution transformer aging and energy arbitrage using electric vehicles. IEEE Trans. Smart Grid 2017, 8, 2712–2722. [Google Scholar] [CrossRef]
  35. Ma, Y.L.; Chen, X.; Wang, L.M.; Yang, J.L. Investigation of Smart Home Energy Management System for Demand Response Application. Front. Energy Res. 2021, 9, 772027. [Google Scholar] [CrossRef]
  36. Wang, C.; Zhou, Y.; Wu, J.; Wang, J.; Zhang, Y.; Wang, D. Robust-Index Method for Household Load Scheduling Considering Uncertainties of Customer Behavior. IEEE Trans. Smart Grid 2015, 6, 1806–1818. [Google Scholar] [CrossRef]
  37. Khodaei, H.; Hajiali, M.; Darvishan, A.; Sepehr, M.; Ghadimi, N. Fuzzy-based heat and power hub models for cost-emission operation of an industrial consumer using compromise programming. Appl. Therm. Eng. 2018, 137, 395–405. [Google Scholar] [CrossRef]
  38. China Photovoltaic Industry Association. China Photovoltaic Industry Development Road Map. Available online: http://chinapv.org.cn/road_map/927.html (accessed on 20 October 2021).
  39. China Photovoltaic Industry Association. China Photovoltaic Industry Annual Report. Available online: http://chinapv.org.cn/annual_report/821.html (accessed on 20 October 2021).
  40. Jd.com. MPPTSUNSWM150W. Available online: https://item.jd.com/10030139729713.html#product-detail (accessed on 20 December 2021).
  41. Jd.com. MPPTSUN Solar Colloidal Lead-Acid Battery. Available online: https://item.jd.com/10035298774674.html#crumb-wrap (accessed on 20 December 2021).
  42. National Development and Reform Commission of the People’s Republic of China. Notice of the National Development and Reform Commission on Matters Related to the New Energy Feed-In Tariff Policy in 2021. Available online: https://zfxxgk.ndrc.gov.cn/web/iteminfo.jsp?id=18168 (accessed on 20 November 2021).
  43. State Grid Shanghai Electric Power Company. Fee Standard of Operating Service. Available online: http://www.sh.sgcc.com.cn/html/main/col706/2021-04/27/20210427145057938221979_1.html (accessed on 20 November 2021).
  44. Jordan, D.C.; Kurtz, S.R.; Vansant, K.; Newmiller, J. Compendium of photovoltaic degradation rates. Prog. Photovolt. Res. Appl. 2016, 24, 978–989. [Google Scholar] [CrossRef]
  45. Li, Z.S. Photovoltaic Distributed Generation Systems: Design, Installation, Operation and Maintenance, 2nd ed.; China Machine Press: Beijing, China, 2019; pp. 149–151. [Google Scholar]
  46. Jd.com. MPPTSUN Solar Inverter. Available online: https://item.jd.com/10028088010512.html#crumb-wrap (accessed on 20 December 2021).
  47. Baidu Library. Calculation of the Annual Electricity Consumption of Shanghai Municipal Residents. Available online: https://wenku.baidu.com/view/be2b3d92dd88d0d233d46ac3.html (accessed on 20 December 2021).
  48. Shanghai Bureau of Statistics. The Shanghai Statistical Yearbook. Available online: http://tjj.sh.gov.cn/tjnj/20210303/2abf188275224739bd5bce9bf128aca8.html (accessed on 20 December 2021).
  49. Shanghai Municipal Development & Reform Commission. Shanghai Renewable Energy and New Energy Development Special Funds Support Measures (2020 Edition). Available online: https://fgw.sh.gov.cn/fgw_gfxwj/20211123/190e765b92e04236920f3d0e17785322.html (accessed on 20 January 2022).
Figure 1. (a) Example of a general low carbon community in the Shanghai area; (b) The overall structure of the distributed solar power generated system applied in the community.
Sustainability 14 10021 g001
Figure 2. Architecture of solar power generation/storage microgrid system.
Sustainability 14 10021 g002
Figure 3. Monthly Average Solar Horizontal Irradiance of Shanghai Area.
Sustainability 14 10021 g003
Figure 4. Map of specific distribution of mentioned cities in China.
Sustainability 14 10021 g004
Figure 5. Developer’s profit vs. Selling price of microgrid system for each region.
Sustainability 14 10021 g005
Figure 6. Installed scale of microgrid system per household for each region.
Sustainability 14 10021 g006
Figure 7. Developer profit margin vs average user return ratio for each region.
Sustainability 14 10021 g007
Table 1. Numerical experimental parameter settings and data sources.
Parameter ListParameter DefinitionValueData Source
n Total number of users purchasing the house200 households/
P f i x PV PV system unit O&M cost0.054 CNY/W/yearReport from China Photovoltaic Industry Association [38]
p B Unit price of battery457.92 CNY/kWhReport from China Photovoltaic Industry Association [39]
p AF , 1 PV accessories determined by the PV system size2.945 CNY/WCalculated from component prices
p AF , 2 PV accessories determined by user number1183 CNY/familyCalculated from component prices
p AF , 3 Cost of connecting wires between solar panels32 CNY/barReference component prices
N PV u n i t Power of each solar electric panel200 w/pieceOnline Business Data [40]
l B Life span of colloidal battery8 yearOnline Business Data [41]
p s e l l PV power generation guide feed-in tariff0.4146 CNY/kWhRelated National Policies [42]
P FR i Peak hour tariffs for the public grid0.617 CNY/kWhResidential electricity tariff in Shanghai [43]
P FR i Valley hour tariffs for the public grid0.307 CNY/kWhResidential electricity tariff in Shanghai [43]
η Attenuation coefficient of PV module power generation0.85%The Current Literature [44]
ρ PV Derating Factor0.9Related Design Manuals [45]
η DCAC Inverter efficiency90%Online Business Data [46]
η r a t e Average annual discount rate for the next 25 years0.05Refer to current Bank of China discount rate
D i , j , l k , B , D i , j , l k , C , D i , j , l k , A Average daily electricity consumption per user for various loads/Online social survey [47] & Shanghai Statistical Yearbook 2020 [48]
Table 2. Optimal configuration of the microgrid system.
Specific ConfigurationNumerical Value
Price of the microgrid system (CNY/household)12,088.59
Developer’s profit (CNY)1,080,000
Developer profit margin44.67%
PV system scale (kWp) 11.4
Battery installation scale (Ah)216.67
Average revenue per user (CNY)4552.33
Average user return ratio37.66%
1 kWp represents the peak power of solar photovoltaic panel.
Table 3. Differences between user groups with different number of family members.
User TypesAverage Revenue of the User (CNY)Average User Yield
User group with 2 family members1245.8610.31%
User group with 3 family members4781.0739.55%
User group with 4 family members7676.6863.50%
Table 4. Differences between user groups with different power saving factor.
User TypesAverage Revenue
of the User (CNY)
Average User Yield
User groups with a power saving factor between 0.8 and 0.93592.1629.72%
User groups with a power saving factor between 0.9 and 1.03916.0032.39%
User groups with a power saving factor between 1.0 and 1.14948.3240.93%
User groups with a power saving factor between 1.1 and 1.26303.4152.14%
Table 5. Experimental comparison of data in subsidized and non-subsidized situations.
Specific ConfigurationExperimental Results with
Subsidized Scenarios
Experimental Results without
Subsidized Scenarios
Price of microgrid system (CNY/household)17,280.1012,088.59
Developer’s profit (CNY)1,760,0001,080,000
Developer profit margin50.90%44.67%
PV system scale (kWp)1.81.4
Battery installation scale (Ah)316.67216.67
Average revenue per user (CNY)5052.164552.33
Average user return ratio29.24%37.66%
Table 6. Comparative analysis of independent operation and centralized management.
Specific ConfigurationExperimental Results with
Subsidized Scenarios
Experimental Results without
Subsidized Scenarios
Price of microgrid system (CNY/household)10,171.8412,088.59
Developer’s profit (CNY)1,000,0001,080,000
Developer profit margin49.16%44.67%
PV system scale (kWp)1.01.4
Battery installation scale (Ah)166.67216.67
Average revenue per user (CNY)3940.984552.33
Average user return ratio 38.74%37.66%
Table 7. Analysis of business mode applications in various geographic regions.
Specific ConfigurationPrice of System (CNY/Household)Developer Profit (CNY)Developer Profit MarginPV System Scale
(kWp)
Battery Installation Scale (Ah) Average Revenue per User (CNY)Average User Return Ratio
Beijing9334.92800,00042.85% 1.283.333889.27 41.66%
Guangzhou11,797.011,040,00044.08%1.4200.004552.72 38.59%
Urumqi12,197.011,120,00045.91% 1.4200.004593.8237.66%
Datong11,818.01920,00038.92%1.6200.004681.93 39.62%
Shanghai12,088.591,080,00044.67%1.4216.674552.3337.66%
Lhasa13,184.341,120,00042.47%1.6266.674801.5436.42%
Jiayuguan11,818.01960,00040.62%1.6200.004711.1139.86%
Shenyang9334.92800,00042.85%1.283.333872.35 41.48%
Chengdu8847.50560,00031.65%1.4100.003872.35 43.77%
Table 8. Comparative analysis of different operation patterns.
Specific ConfigurationBuild-Hold PatternBuild-Sell Pattern
Developer’s profit (CNY)200,299.801,080,000
Developer profit margin25.03%44.67%
PV system scale (kWp)0.81.4
Battery installation scale (Ah)66.67216.67
η e i 0.000.01
Publisher’s Note: MDPI stays neutral with regard to jurisdictional claims in published maps and institutional affiliations.

