1. Introduction
The year 1950 has been commonly considered to mark the beginning of plastic mass production [
1]. Since then, 8.3 billion tons of virgin plastic materials have been manufactured [
2]. Between 1950 and 2015, it is estimated that 6.3 billion tons of plastic waste have been produced globally [
2], constituting almost 76% of all virgin plastics produced since the 1950s. Eight million tons of plastic items spill into the ocean every year [
3]. Plastic items end up in the ocean from various sources in many ways and never fully biodegrade, thus threatening aquatic species, marine and coastal ecosystems, and also human beings as plastic debris enters our food chain [
4,
5,
6,
7]. The abundance of biodiversity and precious resources for humans and other species calls for efficient technologies to monitor marine pollution caused by plastic litter. Ground-based monitoring systems and field campaigns provide precise information on the quantity and quality of marine litter, but present several disadvantages—they are time-consuming, expensive, require great organisational effort, and provide little information about the spatial and temporal dynamics of debris. Thus, such an approach would not suit continuous monitoring over large surface areas. Earth Observation (EO) using satellites can support the ground-based monitoring of marine plastic litter thanks to their global synoptic perspective. In 2019, the Italian Space Agency launched a new hyperspectral satellite called PRISMA (PRecursore IperSpettrale della Missione Applicativa). The high spectral resolution of PRISMA allows for enhanced detection of floating plastic materials given its increased spectral resolution.
However, taking into account the vastity of oceans, the extension of coastal areas around the world, and the effort in terms of time and human resources for processing huge numbers of remotely sensed data using traditional techniques, it is clear that promising Machine Learning (ML) algorithms coupled with newly available hyperspectral satellite data need to be explored. Applying ML methodologies to overcome the open challenges of applied remote sensing is not an entirely new task. Land cover classification with Sentinel-2 time-series data [
8], object detection with very high resolution images [
9], and detection of anomalous movements possibly affecting underground pipelines [
10] are all possible applications for ML. Ref. [
11] describes ML applications extending from bias correction and cross-calibration to oil spill detection. Ref. [
12] explains how Deep Learning (DL) can perform complex tasks such as super-resolution and pan sharpening. However, due to the complex nature of EO data, the application of ML is still an open challenge. From the perspective of applied satellite remote sensing for marine plastic litter detection and quantification, the adoption of ML is still in its infancy, and there is relatively little literature on the topic (e.g., [
13,
14,
15,
16]). Ref. [
13] explored the application of the Support Vector Machine and Random Forest for detecting marine floating plastics through Sentinel-2 data, exploiting both spectral bands and spectral indices. Ref. [
14] attempted to float plastic debris in coastal areas with Sentinel-2 images and developed four classification algorithms: two unsupervised (K-Means and Fuzzy C-Means) and two supervised (Support Vector Regression and Semi-Supervised Fuzzy C-Means). Moreover, Ref. [
14] identified a combination of six bands from Sentinel-2 and two spectral indices to develop their models. Ref. [
15] compared the application of the Random Forest classifier and the Convolutional Neural Network on Unmanned-Aerial-Systems-derived orthophotos of a sandy beach to detect and map marine litter objects.
This paper presents a new ML approach applied to pan-sharpened hyperspectral PRISMA data to detect floating plastic materials. Two ML methodologies were exploited and combined: one unsupervised, the K-Means, and the other supervised, the Light Gradient Boosting Model (LGBM). Each methodology yielded an accuracy related to the ground truth (for the LGBM) and based on the distance from clusters (for the K-Means). The final probability map is a linear combination of unsupervised and supervised output accuracy, representing the probability that a pixel contains plastic or not.
The study’s objective was to develop a new method to effectively identify plastic targets offshore through a combination of supervised and unsupervised ML algorithms applied to pan-sharpened hyperspectral data remotely sensed by the new PRISMA satellite. The study demonstrates that ML algorithms provide promising results in detecting floating objects offshore even with a small dataset of satellite data. It was possible to significantly reduce the false positives and detect floating objects more accurately by increasing the training dataset.
2. Materials and Methods
2.1. Data Description
2.1.1. Study Area
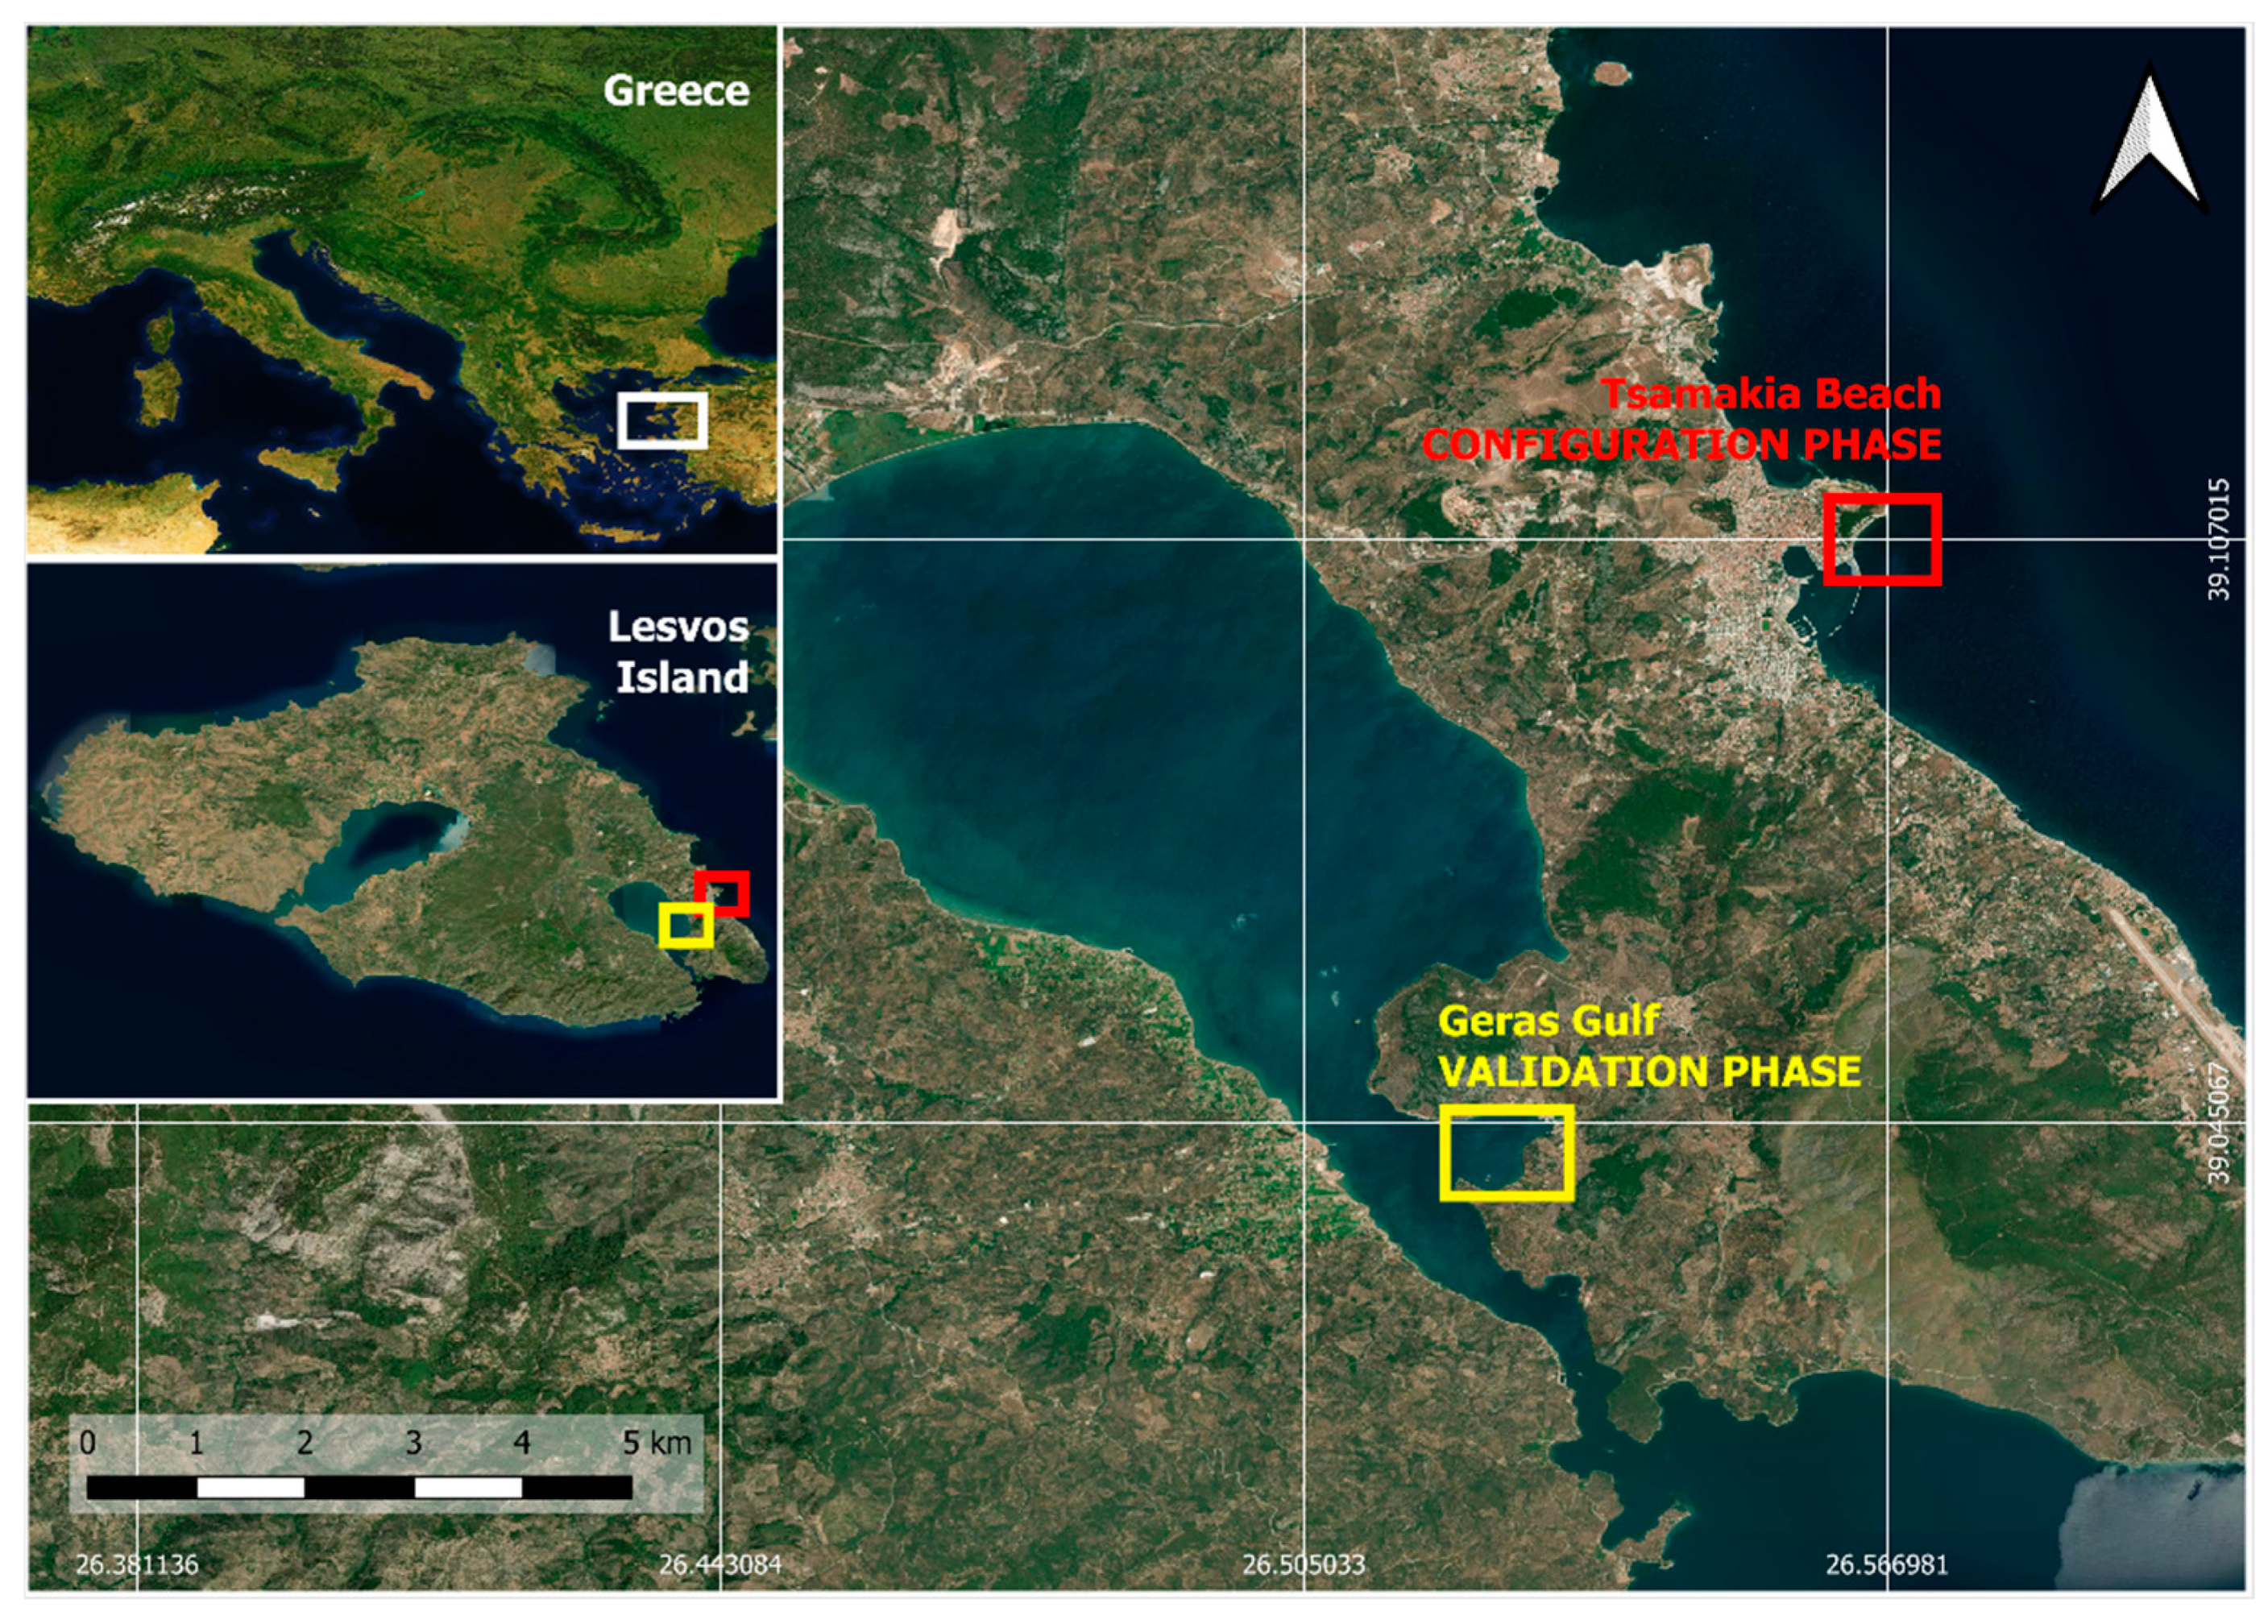
For this investigation, satellite data were collected for two study areas: Tsamakia Beach in Mytilene (Lat: 39.108406°; Long: 26.565948°) and Geras Gulf (Lat: 39.046606°; Long: 26.526732°), which are located on the Greek island of Lesvos (
Figure 1). Six controlled experiments were set up to simulate real-world situations at both sites. The study sites offered an unobstructed space in which to run the controlled experiments, with no interference from any touristic or commercial activities. Moreover, the seabed was sufficiently deep and dark to simulate deep waters effectively, as the spectral response of clear deep water has a unique characteristic in the blue part of the electromagnetic spectrum and becomes insignificant and practically null in the Near-Infrared (NIR) and Short-Wave Infrared (SWIR) portions of the spectrum.
2.1.2. Field Data
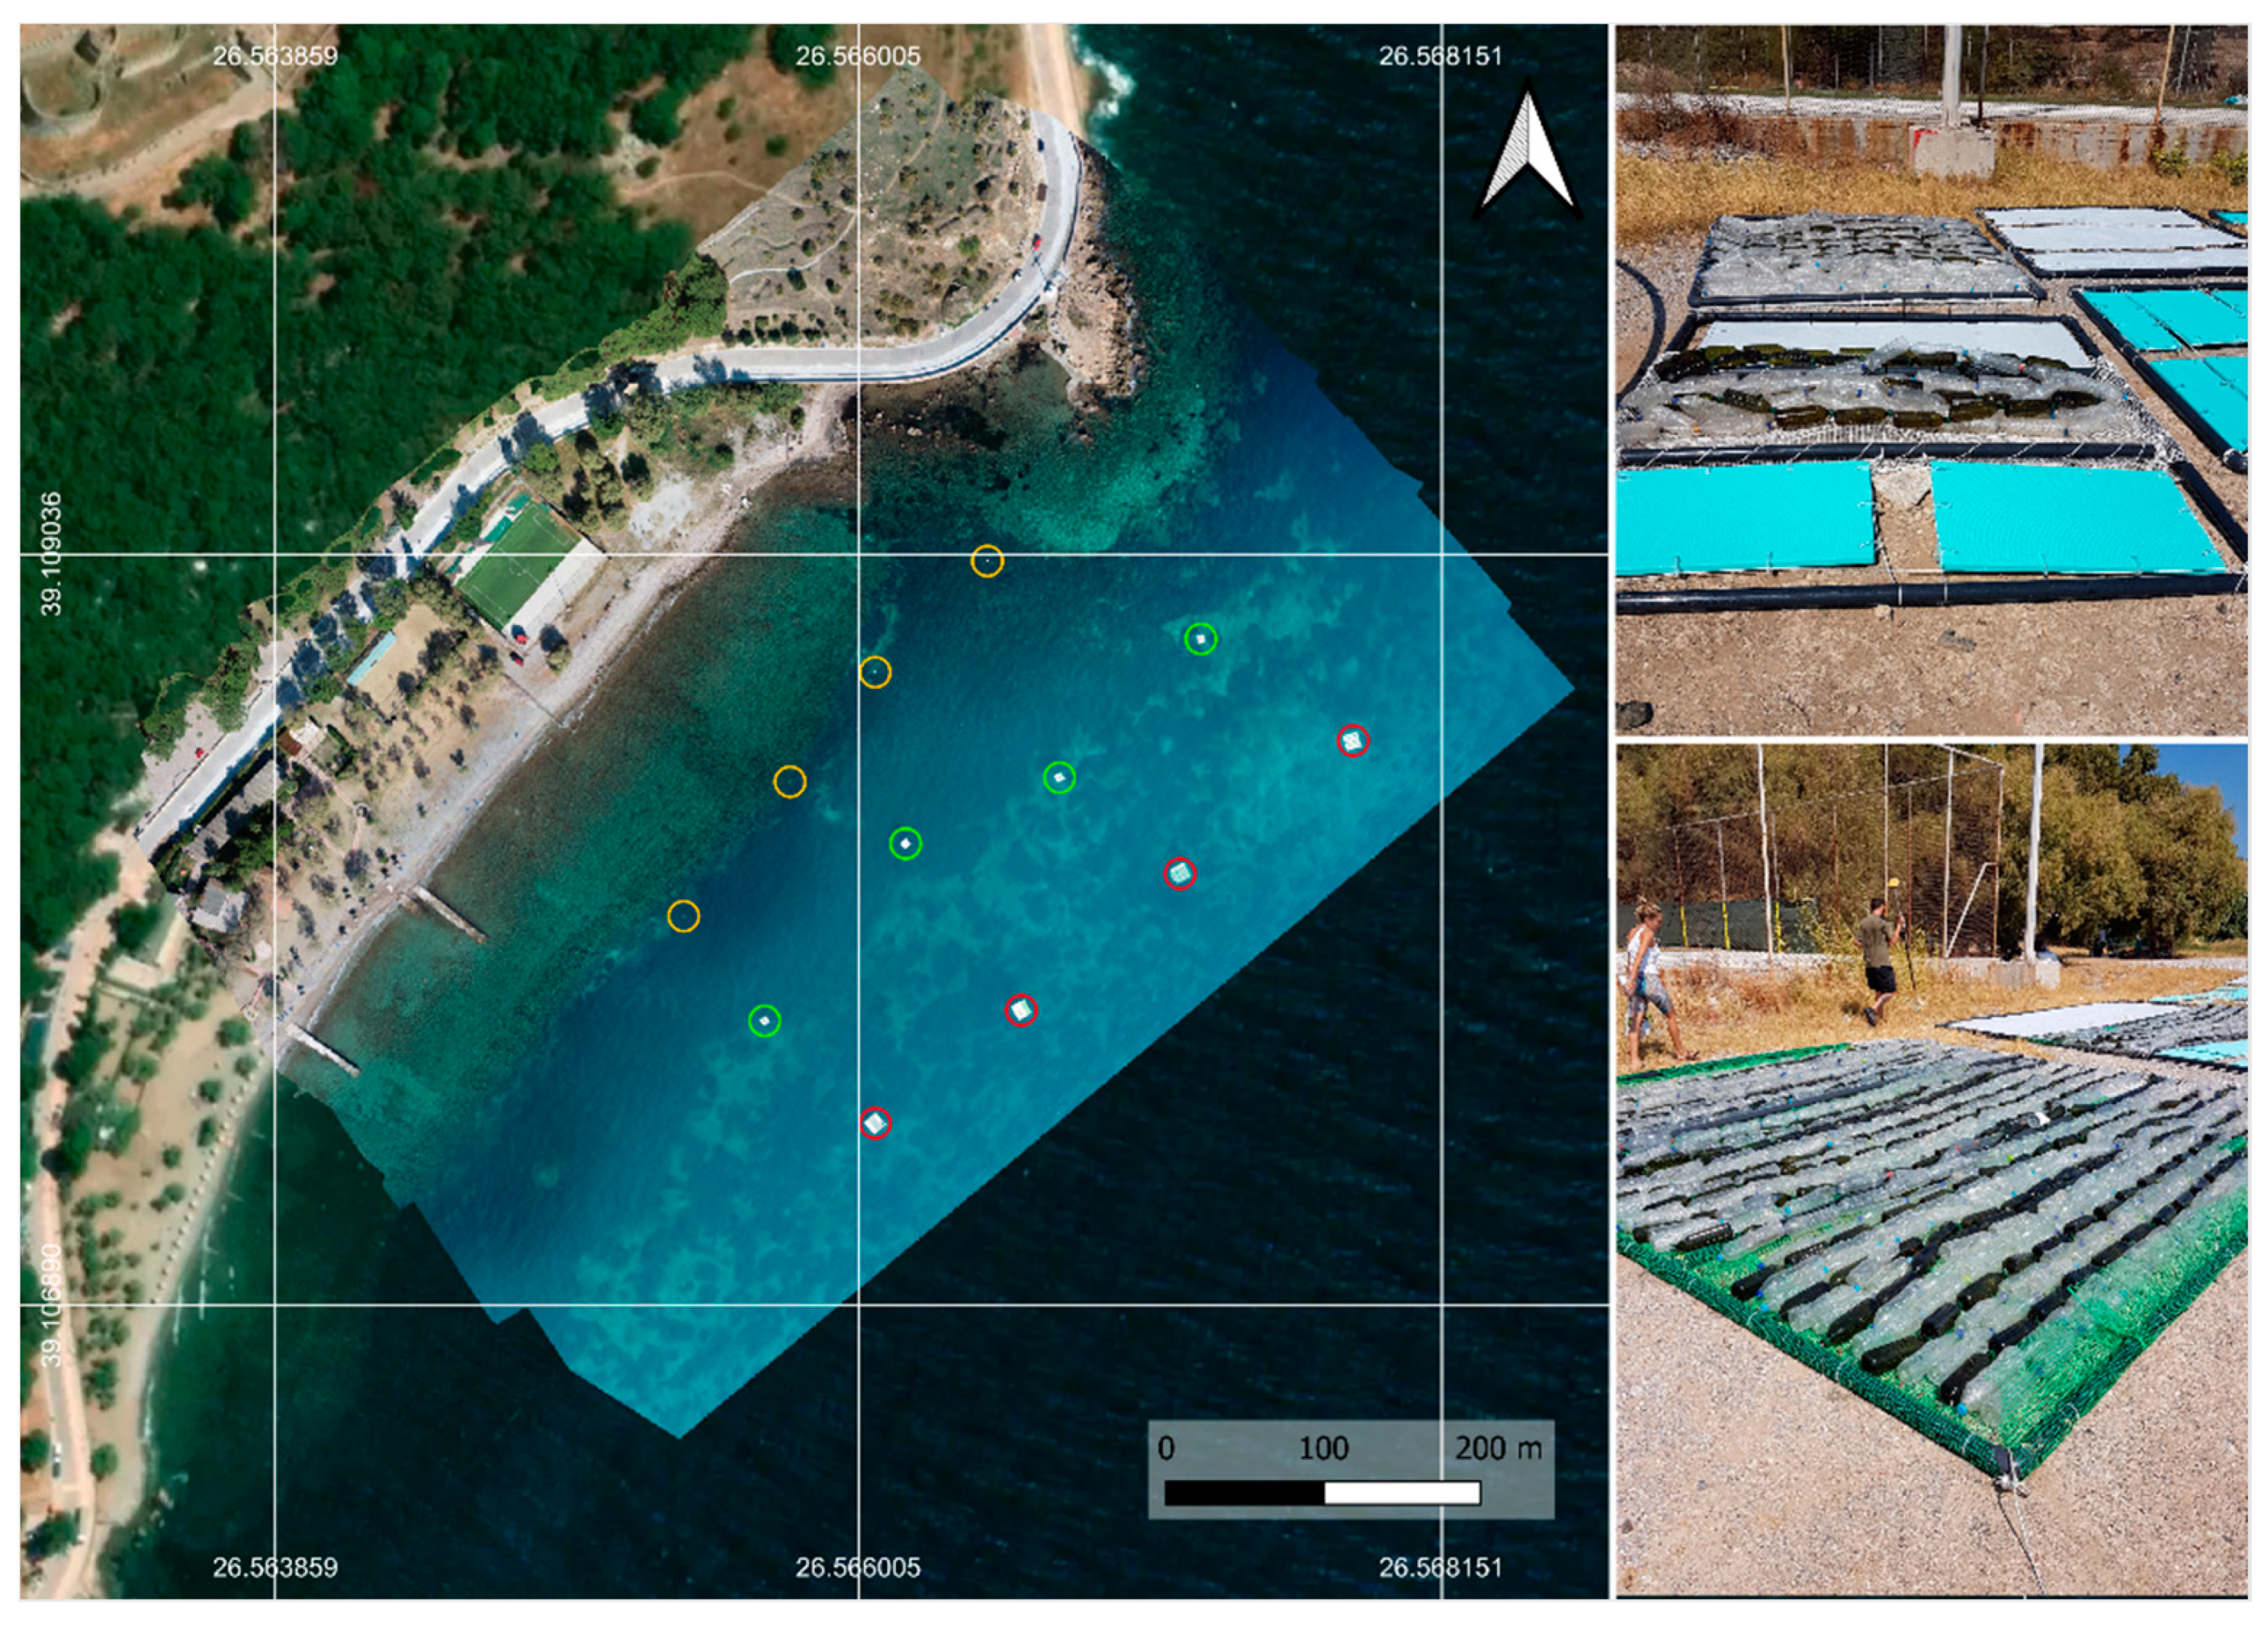
Twelve floating plastic targets were built for the controlled experiments (
Figure 2). The targets were square in shape and made in three different sizes. For each size, four targets were built with four different plastic materials: three targets were made of high-density polyethylene (HDPE) (tarps in white, yellow, and green); three targets were made using polyethylene terephthalate (PET) (transparent water bottles, green oil bottles), three targets were made using polystyrene (PS) (sheets for building insulation, in cyan), and three targets were composed of all the above materials over an equal surface area. The specifications of the 12 plastic targets are reported in
Table 1, and fully described in [
17]. The different sizes were defined based on the spatial resolution that was expected to be achieved with the pan sharpening on PRISMA images, and the lowest possible threshold of accumulation size detectable with these input data was identified. The various plastic materials were chosen to cover all of the most diffused materials dispersed in the marine environment. The 12 targets were placed offshore and onshore during four PRISMA passages over the study sites (
Figure 1). The Global Positioning System (GPS) coordinates of the plastic targets were collected during controlled experiments.
2.1.3. Satellite Data and Pre-Processing
In this study, data acquired by the new hyperspectral satellite PRISMA were used. PRISMA was developed and operated by the Italian Space Agency in 2019. It records data in the 400–2500 nm spectral window with 239 bands (66 bands in the VNIR and 173 in the SWIR range), with a spectral resolution of less than 12 nm and a spatial resolution of 30 m. The satellite also records a single panchromatic (PAN) band in the 400–700 nm spectral window at a spatial resolution of 5 m. PRISMA’s relook time is approximately 29 days. The technical characteristics of PRISMA are reported in
Table 2.
L1 products were exploited, as the atmospheric correction of L2D products affects image radiometry over water bodies. All collected PRISMA data were pre-processed with image fusion techniques to obtain pan-sharpened images with higher spatial resolution than the initial high-spectral-resolution images, fully exploiting PRISMA’s panchromatic band at a 5 m spatial resolution. Image fusion techniques were applied to increase the sensor detectability of marine plastic litter (
Figure 3 and
Figure 4). The pan sharpening was performed using the Principal Component Analysis (PCA) substitution method, reaching a spatial resolution of 5 m [
18]. Bands with a low signal-to-noise ratio were removed. The removed bands were affected by high atmospheric absorption between 1350 and 1470 nm and between 1800 and 1970 nm. Thus, the final pre-processed data consisted of 175 bands (from 239) and a spatial resolution of 5 m. More details on data acquisition and pre-processing of the data utilised are reported in [
17]. A summary of all PRISMA acquisitions is reported in
Table 3.
The study consisted of two phases: the configuration and validation phases. The configuration phase was performed on Tsamakia Beach (
Figure 1). During this phase, plastic targets were placed offshore and onshore. Four PRISMA images were collected: two images with targets offshore and two images with targets onshore. The offshore target images were used as input data to train ML algorithms to detect and recognise plastic pixel spectral behaviours. No information from onshore targets was used as input data; however, these two images were used as a preliminary crosscheck to ensure that no plastic pixels were detected offshore by ML algorithms.
The validation phase was conducted in Geras Gulf (
Figure 1). New PRISMA data were collected with plastic targets placed offshore. The ML algorithms trained during the configuration phase were run with the new images during the validation phase.
For both applied ML methodologies, all parameters were calibrated on a subset of input data, covering the plastic targets and nearby pixels, for both satellite data collected with targets offshore.
Moreover, the two subsets were concatenated and normalised using a master image (i.e., the PRISMA image acquired on 18 September 2020) (
Figure 5). As the main goal of this study was to verify the possibility of distinguishing the spectral signals of plastic targets from other signals, the first step was the normalisation of the two PRISMA subsets using a histogram normalisation algorithm [
19]. By applying this technique, it was possible to modify the histogram of each band of the second image (slave) using the histogram shape of each band of the first image (master). Thus, the digital numbers of the two types of data were more comparable and less affected by local or temporal features.
Because of the high number of correlated bands of the input PRISMA images and to help the unsupervised algorithm to efficiently distinguish between different spectral behaviours, the K-Means was applied after the dimensionality reduction for each pixel. Conversely, the LGBM was applied to the entire spectral information given the availability of ground truth data (i.e., pixels containing plastic materials), as the GPS coordinates of offshore targets were known. Before running the K-Means algorithm, different combinations of pre-processing steps to reduce correlated bands were applied.
Two different combinations of pre-processing were tested for K-Means: a feature extraction algorithm using PCA, and a feature selection method that exploited a subset of the spectral bands. Using PCA, the data can be described using the first four Principal Components that represent 99% of the explained variance, while for the feature selection, one of every four bands is taken into account to remove highly correlated bands and preserve the shape of spectral signatures.
2.2. Machine Learning Methodologies
Two different ML algorithms were used to detect artificial plastic targets offshore. The first is an unsupervised ML algorithm among the clustering methods called K-Means [
20]. K-Means is an incremental approach to performing clustering. It can identify similar behaviours and group them in a cluster using the nearness to the principal point (centroid) based on specified metrics. The K-Means guarantees the method’s applicability even with a new and different plastic target than the ones made for this study. The major issue in using K-Means is finding the correct value of the K parameter and the optimal number of clusters (or groups) accurately describing the variability of data. The silhouette analysis [
21] was used to identify the correct number of clusters. The second ML algorithm is a supervised algorithm among the Decision Tree methods, termed the Light Gradient Boosting Model (LGBM) [
22]. Due to the small number of pixels representing plastic materials in the collected PRISMA data, an unsupervised method was preferred. Unsupervised methods can extract hidden patterns directly from raw input data without the need for ground truth.
Nevertheless, the accuracy obtained with unsupervised algorithms is lower than the accuracy reached using supervised methodologies, which adopt labelling. On the other hand, supervised methods can automatically identify complex relationships between input data and ground truth. Thus, both methodologies were applied to output the final probability mask of plastic presence to increase the accuracy of results. For the supervised approach, four labelling classes were considered: land, shallow waters, deep waters, and plastic targets. The four classes were manually detected through photo interpretation, and the plastic pixels were extracted using only medium and large targets (
Table 4). For the latter, GPS coordinates collected during controlled experiments were exploited.
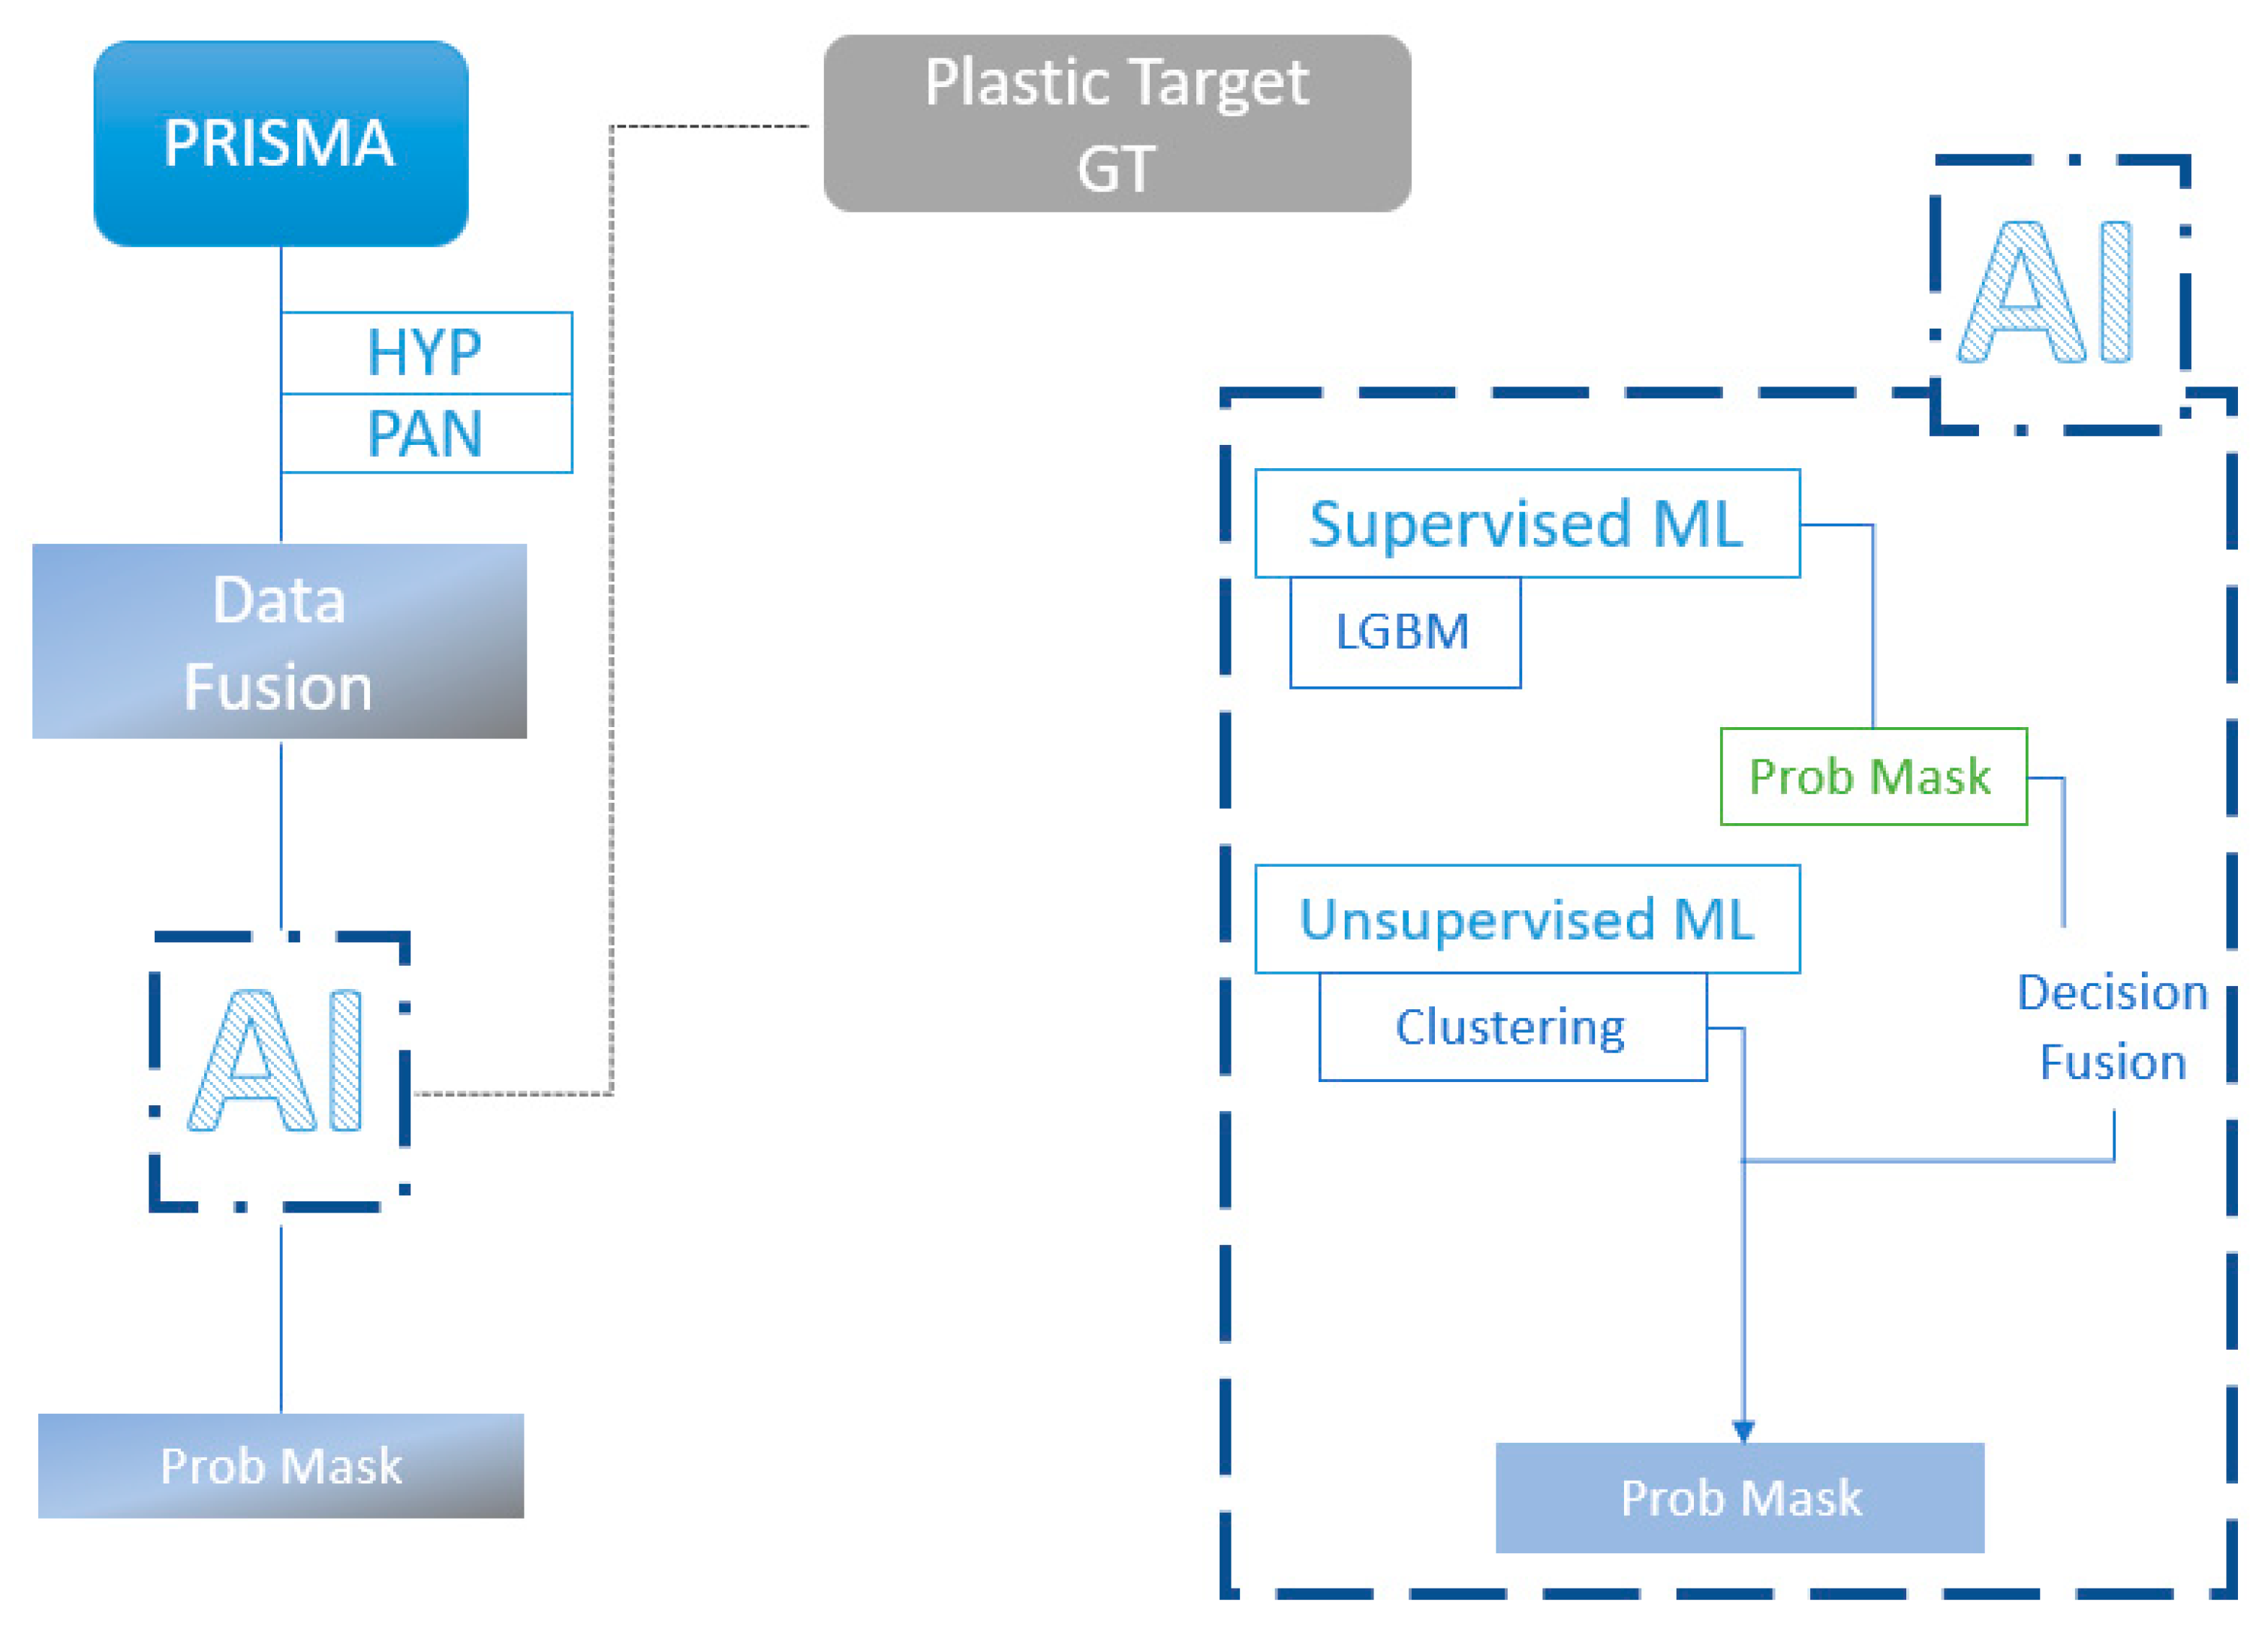
In the first step of the workflow, the K-Means was applied, and the optimal number of clusters was set to eight through the silhouette analysis. The K-Means was applied twice: in the first case, following the dimensionality reduction in input images through the PCA; in the second case, reducing input images through band sub-sampling (retaining one of every four bands) and after feature selection. In the first instance, the K-Means detected 8 of 12 targets (medium-size T-2x to large T-1x size), while in the second the K-Means extracted 9 of 16 targets (7 large T-1x and 2 medium T-2x from the concatenated images). In both cases, the K-Means was not capable of detecting small targets, and issues arose in distinguishing between plastic targets in shallow waters. Thus, preliminary masking of land and shallow waters was required. In the second step of the workflow, the LGBM was applied. The algorithm was trained on a dataset subset (80%), whilst validation was performed on the remaining dataset subset (20%) to compute accuracy and avoid overfitting. The final probability map was outputted by combining results from the K-Means with band sampling and from the LGBM, based on their accuracy as follows:
where coKM is the internal consistency of the K-Means; oaLGBM is the overall accuracy of the LGBM; wKM is the weight assigned to the K-Means; and wLGBM is the weight assigned to the LGBM. The entire workflow is illustrated in
Figure 6.
Each algorithm was independently applied to the images, and the final map was generated using the sum of the weights (
Figure 7).
In a later stage, the pre-trained K-Means and LGBM algorithms were applied to the other two satellite data collected during the configuration phase with the plastic onshore targets (
Table 3). This test served as preliminary testing of the trained algorithms, which successfully did not detect any false-positive plastic pixels offshore. It is important to highlight that the normalisation of input data was essential to obtain meaningful and comparable results. The PRISMA images with the onshore targets were normalised using the same master image employed in the training phase.
3. Results
During the configuration phase of the study, the output probability map was able to highlight plastic targets offshore. The computed LGBM overall accuracy referred to the ground truth samples only and not to the whole map. To perform a quantitative analysis, a threshold was set to binarise the map, and the overall accuracy was performed on the entire map. Based on the test results, the threshold was set to 0.6. Thus, if a pixel value of the output map was greater than or equal to 0.6, the pixel was assigned to “Class 1”—“Plastic”; otherwise, it was assigned to “Class 0”—“No Plastic”. To compare the results, the ground truth was built as follows: five pixels of Class 1 were selected around the GPS coordinates of big targets, and one pixel of Class 1 was selected around the GPS coordinates of medium targets, by taking advantage of photo interpretation. The other pixels of the ground truth map were assigned to Class 0. The true-positive results are shown in
Table 5, where overall accuracy was 72.92%.
The true-positive results show that the proposed method can effectively detect floating objects offshore. In fact, considering only the central points of the targets as ground truth, 13 of 16 objects were highlighted. On the other hand, there were some commission errors. Different points on the map were classified as “Class 1”, but were mostly isolated points with low probability. It is clear that the score coming from the unsupervised method was not significant with respect to the supervised method. Nevertheless, to perform the proposed method in different zones, the contribution of the K-Means can enable achieving high accuracy in the presence of a previously unidentified and different object. To confirm these sound and promising results, the workflow presented was applied to another location (validation phase) where the exact position of the target was unknown (
Figure 1 and
Figure 8), and two new PRISMA images were collected with the offshore targets (
Table 3). During the validation phase two, more large circular targets were placed in the Geras Gulf, one made of wood and the second of plastics [
23]. The new data were acquired in a different season, under different light conditions, showing different histograms and different spectral characteristics than the images collected and exploited in the configuration phase.
Two tests were conducted within the validation phase. Supervised and unsupervised ML algorithms trained during the configuration phase were applied to the new PRISMA images for the first test.
Figure 9 shows the output of the first test run on the satellite data collected on 23 June 2021. In this case, pre-trained K-Means and LGBM detected three floating objects (probably boats) on the surface of
Figure 9 and two targets (one plastic and one wooden) on the bottom. It is worth noting that it was possible to remove several false positives using probability values. Domain experts can move the probability threshold to highlight the desired output. Preliminary masking of land and shallow waters was required to overcome a few open issues near the coastline.
Figure 10 shows the output of the first test, run on the satellite data collected on 29 June 2021. In this case, no relevant results were obtained. The probability map (
Figure 10a) did not highlight significant floating objects. This could be related to ML architecture: the new data might have values far different from data values collected during the configuration phase. Moreover, the new data values might not show enough variability compared to the data values of the configuration phase. Furthermore, atmospheric conditions might have played a significant role.
A second test was performed to solve issues that arose with the first test and to better investigate the effect of training data augmentation on the final results. The K-Means and LGBM were re-trained with three images for the second test: two images collected during the configuration phase plus a third from the validation phase, collected on 23 June 2021. The third image was used to increase the number of plastic pixels in training the LGBM algorithm. LGBM was trained on a dataset subset (80%), whilst the validation was performed on the remaining dataset subset (20%) to compute accuracy and avoid overfitting.
Figure 11 shows notable improvement compared to
Figure 10.
4. Discussion
Two different phases were composed in this work, the configuration phase and the validation phase. In the configuration phase, the methodology was set to build as general a method as possible using a combination of two ML methods. The configuration phase shows the capability of the proposed method to detect floating objects and distinguish the spectral behaviour of shallow water. Furthermore, despite the small size of the medium targets (~2.4 m × 2.4 m) compared to the sensor resolution (5 m × 5 m), the proposed method was able to detect six of eight targets.
Hence, it is clear that during the configuration phase, the unsupervised method alone was not enough to reach high accuracy. The results suggest that the supervised method (LGBM) is sufficient in the presence of more ground truth data; in fact, LGBM’s overall accuracy was about 96%, and all plastic targets (from medium to large) were efficiently detected. Nevertheless, with the two methods combined, system operability was always guaranteed and independent of ground truth availability. If only the K-Means was used, several false positives would have been generated. The combination of the K-Means and LGBM helped us to reach accurate results.
The validation phase was used to understand if the proposed method had the necessary generality in terms of applications. In fact, to ensure that overfitting was avoided, the method was applied in an independent area. The result shows that floating objects were correctly detected (in the second test). Applying K-Means, the third acquisition was used to increase the available information on plastic behaviour. Eventually, the re-trained algorithms were applied to the satellite image of the validation phase collected on 29 June 2021, and the final probability map was output as previously described in the configuration phase. Some false positives remained, but floating objects (
Figure 11a) and bigger targets (
Figure 11b) were detected with higher accuracy than in the first test. It appears that using more data in training ML algorithms allows for the detection of generic floating objects and plastic targets to be improved.
5. Conclusions
The remotely sensed detection of accumulated plastic litter in the marine environment remains a challenge due to the paucity of data availability and spatial and spectral resolutions. Remote sensing applied to marine plastic litter detection is still in its early stages, but is an active hot research topic. Nevertheless, the detection of plastic accumulation and spatial distribution can be essential for effective environmental monitoring in the hands of regional and national agencies within the framework of domestic and international regulations. It can represent the starting point for identifying areas prone to plastic litter accumulation and evaluating the status of plastic pollution in marine areas.
The in situ detection of plastic accumulation for monitoring large surfaces raises certain difficult issues given the narrow perspective applied to solve a global environmental problem, the extreme spatial dynamicity of marine plastic pollution, and the financial resources invested. Satellite data can be of help in this context. However, the availability of satellite imagery to detect actual plastic accumulation with the proper spatial and spectral resolutions, which are cloud-free and collected under good sea weather conditions, are the main drawbacks of remotely sensed optical data. Moreover, these drawbacks slacken the pace of research and development activities regarding this research topic.
The availability of new hyperspectral satellites, such as PRISMA, designed by the Italian Space Agency, that collect data at high spectral resolution (i.e., 239 hyperspectral bands plus a panchromatic band) and medium spatial resolution (i.e., 30 m for the hyperspectral cube and 5 m for the panchromatic band) together with ML algorithms creates room for improvement.
This work aimed to develop a new method, based on a combination of two ML techniques, one unsupervised (K-Means) and the other supervised (LGBM), to detect 12 plastic targets offshore by exploiting pan-sharpened PRISMA hyperspectral data. K-Means alone detected eight of twelve targets, from 2.4 m to 5.1 m in size, while LGBM detected all plastic targets (from 0.6 m to 5.1 m), reaching an overall accuracy of 96%. Finally, the two methods were combined to guarantee operability and extend the capability of detecting different spectral behaviours of the same object under different probable conditions during satellite sensing. Furthermore, the combination of K-Means and LGBM helped to enhance the distinction between floating objects and shallow water.
The results show the capability of the proposed method to detect floating objects offshore. Furthermore, the combination of unsupervised and supervised algorithms was able to reduce false positives, which allows this method to become a supportive tool for domain experts.
Despite the small number of satellite input data, the study showed that the new approach applied to PRISMA hyperspectral data can effectively identify plastic floating marine objects larger than 2.4 m. Furthermore, the study suggests that training ML algorithms with a more robust satellite dataset using plastic materials can improve the performance of this novel method, reducing false positives such as boats or those caused by sunglint. Increasing the satellite dataset with floating plastic material would also allow the exploration of Deep Learning methodologies, such as Generative Adversarial Networks, and the implementation of different ML algorithms.
Author Contributions
Conceptualisation, N.T. and A.A.; methodology, N.T. and G.C.; software, N.T.; validation, M.K., V.K. (Viktoria Kristollari), P.K., V.K. (Vassilia Karathanassi) and E.B.; formal analysis, N.T., A.A., G.C., M.K., V.K. (Viktoria Kristollari), P.K., V.K. (Vassilia Karathanassi) and E.B.; investigation, N.T., A.A., G.C., M.K., V.K. (Viktoria Kristollari), P.K., V.K. (Vassilia Karathanassi) and E.B.; resources, N.T., A.A., G.C., M.K., V.K. (Viktoria Kristollari), P.K., V.K. (Vassilia Karathanassi) and E.B.; data curation, N.T., M.K., V.K. (Viktoria Kristollari) and P.K.; original draft preparation, A.A. and N.T.; review and editing, A.A., N.T., G.C., M.K., V.K. (Viktoria Kristollari), P.K., V.K. (Vassilia Karathanassi) and E.B.; visualisation, N.T. and A.A.; supervision, A.A., G.C. and V.K. (Vassilia Karathanassi); project administration, A.A.; funding acquisition, A.A. All authors have read and agreed to the published version of the manuscript.
Funding
This work was supported by the Discovery Element of the European Space Agency’s Basic Activities under ESA Contract 4000131235/20/NL/GLC (REACT Project: Crowdsourcing, Copernicus and Hyperspectral Satellite Data for Marine Plastic Litter Detection, Quantification and Tracking) and, in part, by the Discovery Element of the European Space Agency’s Basic Activities under ESA Contract 4000131040/20/NL/GLC (Plastic Litter Project: Detection and monitoring of artificial plastic targets with satellite imagery and UAV).
Data Availability Statement
Not applicable.
Acknowledgments
We wish to thank Konstantinos Topouzelis from the Department of Marine Sciences, University of the Aegean, for supporting plastic target preparation and field activities during the controlled experiments. The authors are grateful to the anonymous reviewers of this paper for their constructive comments and valuable suggestions, which greatly improved the quality of the manuscript.
Conflicts of Interest
The authors declare no conflict of interest. The funders had no role in the design of the study; in the collection, analyses, or interpretation of data; in the writing of the manuscript; or in the decision to publish the results.
References
- Geyer, R. Production, Use, and Fate of Synthetic Polymers. In Plastic Waste and Recycling; Elsevier: Amsterdam, The Netherlands, 2020; pp. 13–32. ISBN 9780128178805. [Google Scholar]
- Casoli, G.; Ramkumar, S. Plastic Pollution in the Oceans: A Systemic Analysis—Status Quo and Possible Sustainable Solutions. In Mare Plasticum—The Plastic Sea; Streit-Bianchi, M., Cimadevila, M., Trettnak, W., Eds.; Springer International: Cham, Switzerland, 2020; pp. 221–243. ISBN 9783030389444. [Google Scholar]
- European Environment Agency. The European Environment—State and Outlook 2020—Knowledge for Transition to a Sustainable Europe; Publications Office: Luxembourg, 2019. [Google Scholar] [CrossRef]
- Kershaw, P. Marine Plastic Debris and Microplastics: Global Lessons and Research to Inspire Action and Guide Policy Change; United Nations Environment Programme: Nairobi, Kenya, 2016. [Google Scholar]
- Rochman, C.M.; Browne, M.A.; Halpern, B.S.; Hentschel, B.T.; Hoh, E.; Karapanagioti, H.K.; Rios-Mendoza, L.M.; Takada, H.; Teh, S.; Thompson, R. Classify plastic waste as hazardous. Nature 2013, 494, 169–171. [Google Scholar] [CrossRef] [PubMed]
- Thevenon, F.; Carroll, C.; Sousa, J. Plastic Debris in the Ocean the Characterization of Marine Plastics and Their Environmental Impacts, Situation Analysis Report; IUCN: Gland, Switzerland, 2014; ISBN 9782831716961. [Google Scholar]
- Vethaak, A.D.; Leslie, H.A. Plastic Debris Is a Human Health Issue. Environ. Sci. Technol. 2016, 50, 6825–6826. [Google Scholar] [CrossRef] [PubMed] [Green Version]
- Campos-Taberner, M.; García-Haro, F.J.; Martínez, B.; Izquierdo-Verdiguier, E.; Atzberger, C.; Camps-Valls, G.; Gilabert, M.A. Understanding deep learning in land use classification based on Sentinel-2 time series. Sci. Rep. 2020, 10, 17188. [Google Scholar] [CrossRef] [PubMed]
- Gong, Y.; Xiao, Z.; Tan, X.; Sui, H.; Xu, C.; Duan, H.; Li, D. Context-Aware Convolutional Neural Network for Object Detection in VHR Remote Sensing Imagery. IEEE Trans. Geosci. Remote Sens. 2020, 58, 34–44. [Google Scholar] [CrossRef]
- Amoroso, N.; Cilli, R.; Bellantuono, L.; Massimi, V.; Monaco, A.; Nitti, D.; Nutricato, R.; Samarelli, S.; Taggio, N.; Tangaro, S.; et al. PSI Clustering for the Assessment of Underground Infrastructure Deterioration. Remote Sens. 2020, 12, 3681. [Google Scholar] [CrossRef]
- Lary, D.J.; Zewdie, G.K.; Liu, X.; Wu, D.; Levetin, E.; Allee, R.J.; Malakar, N.; Walker, A.; Mussa, H.; Mannino, A.; et al. Machine Learning Applications for Earth Observation. In Earth Observation Open Science and Innovation; Mathieu, P.-P., Aubrecht, C., Eds.; Springer International: Cham, Switzerland, 2018; pp. 165–218. ISBN 9783319656328. [Google Scholar]
- Tsagkatakis, G.; Aidini, A.; Fotiadou, K.; Giannopoulos, M.; Pentari, A.; Tsakalides, P. Survey of Deep-Learning Approaches for Remote Sensing Observation Enhancement. Sensors 2019, 19, 3929. [Google Scholar] [CrossRef] [Green Version]
- Sannigrahi, S.; Basu, B.; Basu, A.S.; Pilla, F. Development of automated marine floating plastic detection system using Sentinel-2 imagery and machine learning models. Mar. Pollut. Bull. 2022, 178, 113527. [Google Scholar] [CrossRef]
- Basu, B.; Sannigrahi, S.; Basu, A.S.; Pilla, F. Development of Novel Classification Algorithms for Detection of Floating Plastic Debris in Coastal Waterbodies Using Multispectral Sentinel-2 Remote Sensing Imagery. Remote Sens. 2021, 13, 1598. [Google Scholar] [CrossRef]
- Gonçalves, G.; Andriolo, U.; Pinto, L.; Duarte, D. Mapping marine litter with Unmanned Aerial Systems: A showcase comparison among manual image screening and machine learning techniques. Mar. Pollut. Bull. 2020, 155, 111158. [Google Scholar] [CrossRef] [PubMed]
- International Ocean Colour Coordinating Group. Ocean Colour Bibliography. Available online: https://ioccg.org/resources/ocean-colour-bibliography/ (accessed on 4 April 2022).
- Kremezi, M.; Kristollari, V.; Karathanassi, V.; Topouzelis, K.; Kolokoussis, P.; Taggio, N.; Aiello, A.; Ceriola, G.; Barbone, E.; Corradi, P. Pansharpening PRISMA Data for Marine Plastic Litter Detection Using Plastic Indexes. IEEE Access 2021, 9, 61955–61971. [Google Scholar] [CrossRef]
- Loncan, L.; de Almeida, L.B.; Bioucas-Dias, J.M.; Briottet, X.; Chanussot, J.; Dobigeon, N.; Fabre, S.; Liao, W.; Licciardi, G.A.; Simoes, M.; et al. Hyperspectral Pansharpening: A Review. IEEE Geosci. Remote Sens. Mag. 2015, 3, 27–46. [Google Scholar] [CrossRef] [Green Version]
- Vij, K.; Singh, Y. Enhancement of images using histogram processing techniques. Int. J. Comp. Tech. Appl. 2009, 2, 309–313. [Google Scholar]
- MacQueen, J. Some methods for classification and analysis of multivariate observations. In Proceedings of the Fifth Berkeley Symposium on Mathematical Statistics and Probability, Berkeley, CA, USA, 21 June–18 July 1965 and 27 December 1965–7 January 1966; Le Cam, L.M., Neyman, J., Eds.; University of California Press: Berkeley, CA, USA, 1967; Volume 1, pp. 281–297. [Google Scholar]
- Rousseeuw, P.J. Silhouettes: A graphical aid to the interpretation and validation of cluster analysis. J. Comput. Appl. Math. 1987, 20, 53–65. [Google Scholar] [CrossRef] [Green Version]
- Ke, G.; Meng, Q.; Finley, T.; Wang, T.; Chen, W.; Ma, W.; Ye, Q.; Liu, T.Y. Lightgbm: A highly efficient gradient boosting decision tree. In Proceedings of the Advances in Neural Information Processing Systems 30 (NIPS 2017), Long Beach, CA, USA, 4–9 December 2017; Volume 30. [Google Scholar]
- Marine Remote Sensing Group. Plastic Litter Project 2021. Available online: https://plp.aegean.gr/plastic-litter-project-2021/ (accessed on 31 March 2022).
Figure 1.
Map of the south-eastern part of Lesvos Island (Greece), showing the study sites where controlled experiments were performed: Tsamakia Beach in Mytilene (red) and Geras Gulf (yellow). The configuration phase of this study was conducted on Tsamakia Beach, whilst the validation phase was performed in Geras Gulf.
Figure 2.
Unmanned Aerial Vehicle (UAV) image of large-sized (T-1x, red circles), medium-sized (T-2x, green circles), and small-sized (T-3x, yellow circles) floating plastic targets at Tsamakia Beach (Mytilene) on 22 October 2020 (sensing date) as well as details of the plastic targets during the construction stage. Due to their small sizes, the four small floating plastic targets (T-3x) were not clearly visible.
Figure 3.
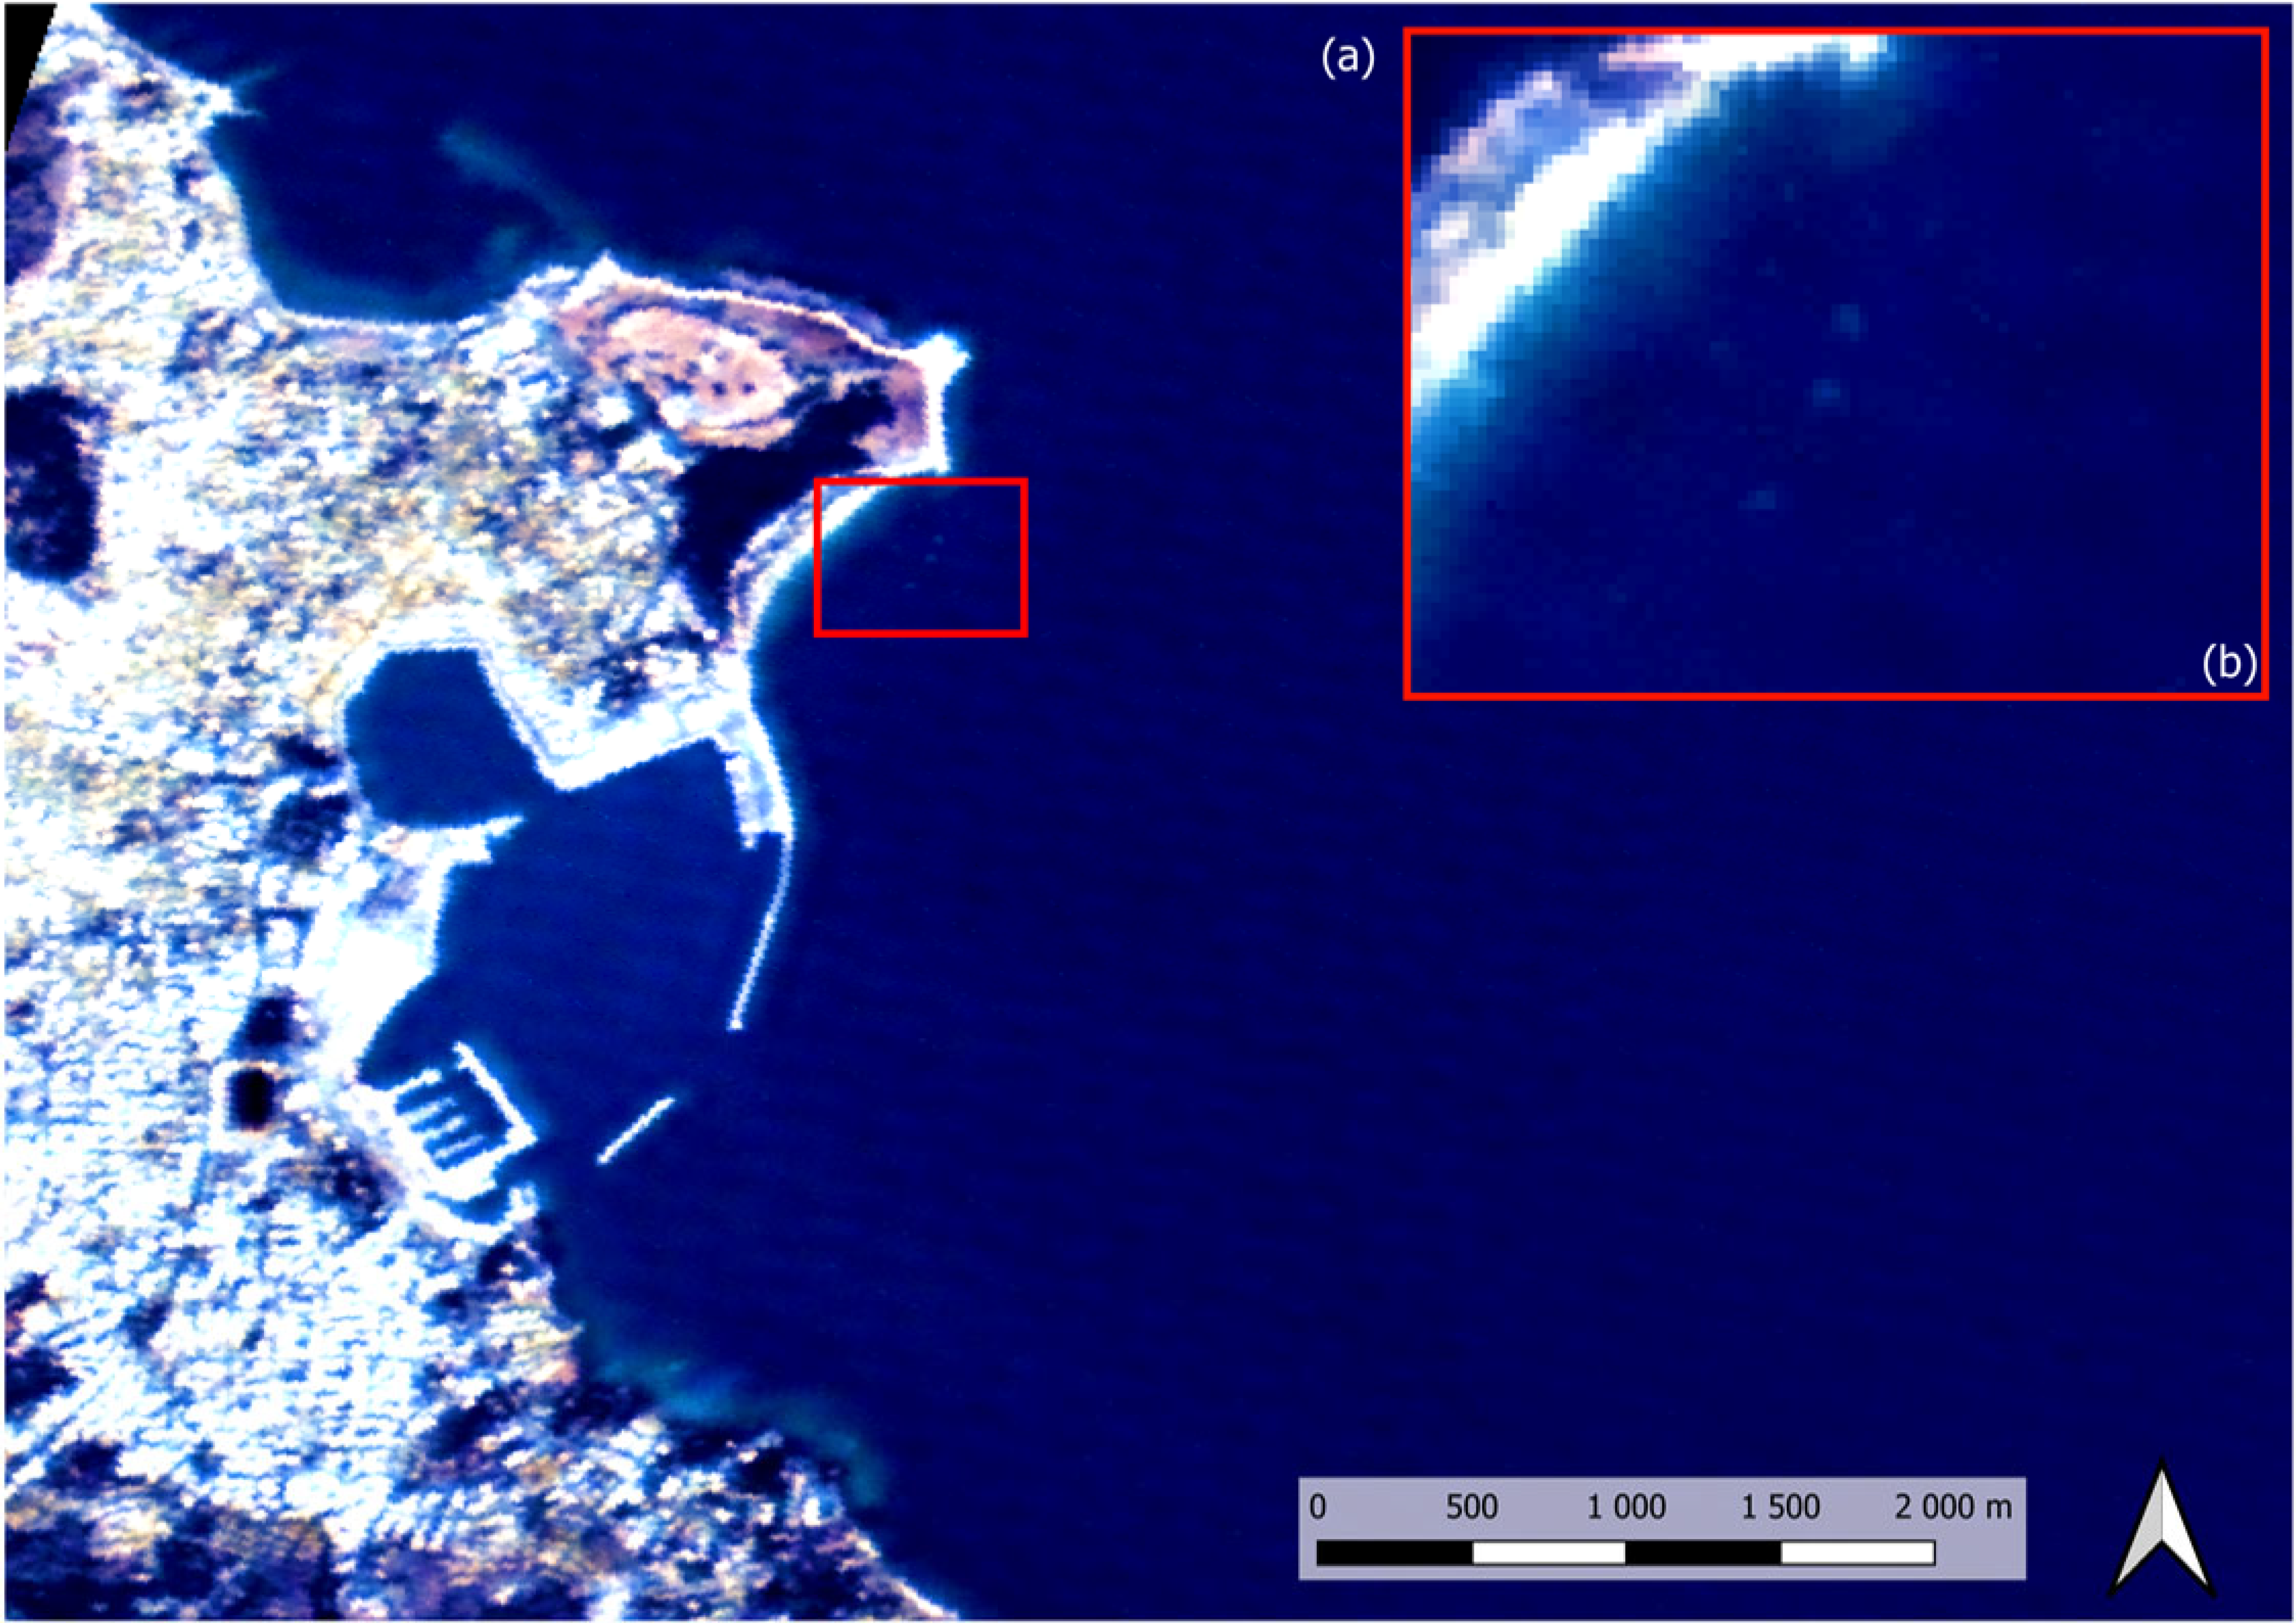
(a) Example of a subset of the entire Red–Green–Blue (RGB) pan-sharpened PRISMA acquisition with a 1001 × 1001 pixel and 5 m/pixel spatial resolution. (b) A zoomed-in image of the area of interest where plastic targets were placed.
Figure 3.
(a) Example of a subset of the entire Red–Green–Blue (RGB) pan-sharpened PRISMA acquisition with a 1001 × 1001 pixel and 5 m/pixel spatial resolution. (b) A zoomed-in image of the area of interest where plastic targets were placed.
Figure 4.
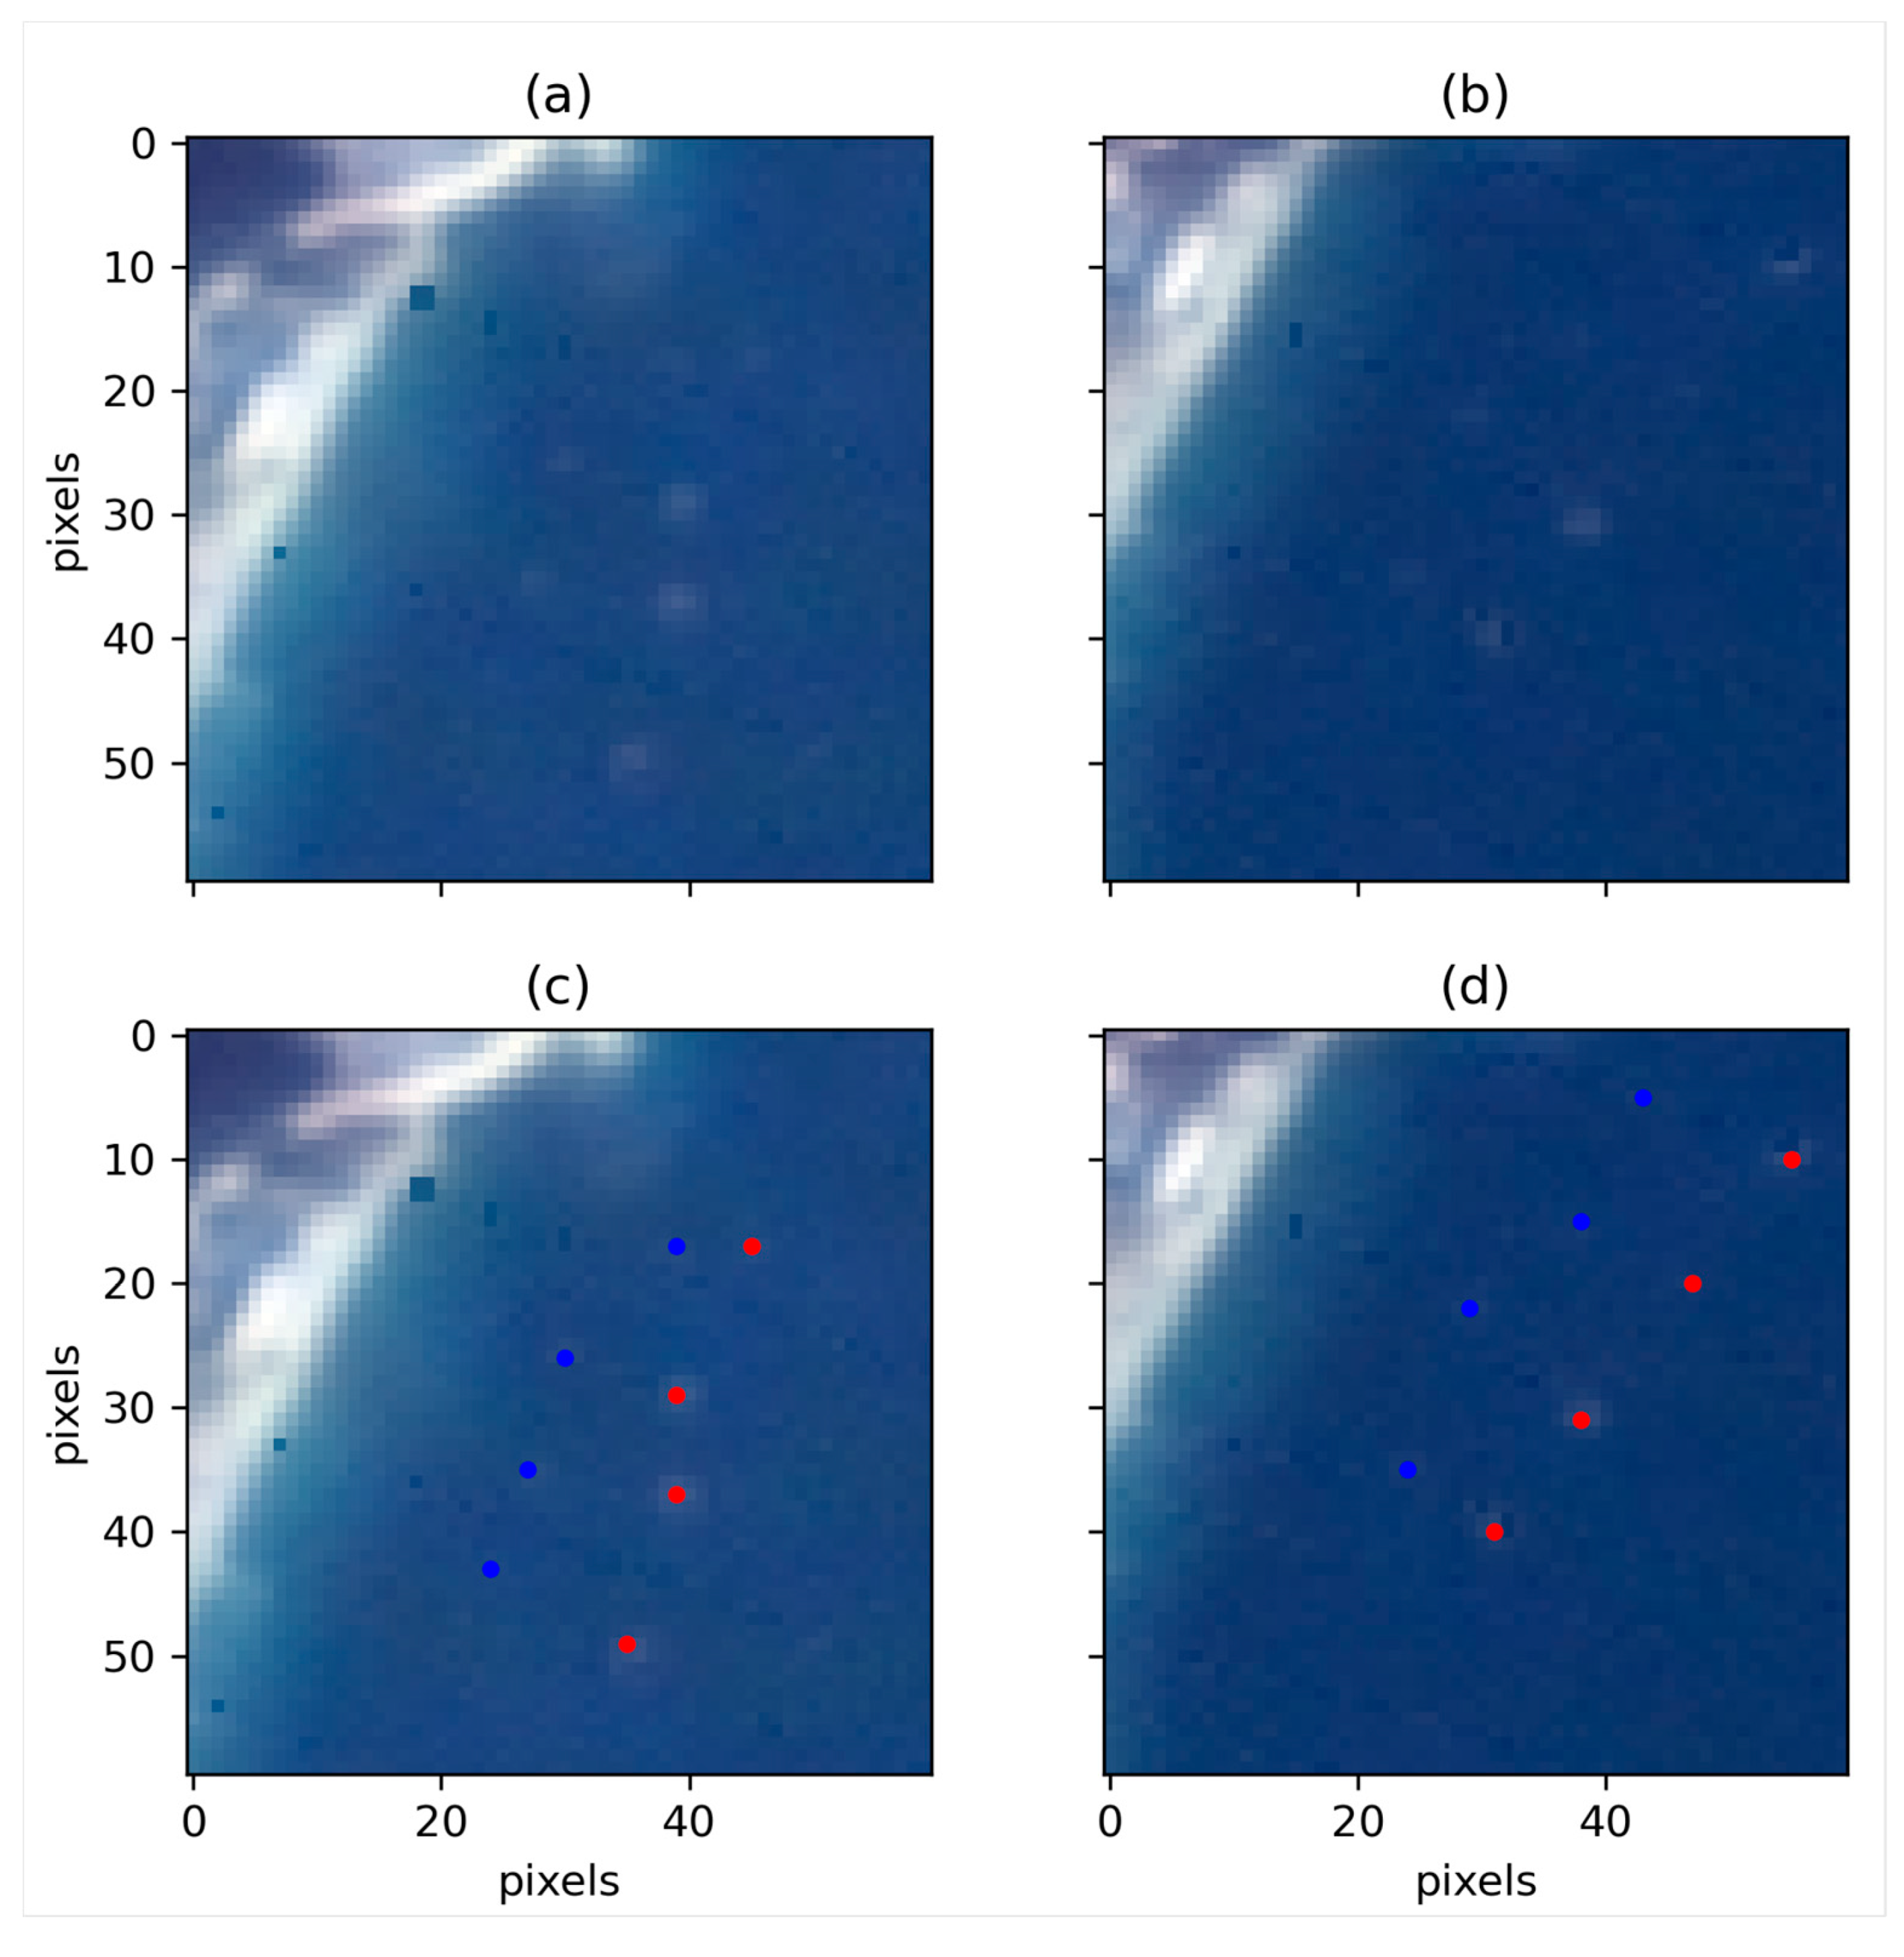
(
a) Subset of the pan-sharpened PRISMA data acquired on 18 September 2020; (
b) subset of the pan-sharpened PRISMA data acquired on 22 October; (
c,
d) indicate the positions of the large- and medium-size targets (T-1x in red and T-2x in blue as in
Table 1).
Figure 4.
(
a) Subset of the pan-sharpened PRISMA data acquired on 18 September 2020; (
b) subset of the pan-sharpened PRISMA data acquired on 22 October; (
c,
d) indicate the positions of the large- and medium-size targets (T-1x in red and T-2x in blue as in
Table 1).
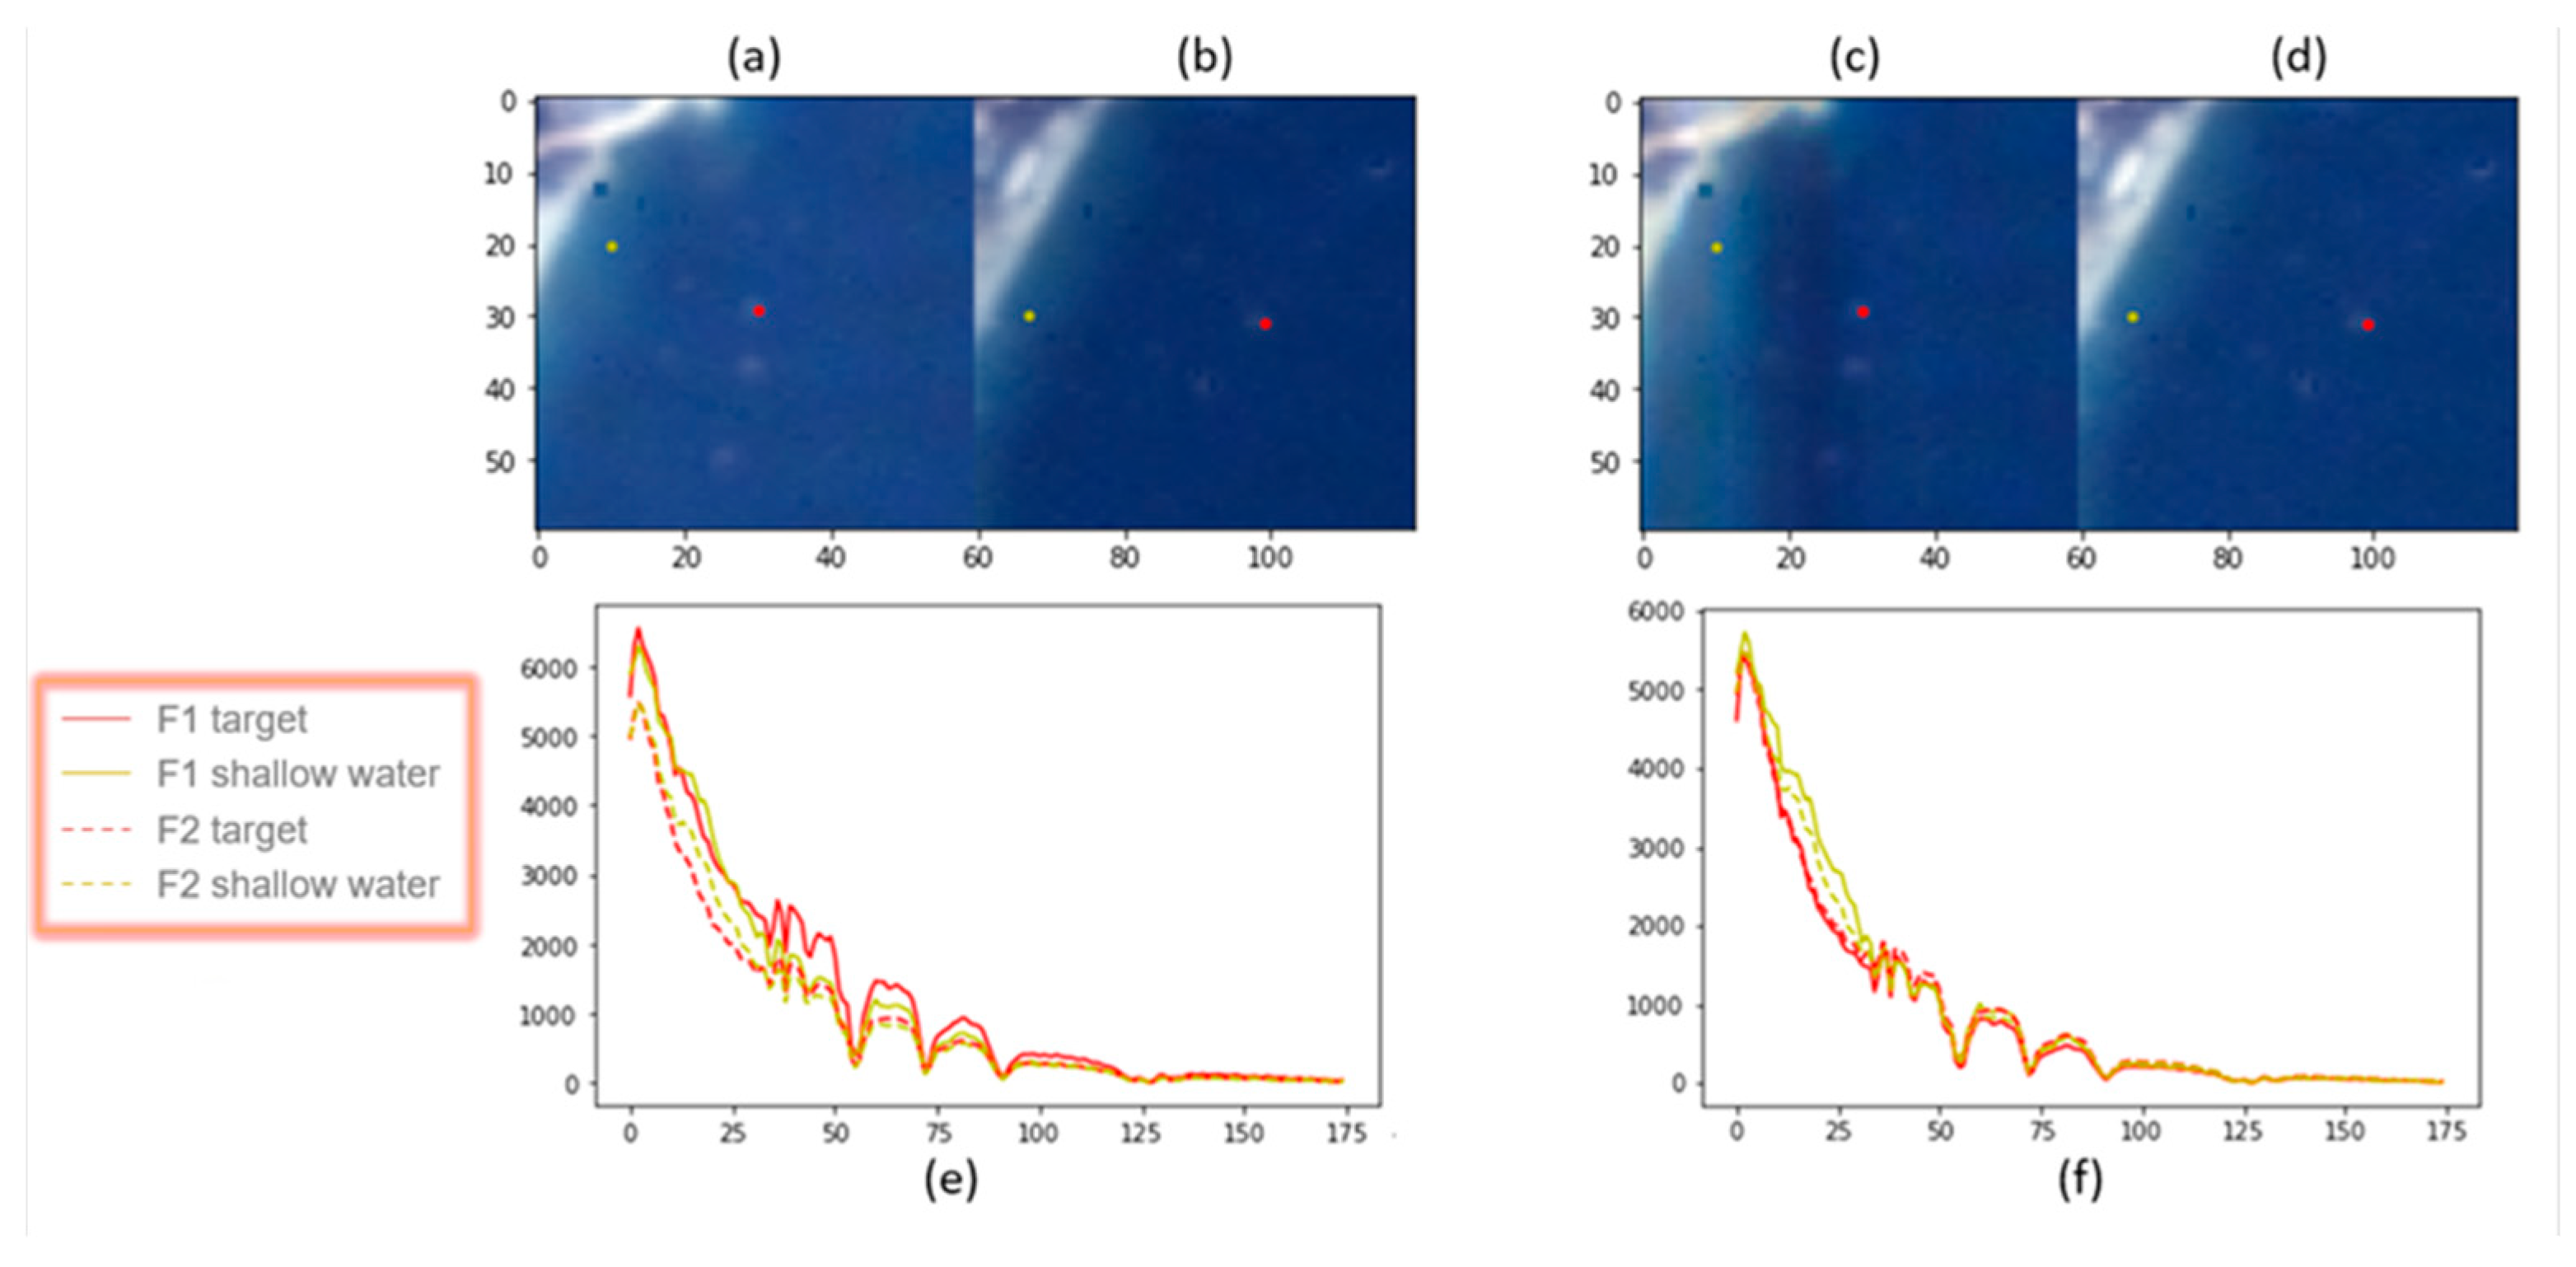
Figure 5.
(a,b) are the Red–Green–Blue (RGB) representation of satellite data before histogram normalisation: a pixel of the plastic target is highlighted in red, a pixel of shallow water is highlighted in yellow. (c,d) are the RGB representation of satellite data after histogram normalisation. (e,f) show how the spectral behaviour changed after the normalisation phase.
Figure 6.
Workflow of the proposed combination of ML algorithms for marine plastic litter detection exploiting hyperspectral PRISMA data.
Figure 6.
Workflow of the proposed combination of ML algorithms for marine plastic litter detection exploiting hyperspectral PRISMA data.
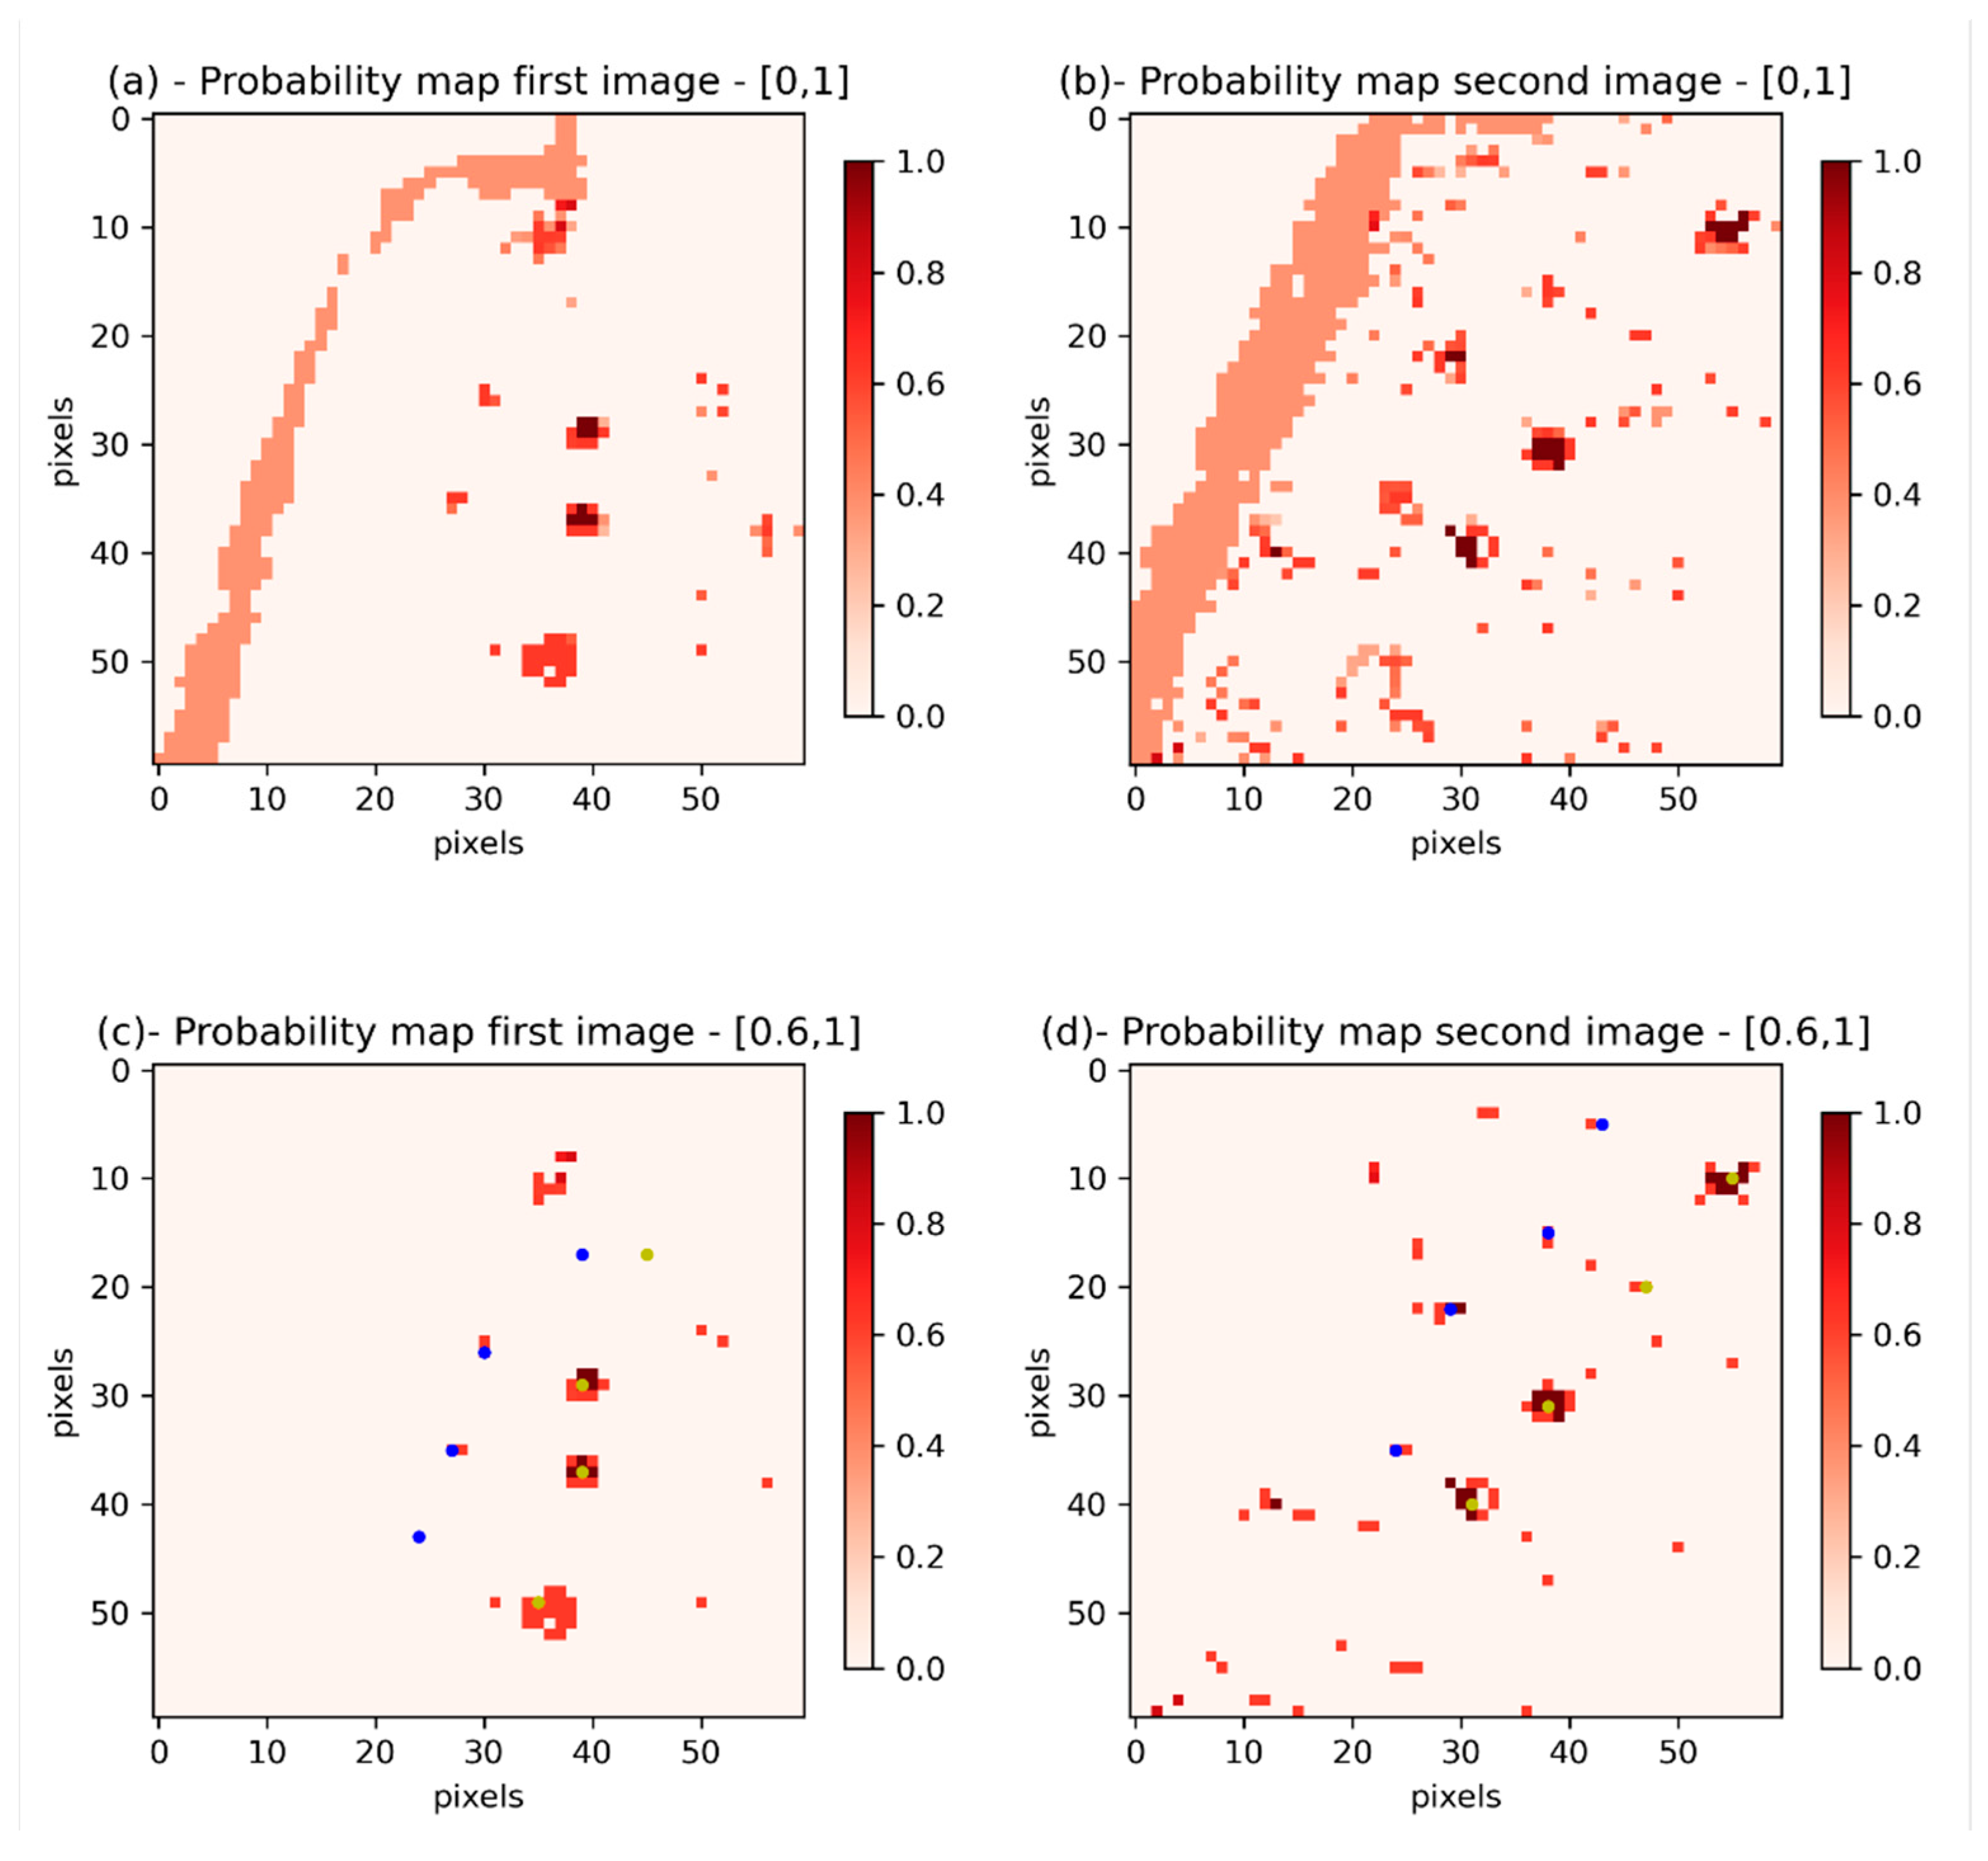
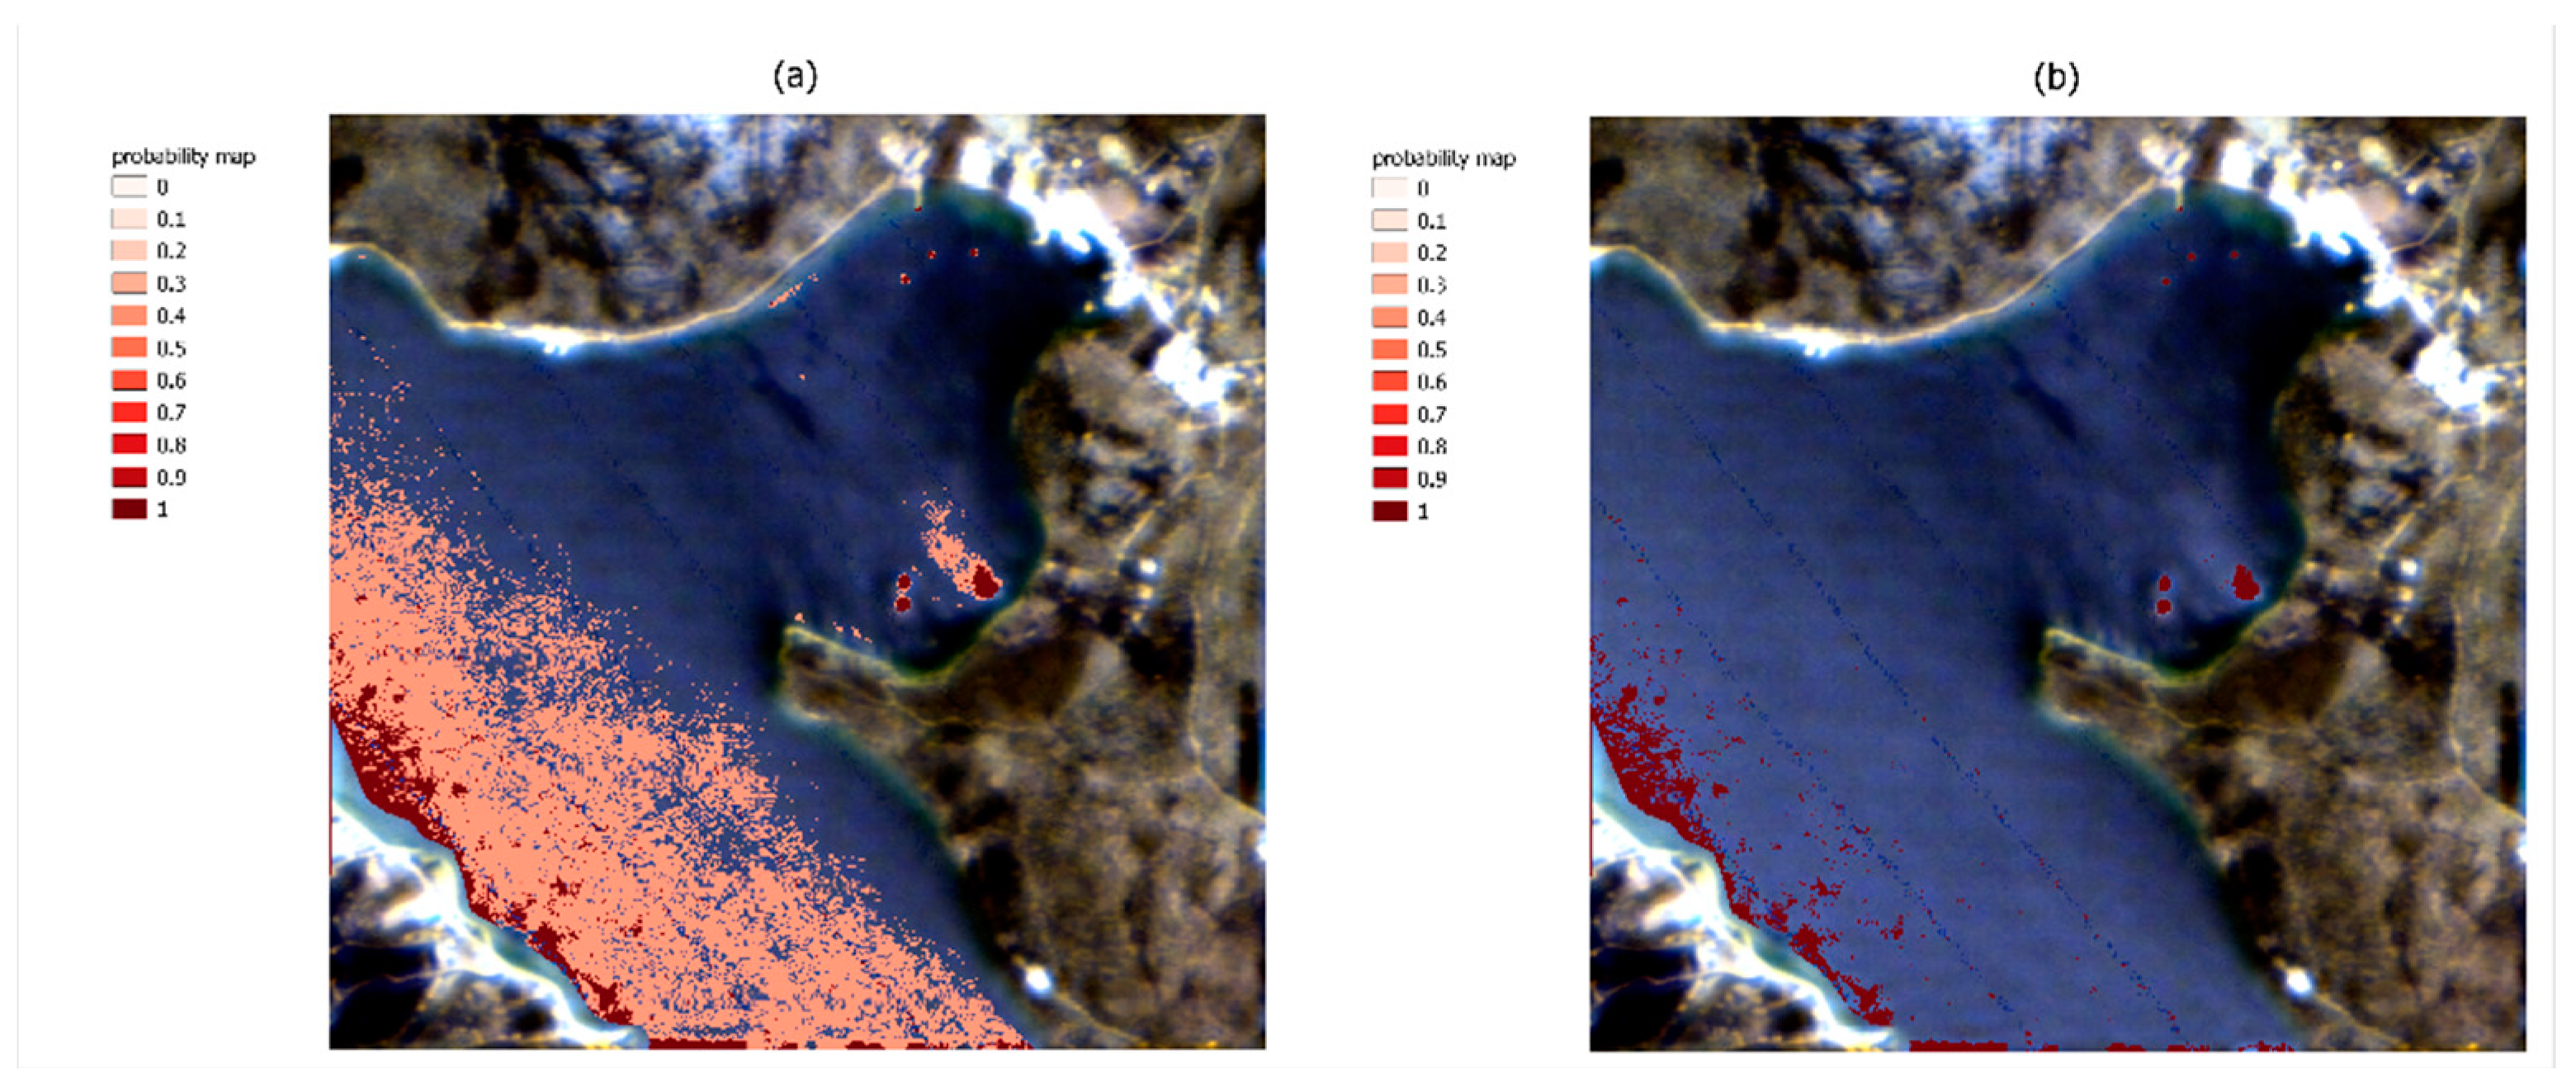
Figure 7.
(a,b) Final maps where each pixel represents a value in the [0.10,1.00] interval as a linear combination of the weights; (c,d) the same final maps with values in the [0.6,1.00] interval.
Figure 7.
(a,b) Final maps where each pixel represents a value in the [0.10,1.00] interval as a linear combination of the weights; (c,d) the same final maps with values in the [0.6,1.00] interval.
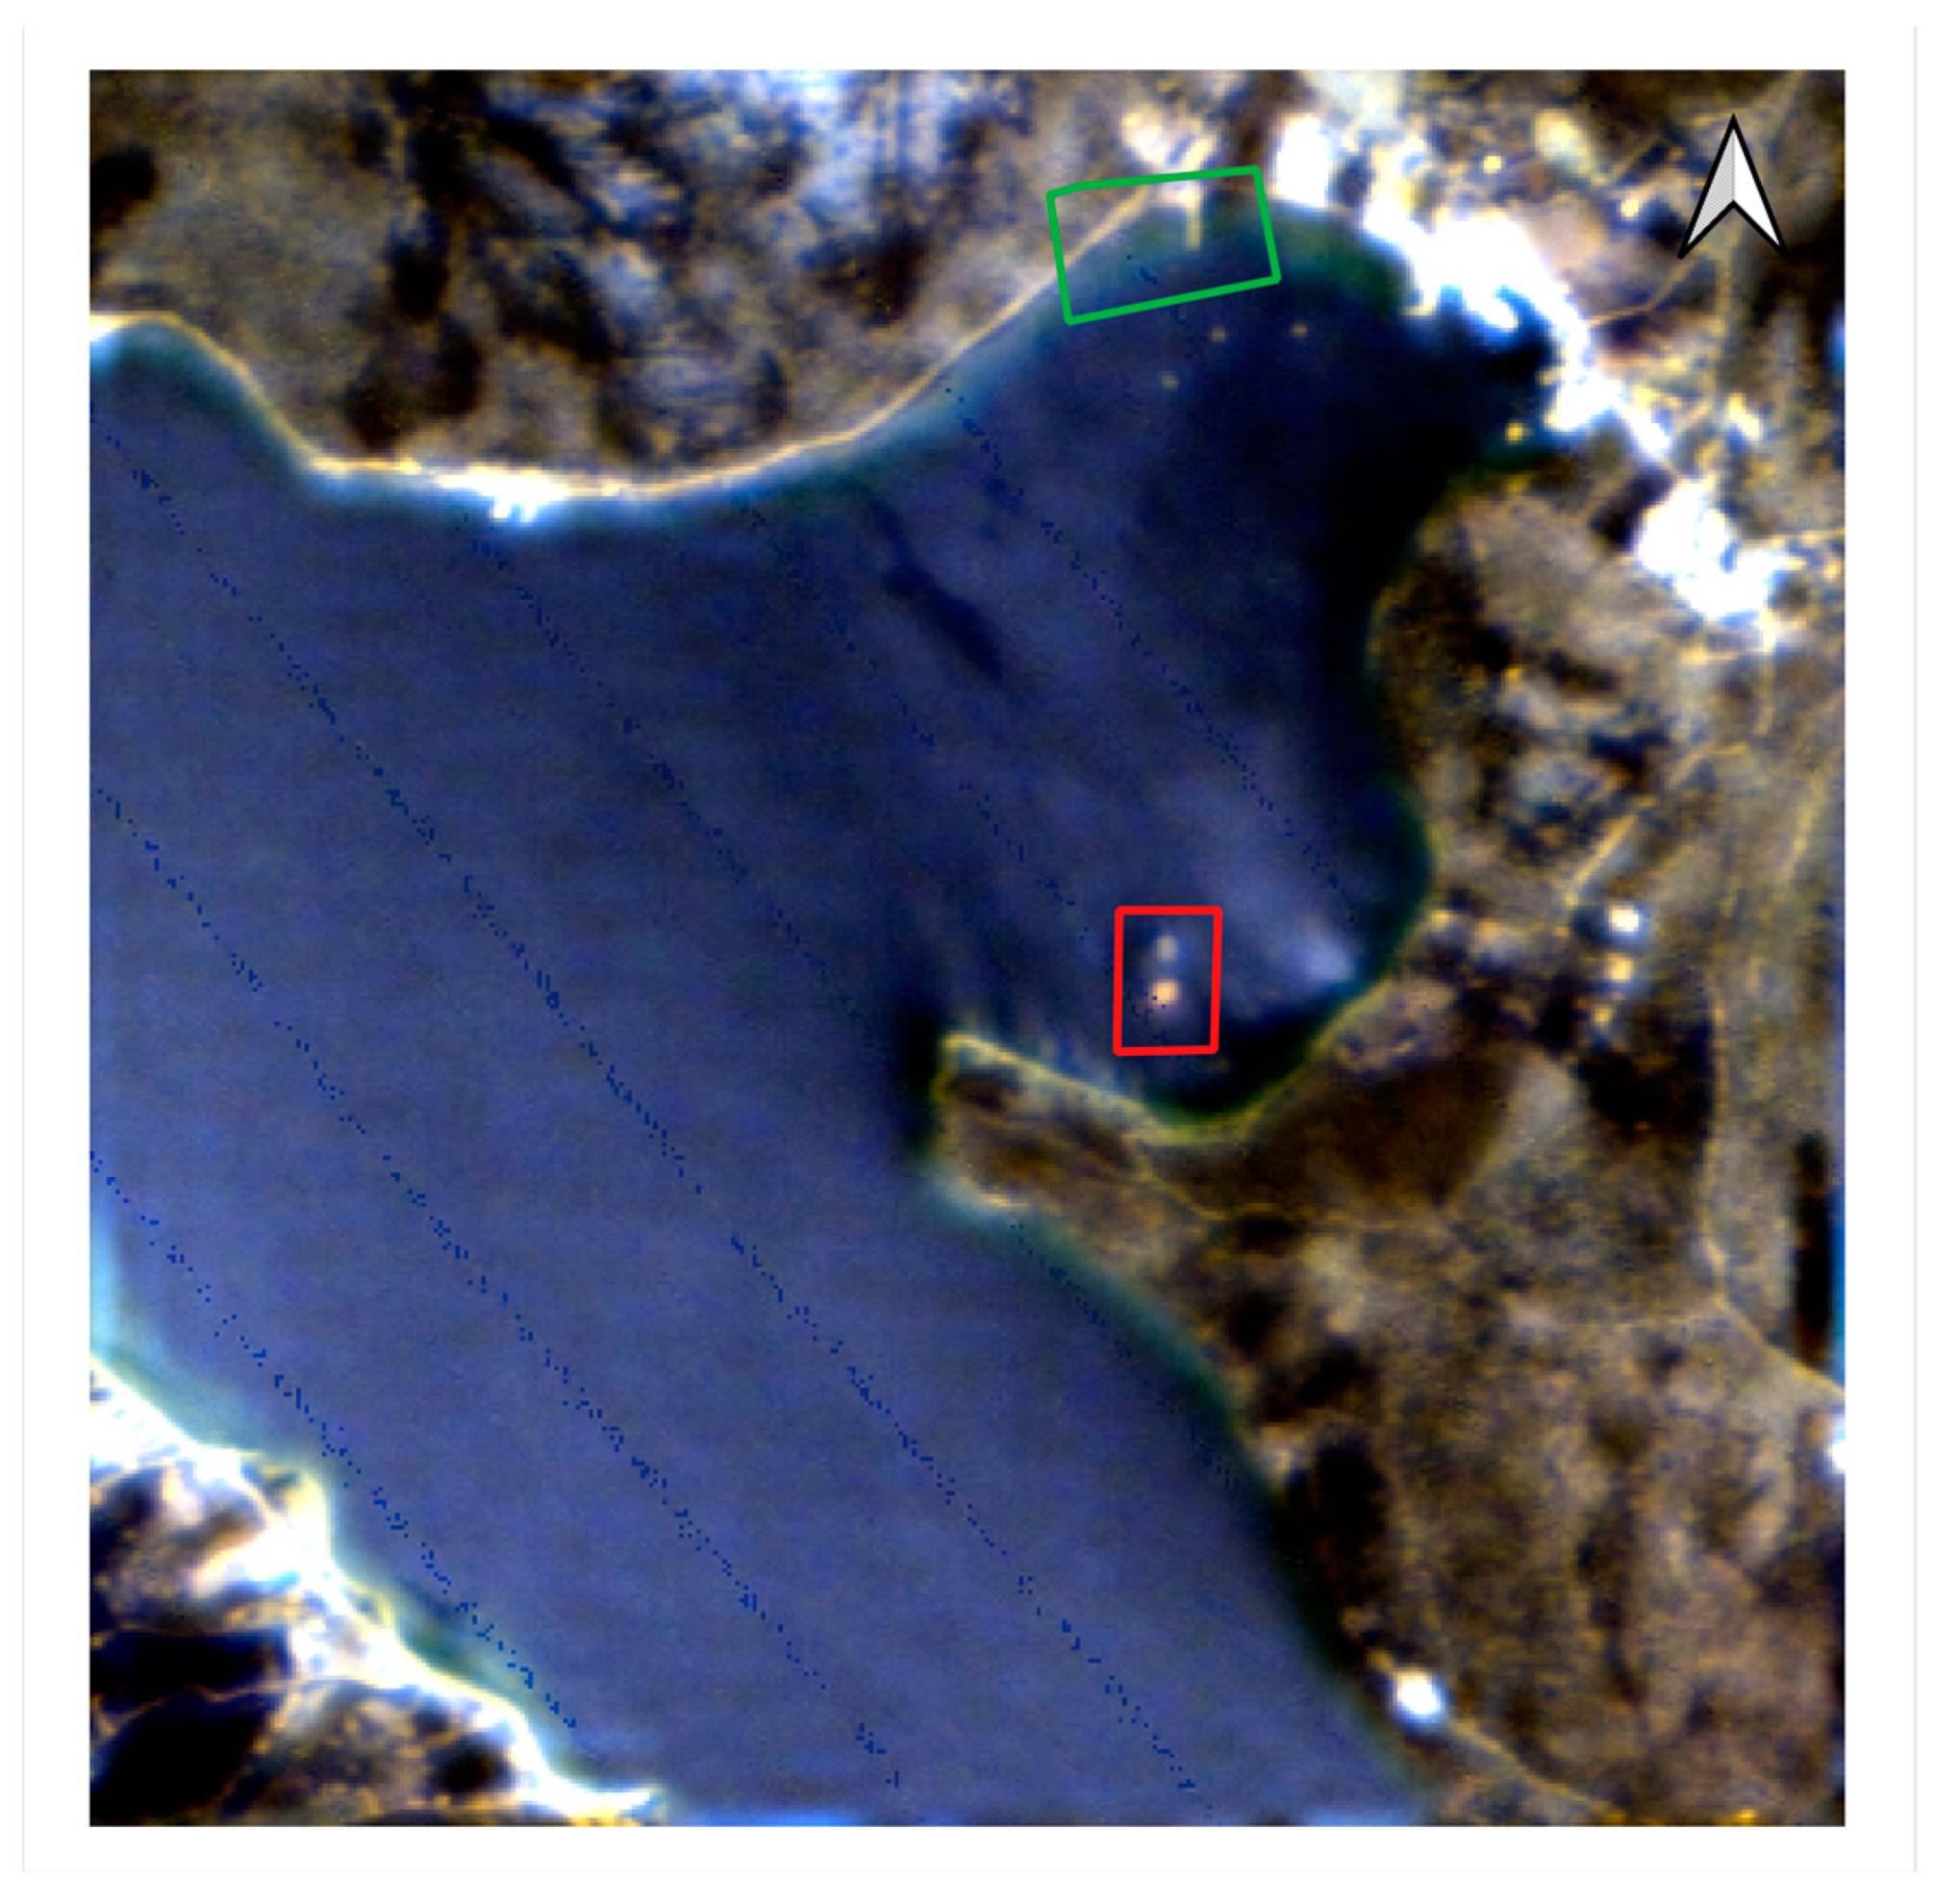
Figure 8.
Red–Green–Blue image of the pan-sharpened PRISMA data collected over the Geras Gulf. The plastic targets were placed within the green rectangle. Two other large circular targets were placed in the Geras Gulf, one made of wood and the other of plastics (red) [
23].
Figure 8.
Red–Green–Blue image of the pan-sharpened PRISMA data collected over the Geras Gulf. The plastic targets were placed within the green rectangle. Two other large circular targets were placed in the Geras Gulf, one made of wood and the other of plastics (red) [
23].
Figure 9.
Results of the applications of the supervised and unsupervised ML algorithms trained during the configuration phase and applied on the PRISMA image collected on 23 June 2021 over the Geras Gulf. (a) The probability map ranges between 0 and 1. (b) The probability mask with only values greater than 0.80.
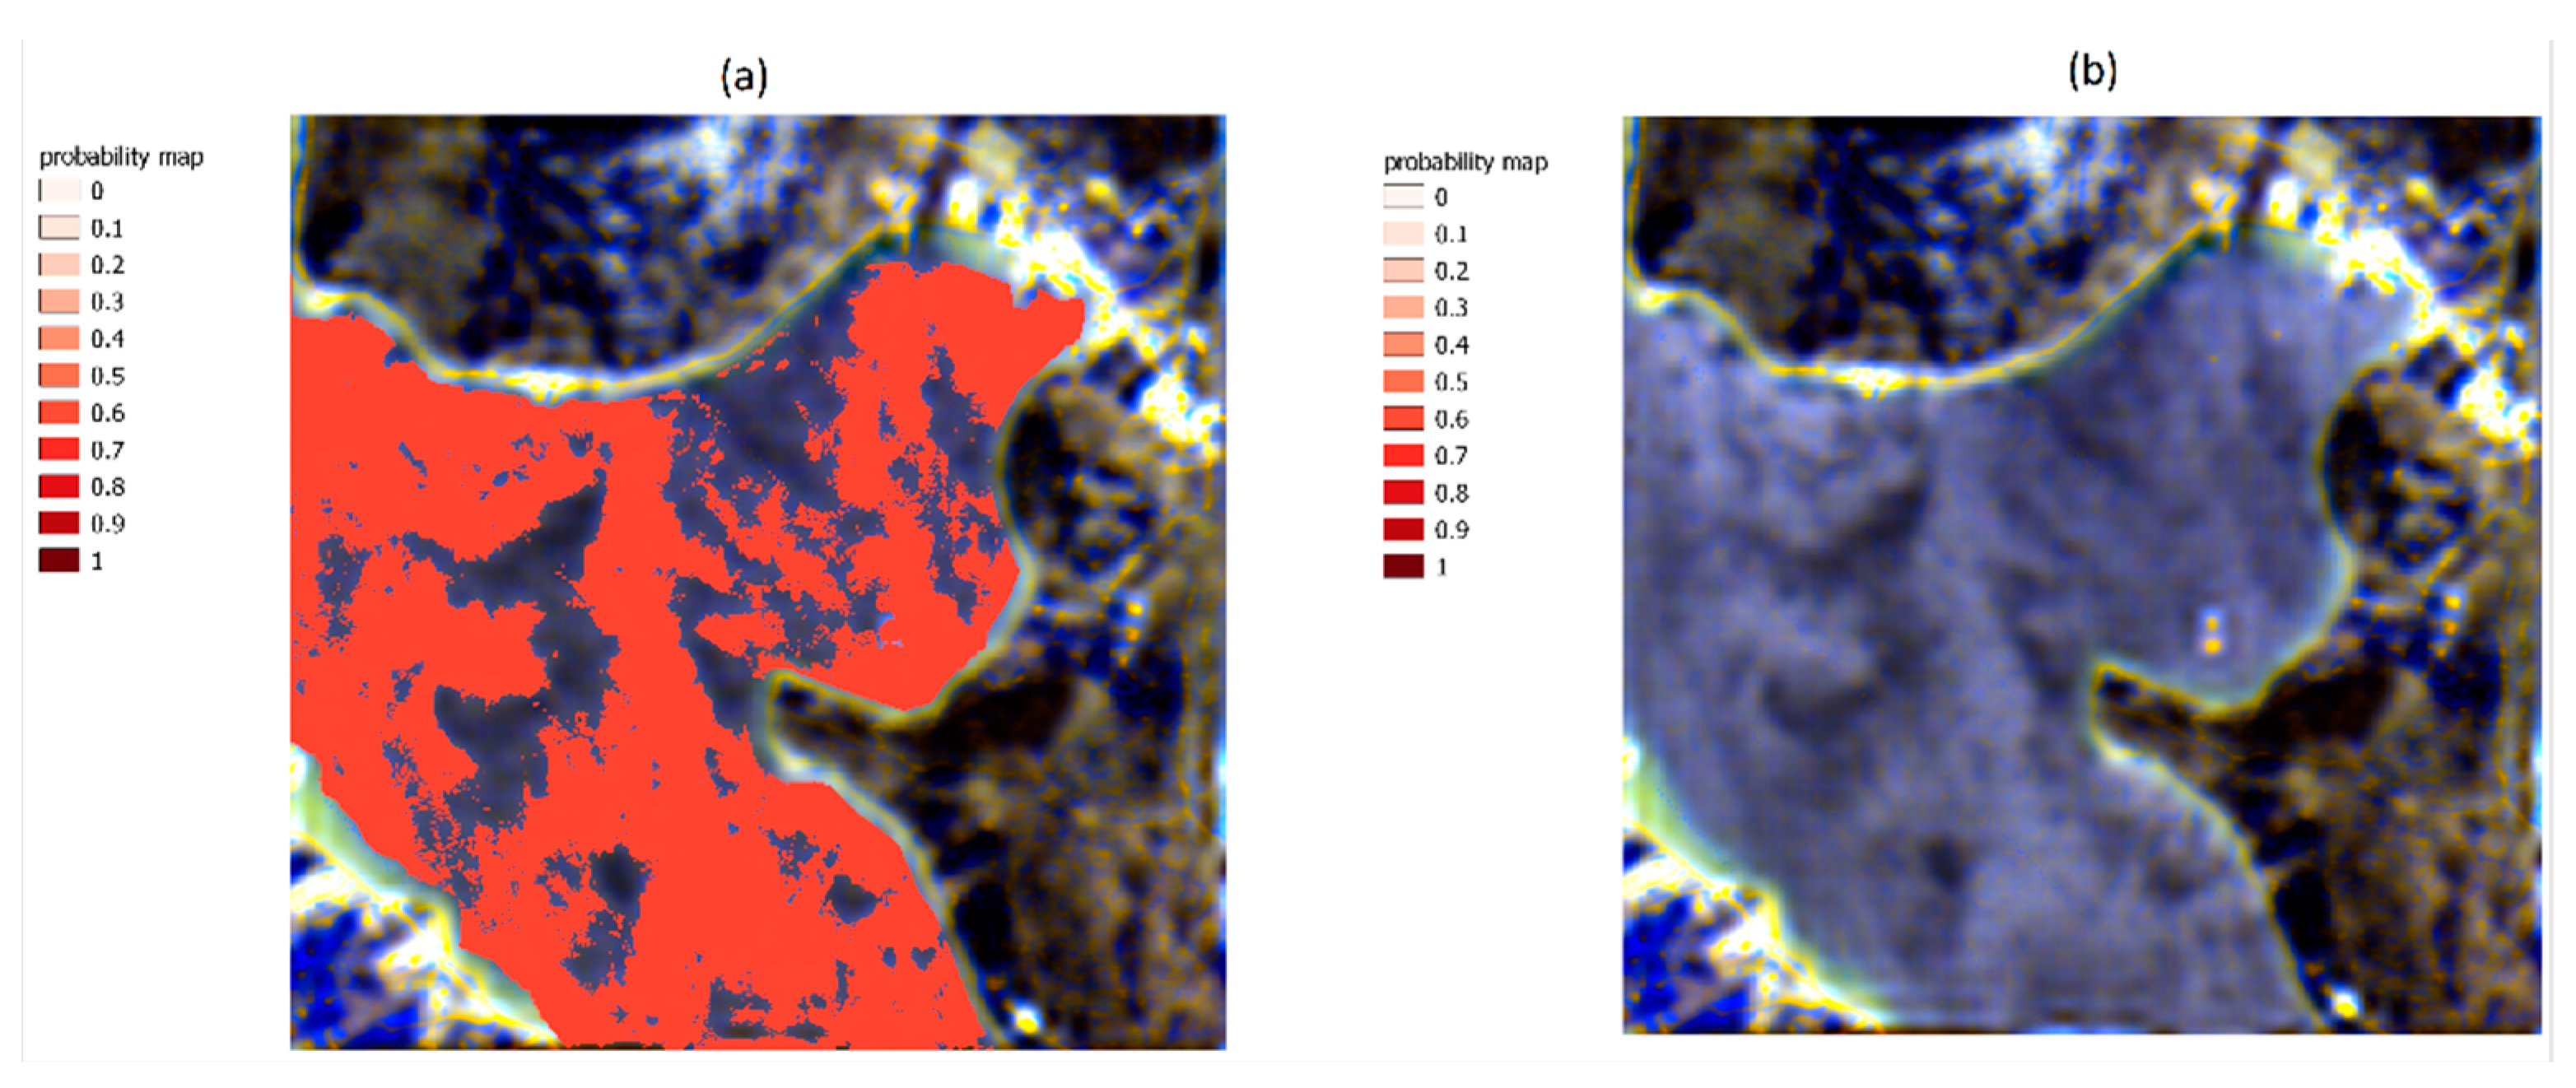
Figure 10.
Results of the application of the supervised and unsupervised ML algorithms trained during the configuration phase and applied on the PRISMA image collected on 29 June 2021 over the Geras Gulf. (a) The probability map ranges between 0 and 1. (b) The probability mask with only values greater than 0.80: no significant results were obtained with this test.
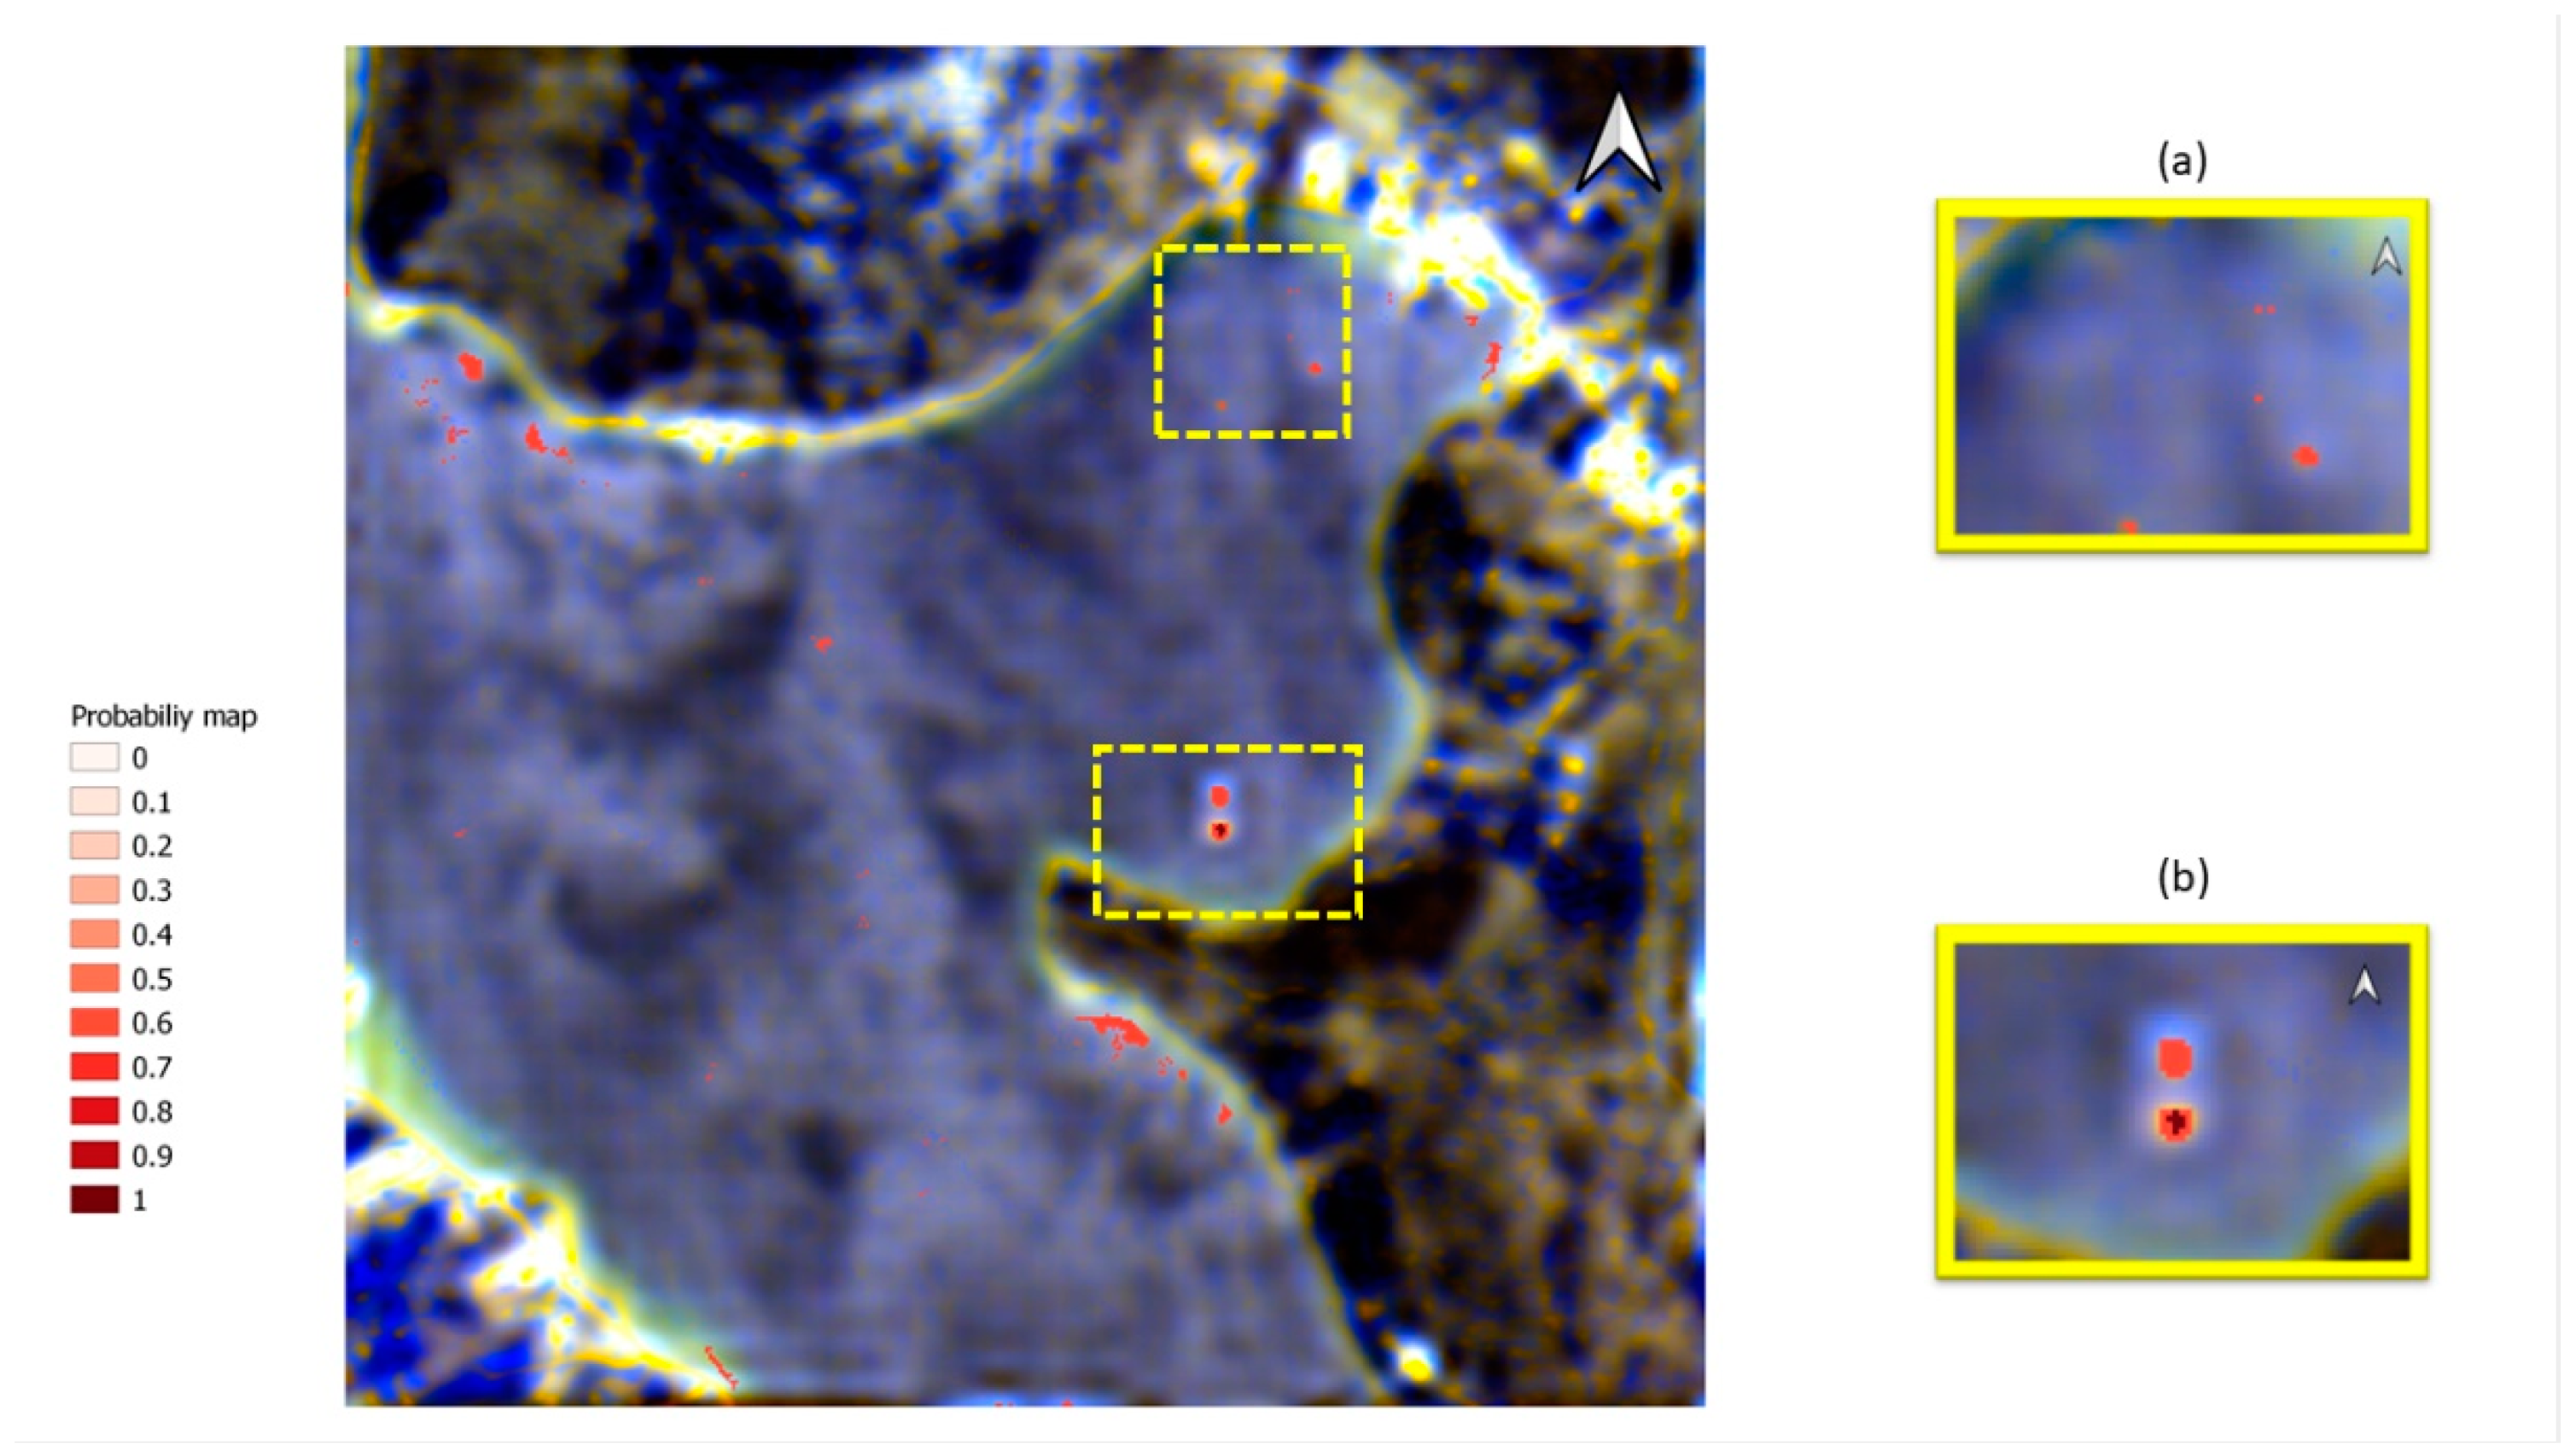
Figure 11.
The output of the re-trained LGBM+K-Means with values (red pixels) representing the probability of a floating object (from 0 to 1). With re-trained algorithms, it was possible to obtain more accurate results. (a) A zoom of floating objects. (b) shows the two targets that were detected with high probability.
Table 1.
Specifications of the 12 plastic targets: three targets were made using high-density polyethylene (HDPE); three targets were made using polyethylene terephthalate (PET); three other targets were made using polystyrene (PS), and the last three targets were realised with all the above materials over an equal surface area [
17].
| Type | Size | Type | Size | Type | Size | Composition |
|---|
| T-1A | 5.1 m × 5.1 m | T-2A | 2.4 m × 2.4 m | T-3A | 0.6 m × 0.6 m | HDPE |
| T-1B | 5.1 m × 5.1 m | T-2B | 2.4 m × 2.4 m | T-3B | 0.6 m × 0.6 m | PET |
| T-1C | 5.1 m × 5.1 m | T-2C | 2.4 m × 2.4 m | T-3C | 0.6 m × 0.6 m | PS |
| T-1D | 5.1 m × 5.1 m | T-2D | 2.4 m × 2.4 m | T-3D | 0.6 m × 0.6 m | HDPE + PET + PS |
Table 2.
PRISMA’s technical features.
Table 2.
PRISMA’s technical features.
| Orbit Altitude Reference | 615 km |
|---|
| Swath/Field of View (FOV) | 30 km/2.77° |
| GSD | HS: 30 m
PAN: 5 m |
| Spatial Pixels | HS: 1000
PAN: 6000 |
| Pixel Size | HS: 30 × 30 μm
PAN: 6.5 × 6.5 μm |
| Spectral Range | VNIR: 400–1010 nm (66 bands)
SWIR: 920–2500 nm (173 bands)
PAN: 400–700 nm |
| Spectral Sampling Interval (SSI) | ≤12 nm |
| Spectral Width | ≤12 nm |
Cross-Track Variation in Centre
Wavelength (Smile) | <+/−0.1 SSI |
Spatial registration of spectral sampling
(incl. Keystone) | ≤0.1 pixel |
| Spectral Calibration Accuracy | +/−0.1 nm |
| Radiometric Quantisation | 12 bit |
| VNIR SNR | >200:1 |
| SWIR SNR | >100:1 |
| PAN SNR | >240:1 |
| Absolute Radiometric Accuracy | Better than 5% |
| Lifetime | 5 years |
Table 3.
Summary of collected satellite data.
Table 3.
Summary of collected satellite data.
| Satellite | Product | Sensing Date | Target Position | Location | Phase |
|---|
| PRISMA | L1 | 18 September 2020 | Offshore | Mytilene | Configuration |
| PRISMA | L1 | 23 September 2020 | Onshore | Mytilene | Configuration |
| PRISMA | L1 | 11 October 2020 | Onshore | Mytilene | Configuration |
| PRISMA | L1 | 22 October 2020 | Offshore | Mytilene | Configuration |
| PRISMA | L1 | 23 June 2021 | Offshore | Geras Gulf | Validation |
| PRISMA | L1 | 29 June 2021 | Offshore | Geras Gulf | Validation |
Table 4.
Training set distribution per class.
Table 4.
Training set distribution per class.
| Class | Samples (No. of Pixels) |
|---|
| Deep Water | 224 |
| Land | 406 |
| Plastic Targets | 42 |
| Shallow Water | 668 |
Table 5.
True-positive results in the configuration phase.
Table 5.
True-positive results in the configuration phase.
| Targets | Image 1 | Image 2 | Ground Truth for Each Image |
| 4 medium | 2 pix | 4 pix | 4 pix |
| 4 large | 14 pix | 15 pix | 20 pix |
| Total | 16 pix | 19 pix | 24 pix |
| Total% | 66.67% | 79.17% | 100% |
| Publisher’s Note: MDPI stays neutral with regard to jurisdictional claims in published maps and institutional affiliations. |
© 2022 by the authors. Licensee MDPI, Basel, Switzerland. This article is an open access article distributed under the terms and conditions of the Creative Commons Attribution (CC BY) license (https://creativecommons.org/licenses/by/4.0/).


 ,
, 


