Article

How Does AR Technology Adoption and Involvement Behavior Affect Overseas Residents’ Life Satisfaction?

1
Department of Business Administration, Kumoh National Institute of Technology, Gumi 39177, Korea
2
Doctoral School of Economic and Regional Sciences, Hungarian University of Agriculture and Life Sciences, 2100 Godollo, Hungary
3
Institute of Economic Sciences, Hungarian University of Agriculture and Life Sciences, 2100 Godollo, Hungary
*
Authors to whom correspondence should be addressed.
Big Data Cogn. Comput. 2022, 6(3), 80; https://doi.org/10.3390/bdcc6030080
Submission received: 21 April 2022 / Revised: 8 July 2022 / Accepted: 19 July 2022 / Published: 25 July 2022
(This article belongs to the Special Issue Virtual Reality, Augmented Reality, and Human-Computer Interaction)

Abstract

:
This study aims to better understand foreign residents’ life satisfaction by exploring residents’ AR technology adoption behavior (a combination of transportation applications’ usefulness and ease of use) and travel involvement. Data were collected from 400 respondents randomly through a questionnaire-based survey. SPSS and AMOS were used to analyze and gather results. This study suggests overall life satisfaction as an operationalized dependent variable to measure a traveler’s sense of satisfaction, a traveler’s involvement, and AR adoption of necessary transportation apps is constructed as an independent variable. The model was proposed to explore the impacts of travel satisfaction on overall life satisfaction. The model focused on the role of traveling involvement when it is considered a first variable to explore the impact of travel satisfaction on the overall quality of life. Furthermore, AR technology adoption behavior is where people use traveling apps before and during traveling to fulfill travel needs, obtain details about locations, and make proper arrangements, as well as other facilities. Two significant roles of transportation apps and travelers’ involvement in travel-satisfaction development and overall life satisfaction were found; variables had a positive effect on travel satisfaction and life satisfaction. The results also revealed that AR mobile travel applications with traveler involvement could help improve individual overseas residents’ travel satisfaction; travel satisfaction provides more feelings of satisfaction with life in South Korea.

1. Introduction

Scholars have investigated life satisfaction in numerous disciplines, e.g., public health, tourism, and psychology. Previous research has used several methods to understand how different factors contribute to life satisfaction [1,2]. These studies provide a foundation for understanding the role of travel satisfaction in life’s overall wellbeing. For example, Friman, Gärling, Ettema, and Olsson (2017) [1] theorized whether multiple-purpose travel affects emotional wellbeing as well as life satisfaction; similarly, Dittmann and Goebel (2010) [3] examined how the socioeconomic status of neighborhood aspects affects life satisfaction. Furthermore, the authors revealed that during travel, “relaxation” is a better predictor of life satisfaction [2]. Additionally, Chen, Liu, Yu, Tan, Fu, and Mao (2019) [4] found that cross-cultural social adaptation is significantly associated with overseas life satisfaction. However, to the best of our knowledge, there have been few research studies about travel involvement and AR technology adoption behavior to examine overseas residents’ life satisfaction.
For decades, a long-standing research question in IT has been how user acceptance of the IT system can be accurately explained to enhance life satisfaction. User acceptance can be explained by adoption behavior (acceptance of perceived usefulness and perceived ease of use). Perceived ease of use plays a significant role in technology acceptance and positively impacts the intention to use AR technology because it increases users’ experience [5]. Modern mobile technological advancements have revolutionized how people experience their surroundings to enhance the overall experience of traveling. A recent study explored the opportunities of using augmented reality to enhance the travel experience; The acceptance of AR among British female travelers depends on a favorable attitude towards perceived usefulness and perceived ease of use; therefore, to identify the potential of mobile application adoption, it is essential to examine technology acceptance and AR acceptance behavior [6].
It is theoretically and empirically objective to explain how the combination of the acceptance of mobile augmented-reality travel apps and travel involvement contributes to achieving travel satisfaction to increase life satisfaction. Previous research has mainly investigated the relation of travel experience to life satisfaction and has used different methodologies [7]. Another author describes the Android-based application of augmented reality (AR), which has a feature to innovatively and dynamically support the action of a transport user by putting an additional information layer on an intelligent phone camera screen and giving instructions to an assistant that leads the user to the nearest destination stop [8]. Literature makes it challenging to conclude their life satisfaction without knowing the impact of augmented-reality technology on travel satisfaction. Therefore, one contribution that this study makes is obtaining specific input about travel involvement and AR technology adoption behavior using any transportation application.
Something that has received considerably less attention in research is whether or not travel involvement and AR technology adoption are associated with overseas residents’ life satisfaction. However, there is only limited research on acceptance of augmented reality technology in the life-satisfaction context, and it has received little attention from previous scholars. In this research, it was determined that a gap exists in examining augmented reality adoption’s impact on life satisfaction. The present study contributes to the gap in the mobile augmented-reality transportation-app-adoption behavior of overseas resident-travelers in South Korea. Previous research has investigated satisfaction with work and satisfaction with daily travel [1]. We extended this research by investigating whether travelers’ involvement and technology adoption (mobile-based travel-application acceptance related to usefulness/ease of use) are related to travel satisfaction and overall life satisfaction. Therefore, this study aims to discuss the impacts of transportation apps and travelers’ involvement on travel satisfaction, and ultimately, the overall sense of satisfactory quality.
Therefore, this research attempts to investigate further how the augmented reality (AR) model based on the original TAM (technology acceptance model) and travel involvement contributes to travel satisfaction and overall life satisfaction. This investigation can not only add knowledge to the area of technology adoption benefits, but also provide critical information for overseas residents regarding what factors they should consider in managing their life satisfaction in South Korea. Its result will be beneficial for the IT developers, technology experts, and developers of mobile applications that are researching technology adoption behavior and its impact on the community.
Firstly, by reviewing the literature on the adoption of location-based transportation apps through a methodology of qualitative research and interviews with domestic overseas living in South Korea, we can build a model (Appendix A) that could be tested in quantitative research (see Appendix A) focused on a representative sample.

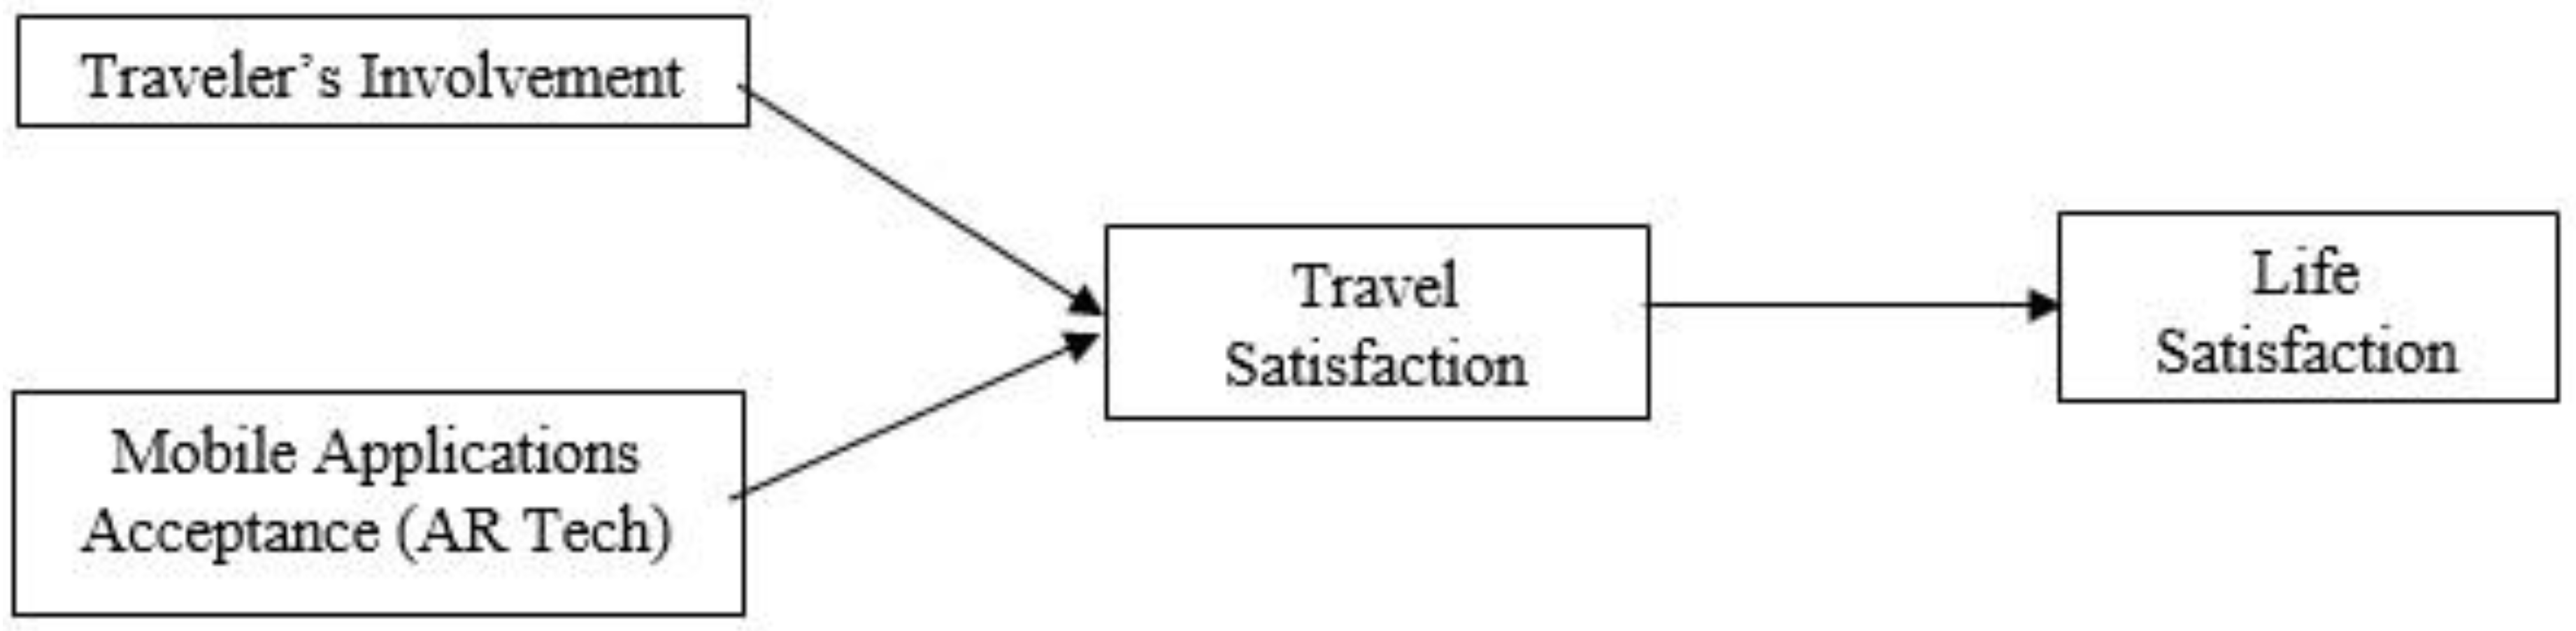
1.1. Conceptual Model and Hypothesis Development

To explain the hypothesized relationship between variables in literature, the following section begins with a review of traveler’s involvement, mobile augmented-technology adoption behavior, travel satisfaction, and overseas life satisfaction. Furthermore, two key dimensions of AR technology are also identified to examine travelers’ technology adoption behavior. The research model shown in Figure 1 proposes that travelers’ involvement and AR technology adoption behavior positively impact travel satisfaction. Overseas life satisfaction is influenced by travel satisfaction.

1.2. Travelers’ Involvement

The involvement construct has been approached in a variety of ways; involvement refers to the strength of an individual’s cognitive structure to a focal object, and the interaction between individuals and objects is linked to the involvement construct, which relates to individuals’ perceptions of importance and relevance of shown behavior; involvement has been shown to have a moderating effect on variables to analyze customer loyalty [9].
In behavioral research, involvement has gained a lot of importance. Previous research proposed behavioral modes and explained involvement concepts from different perspectives [10,11]. The authors emphasized that the degree of arousal of involved individuals concerning goal-related objects represents the intensity of involvement.
Li (2014) [12] pointed out that involvement is a psychological state of motivation, interest, or encouragement among individuals or groups. It changes from consumer behaviors and leisure behaviors that have a strong relation with involvement; high or low involvement can be seen in different consumer behavioral studies. The author [13] suggested that attraction was considered the most influential factor for traveling activities that need participation.
Chen, Petrick, and Shahvali (2016) [2] suggested that relaxation is considered a better predictor of life satisfaction during traveling. Another study [14] explored the relation of travel involvement with travel intention, and the authors concluded that involvement is considered the most critical component of the travel experience. In contrast, the study ignored the relation of travelers’ involvement with travel satisfaction.
In other words, the positive involvement behavior during traveling revealed travel satisfaction. This study attempts to understand whether travelers’ involvement results in travel satisfaction or not. Hence, this study explores the effect of individual travel involvement and satisfaction obtained from travel activity. The first hypothesis of the study is as follows:
Hypothesis 1 (H1). 
Travelers’ involvement has a positive influence on travel satisfaction.

1.3. AR Adoption Behavior

The technology acceptance model, TEM, predicts behavioral intention to use information systems depending upon perceived ease of use and usefulness of websites (such as Facebook) that connect people through social networks [15]. The research highlighted the mobile phone applications that tourists use for assistance at tourist destinations in South Korea. Furthermore, the majority of respondents used apps, such as subway and bus apps (Seoul Bus, Kakao Metro, Kakao Bus, Subway Korea, Waze, Metroid) and map apps (Kakao Maps, Google Maps, Naver Maps). Naver and Kakao Maps, which integrate navigation into the maps, are more popular than Google Maps in Korea [16]. Based on past research, the literature study attempts to develop a model that will explain the acceptance of mobile travel applications such as (KakaoMap, KakaoNavi, BusanBus, NaverMap, SubwayKorea, SubwayBusan, and KoreaTravelGuide) used by foreigners to obtain travel assistance through technology acceptance.
Perceived usefulness and ease of use cause people to accept or reject information technology, so these determinants are significant. People tend to use the specific application if they believe that it will help them to perform their job better. At the same time, they may believe that people will become capable of using them advantageously; Hence, easy-to-use applications are more likely to be accepted by users [17].
Destinations and tourism organizations enhance visitors’ experiences by utilizing benefits from the increased availability of AR applications. To get to know unknown surroundings, individuals receive support from AR applications; thus, to provide an enjoyable experience of travel, newly developed applications provide valuable information. Hence, for decades, TAM has been adopted within various research disciplines, including mobile services [6,17]. At the same time, the literature ignored the behavioral impact of AR adoption on travel satisfaction to examine the context of overseas residents’ life satisfaction. Significant research has been conducted on mobile-based AR applications; current smartphone ranges from navigators to digital cameras; as well as GPS-based applications, which are becoming the commanding platform for AR [6]. To boost the traveling experience, the usage of AR plays a vital role with the emergence of AR travel organizations that can enhance the travel experience by viewing relevant information. Thus, for travel organizations, AR applications are particularly significant [18].
Therefore, it is crucial to identify the impact of AR acceptance behavior of mobile travel applications on travel satisfaction when applied to the context of life satisfaction.
Hence, the second hypothesis of the study is initiated:
Hypothesis 2 (H2). 
AR adoption behavior of mobile applications has a positive influence on travel satisfaction.

1.4. Travel Satisfaction

Children’s travel satisfaction has been linked to life satisfaction [19], but no previous research exists on overseas residents’ life satisfaction.
In the human cognitive process, which expresses an emotional state that occurs as the result of achieving a specific task, every individual experience’s life satisfaction in a unique way, which may rely on personality traits, external factors, living conditions, resources, life events, and their interactions [20]. At the same time, travel behavior studies have focused on travel cost, experiences, and behavioral intentions. Satisfaction with public transport can impact people’s general quality of life and subjective wellbeing. Similarly, residential location can also impact travel satisfaction [21,22]. Several studies have investigated satisfaction impact on people’s wellbeing and life satisfaction [1,23,24]; however, none have been conducted in Busan, South Korea, for overseas residents’ life satisfaction.
When studying travel satisfaction’s impact on wellbeing, it is imperative to examine the influence of travel involvement and AR acceptance behavior of mobile travel applications on travel satisfaction to study overseas residents’ life satisfaction.
It is well-known that the attention on overseas residents’ life satisfaction is increasing, but relatively few studies have considered overseas life satisfaction. During the past two decades, attention to travel satisfaction has rapidly grown. Most recently, feelings of satisfaction during the trip have also been observed [25]; satisfaction is linked to personal emotions used to measure travel behavior and suggest that traveling utilities may be considered a proxy for traveling behavioral satisfaction.
To increase intrinsic motivation and willingness to repeat this behavior, satisfying experiences are considered an essential factor, and satisfied participants in travel behavior showed higher intention (self-efficacy) to repeat the behavior to use public transportation in the future [26].
Hence, the third hypothesis of the study is initiated:
Hypothesis 3 (H3). 
Travel satisfaction has a positive influence on overseas residents’ life satisfaction.

2. Methodology

2.1. Sample and Data Collection

The sample was composed of 400 respondents from Busan, South Korea, and overseas residents randomly sampled from the large city of Busan in 2021. Their ages range from 20 to 60 years. The participants were asked about their residency in South Korea because of the participation condition “residency in South Korea for more than one year”; the residency of all overseas participants was confirmed before data collection. There were 265 men and 135 women respondents in this survey. The survey was conducted mainly on university students, academicians, factory workers, senior-level officers, etc. It was a mainly online survey that we sent out to their mobiles using social site applications.

2.2. Instruments and Measurements

To collect information regarding the life satisfaction of all participants, measurements of constructs were adopted from existing literature. The questions were structured along a seven-step scale. The three questions were drawn for the traveler’s involvement scale from the Handbook of Marketing Scales [27]); after combining the items of perceived ease of use and perceived usefulness, we found items for AR adoption behavior obtained from the existing scale [5]; moreover, three items for the travel satisfaction scale and three items for the life satisfaction scale developed by [2] were used. We surveyed the second-largest city in South Korea, Busan [28] and its attractions for foreigners because of its beaches. Guidelines were suggested by [29] Cronbach’s alpha (0.8~0.9) of all variables indicates an excellent internal consistency. After confirming the fit indices, validity, and reliability of variables, our next step was to evaluate the structural model to conclude the hypothesized relationship between variables.

2.3. Results and Discussions

We used the software SPSS (version 21.0, Gumi, South Korea) and AMOS (version 21.0, Gumi, South Korea) to perform Cronbach’s alpha and CFA. The structural equation modeling (SEM) procedure was applied and hypotheses were tested. To assess the reliability and validity of the four research constructs, confirmatory factor analysis (CFA) was conducted. Then, a structural regression model was used to determine the influence of travel satisfaction on life satisfaction using technology adoption behavior and to check the influence of travelers’ involvement, and all hypotheses were tested.
To test the internal consistency of the variables in the component, we calculated Alpha and CR. Results show that CR and Cronbach’s α values are high, more than 0.7, and the difference is also significantly less. The model is composed of the following variables: Traveling involvement, AR adoption behavior, travel satisfaction, and life satisfaction. To analyze reliability and validity, CFA was performed with four constructs, as shown in Table 1. All the indicators have significant factor loadings between 0.823~0.939, while the AVE 0.53~0.87 was above the required value. Results are supported by previous research (Fornell and Larcker, 1981), concluding that convergent validity exists. Overseas residents were generally satisfied with their life in South Korea.
Confirmatory factor analysis whole-model acceptable fit values were reported in Table 2.
In Table 3, The goodness of fit (GFI) value is below 0.90 which indicates the model isn’t a good fit. The comparative Fit index (CFI) should be above 0.90. In this research, the (CFI = 0.96), which indicates the comparative fit index is up to the mark. The Root mean square error of approximation should be greater than 0.08, which is up to the requirement, and shows good fit.
The correlation results in the Table 4. Shows the relationship among variables. Traveler’s involvement has significant positive relationship with AR adoption behavior (r = 0.590, p < 0.001), Travel satisfaction (r = 0.732, p < 0.001), and Life satisfaction (r = 0.777, p < 0.001).
After confirming the validity and reliability of constructs, we evaluated the structural model in support of H1, H2, and H3; as Table 5 shows, the results confirmed a significant positive influence of travel involvement on travel satisfaction (β = 0.615, S. E = 0.076, T = 8.147, p < 0.001). The result is supported by previous research [9]. A previous study examined personal involvement’s moderating effect on the online shopping behavior of consumers and the significant positive influence of AR adoption behavior on travel satisfaction (β = 0.530, S. E = 0.055, T = 9.700, p < 0.001). It is the second-strongest predictor; the results are supported by the study conducted by the authors [6], and a significant positive influence of travel satisfaction on life satisfaction (β = 0.741, S. E = 0.038, T = 0.928, p < 0.001) is supported by previous research by authors [7]. Examination of life satisfaction of people’s regression coefficients points out that AR adoption behavior of mobile travel applications relative to travel involvement is the strongest predictor of travel satisfaction. In contrast, both travel involvement and AR adoption behavior have seen a positive impact on travel satisfaction and life satisfaction. As discussed earlier, our research model of life satisfaction is composed of two independent variables and one mediating variable. Travel involvement is the primary construct of the positive assessment of travel satisfaction.
Most importantly, AR adoption behavior is the newly tested construct of the positive assessment of travel satisfaction. The results clearly show that selected variables are stronger predictors of overseas residents’ life satisfaction in this modern arena. The documented findings can propose a general life satisfaction for overseas residents.

3. Conclusions

Theoretical Contributions

Using quantitative data from a survey conducted for this study, we have analyzed how mobile acceptance applications and travel involvement play a role in influencing travel satisfaction and life satisfaction, similar to previous studies. Although this study provided valuable information regarding the link between the satisfaction experienced through AR acceptance and ultimately obtained life satisfaction, future studies can provide additional insight. AR plays a vital role in meeting individuals’ various needs to feel life satisfaction. The quantitative analysis of this research provides a clear insight into AR acceptance for traveling purposes, ultimately affecting travel satisfaction and life satisfaction.
The purpose of this research was to develop and validate a new construct for travel involvement and AR mobile applications’ acceptance behavior, with the intention of perceived ease of use and usefulness to examine overseas life satisfaction, two distinct variables hypothesized to determine travel satisfaction. This study was successful in several respects. The new concept of travel involvement and technology adoption behavior were found to have strong results and built significant relationships with travel satisfaction. Initial scale items were generated based on stated definitions, scale, and literature. As discussed above, both travel involvement and AR adoption behavior were significantly correlated with travel satisfaction; as discussed earlier, the result is supported by previous research [9]; the previous study examined personal involvement’s positive moderating effect on the online shopping behavior of consumers while ignoring the relation of involvement with travel satisfaction to examine overseas residents’ life satisfaction. The same correlation pattern was found with the relationship between travel satisfaction and life satisfaction. The most unique findings of this study are the strength of mobile travel-application adoption behavior (Cronbach’s α = 0.9; t-value = 9.7) compared to travel involvement (Cronbach‘s α = 0.8; t-value = 8.1). In both constructs, AR mobile-app adoption behavior was significantly more strongly linked to travel satisfaction than involvement behavior. As a result, overseas residents are often willing to use mobile travel applications that they consider easy to use and useful during traveling from one location to another.
We detail how involvement and mobile-based travel applications affect travel satisfaction and life satisfaction. The findings are highly relevant for transport planners and IT developers to develop and provide attractive and satisfactory mobile applications for overseas residents. Some previously investigated factors (seat availability, attitude) during traveling were not included in this study [22,30], which investigated travel satisfaction but ignored overseas travel satisfaction and life satisfaction. Instead, more focus is on mobile-based travel-application acceptance behavior, which is more important for travel-application developers. In short, the finding suggests that travelers’ involvement and mobile travel applications’ adoption behavior both positively influence travel satisfaction, and that the travel applications should be easy to use and have useful facilities in order to increase acceptance behavior for overseas residents’ life satisfaction [31]. This could be solved by providing travel applications in different languages, such as English. If application developers develop apps with these findings in mind, it will result in more satisfied overseas life. As a result, travel satisfaction with the acceptance of travel applications will increase the overall life satisfaction of overseas residents of Busan, South Korea.

4. Research Implications

Future research must address how other variables relate to overseas life satisfaction. Technology adoption situations and intentions have received less attention in life-satisfaction theory. As this research was conducted in the city of Busan, South Korea, to generalize more results more research is needed, by including other geographical areas to understand the relationship between overseas life satisfaction with AR technology adoption behavior. In future research, different travel-application usage and usefulness can be measured to influence overseas residents’ life satisfaction in South Korea.

Author Contributions

Conceptualization, N.D., G.-G.K., and C.B.I.; methodology, N.D. and M.B.H.; software, N.D. and M.B.H.; validation, M.B.H., A.D., and C.B.I.; formal analysis, N.D. and M.B.H.; investigation, N.D., A.D., and M.B.H.; resources, N.D., A.D., and M.B.H.; data curation, N.D., A.D., and M.B.H.; writing, N.D. and M.B.H.; writing—review and editing, N.D., G.-G.K., M.B.H. and C.B.I.; visualization, M.B.H. and A.D.; supervision, C.B.I.; project administration, M.B.H. and A.D.; funding acquisition, C.B.I. All authors have read and agreed to the published version of the manuscript.

Funding

This research received no external funding.

Institutional Review Board Statement

This study has been approved by the Institutional Review Board of the Doctoral School Hungarian University of Agriculture and Life Science on 9 January 2021.

Informed Consent Statement

Not applicable.

Data Availability Statement

Not applicable.

Conflicts of Interest

The authors declare no conflict of interest.

Appendix A

Table A1. Items drawn from literature and modified for this study.
ItemsSource
Travelers’ Involvement in new technology[27]
Travel applications offer me relaxation and fun when life pressures build up.
Using travel applications for traveling is one of the most satisfying enjoyable things I do.
I enjoy discussing outing places with my friends which I explored through travel applications.
Perceived Usefulness[5]
By using travel applications, I can decide more quickly and more easily which transportation I should take.
By using travel applications, I can better decide in which direction I should go.
By using travel applications, I can decide more easily whether I should take this transportation or not.
Perceived Ease of Use[5]
The interaction with travel applications is clear and understandable.
To use travel applications, I do not need a lot of mental effort.
I find travel applications easy to use.
Travel Satisfaction[2]
Dissatisfied/Satisfied
Displeased/Pleased
Frustrated/Contented
Life Satisfaction[2]
In most ways, my life is close to ideal.
The conditions of my life are excellent.
I am satisfied with my life.

References

  1. Friman, M.; Gärling, T.; Ettema, D.; Olsson, L.E. How does travel affect emotional well-being and life satisfaction? Transp. Res. Part A Policy Pract. 2017, 106, 170–180. [Google Scholar] [CrossRef]
  2. Chen, C.C.; Petrick, J.F.; Shahvali, M. Tourism experiences as a stress reliever: Examining the effects of tourism recovery experiences on life satisfaction. J. Travel Res. 2016, 55, 150–160. [Google Scholar] [CrossRef]
  3. Dittmann, J.; Goebel, J. Your house, your car, your education: The socio-economic situation of the neighborhood and its impact on life satisfaction in Germany. Soc. Indic. Res. 2010, 96, 497–513. [Google Scholar] [CrossRef]
  4. Chen, X.; Liu, X.; Yu, W.; Tan, A.; Fu, C.; Mao, Z. Association between Cross-Cultural Social Adaptation and Overseas Life Satisfaction among Chinese Medical Aid Team Members (CMATMs) in Africa. Int. J. Environ. Res. Public Health 2019, 16, 1572. [Google Scholar] [CrossRef]
  5. Van der Heijden, H. User acceptance of hedonic information systems. MIS Q. 2004, 28, 695–704. [Google Scholar] [CrossRef]
  6. tom Dieck, M.C.; Jung, T. A theoretical model of mobile augmented reality acceptance in urban heritage tourism. Curr. Issues Tour. 2018, 21, 154–174. [Google Scholar] [CrossRef]
  7. Friman, M.; Westman, J.; Olsson, L.E. Children’s life satisfaction and satisfaction with school travel. Child Indic. Res. 2019, 12, 1319–1332. [Google Scholar] [CrossRef]
  8. Brata, K.C.; Liang, D.; Pramono, S.H. Location-based augmented reality information for bus route planning system. Int. J. Electr. Comput. Eng. 2015, 5, 142–149. [Google Scholar] [CrossRef]
  9. Chen, C.F.; Tsai, M.H. Perceived value, satisfaction, and loyalty of TV travel product shopping: Involvement as a moderator. Tour. Manag. 2008, 29, 1166–1171. [Google Scholar] [CrossRef]
  10. Poiesz, T.B.C.; Cees, J.P. Do we need involvement to understand consumer behavior? Adv. Consum. Res. 1995, 22, 448–452. [Google Scholar]
  11. Zaichkowsky, J.L. Conceptualizing involvement. J. Advert. 1986, 15, 4–14. [Google Scholar] [CrossRef]
  12. Li, Y.M. Effects of story marketing and travel involvement on tourist behavioral intention in the tourism industry. Sustainability 2014, 6, 9387–9397. [Google Scholar] [CrossRef]
  13. Chen, C.F.; Chen, F.S. Experience quality, perceived value, satisfaction, and behavioral intentions for heritage tourists. Tour. Manag. 2010, 31, 29–35. [Google Scholar] [CrossRef]
  14. Bian, R.; Zhu, M. The Relationship between Ritual, Personal Involvement, and Travel Intention: A Study of Check-in-Travel on DouYin. Am. J. Ind. Bus. Manag. 2020, 10, 451. [Google Scholar] [CrossRef]
  15. Rosen, P.; Sherman, P. Hedonic information systems: Acceptance of social networking websites. In Proceedings of the Americas Conference on Information Systems AMCIS 2006, Acapulco, Mexico, 4–6 August 2006. [Google Scholar]
  16. Brennan, B.S.; Koo, C.; Bae, K.M. Smart tourism: A study of mobile application use by tourists visiting South Korea. Arts Humanit. Soc. Converg. Multimed. Pap. 2018, 8, 1–9. [Google Scholar]
  17. Davis, F.D. Perceived usefulness, perceived ease of use, and user acceptance of information technology. MIS Q. 1989, 13, 319–340. [Google Scholar] [CrossRef]
  18. Leue, M.; Jung, T.H. A theoretical model of augmented reality acceptance. E-Rev. Tour. Res. 2014, 5. [Google Scholar]
  19. Waygood, E.O.D.; Friman, M.; Taniguchi, A.; Olsson, L.E. Children’s life satisfaction and travel satisfaction: Evidence from Canada, Japan, and Sweden. Travel Behav. Soc. 2019, 16, 214–223. [Google Scholar] [CrossRef]
  20. Skurzak, A.; Zarajczyk, M.; Iwanowicz-Palus, G.; Korżyńska-Piętas, M.; Lewicka, M.; Wiktor, H. Life satisfaction of the pregnant women. Pielegniarstwo XXI Wieku/Nurs. 21st Century 2020, 18, 207–213. [Google Scholar] [CrossRef]
  21. McCarthy, S.; Habib, M.A. Investigation of life satisfaction, travel, built environment, and attitudes. J. Transp. Health 2018, 11, 15–24. [Google Scholar] [CrossRef]
  22. Lunke, E.B. Commuters’ satisfaction with public transport. J. Transp. Health 2020, 16, 100842. [Google Scholar] [CrossRef]
  23. Bergstad, C.J.; Gamble, A.; Gärling, T.; Hagman, O.; Polk, M.; Ettema, D.; Friman, M.; Olsson, L.E. Subjective well-being related to satisfaction with daily travel. Transportation 2011, 38, 1–15. [Google Scholar] [CrossRef]
  24. Smith, O.B. Peak of the Day or the Daily Grind: Commuting and Subjective Well-Being. Ph.D. Dissertation, Portland State University, Portland, OR, USA, 2013. [Google Scholar]
  25. Francois, S.; Astegiano, P.; Viti, F. Analyzing the correlation between commuting satisfaction and traveling utility. Transp. Res. Procedia 2017, 25, 2639–2648. [Google Scholar] [CrossRef]
  26. Ryan, R.M.; Patrick, H.; Deci, E.L.; Williams, G.C. Facilitating health behavior change and its maintenance: Interventions based on self-determination theory. Eur. Health Psychol. 2008, 10, 2–5. [Google Scholar]
  27. Bearden, W.O.; Netemeyer, R.G. Involvement, Information Processing, and Price Perceptions. In Handbook of Marketing Scales: Multi-Item Measures for Marketing and Consumer Behaviour Research, 2nd ed.; SAGE: Thousand Oaks, CA, USA, 1999. [Google Scholar]
  28. Ahn, Y.J.; Kim, I.; Lee, T.J. Exploring visitor brand citizenship behavior: The case of the ‘MICE city Busan’, South Korea. J. Destin. Mark. Manag. 2016, 5, 249–259. [Google Scholar] [CrossRef]
  29. George, D. SPSS for Windows Step by Step: A Simple Study Guide and Reference; 17.0 Update, 10/e; Pearson Education India: Bengaluru, India, 2011. [Google Scholar]
  30. Smith, O. Commute well-being differences by mode: Evidence from Portland, Oregon, USA. J. Transp. Health 2017, 4, 246–254. [Google Scholar] [CrossRef]
  31. Dewan, N.; Hossain, M.B.; Kim, G.G.; Dunay, A.; Illés, C.B. Transportation Mobile Applications Adoption Behavior Does Affect Overseas Residents’ Life Satisfaction: Involvement as A Moderator. Cogent Bus. Manag. 2022, 9, 2096998. [Google Scholar] [CrossRef]
Figure 1. Conceptual framework.
Bdcc 06 00080 g001
Table 1. Variables’ structures and concepts applied.
Perceived Ease Of Use“The degree to which a person believes that using a particular system would be free of effort.”
The mobile phone applications that tourists use to assist them at tourist destinations in South Korea. People tend to use the specific application if they believe it will help them to perform their job better [17].
Perceived Usefulness“The degree to which a person believes that using a particular system would enhance his or her job performance.”
Easy-to-use applications are more likely to be accepted by users and be considered useful [17].
Travel Satisfaction“An intrinsic positive consequence emerging from behavior that fulfills the expectations of an individual.”
Travel behavior studies have focused on travel cost, experiences, and behavioral intentions, but no previous research exists on overseas residents’ life satisfaction [19].
Life Satisfaction“A global assessment of person quality of life according to his chosen criteria.”
The attention on overseas residents’ life satisfaction is increasing, but relatively few studies have considered overseas life satisfaction [25]
Traveler’s InvolvementIn studies [10,11], the authors emphasized that the degree of arousal of involved individuals concerning goal-related objects represents the intensity of involvement.
Study [14] explored the relation of travel involvement with travel intention, and the authors concluded that involvement is considered the most critical component of the travel experience. In contrast, the study ignored the relation of travelers’ involvement with travel satisfaction.
Table 2. Validity and reliability of variables.
ConstructsFactor LoadingCronbach’s αC.R.MeanS. D
Travelers’ involvement0.8230.8660.86617.7253.3320
0.835
0.827
AR adoption behavior0.8610.9530.95133.7908.5210
0.866
0.898
0.903
0.844
0.877
Travel satisfaction0.9170.9500.95116.9054.8316
0.926
0.949
Life satisfaction0.9250.9470.94817.6553.9236
0.939
0.917
Table 3. Model goodness of fit.
Fit IndicesGoodness-of-Fit Values
CNIM/DF3.984
CFI0.964
TLI0.953
AGFI0.851
GFI0.898
NFI0.952
RMSEA0.086
Table 4. Correlation matrix.
Scale1234
Travelers’ involvement(0.6862)
AR adoption behavior0.590 ***(0.7658)
Travel satisfaction0.7320.727 ***(0.866)
Life satisfaction0.7770.8430.565 ***(0.5324)
Significance level = 0.01
Note: *** shows the level of significance, p = level of significance *** p < 0. 001.
Table 5. Structural parameter estimates and good-of-fit indices for total sample.
Hypothesized PathβS. EBTpHypothesis
  Involvement Travel   satisfaction 0.6150.0760.4628.147***H1 Supported
AR   adoption   behavior Travel   satisfaction 0.5300.0550.4459.700***H2 Supported
Travel   satisfaction Life   satisfaction   0.7410.0380.92819.555***H3 supported
Fit statistics (N = 400)
χ2/d. f = 4.195
GFI = 0.898
CFI = 0.96
RMSEA = 0.089
Note: Path = relationship between independent and dependent variable; β = unstandardized regression coefficient; B = standardized; S. E = standard error; p = level of significance *** p <0. 001.
Publisher’s Note: MDPI stays neutral with regard to jurisdictional claims in published maps and institutional affiliations.

