
Virtual Reality-Based Stimuli for Immersive Car Clinics: A Performance Evaluation Model


 ,
,  and
and 
Abstract
:1. Introduction
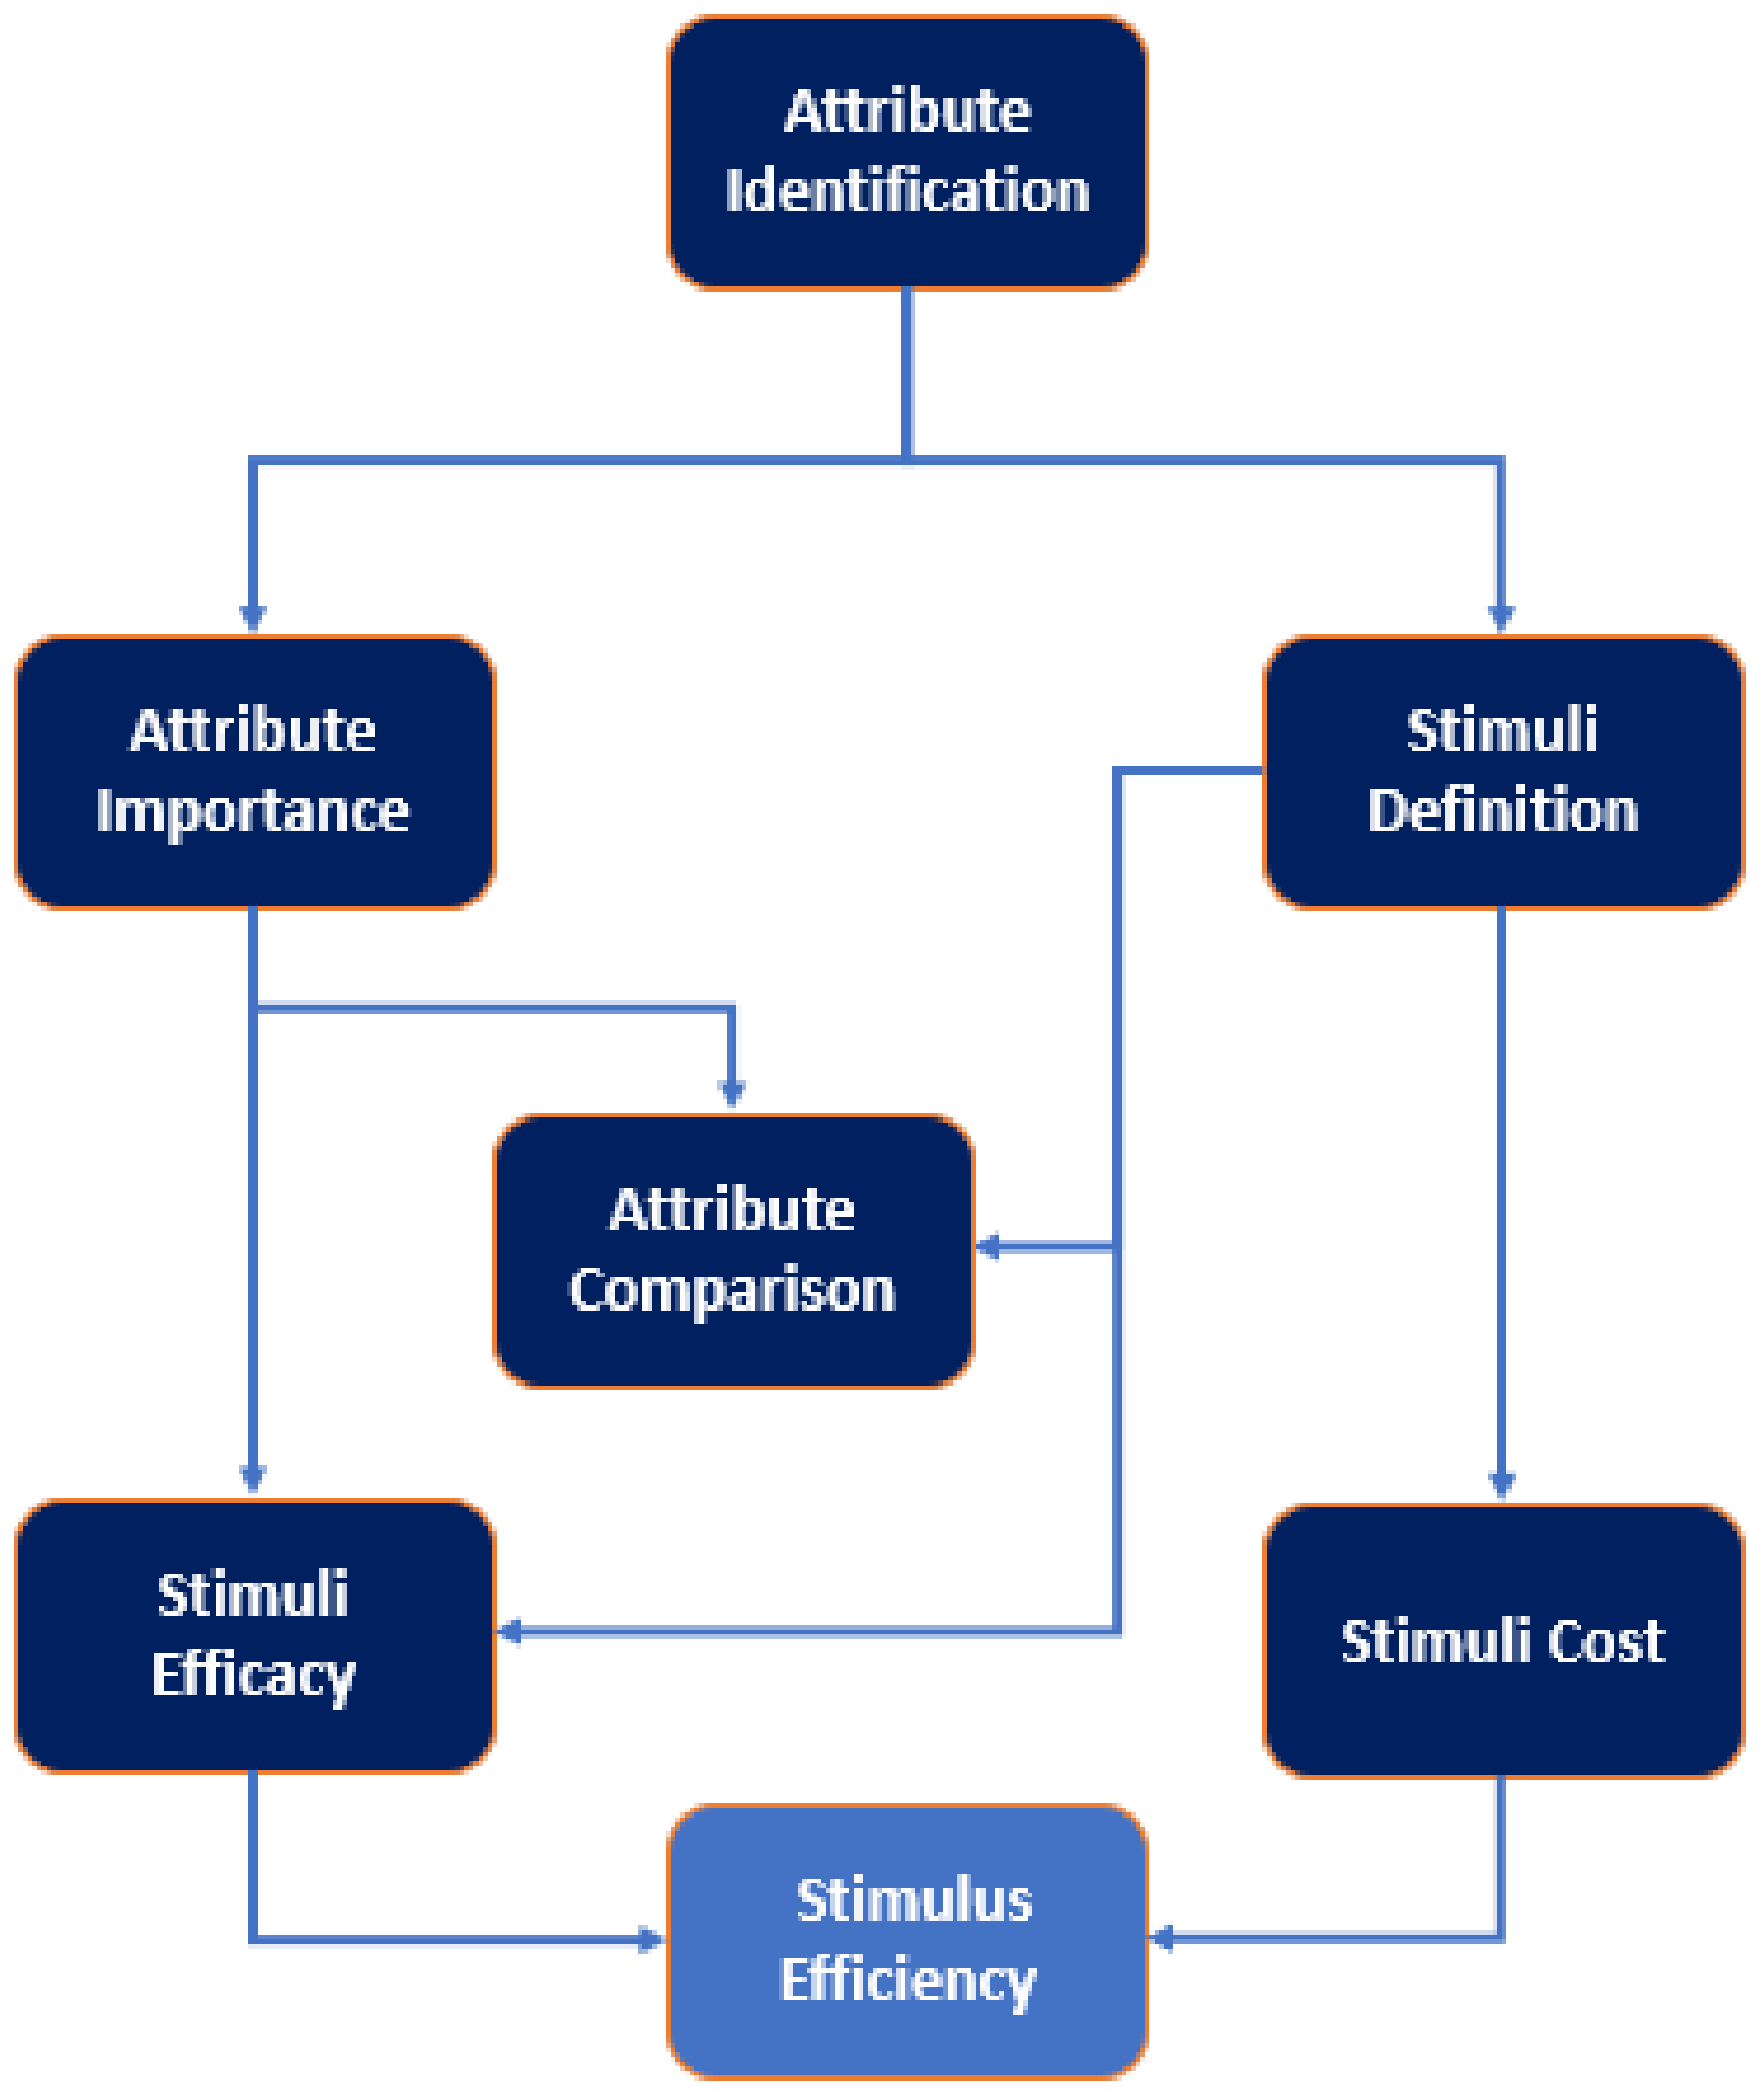
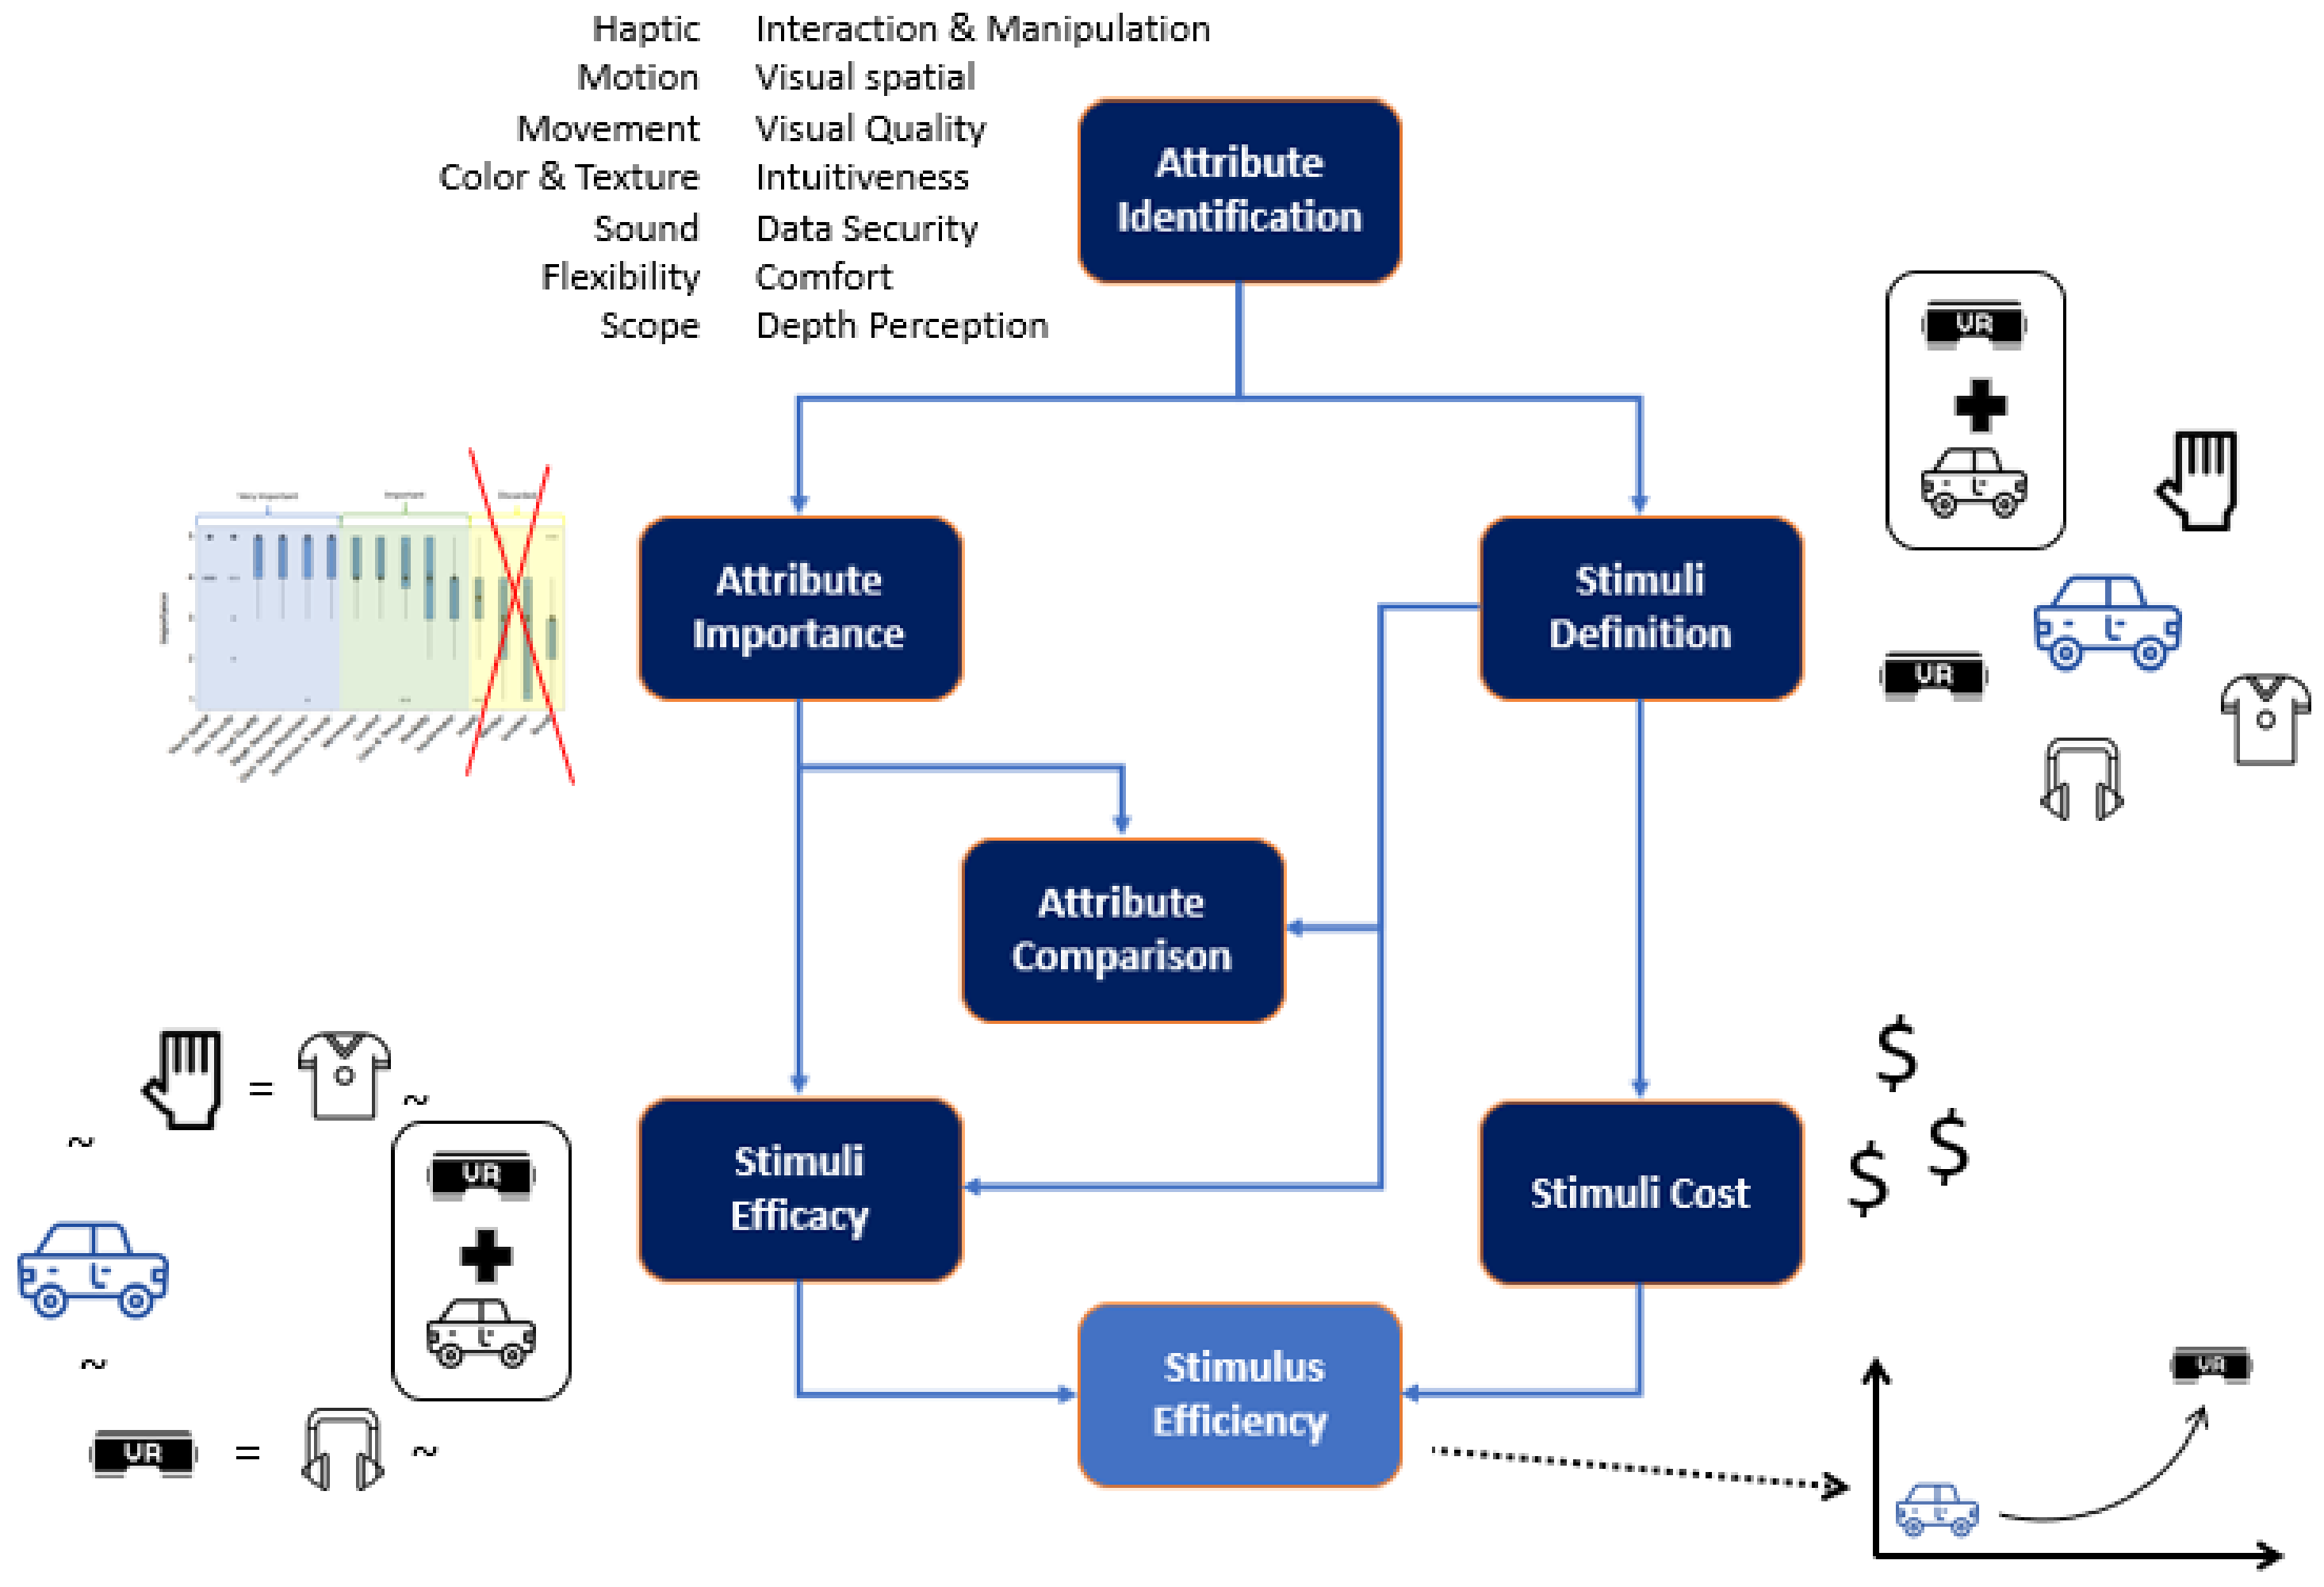
2. Materials and Methods
2.1. Attribute Identification
- Interaction and Manipulation—Customers’ capacity to interact with stimuli such as walking around the vehicle, opening the side door/liftgate, sitting inside the vehicle, and so on.
- Visual-Spatial—The capacity of a customer to perceive the stimuli on a 1:1 scale.
- Visual Quality—Stimulus visual similarity with the final vehicle shape and design.
- Intuitiveness—Customer intuitiveness to interact with stimulus or utilize VR equipment during clinic.
- Data Security—Data and information security before to, during, and after the clinic, such as the potential of non-authorized personnel taking stimulus photographs, gaining access to stimulus, and so on.
- Comfort—Physical sensations of the customer during the interview (nausea of looking too long to stimulus, screen, etc.). Difficulty carrying/manipulating clinic-required equipment (Ex: heavy virtual reality vests, uncomfortable headsets, etc.).
- Depth Perception—Depth perception is the ability to perceive the stimulus’s three-dimensional volume and spatial layout.
- Haptic—Perception of being able to grasp or touch surfaces or objects in the stimulus. For example, touch the steering column, reach operational switches/buttons, and so on.
- Motion—While one of them is moving, the perception of customer movement in relation to the stimulus. For example, perception of customer movement while walking around the stimulus, and so forth.
- Movement—Customers’ perceptions of their position vary in response to the stimulus or a piece of it.
- Color and Texture—The Color and Texture of the stimulus are similar to those of a real car.
- Sound—The audible feedback while moving, knocking, and so on stimulus. For instance, a door closing sound, a switch “click” sound when triggered, and so on.
- Flexibility—The possibility to research stimulus with various series, content, colors and textures, and so on.
- Location—The clinic’s proximity to the interviewee’s house (to avoid interviewee travel, etc.).
2.2. Stimuli Definition
2.3. Attribute Importance
- Not Important
- Somewhat Important
- Moderate
- Important
- Very Important
2.4. Stimuli Efficacy
2.5. Stimuli Cost
3. Results and Discussion
3.1. Hypothesis Definition
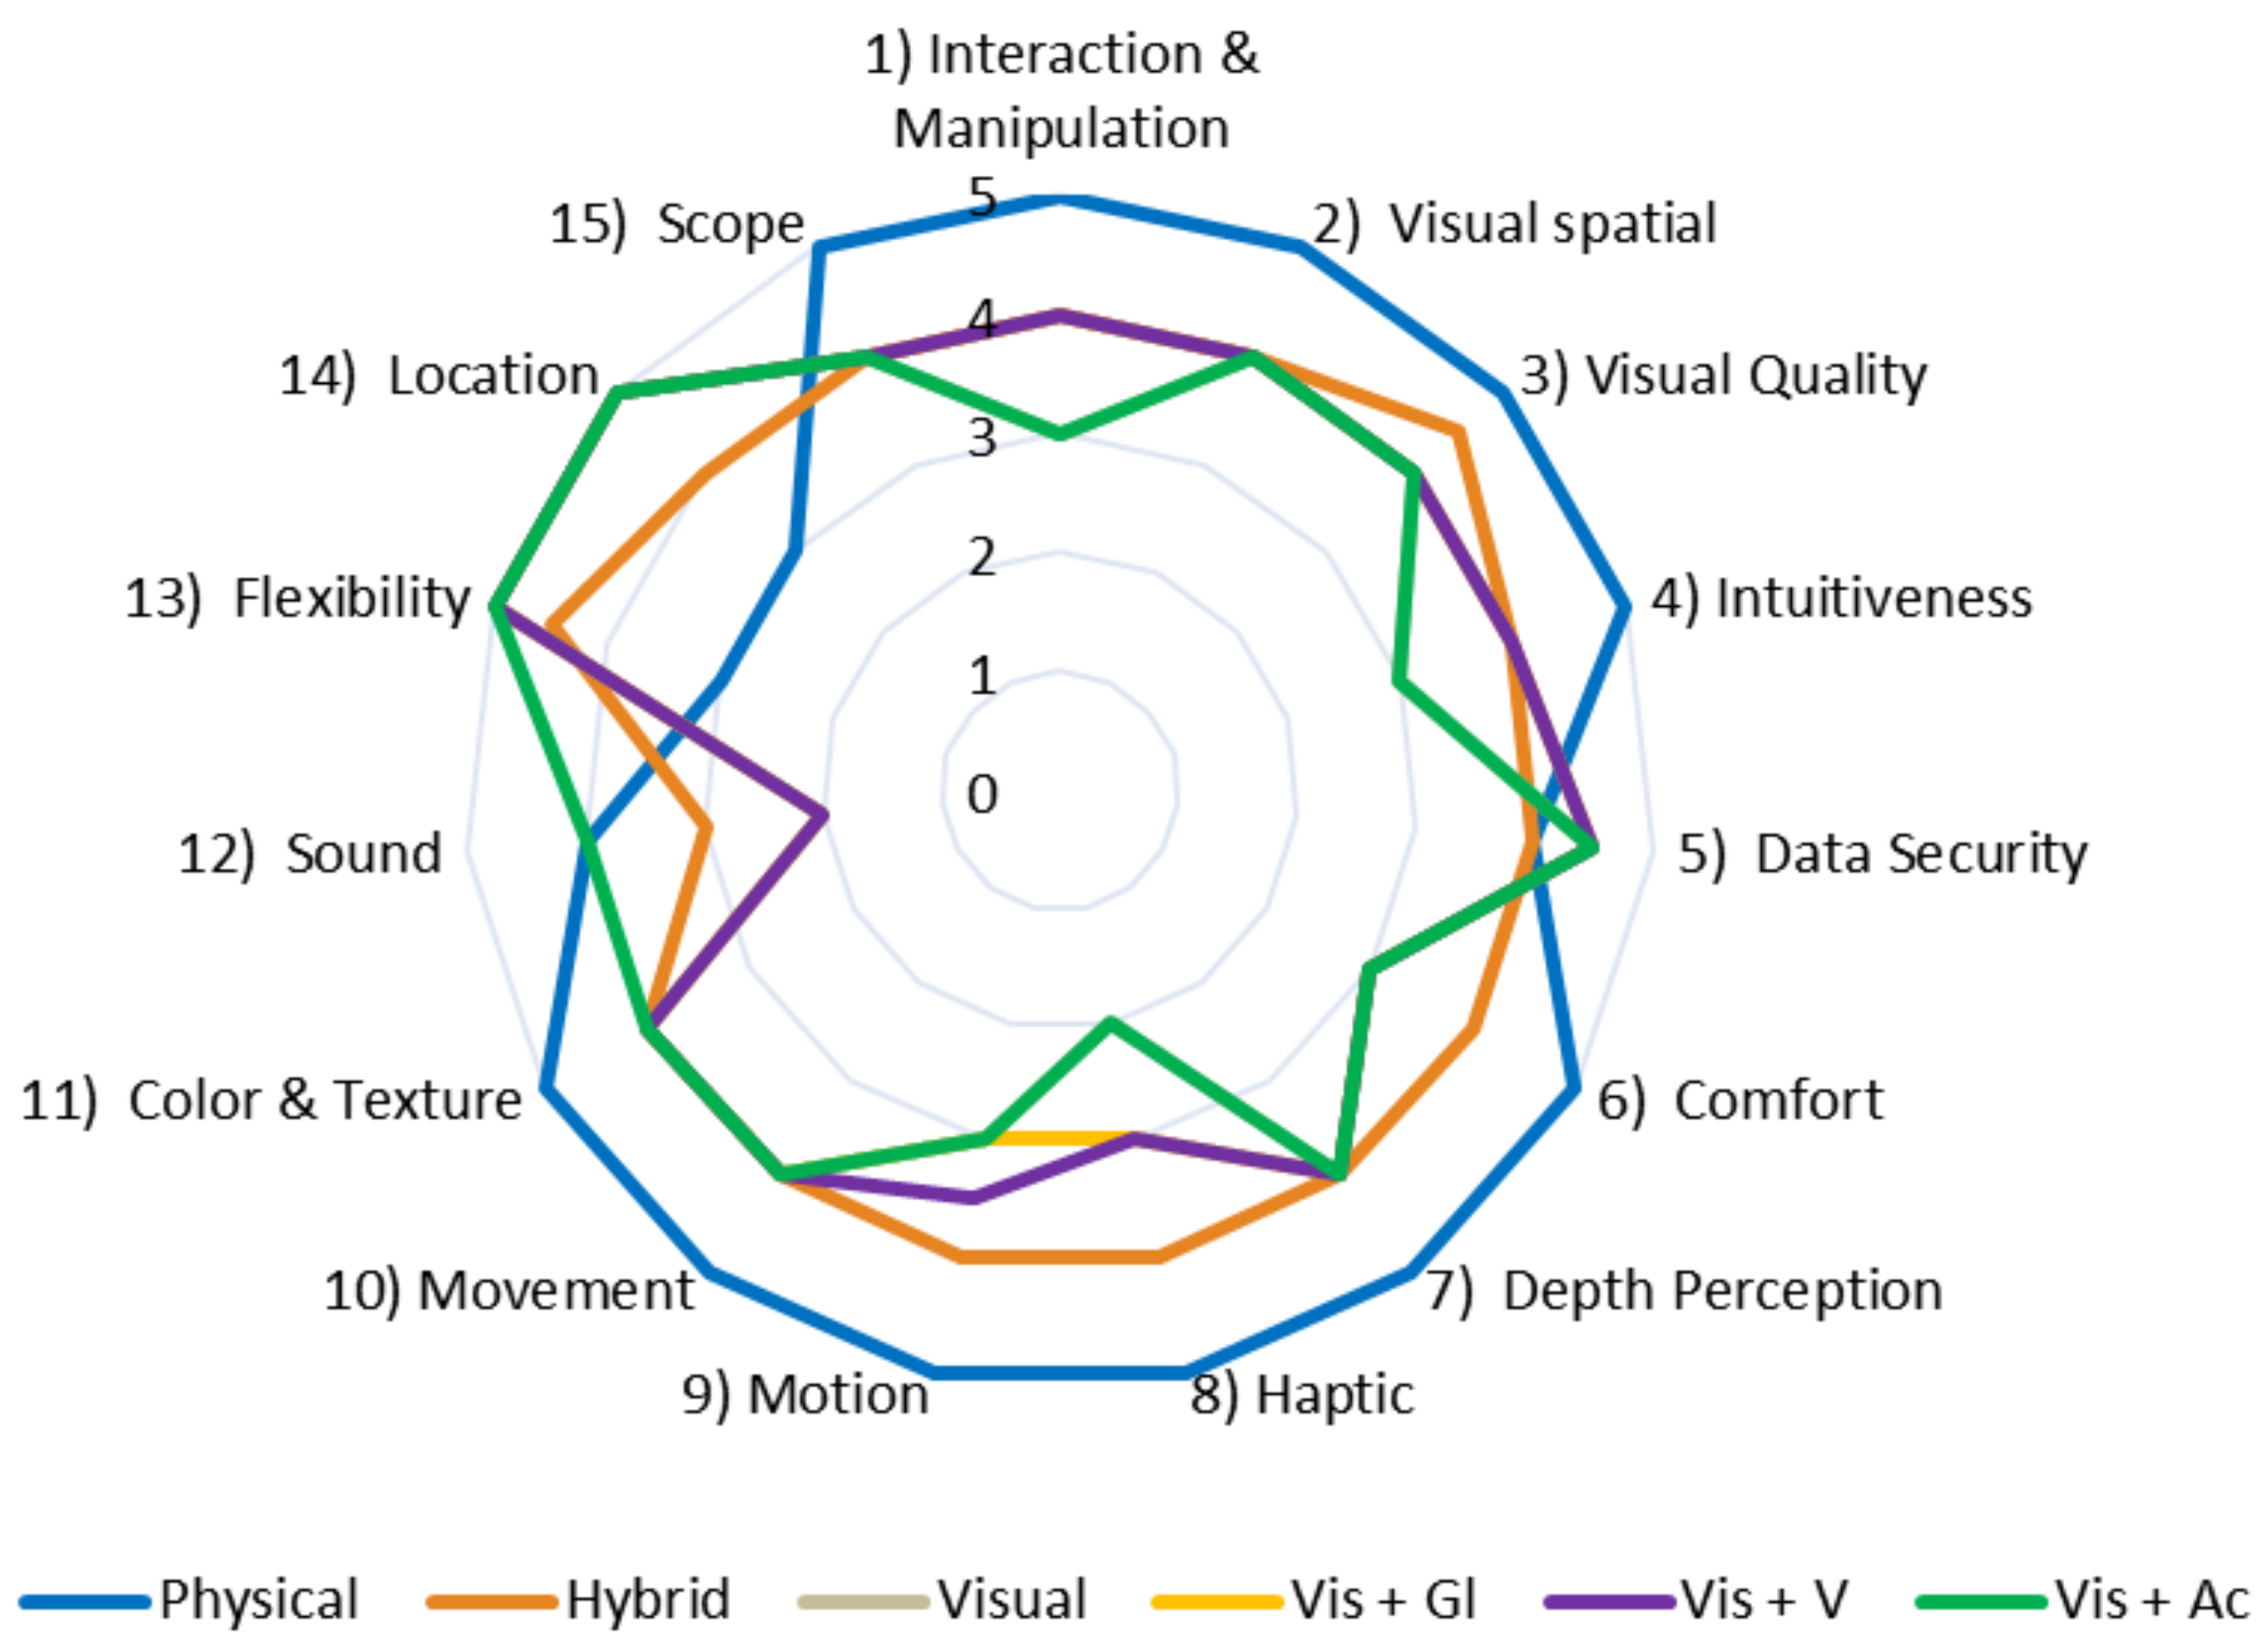
3.2. Attribute Importance Results
- Very Important (Score 5)—Visual-Spatial, Data Security, Visual Quality, Depth Perception, Interaction and Manipulation, and Scope attributes;
- Important (Score 4)—Movement, Comfort, Color and Texture, Flexibility, and Intuitiveness at-tributes.
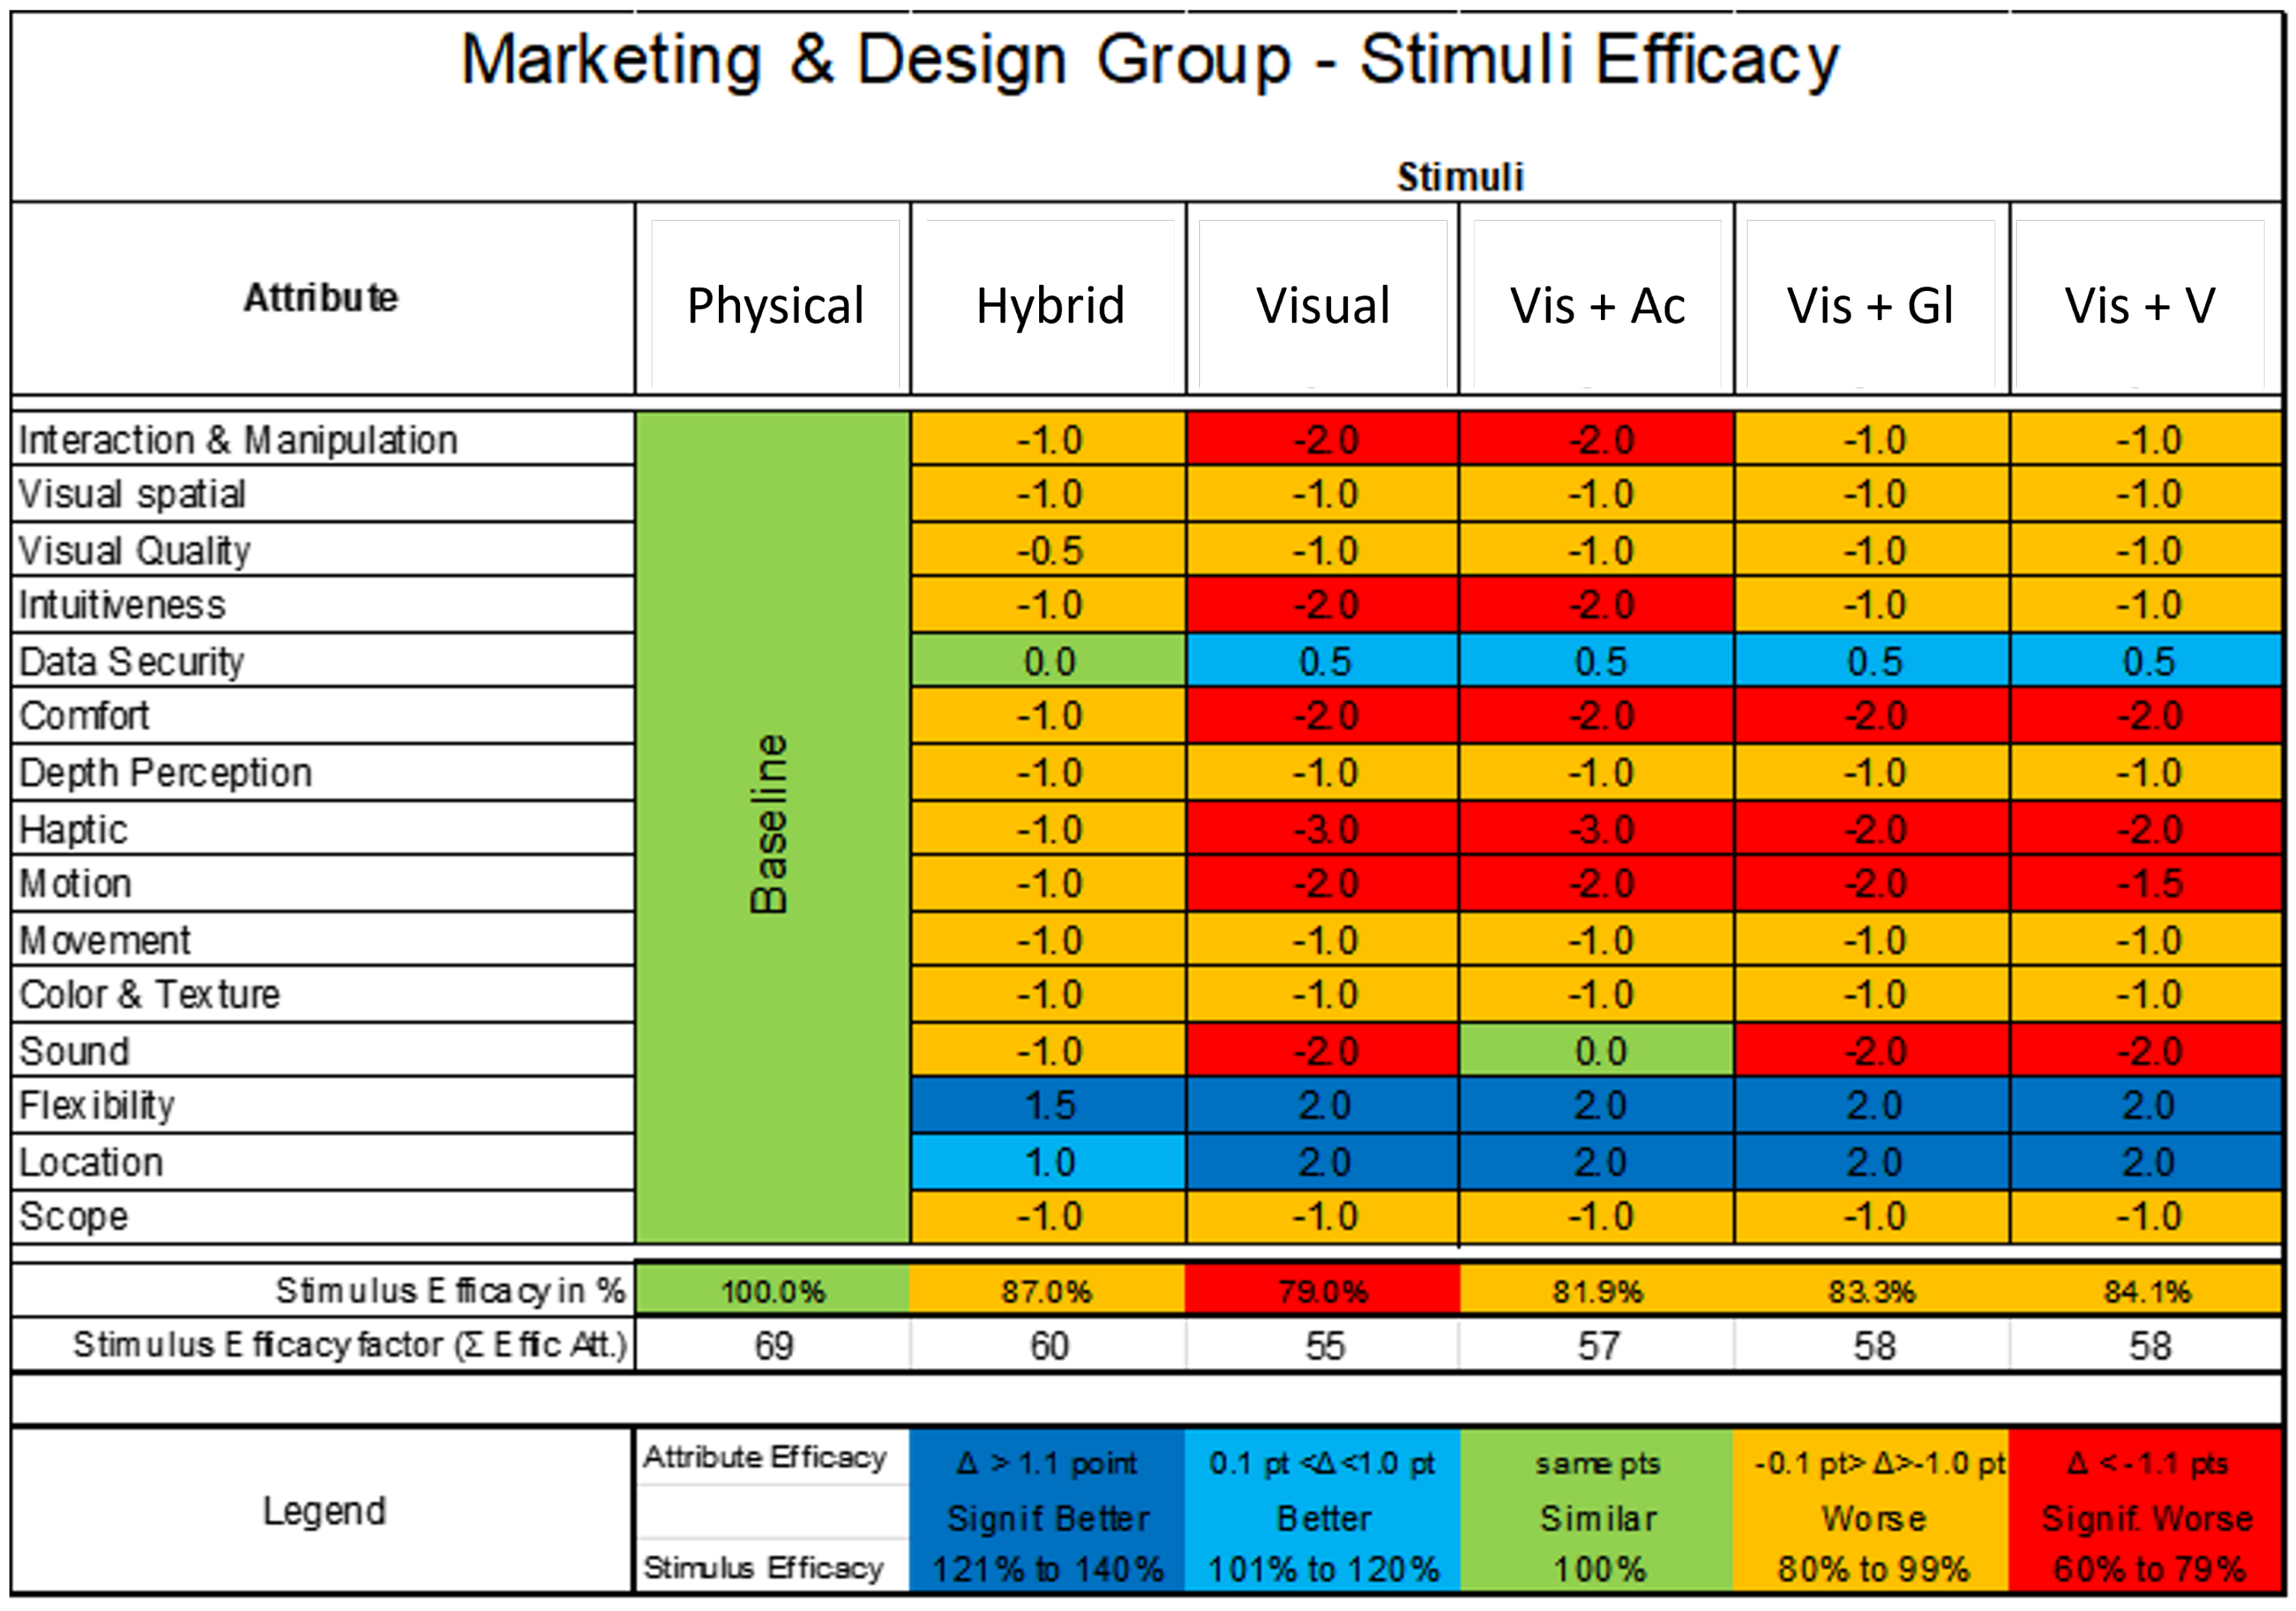
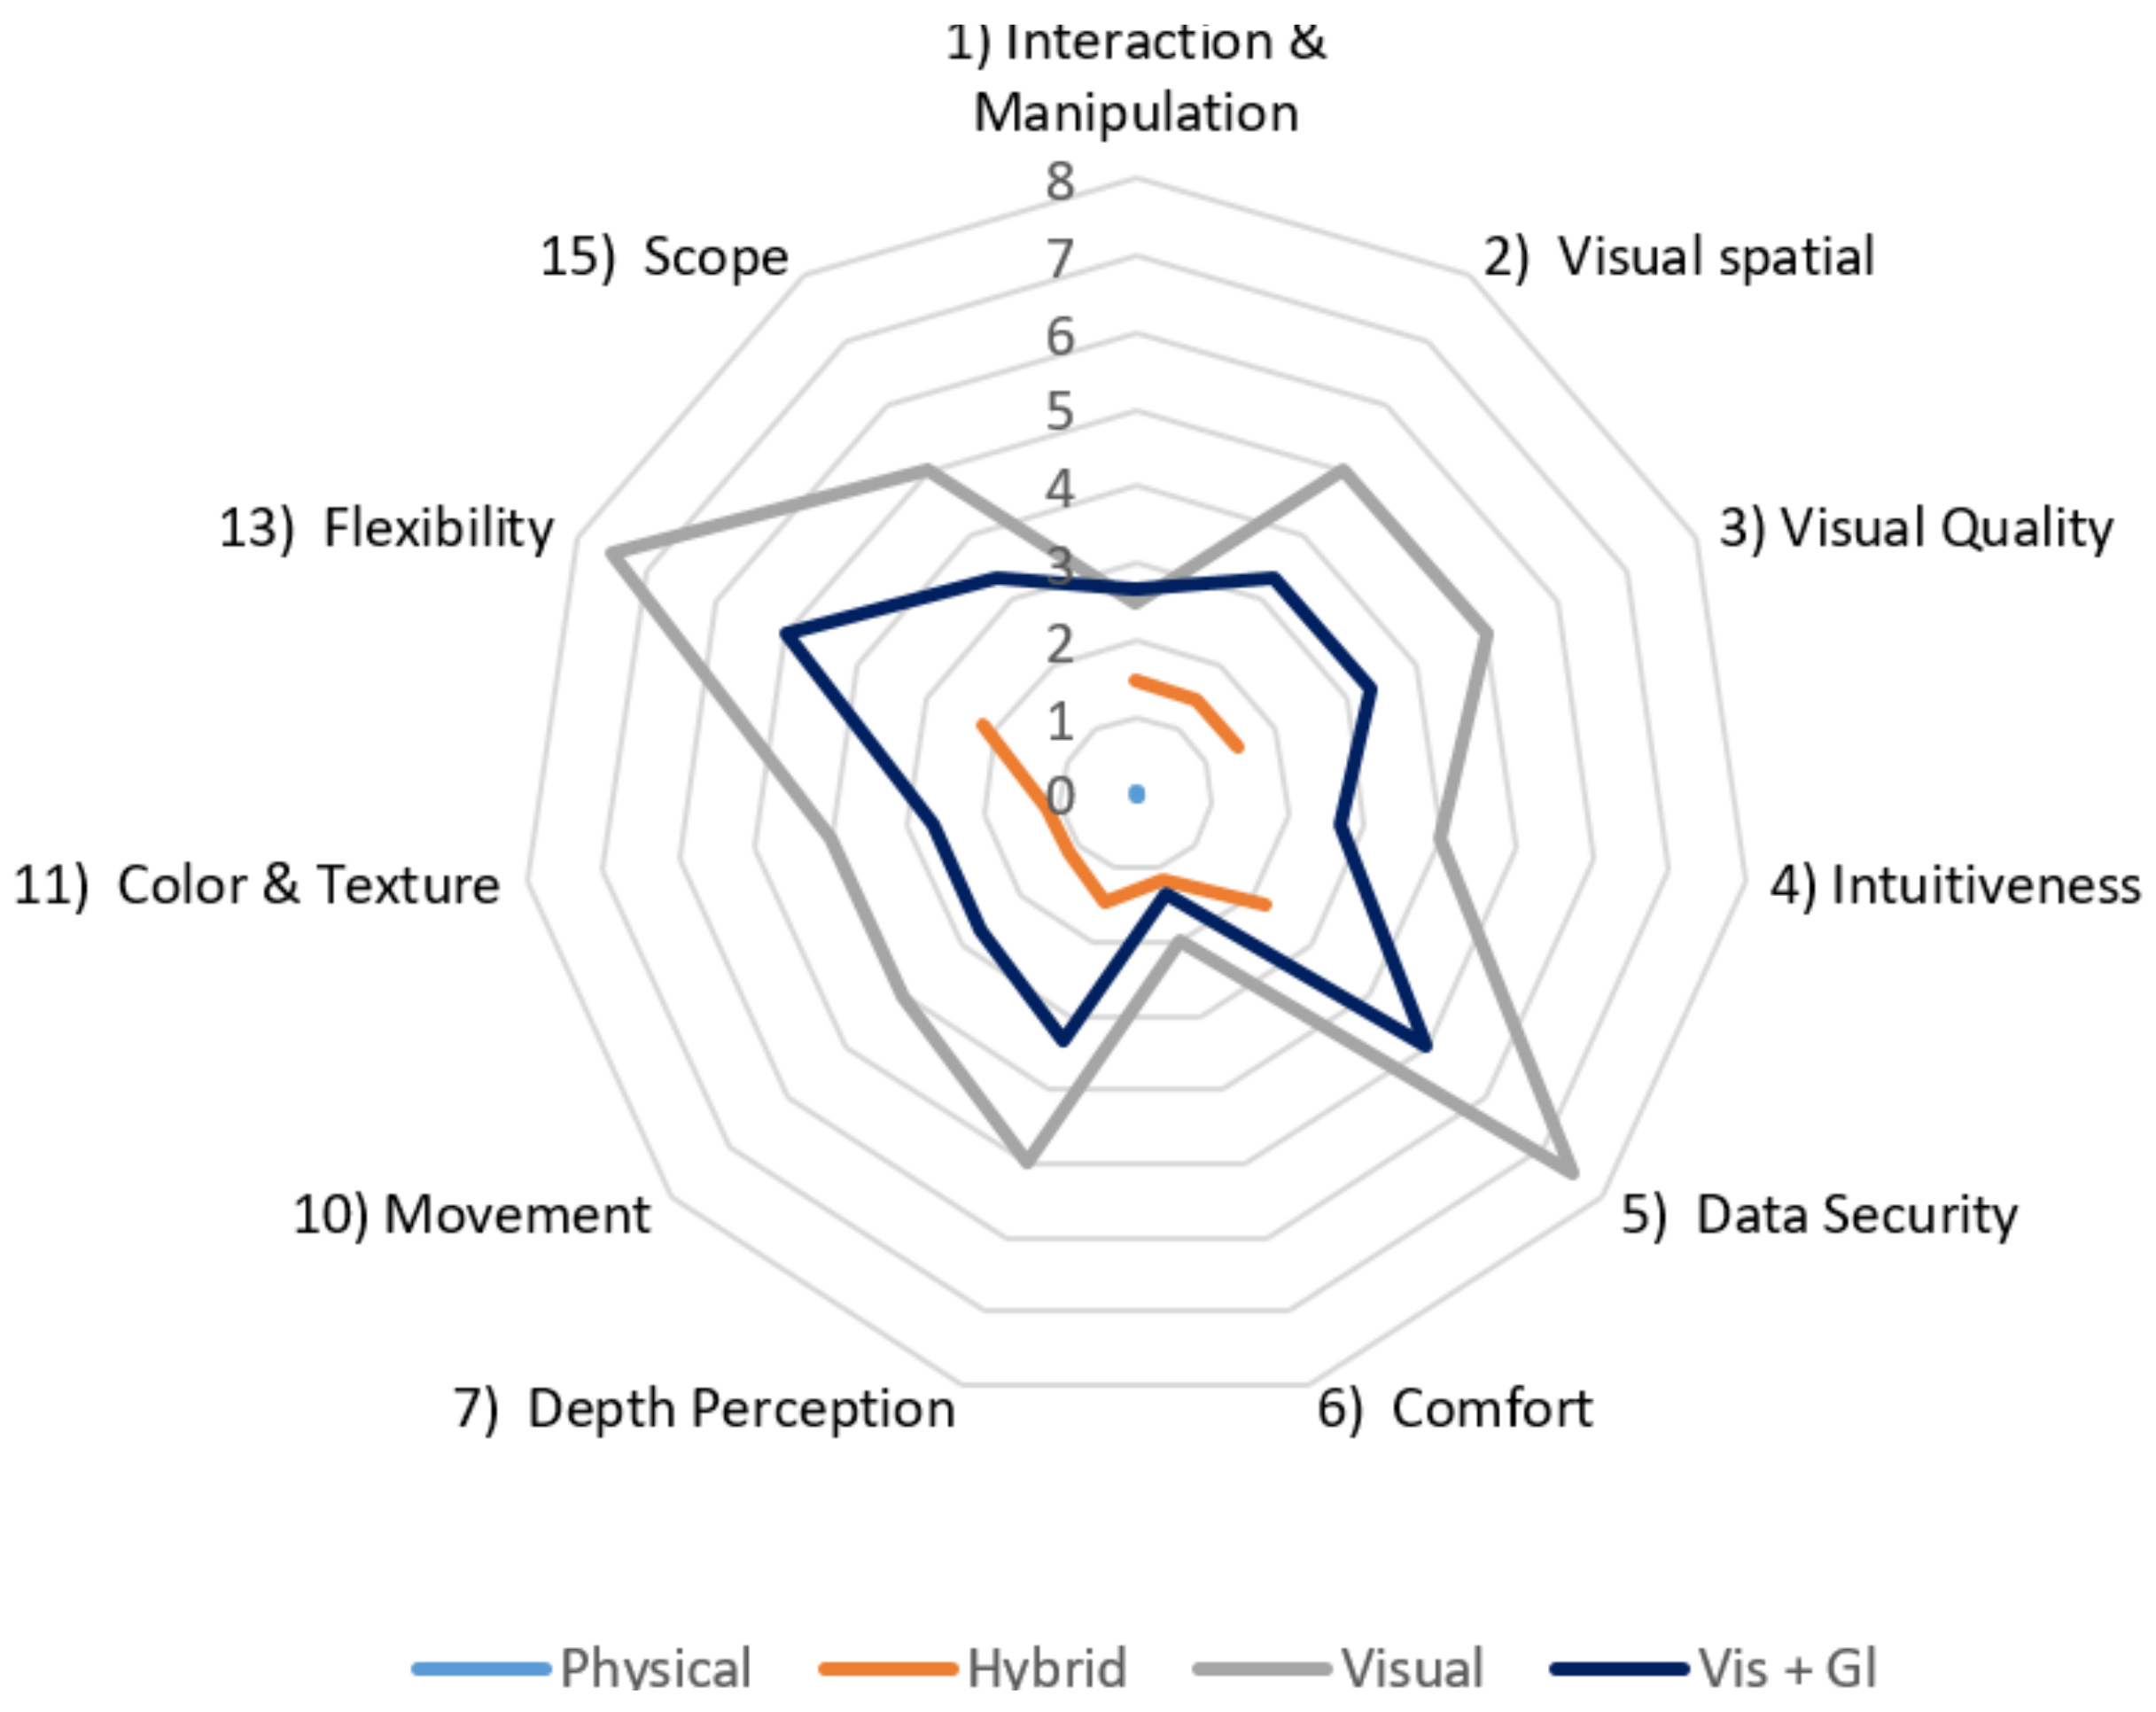
3.3. Stimuli Efficacy—Marketing and Design Group
3.4. Stimuli Efficacy—Product Development and VR Group
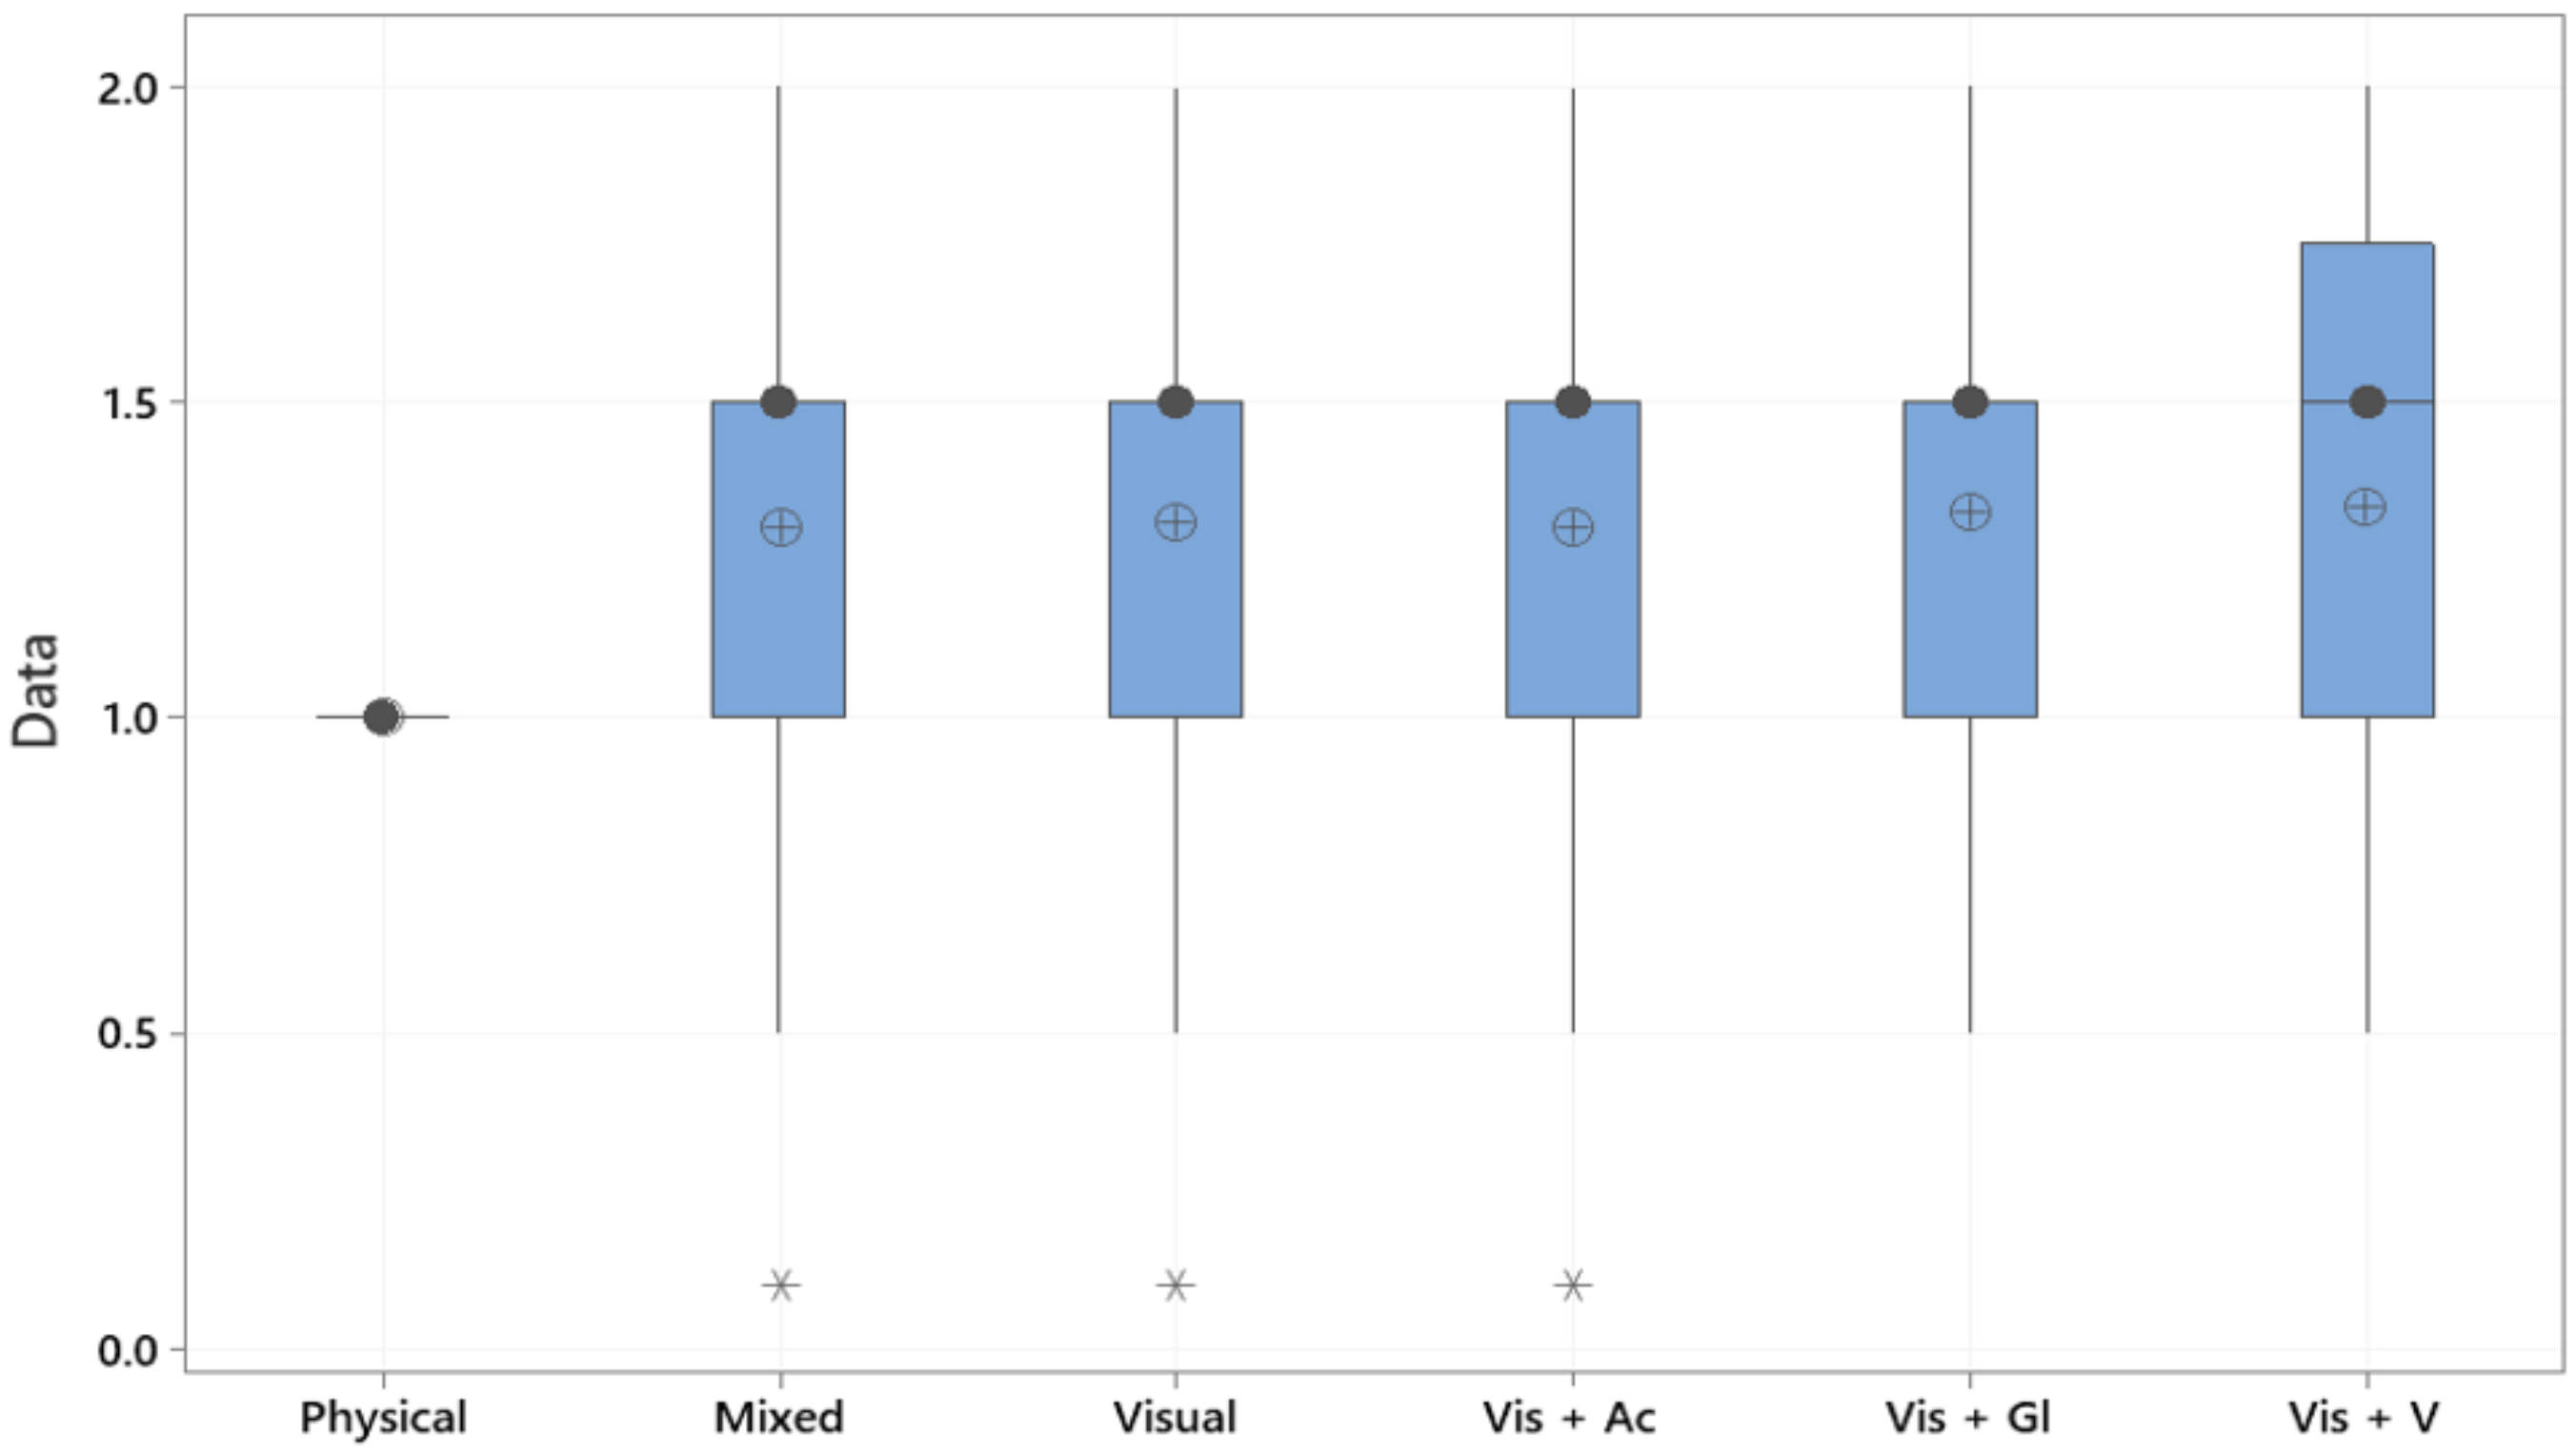
3.4.1. Stimuli Efficacy Results
3.4.2. Stimuli Efficacy—Final Considerations
3.5. Stimuli Cost Factor
3.6. Performance Evaluation Model
4. Conclusions
Supplementary Materials
Author Contributions
Funding
Institutional Review Board Statement
Informed Consent Statement
Data Availability Statement
Conflicts of Interest
Abbreviations
| NDA | No Data Available |
| CNPq | National Council for Scientific and Technological Development |
| Vis + Ac | Visual and Acoustic Virtual Stimulus |
| Vis + Gl | Visual and Haptical Gloves Virtual Stimulus |
| Vis + V | Visual and Haptical Vest Virtual Stimulus |
References
- De Clerk, M.; Dangelmaier, M.; Schmierer, G.; Spath, D. User Centered Design of Interaction Techniques for VR-Based Automotive Design Reviews. Front. Robot. AI 2019, 6, 13. [Google Scholar] [CrossRef] [PubMed] [Green Version]
- Hashim, A.M.; Whitfield, T.; Jackson, S.; Effendi, R.A.A.R. The application of experimental aesthetics to a marketing research method in the automotive industry. In Proceedings of the 2nd International Conference on Management, Economy, Education, Social Science and Technology (METEC2021), Penang, Malaysia, 26–27 June 2021. [Google Scholar]
- Henriques, A.C.; Winkler, I. The Advancement of Virtual Reality in Automotive Market Research: Challenges and Opportunities. Appl. Sci. 2021, 11, 11610. [Google Scholar] [CrossRef]
- Real or Virtual: Car Clinics in the Method Test. Nuremberg Institute for Market Decisions. 2022. Available online: https://www.nim.org/en/compact/focustopics/real-or-virtual-car-clinics-method-test (accessed on 17 November 2021).
- Jerald, J. The VR Book: Human-Centered Design for Virtual Reality; Morgan & Claypool: San Rafael, CA, USA, 2015. [Google Scholar]
- Firu, A.C.; Tapîrdea, A.I.; Feier, A.I.; Drăghici, G. Virtual reality in the automotive field in industry 4.0. Mater. Today Proc. 2021, 45, 4177–4182. [Google Scholar] [CrossRef]
- Wolfartsberger, J. Analyzing the potential of Virtual Reality for engineering design review. Autom. Constr. 2019, 104, 27–37. [Google Scholar] [CrossRef]
- Lawson, G.; Salanitri, D.; Waterfield, B. Future directions for the development of virtual reality within an automotive manufacturer. Appl. Ergon. 2016, 53, 323–330. [Google Scholar] [CrossRef] [PubMed]
- Hanson, L. The Use and Usage of Virtual Reality Technologies in Planning and Implementing New Workstations. In Proceedings of the 6th International Digital Human Modeling Symposium, Skövde, Sweden, 31 August–2 September 2020; IOS Press: Amsterdam, The Netherlands, 2020; Volume 11, p. 388. [Google Scholar]
- Čujan, Z.; Fedorko, G.; Mikušová, N. Application of virtual and augmented reality in automotive. Open Eng. 2020, 10, 113–119. [Google Scholar] [CrossRef]
- Mousavi, M.; Aziz, F.I. Opportunities and constraints of virtual reality application in international and domestic car companies of Malaysia. In Proceedings of the 2012 UKSim 14th International Conference on Computer Modelling and Simulation, Cambridge, UK, 28–30 March 2012; pp. 273–277. [Google Scholar]
- Lombart, C.; Millan, E.; Normand, J.M.; Verhulst, A.; Labbé-Pinlon, B.; Moreau, G. Effects of physical, non-immersive virtual, and immersive virtual store environments on consumers’ perceptions and purchase behavior. Comput. Hum. Behav. 2020, 110, 106374. [Google Scholar] [CrossRef]
- De Clerk, M.; Schmierer, G.; Dangelmaier, M.; Spath, D. Interaction techniques for virtual reality based automotive design reviews. In Proceedings of the International Conference on Virtual Reality and Augmented Reality, Las Vegas, FL, USA, 15–20 July 2017; pp. 39–48. [Google Scholar]
- Kang, H.J.; Shin, J.H.; Ponto, K. How 3D virtual reality stores can shape consumer purchase decisions: The roles of informativeness and playfulness. J. Interact. Mark. 2020, 49, 70–85. [Google Scholar] [CrossRef]
- Wedel, M.; Bigné, E.; Zhang, J. Virtual and augmented reality: Advancing research in consumer marketing. Int. J. Res. Mark. 2020, 37, 443–465. [Google Scholar] [CrossRef]
- Lawson, G.; Salanitri, D.; Waterfield, B. Vr processes in the automotive industry. In Proceedings of the International Conference on Human-Computer Interaction, Los Angeles, CA, USA, 2–7 August 2015; pp. 208–217. [Google Scholar]
- Kumari, S.; Polke, N. Implementation Issues of Augmented Reality and Virtual Reality: A Survey. In International Conference on Intelligent Data Communication Technologies and Internet of Things; Springer: Berlin/Heidelberg, Germany, 2018; pp. 853–861. [Google Scholar]
- Górski, F.; Buń, P.; Wichniarek, R.; Zawadzki, P.; Hamrol, A. Design and implementation of a complex virtual reality system for product design with active participation of end user. In Advances in Human Factors, Software, and Systems Engineering; Springer: Berlin/Heidelberg, Germany, 2016; pp. 31–43. [Google Scholar]
- Singh, H.; Singh, C.; Majumdar, R. Virtual reality as a marketing tool. In Emerging Trends in Expert Applications and Security; Springer: Berlin/Heidelberg, Germany, 2019; pp. 445–450. [Google Scholar]
- Hoermann, M.; Schwalm, M. Evaluation of a Vehicle Exterior’s Sportiness Under Real vs. Virtual Conditions. In Proceedings of the International Conference on Virtual, Augmented and Mixed Reality, Las Vegas, FL, USA, 15–20 July 2015; Springer: Berlin/Heidelberg, Germany, 2015; pp. 470–479. [Google Scholar]
- Loureiro, S.M.C.; Guerreiro, J.; Eloy, S.; Langaro, D.; Panchapakesan, P. Understanding the use of Virtual Reality in Marketing: A text mining-based review. J. Bus. Res. 2019, 100, 514–530. [Google Scholar] [CrossRef]
- Virtual Reality (VR) Market Share, Growth|Research Report, 2021–2028. 2021. Available online: https://www.fortunebusinessinsights.com/industry-reports/virtual-reality-market-101378 (accessed on 23 November 2021).
- Virtual Reality Gets a Boost during the Pandemic. 2021. Available online: https://www.ccsinsight.com/press/company-news/virtual-reality-gets-a-boost-during-the-pandemic/ (accessed on 23 November 2021).
- Chih-Pei, H.; Chang, Y.Y.; John, W. Creswell, research design: Qualitative, quantitative, and mixed methods approaches. J. Soc. Adm. Sci. 2017, 4, 205–207. [Google Scholar]
- Colquhoun, D. An investigation of the false discovery rate and the misinterpretation of p-values. R. Soc. Open Sci. 2014, 1, 140216. [Google Scholar] [CrossRef] [PubMed] [Green Version]
- KPMG. 22nd Annual Global Automotive Executive Survey 2021: Industry Leaders Foresee Dramatic Changes. Where the Opportunities May Lie. 2021. Available online: https://assets.kpmg/content/dam/kpmg/xx/pdf/2021/11/global-automotive-executive-summary-2021.pdf (accessed on 10 January 2022).
- Statista. Vehicle Purchase Decision Making Factors 2015. Available online: https://www.statista.com/statistics/511842/vehicle-purchase-decision-making-factors-uk-survey (accessed on 10 December 2021).
- He, L.; Hoyle, C.; Chen, W. Examination of customer satisfaction surveys in choice modelling to support engineering design. J. Eng. Des. 2011, 22, 669–687. [Google Scholar] [CrossRef]
- Cho, H.; Hasija, S.; Sosa, M. How Important is Design for the Automobile Value Chain? INSEAD Working Paper No. 2015/86/TOM. 2015. Available online: http://dx.doi.org/10.2139/ssrn.2683913 (accessed on 10 January 2022).
- Enoch, J.; McDonald, L.; Jones, L.; Jones, P.R.; Crabb, D.P. Evaluating whether sight is the most valued sense. JAMA Ophthalmol. 2019, 137, 1317–1320. [Google Scholar] [CrossRef] [PubMed]
- Martilla, J.A.; James, J.C. Importance-performance analysis. J. Mark. 1977, 41, 77–79. [Google Scholar] [CrossRef]
- Oh, H. Revisiting importance–performance analysis. Tour. Manag. 2001, 22, 617–627. [Google Scholar] [CrossRef]
- Sundqvist, E.; Backlund, F.; Chronéer, D. What is project efficiency and effectiveness? Procedia-Soc. Behav. Sci. 2014, 119, 278–287. [Google Scholar] [CrossRef] [Green Version]


| Stimuli | Definition |
|---|---|
| Base Stimulus—1:1 Physical Stimulus (Physical) | Hard models in 1:1 scale simulating the exterior and interior design of the vehicle. Accurate replicas of final design in terms of appearance with very limited functionality incorporated (ex: push-up, moving sliders, seating position, etc.) |
| Stimulus 1—Hybrid Reality Stimulus (Hybrid or Mixed) | Virtual visual interior and exterior models with accurate final design in terms of appearance supported with physical prototype 1:1 scale (seat buck structures simulating front and rear seat rows and instrumental panel). Physical prototype provide very limited physical functionality incorporated (ex: push-up, moving sliders, seating position, etc.). Virtual visual model assessed through a stereoscopic head mounted google device |
| Stimulus 2—Visual Virtual Stimulus (Visual) | Virtual visual interior and exterior models with accurate final design in terms of appearance. Virtual visual model assessed through a stereoscopic head mounted google device |
| Stimulus 3—Visual and Acoustic Virtual Stimulus (Vis + Ac) | Virtual visual interior and exterior models with accurate final design in terms of appearance supported with Virtual Acoustic attributes providing limited virtual functionality incorporated (ex: sound to open door, sound to push button, etc.). Virtual visual model assessed through a stereoscopic head mounted google with headphone incorporated |
| Stimulus 4—Visual and Haptical Gloves Virtual Stimulus (Vis + Gl) | Virtual visual interior and exterior models with accurate final design in terms of appearance supported with virtual Haptic attributes providing limited virtual functionality incorporated (ex: push-up, moving sliders, etc.). Virtual visual model assessed through a stereoscopic head mounted google device and Haptic attributes assessed through sensor gloves |
| Stimulus 5—Visual and Haptical Vest Virtual Stimulus (Vis + V) | Virtual visual interior and exterior models with accurate final design in terms of appearance supported with virtual Haptic attributes providing limited virtual functionality incorporated (ex: push-up, moving sliders, seating position, etc.). Virtual visual model assessed through a stereoscopic head mounted google device and Haptic attributes assessed through the sensor vest’s option track |
| Variable | Count | Mean | Standard Error Mean | Variance | Coefficient of Variation | Minimum | Q1 | Median | Q3 | Maximum | Interquartile Range | Mode | N for Mode | Skewness | Kurtosis |
|---|---|---|---|---|---|---|---|---|---|---|---|---|---|---|---|
| Visual-Spatial | 30 | 4.8 | 0.0743 | 0.1655 | 8.48 | 4 | 5 | 5 | 5 | 5 | 0 | 5 | 24 | −1.58 | 0.53 |
| Data Security | 30 | 4.767 | 0.124 | 0.461 | 14.24 | 2 | 5 | 5 | 5 | 5 | 0 | 5 | 26 | −3.22 | 10.46 |
| Visual Quality | 30 | 4.633 | 0.102 | 0.309 | 12 | 3 | 4 | 5 | 5 | 5 | 1 | 5 | 20 | −1.22 | 0.62 |
| Depth Perception | 30 | 4.6 | 0.103 | 0.317 | 12.24 | 3 | 4 | 5 | 5 | 5 | 1 | 5 | 19 | −1.04 | 0.18 |
| Clinic Scope Restriction | 30 | 4.483 | 0.176 | 0.901 | 21.18 | 1 | 4 | 5 | 5 | 5 | 1 | 5 | 20 | −2.23 | 5.55 |
| Interaction & Manip. | 30 | 4.467 | 0.133 | 0.533 | 16.35 | 3 | 4 | 5 | 5 | 5 | 1 | 5 | 18 | −1.02 | −0.3 |
| Movement | 30 | 4.367 | 0.112 | 0.378 | 14.08 | 3 | 4 | 4 | 5 | 5 | 1 | 4 | 15 | −0.4 | −0.57 |
| Comfort | 30 | 4.267 | 0.117 | 0.409 | 14.99 | 3 | 4 | 4 | 5 | 5 | 1 | 4 | 16 | −0.29 | −0.55 |
| Color & Texture | 30 | 3.967 | 0.195 | 1.137 | 26.88 | 1 | 3.75 | 4 | 5 | 5 | 1.25 | 4 | 13 | −1.39 | 2.27 |
| Flexibility | 30 | 3.897 | 0.181 | 0.953 | 25.06 | 2 | 3 | 4 | 5 | 5 | 2 | 4 | 11 | −0.52 | −0.62 |
| Intuitiveness | 30 | 3.633 | 0.155 | 0.723 | 23.4 | 2 | 3 | 4 | 4 | 5 | 1 | 3 | 12 | 0.09 | −0.59 |
| Haptic | 30 | 3.467 | 0.196 | 1.154 | 30.99 | 1 | 3 | 3.5 | 4 | 5 | 1 | 3 | 11 | −0.53 | 0.24 |
| Motion | 30 | 3.067 | 0.191 | 1.099 | 34.18 | 1 | 2 | 3 | 4 | 5 | 2 | 3 | 10 | 0.24 | −0.63 |
| Location | 30 | 2.667 | 0.26 | 2.023 | 53.34 | 1 | 1 | 3 | 4 | 5 | 3 | 1 | 10 | 0.1 | −1.38 |
| Sound | 30 | 2.633 | 0.195 | 1.137 | 40.49 | 1 | 2 | 3 | 3 | 5 | 1 | 3 | 11 | 0.45 | 0.06 |
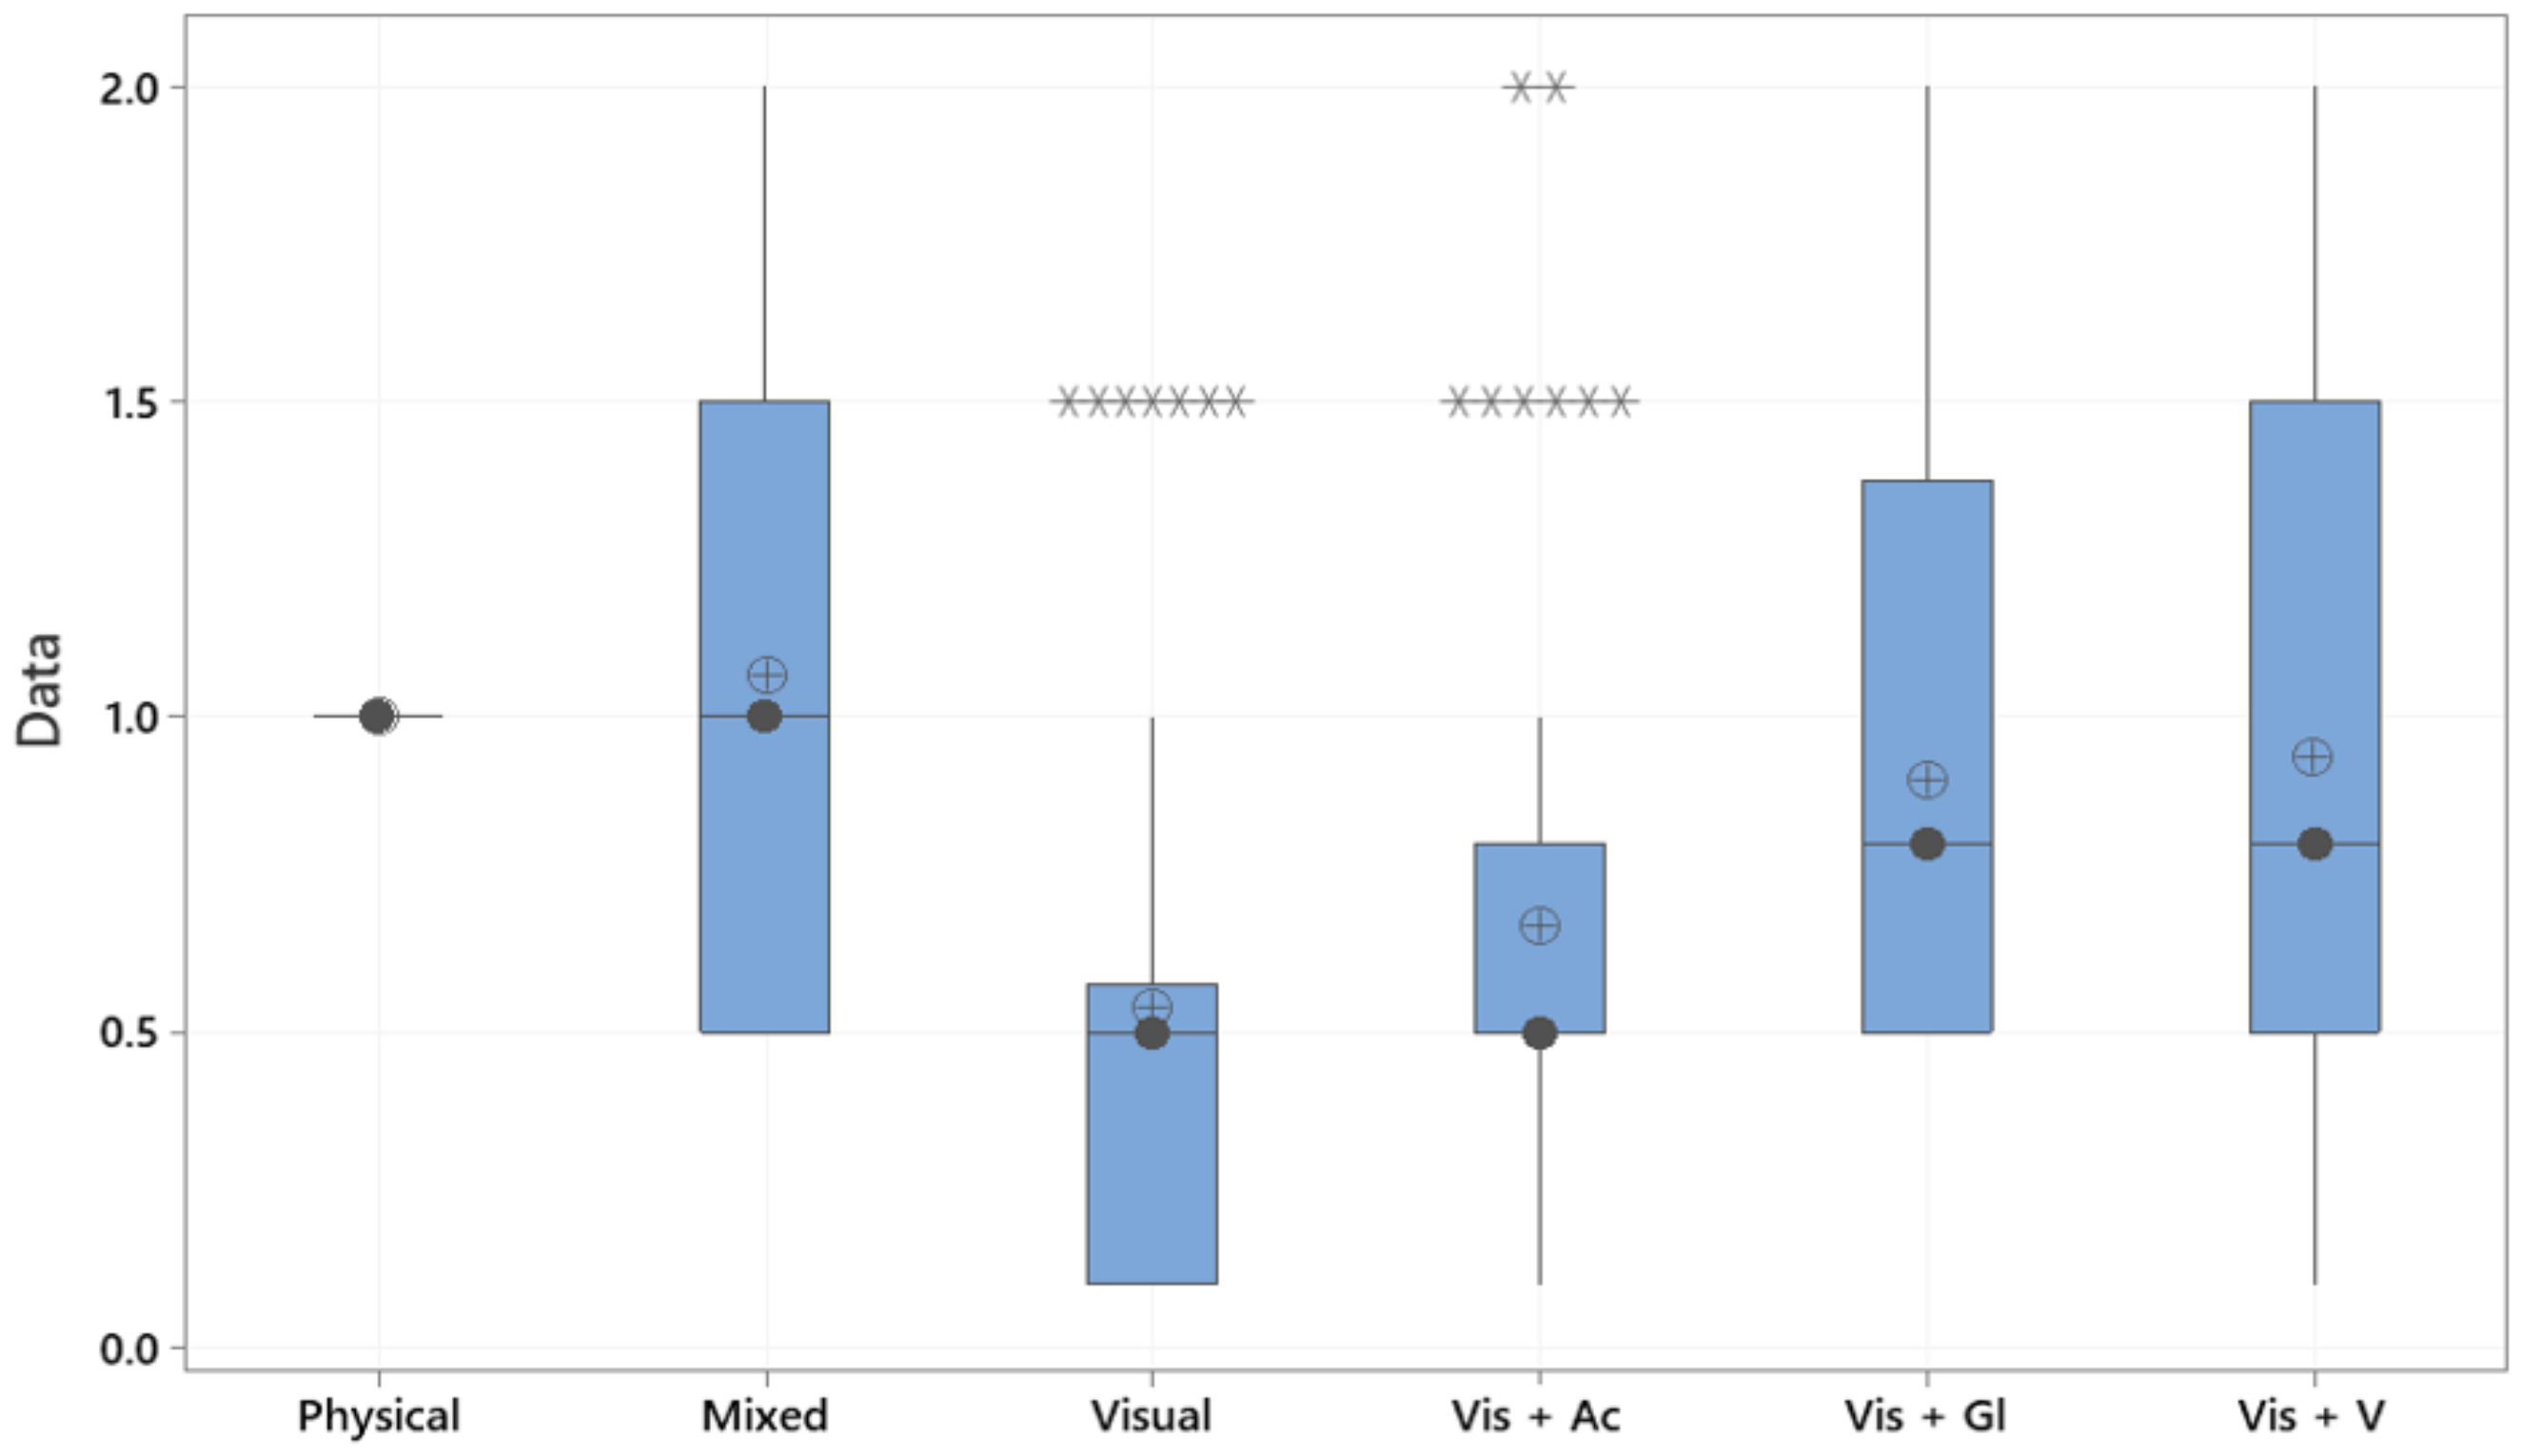
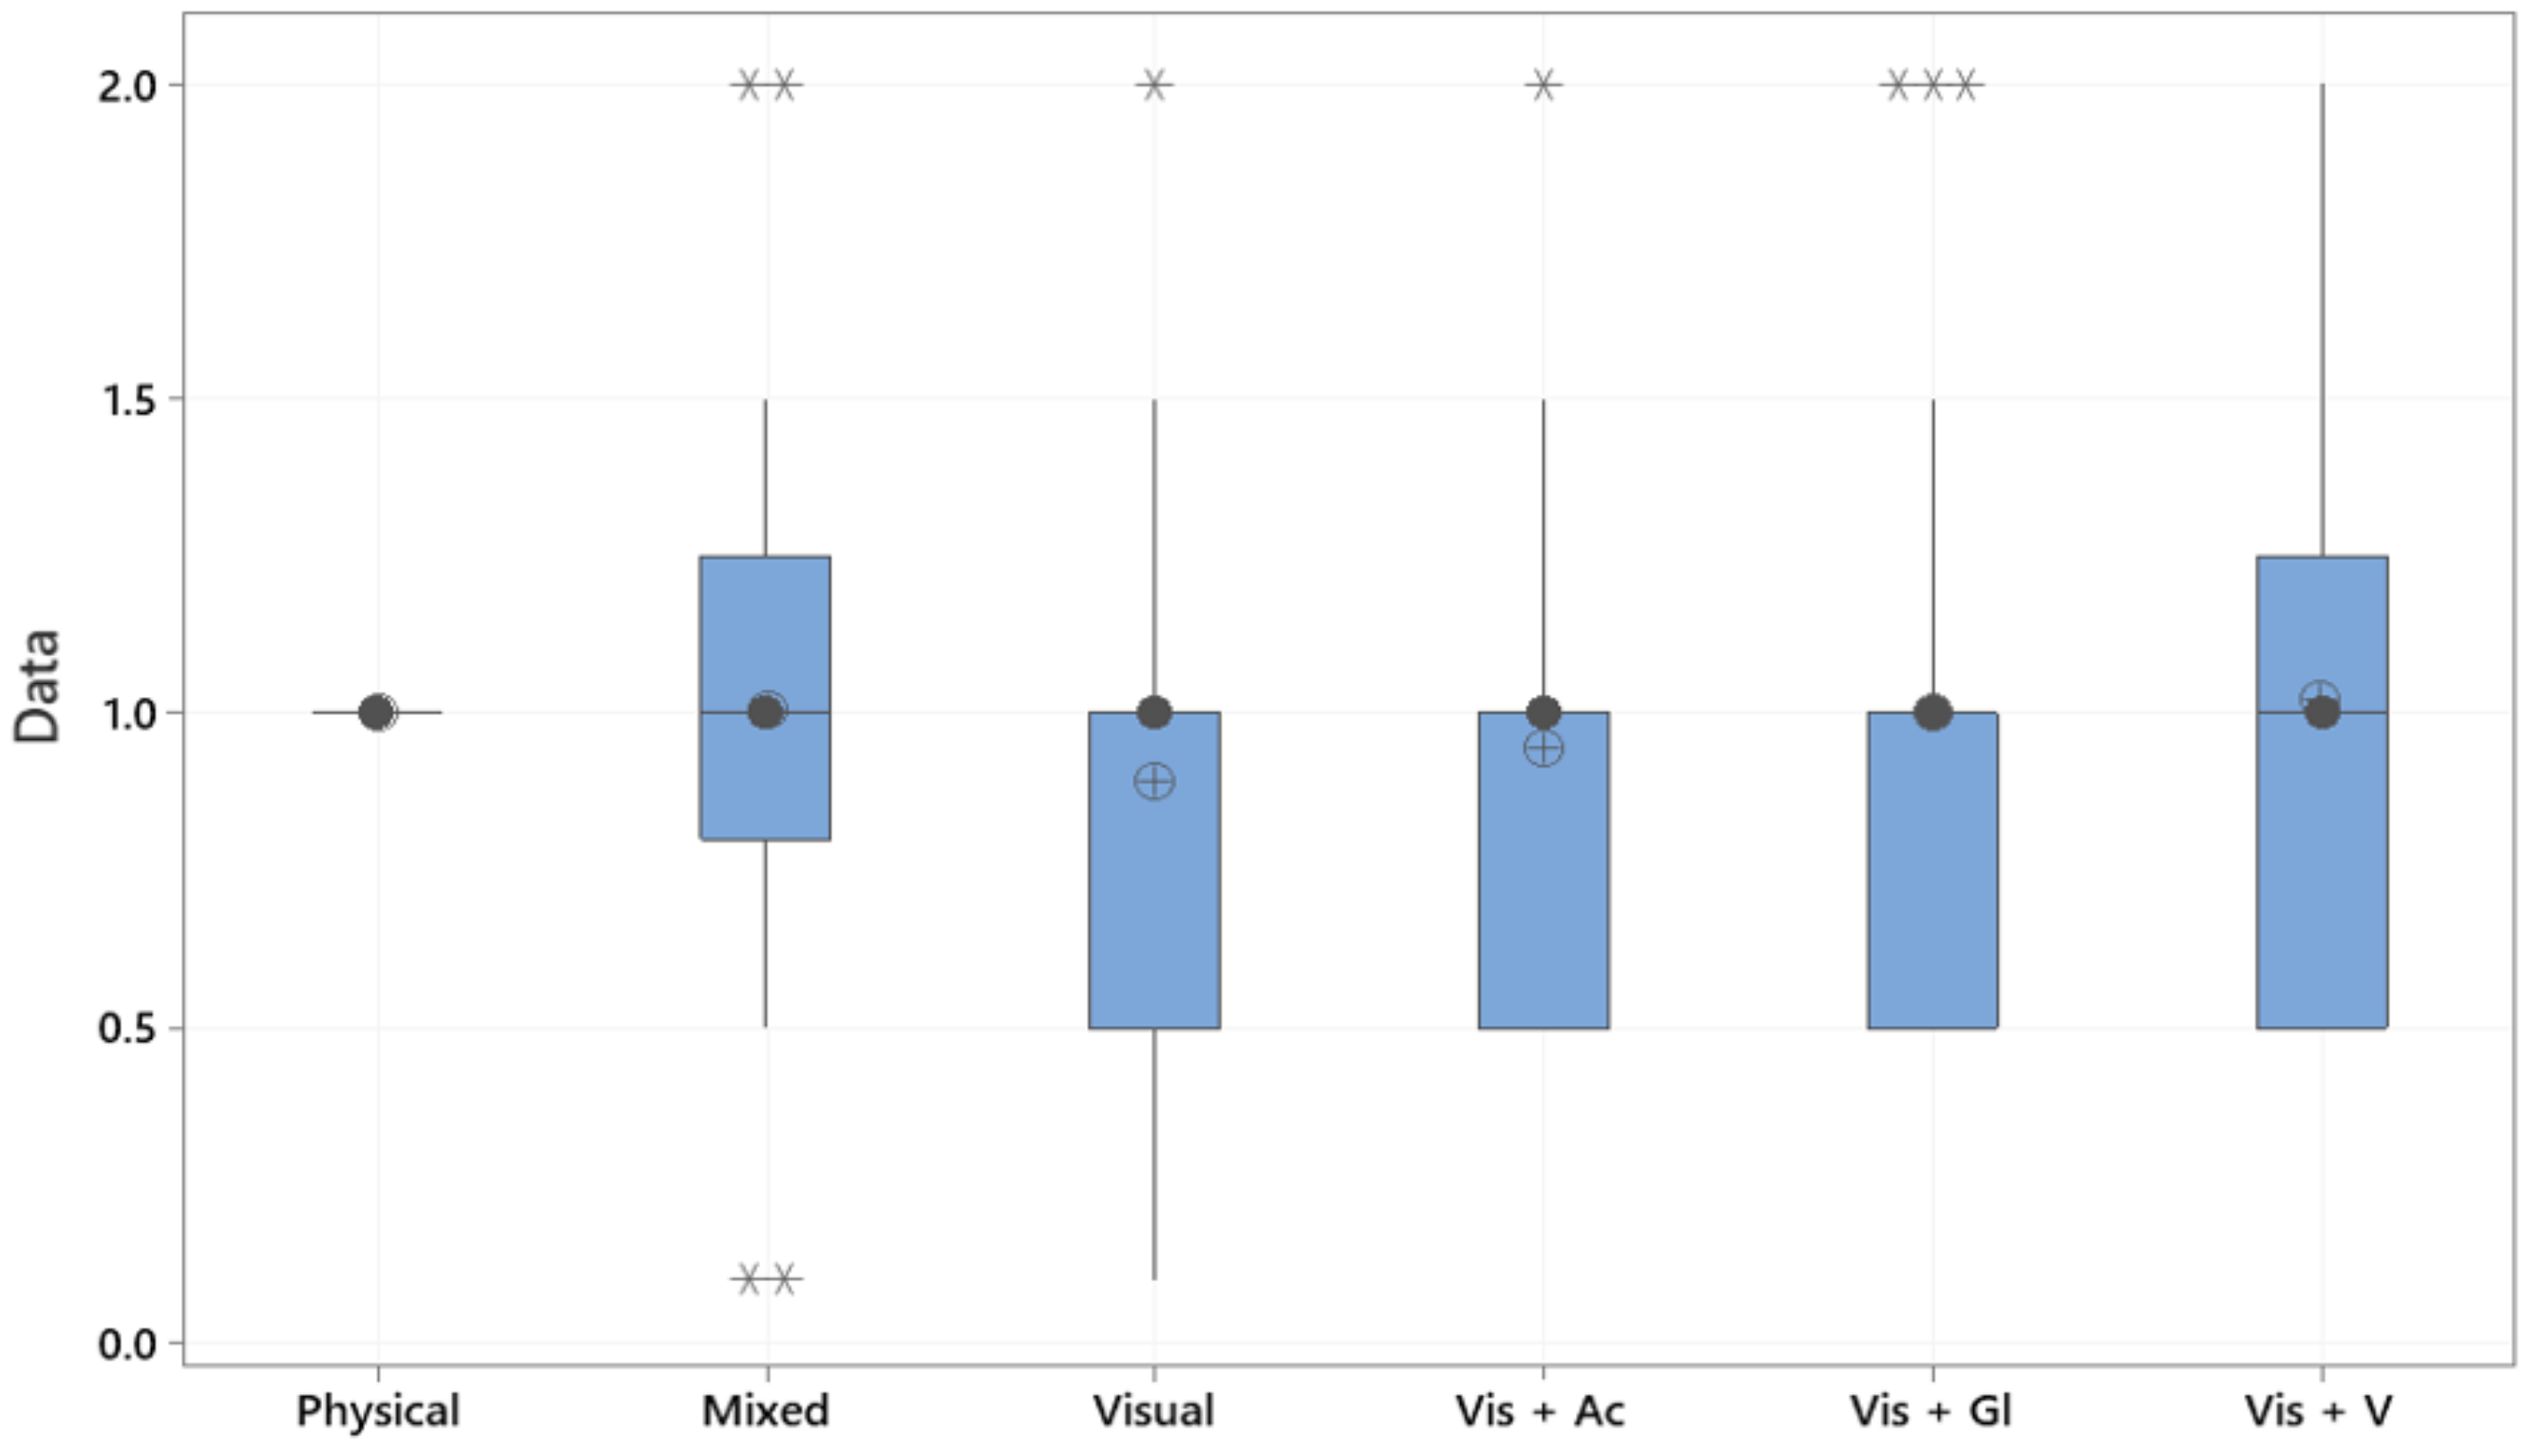
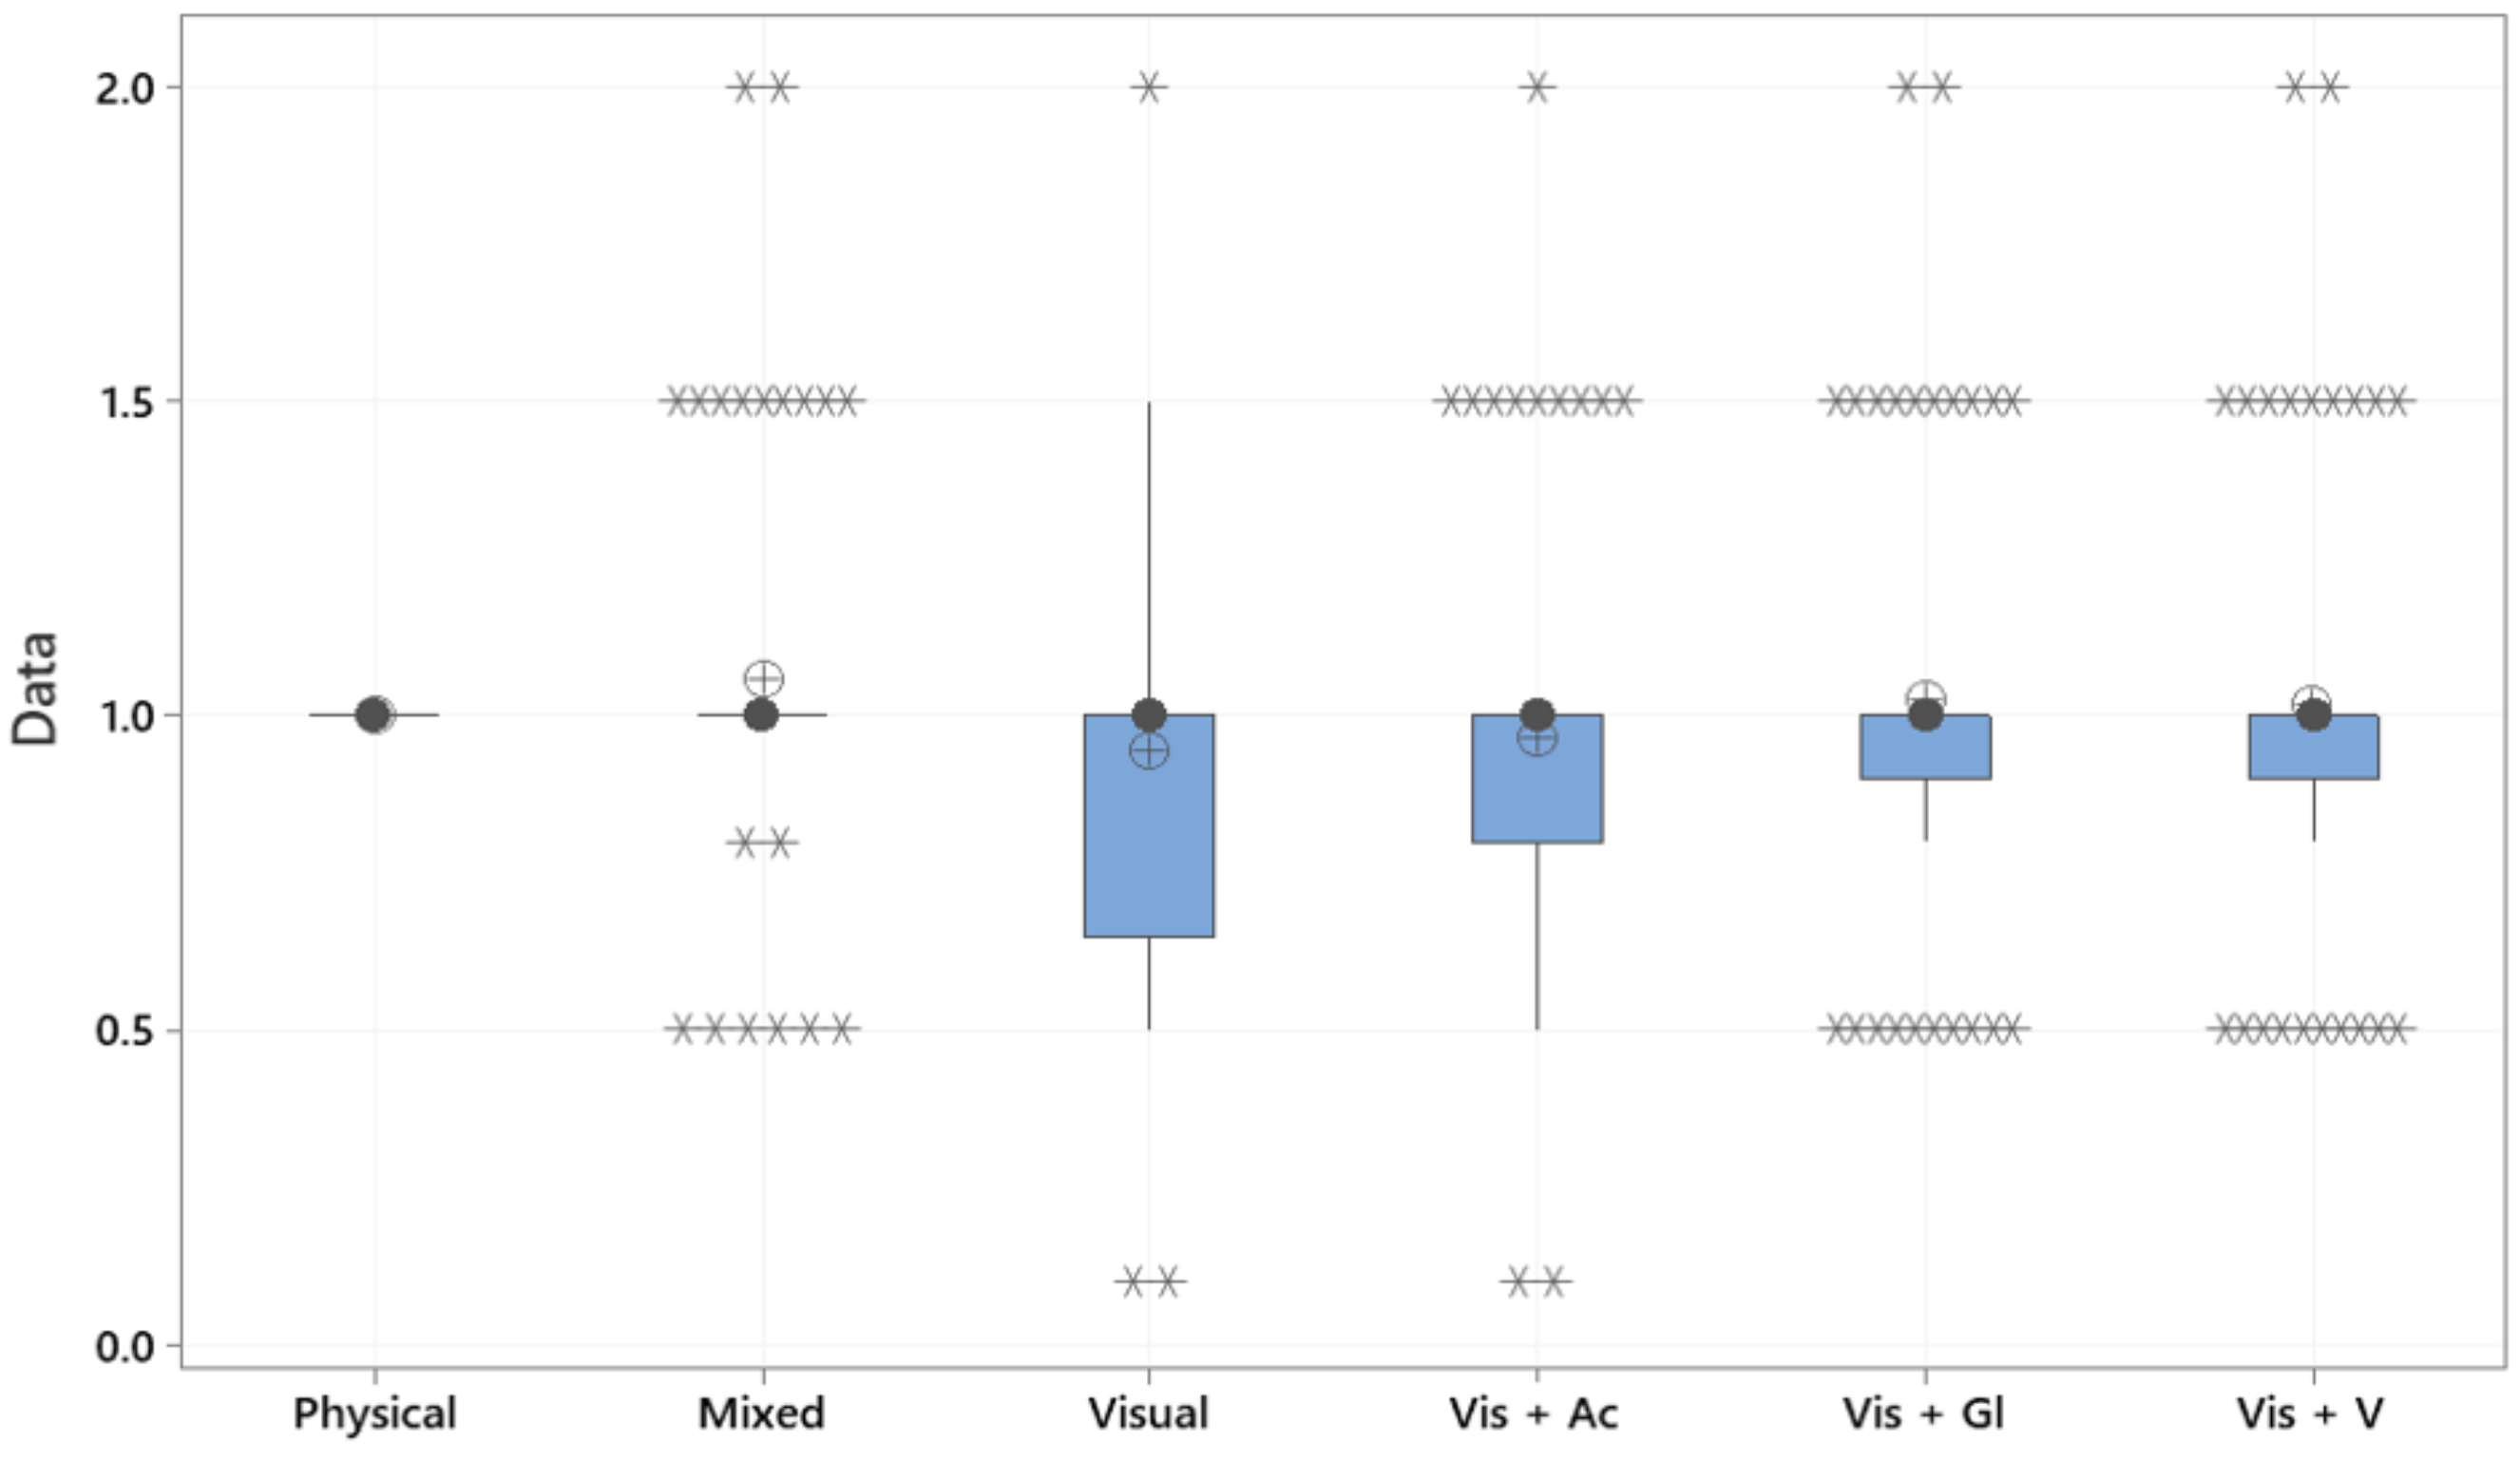
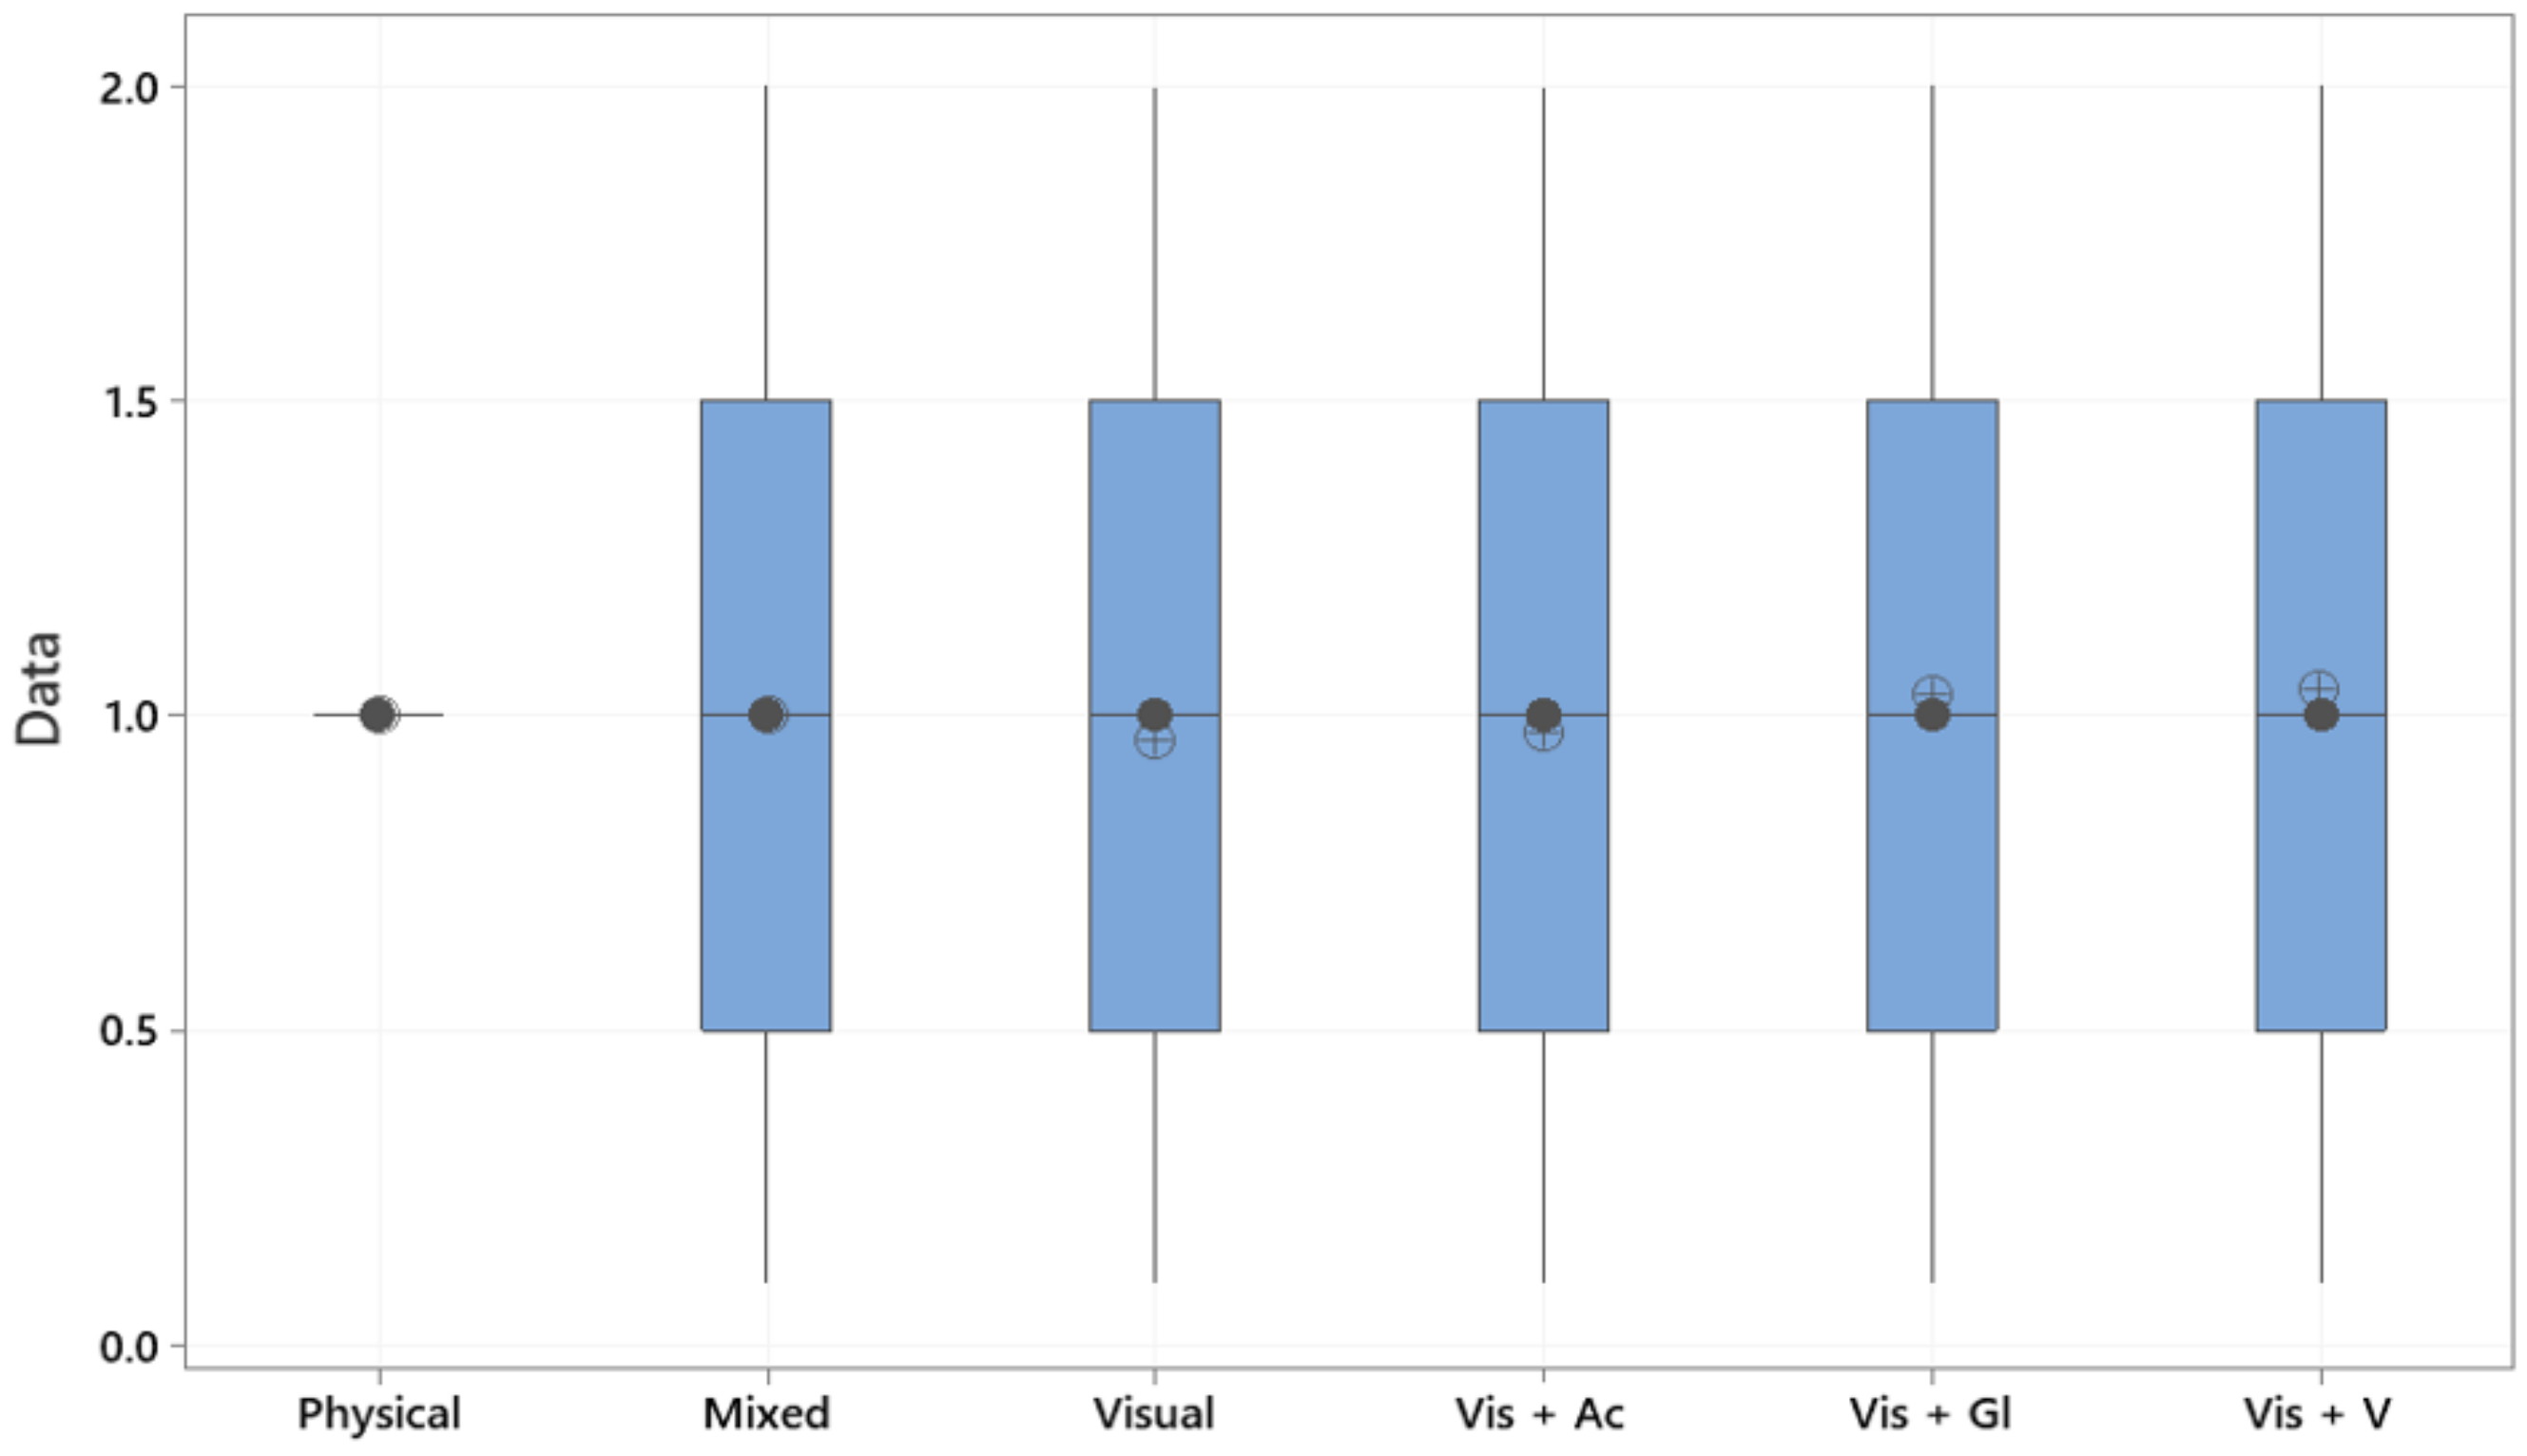
| Attribute | Stimulus | Count | Mean | Standard Error Mean | Variance | Coefficient of Variation | Minimum | Q1 | Median | Q3 | Maximum | Interquartile Range | Skewness | Kurtosis |
|---|---|---|---|---|---|---|---|---|---|---|---|---|---|---|
| Color and Texture | Hybrid (Mixed) | 53 | 0.983 | 0.0681 | 0.2461 | 50.46 | 0.1 | 0.5 | 1 | 1.5 | 2 | 1 | 0.48 | −0.75 |
| Vis + Ac | 53 | 0.9566 | 0.0681 | 0.2456 | 51.8 | 0.1 | 0.5 | 1 | 1.5 | 2 | 1 | 0.38 | −0.81 | |
| Vis + Gl | 53 | 1.0208 | 0.0681 | 0.2459 | 48.58 | 0.1 | 0.5 | 1 | 1.5 | 2 | 1 | 0.2 | −1.12 | |
| Vis + V | 53 | 1.0302 | 0.0674 | 0.2406 | 47.61 | 0.1 | 0.5 | 1 | 1.5 | 2 | 1 | 0.17 | −1.07 | |
| Visual | 53 | 0.9377 | 0.0704 | 0.2628 | 54.67 | 0.1 | 0.5 | 1 | 1.5 | 2 | 1 | 0.55 | −0.69 | |
| Data Security | Hybrid (Mixed) | 53 | 0.8774 | 0.063 | 0.2106 | 52.31 | 0.5 | 0.5 | 1 | 1 | 2 | 0.5 | 1.14 | 0.53 |
| Vis + Ac | 53 | 0.6245 | 0.0472 | 0.118 | 55.01 | 0.1 | 0.5 | 0.5 | 1 | 1.5 | 0.5 | 0.85 | 0.63 | |
| Vis + Gl | 53 | 0.6038 | 0.0425 | 0.0958 | 51.25 | 0.1 | 0.5 | 0.5 | 0.75 | 1.5 | 0.25 | 0.98 | 1.26 | |
| Vis + V | 53 | 0.5717 | 0.0447 | 0.1059 | 56.93 | 0.1 | 0.5 | 0.5 | 0.5 | 1.5 | 0 | 0.89 | 1.09 | |
| Visual | 53 | 0.6226 | 0.0476 | 0.1202 | 55.69 | 0.1 | 0.5 | 0.5 | 1 | 2 | 0.5 | 1.51 | 4.01 | |
| Data Security | Hybrid (Mixed) | 53 | 1.2472 | 0.0662 | 0.2322 | 38.63 | 0.1 | 1 | 1.5 | 1.5 | 2 | 0.5 | −0.31 | −0.53 |
| Vis + Ac | 53 | 1.3604 | 0.0698 | 0.2582 | 37.35 | 0.1 | 1 | 1.5 | 1.75 | 2 | 0.75 | −0.45 | −0.52 | |
| Vis + Gl | 53 | 1.3604 | 0.0724 | 0.2774 | 38.72 | 0.1 | 1 | 1.5 | 2 | 2 | 1 | −0.45 | −0.68 | |
| Vis + V | 53 | 1.3528 | 0.0744 | 0.2937 | 40.06 | 0.1 | 1 | 1.5 | 2 | 2 | 1 | −0.54 | −0.49 | |
| Visual | 53 | 1.3698 | 0.0695 | 0.256 | 36.94 | 0.1 | 1 | 1.5 | 1.75 | 2 | 0.75 | −0.51 | −0.44 | |
| Depth Perception | Hybrid (Mixed) | 53 | 1 | 0.0571 | 0.1731 | 41.6 | 0.5 | 0.5 | 1 | 1 | 2 | 0.5 | 0.62 | 0.06 |
| Vis + Ac | 53 | 0.8547 | 0.0597 | 0.1887 | 50.82 | 0.1 | 0.5 | 1 | 1 | 2 | 0.5 | 0.43 | −0.4 | |
| Vis + Gl | 53 | 0.983 | 0.0654 | 0.2268 | 48.45 | 0.1 | 0.5 | 1 | 1.5 | 2 | 1 | 0.39 | −0.76 | |
| Vis + V | 53 | 0.983 | 0.0681 | 0.2461 | 50.46 | 0.1 | 0.5 | 1 | 1.5 | 2 | 1 | 0.6 | −0.46 | |
| Visual | 53 | 0.8189 | 0.0602 | 0.1923 | 53.56 | 0.1 | 0.5 | 1 | 1 | 2 | 0.5 | 0.49 | −0.27 | |
| Flexibility | Hybrid (Mixed) | 53 | 1.3226 | 0.0745 | 0.2941 | 41 | 0.1 | 1 | 1.5 | 1.5 | 2 | 0.5 | −0.48 | −0.82 |
| Vis + Ac | 53 | 1.3226 | 0.0769 | 0.3133 | 42.32 | 0.1 | 1 | 1.5 | 1.75 | 2 | 0.75 | −0.46 | −0.96 | |
| Vis + Gl | 53 | 1.3491 | 0.0745 | 0.2941 | 40.2 | 0.5 | 1 | 1.5 | 2 | 2 | 1 | −0.39 | −1.09 | |
| Vis + V | 53 | 1.3585 | 0.0754 | 0.3017 | 40.43 | 0.5 | 1 | 1.5 | 2 | 2 | 1 | −0.4 | −1.13 | |
| Visual | 53 | 1.3321 | 0.0779 | 0.3215 | 42.56 | 0.1 | 1 | 1.5 | 2 | 2 | 1 | −0.46 | -1 | |
| Interaction and Manipulation | Hybrid (Mixed) | 53 | 1.0481 | 0.0662 | 0.228 | 45.56 | 0.5 | 0.5 | 1 | 1.5 | 2 | 1 | 0.36 | −0.89 |
| Vis + Ac | 53 | 0.6404 | 0.0659 | 0.2256 | 74.17 | 0.1 | 0.5 | 0.5 | 0.5 | 2 | 0 | 1.45 | 1.52 | |
| Vis + Gl | 53 | 0.875 | 0.0671 | 0.2341 | 55.29 | 0.5 | 0.5 | 0.5 | 1.375 | 2 | 0.875 | 0.94 | −0.4 | |
| Vis + V | 53 | 0.9154 | 0.0757 | 0.2978 | 59.62 | 0.1 | 0.5 | 0.5 | 1.5 | 2 | 1 | 0.85 | −0.58 | |
| Visual | 53 | 0.5077 | 0.063 | 0.2066 | 89.53 | 0.1 | 0.1 | 0.5 | 0.5 | 1.5 | 0.4 | 1.26 | 0.65 | |
| Intuitiveness | Hybrid (Mixed) | 53 | 1.066 | 0.0572 | 0.1734 | 39.07 | 0.5 | 1 | 1 | 1.5 | 2 | 0.5 | 0.37 | −0.33 |
| Vis + Ac | 53 | 0.966 | 0.0661 | 0.2319 | 49.85 | 0.1 | 0.5 | 1 | 1.5 | 2 | 1 | 0.36 | −0.62 | |
| Vis + Gl | 53 | 1.066 | 0.066 | 0.2311 | 45.1 | 0.5 | 0.5 | 1 | 1.5 | 2 | 1 | 0.4 | −0.79 | |
| Vis + V | 53 | 1.0698 | 0.0728 | 0.281 | 49.55 | 0.1 | 0.5 | 1 | 1.5 | 2 | 1 | 0.18 | −0.91 | |
| Visual | 53 | 0.883 | 0.0659 | 0.2299 | 54.3 | 0.1 | 0.5 | 1 | 1.25 | 2 | 0.75 | 0.49 | −0.6 | |
| Location | Hybrid (Mixed) | 53 | 1.2358 | 0.074 | 0.2904 | 43.61 | 0.1 | 1 | 1.5 | 1.5 | 2 | 0.5 | −0.61 | −0.09 |
| Vis + Ac | 53 | 1.7736 | 0.0417 | 0.092 | 17.1 | 1 | 1.5 | 2 | 2 | 2 | 0.5 | −0.99 | 0.03 | |
| Vis + Gl | 53 | 1.7642 | 0.0439 | 0.102 | 18.1 | 1 | 1.5 | 2 | 2 | 2 | 0.5 | −1.03 | 0.03 | |
| Vis + V | 53 | 1.7358 | 0.0478 | 0.1212 | 20.05 | 0.5 | 1.5 | 2 | 2 | 2 | 0.5 | −1.32 | 1.84 | |
| Visual | 53 | 1.766 | 0.0502 | 0.1338 | 20.71 | 0.1 | 1.5 | 2 | 2 | 2 | 0.5 | −2.21 | 7.16 | |
| Motion | Hybrid (Mixed) | 53 | 0.9811 | 0.0555 | 0.1631 | 41.16 | 0.5 | 0.5 | 1 | 1 | 2 | 0.5 | 0.75 | 0.51 |
| Vis + Ac | 53 | 0.817 | 0.056 | 0.1664 | 49.94 | 0.1 | 0.5 | 1 | 1 | 2 | 0.5 | 0.56 | 0.17 | |
| Vis + Gl | 53 | 0.9 | 0.0582 | 0.1796 | 47.09 | 0.1 | 0.5 | 1 | 1 | 2 | 0.5 | 0.33 | −0.46 | |
| Vis + V | 53 | 0.8736 | 0.062 | 0.2035 | 51.64 | 0.1 | 0.5 | 1 | 1 | 2 | 0.5 | 0.53 | −0.1 | |
| Visual | 53 | 0.734 | 0.053 | 0.1488 | 52.56 | 0.1 | 0.5 | 0.5 | 1 | 2 | 0.5 | 0.83 | 1.13 | |
| Movement | Hybrid (Mixed) | 53 | 1.0472 | 0.0472 | 0.1179 | 32.79 | 0.5 | 1 | 1 | 1 | 2 | 0 | 0.62 | 1.08 |
| Vis + Ac | 53 | 0.9472 | 0.0538 | 0.1533 | 41.34 | 0.1 | 0.5 | 1 | 1 | 2 | 0.5 | 0.1 | 0.14 | |
| Vis + Gl | 53 | 1.0094 | 0.053 | 0.1489 | 38.23 | 0.5 | 0.75 | 1 | 1 | 2 | 0.25 | 0.49 | 0.11 | |
| Vis + V | 53 | 1 | 0.0522 | 0.1442 | 37.98 | 0.5 | 0.75 | 1 | 1 | 2 | 0.25 | 0.55 | 0.32 | |
| Visual | 53 | 0.9283 | 0.0534 | 0.1509 | 41.85 | 0.1 | 0.5 | 1 | 1 | 2 | 0.5 | 0.17 | 0.22 | |
| Sound | Hybrid (Mixed) | 53 | 0.7615 | 0.0595 | 0.1844 | 56.38 | 0.1 | 0.5 | 0.5 | 1 | 2 | 0.5 | 0.53 | 0.16 |
| Vis + Ac | 53 | 1.1538 | 0.0721 | 0.27 | 45.03 | 0.5 | 0.5 | 1 | 1.5 | 2 | 1 | 0.21 | −1.11 | |
| Vis + Gl | 53 | 0.6 | 0.0641 | 0.2137 | 77.05 | 0.1 | 0.5 | 0.5 | 0.875 | 2 | 0.375 | 1.37 | 1.94 | |
| Vis + V | 53 | 0.6269 | 0.067 | 0.2338 | 77.12 | 0.1 | 0.5 | 0.5 | 1 | 2 | 0.5 | 1.43 | 2 | |
| Visual | 53 | 0.4365 | 0.0534 | 0.1482 | 88.2 | 0.1 | 0.1 | 0.5 | 0.5 | 1.5 | 0.4 | 1.31 | 1.46 | |
| Visual Quality | Hybrid (Mixed) | 53 | 1.0302 | 0.0632 | 0.2118 | 44.67 | 0.1 | 0.5 | 1 | 1.5 | 2 | 1 | 0.08 | −0.96 |
| Vis + Ac | 53 | 1.0755 | 0.0578 | 0.1769 | 39.11 | 0.5 | 0.5 | 1 | 1.5 | 1.5 | 1 | −0.3 | −1.53 | |
| Vis + Gl | 53 | 1.1038 | 0.0665 | 0.2342 | 43.85 | 0.5 | 0.5 | 1 | 1.5 | 2 | 1 | 0.09 | −1.14 | |
| Vis + V | 53 | 1.1226 | 0.0672 | 0.2395 | 43.59 | 0.5 | 0.5 | 1 | 1.5 | 2 | 1 | 0.12 | −1.08 | |
| Visual | 53 | 1.0943 | 0.0618 | 0.2025 | 41.12 | 0.5 | 0.5 | 1 | 1.5 | 2 | 1 | −0.06 | −1.19 | |
| Visual-Spatial | Hybrid (Mixed) | 53 | 0.9943 | 0.0583 | 0.1802 | 42.69 | 0.1 | 0.5 | 1 | 1.25 | 2 | 0.75 | 0.15 | −0.02 |
| Vis + Ac | 53 | 0.934 | 0.0522 | 0.1446 | 40.71 | 0.5 | 0.5 | 1 | 1 | 2 | 0.5 | 0.5 | −0.23 | |
| Vis + Gl | 53 | 0.9906 | 0.0579 | 0.1778 | 42.57 | 0.5 | 0.5 | 1 | 1 | 2 | 0.5 | 0.64 | −0.01 | |
| Vis + V | 53 | 1.0094 | 0.0639 | 0.2163 | 46.07 | 0.5 | 0.5 | 1 | 1.25 | 2 | 0.75 | 0.71 | −0.22 | |
| Visual | 53 | 0.8792 | 0.0532 | 0.1498 | 44.01 | 0.1 | 0.5 | 1 | 1 | 2 | 0.5 | 0.54 | 0.1 |
| Stimulus | Cost Factor |
|---|---|
| Base Stimulus—1:1 Physical Stimulus | 152.39 |
| Stimulus 1—Hybrid Reality Stimulus | 3.41 |
| Stimulus 2—Visual Virtual Stimulus | 1.00 |
| Stimulus 3—Visual and Acoustic Virtual Stimulus | 1.10 |
| Stimulus 4—Visual and Haptic Gloves Virtual Stimulus | 1.10 |
| Stimulus 5—Visual and Haptic Vest Virtual Stimulus | 1.50 |
Publisher’s Note: MDPI stays neutral with regard to jurisdictional claims in published maps and institutional affiliations. |
© 2022 by the authors. Licensee MDPI, Basel, Switzerland. This article is an open access article distributed under the terms and conditions of the Creative Commons Attribution (CC BY) license (https://creativecommons.org/licenses/by/4.0/).
Share and Cite
Henriques, A.C.; Murari, T.B.; Callans, J.; Silva, A.M.P.; Apolinario, A.L., Jr.; Winkler, I. Virtual Reality-Based Stimuli for Immersive Car Clinics: A Performance Evaluation Model. Big Data Cogn. Comput. 2022, 6, 45. https://doi.org/10.3390/bdcc6020045
Henriques AC, Murari TB, Callans J, Silva AMP, Apolinario AL Jr., Winkler I. Virtual Reality-Based Stimuli for Immersive Car Clinics: A Performance Evaluation Model. Big Data and Cognitive Computing. 2022; 6(2):45. https://doi.org/10.3390/bdcc6020045
Chicago/Turabian StyleHenriques, Alexandre Costa, Thiago Barros Murari, Jennifer Callans, Alexandre Maguino Pinheiro Silva, Antonio Lopes Apolinario, Jr., and Ingrid Winkler. 2022. "Virtual Reality-Based Stimuli for Immersive Car Clinics: A Performance Evaluation Model" Big Data and Cognitive Computing 6, no. 2: 45. https://doi.org/10.3390/bdcc6020045
APA StyleHenriques, A. C., Murari, T. B., Callans, J., Silva, A. M. P., Apolinario, A. L., Jr., & Winkler, I. (2022). Virtual Reality-Based Stimuli for Immersive Car Clinics: A Performance Evaluation Model. Big Data and Cognitive Computing, 6(2), 45. https://doi.org/10.3390/bdcc6020045