Machine Learning Approaches with Textural Features to Calculate Breast Density on Mammography

 , ,
, ,  ,
,  ,
,  , , and
Abstract
1. Introduction
2. Methods
2.1. Study Population
2.2. Digital Mammograms Acquisition
2.3. Image Pre-Processing
2.4. Features Extraction and Features Selection
2.5. Statistical and Machine Learning Analysis
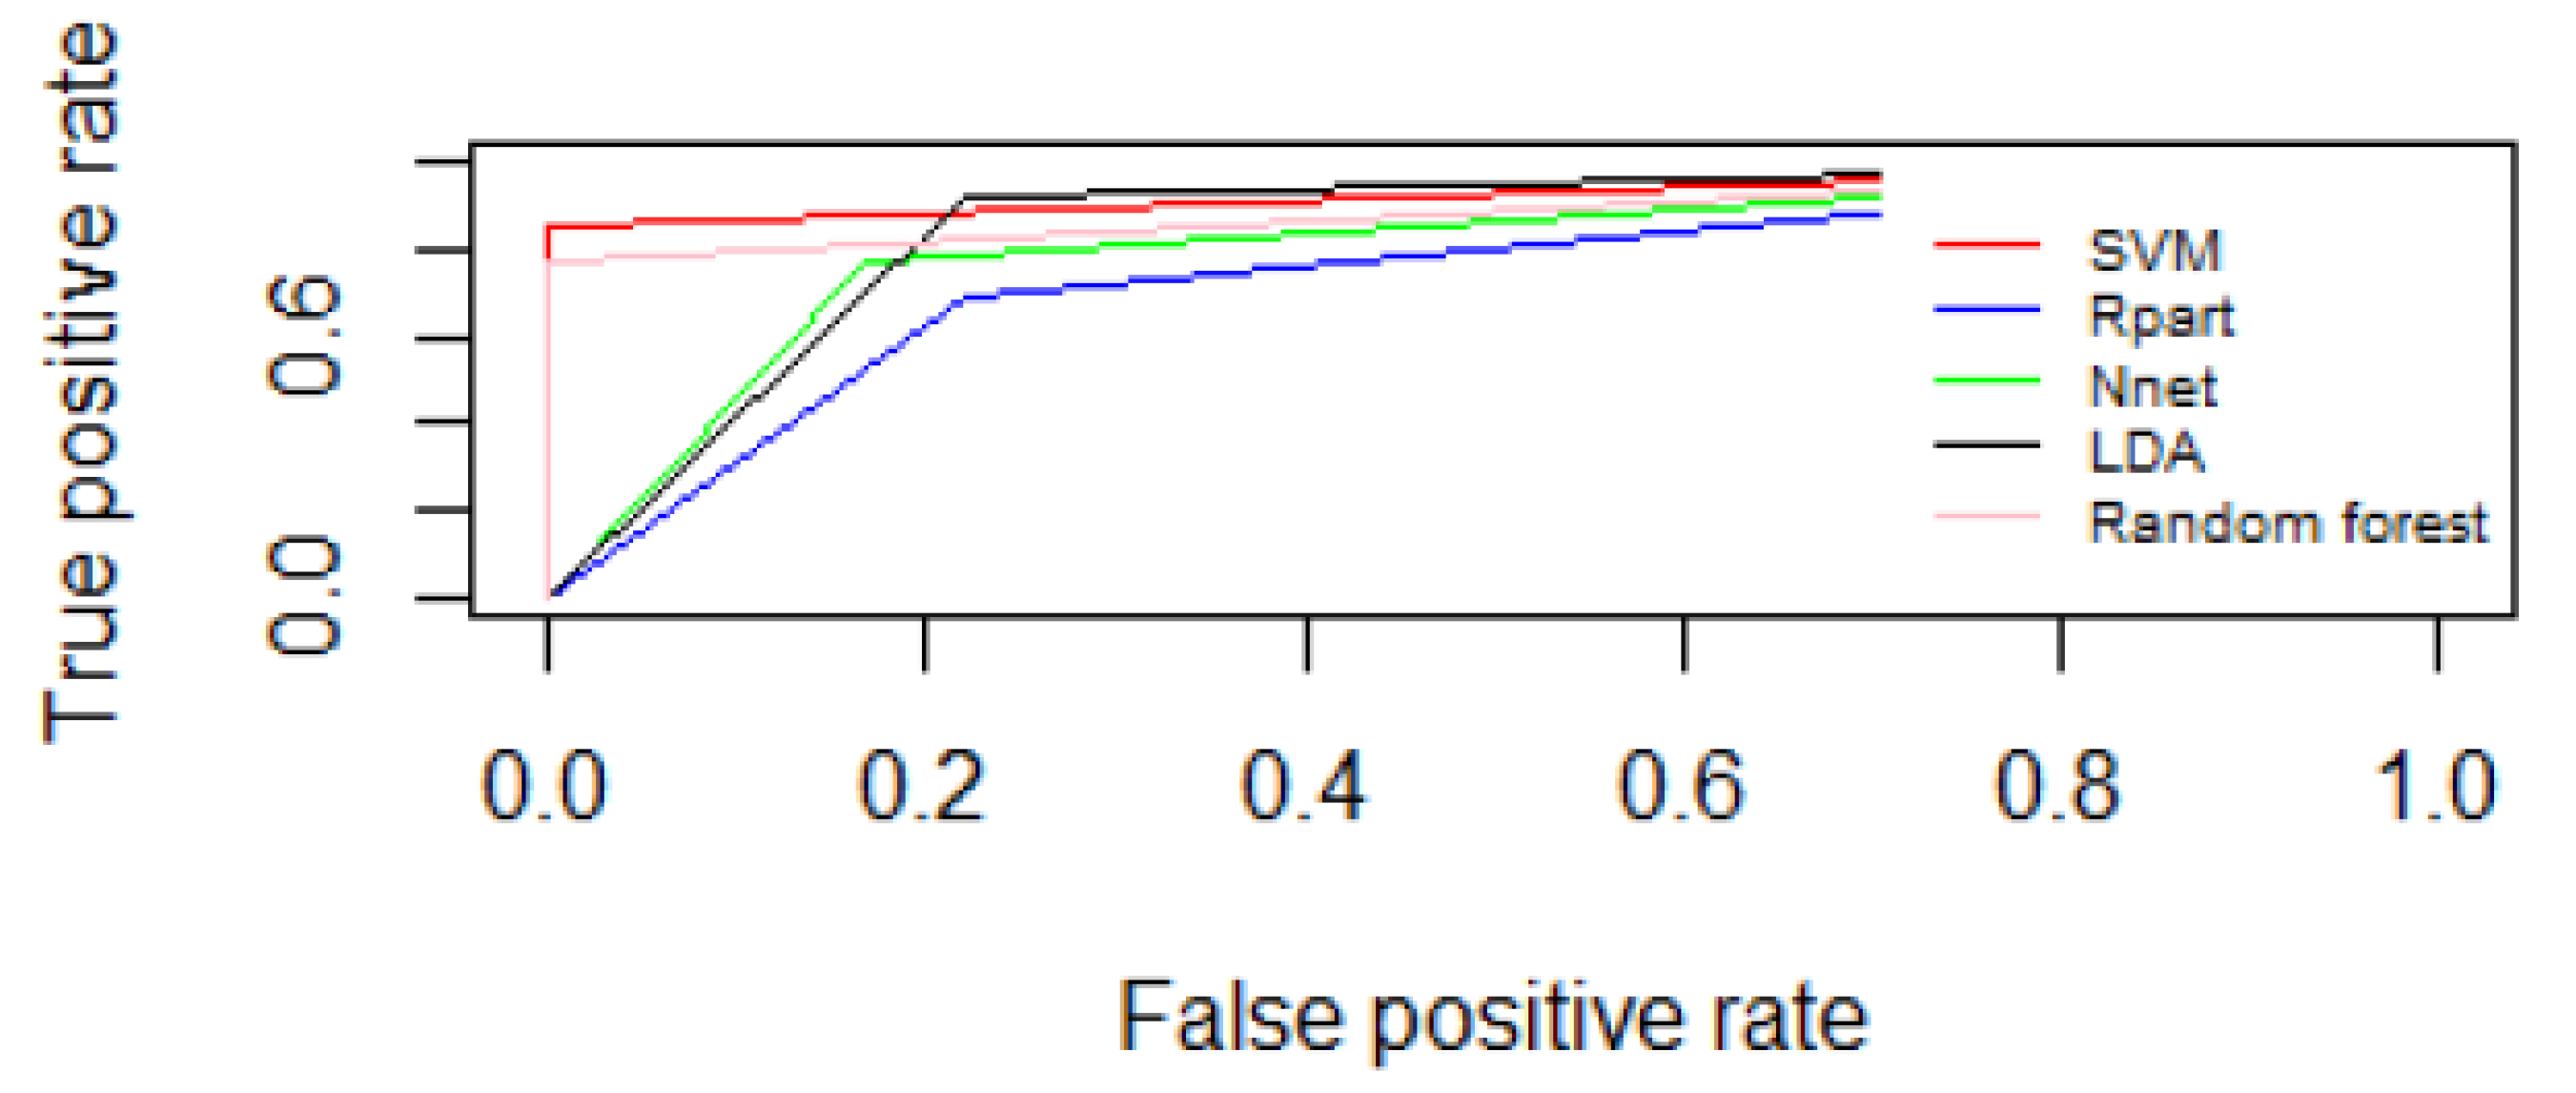
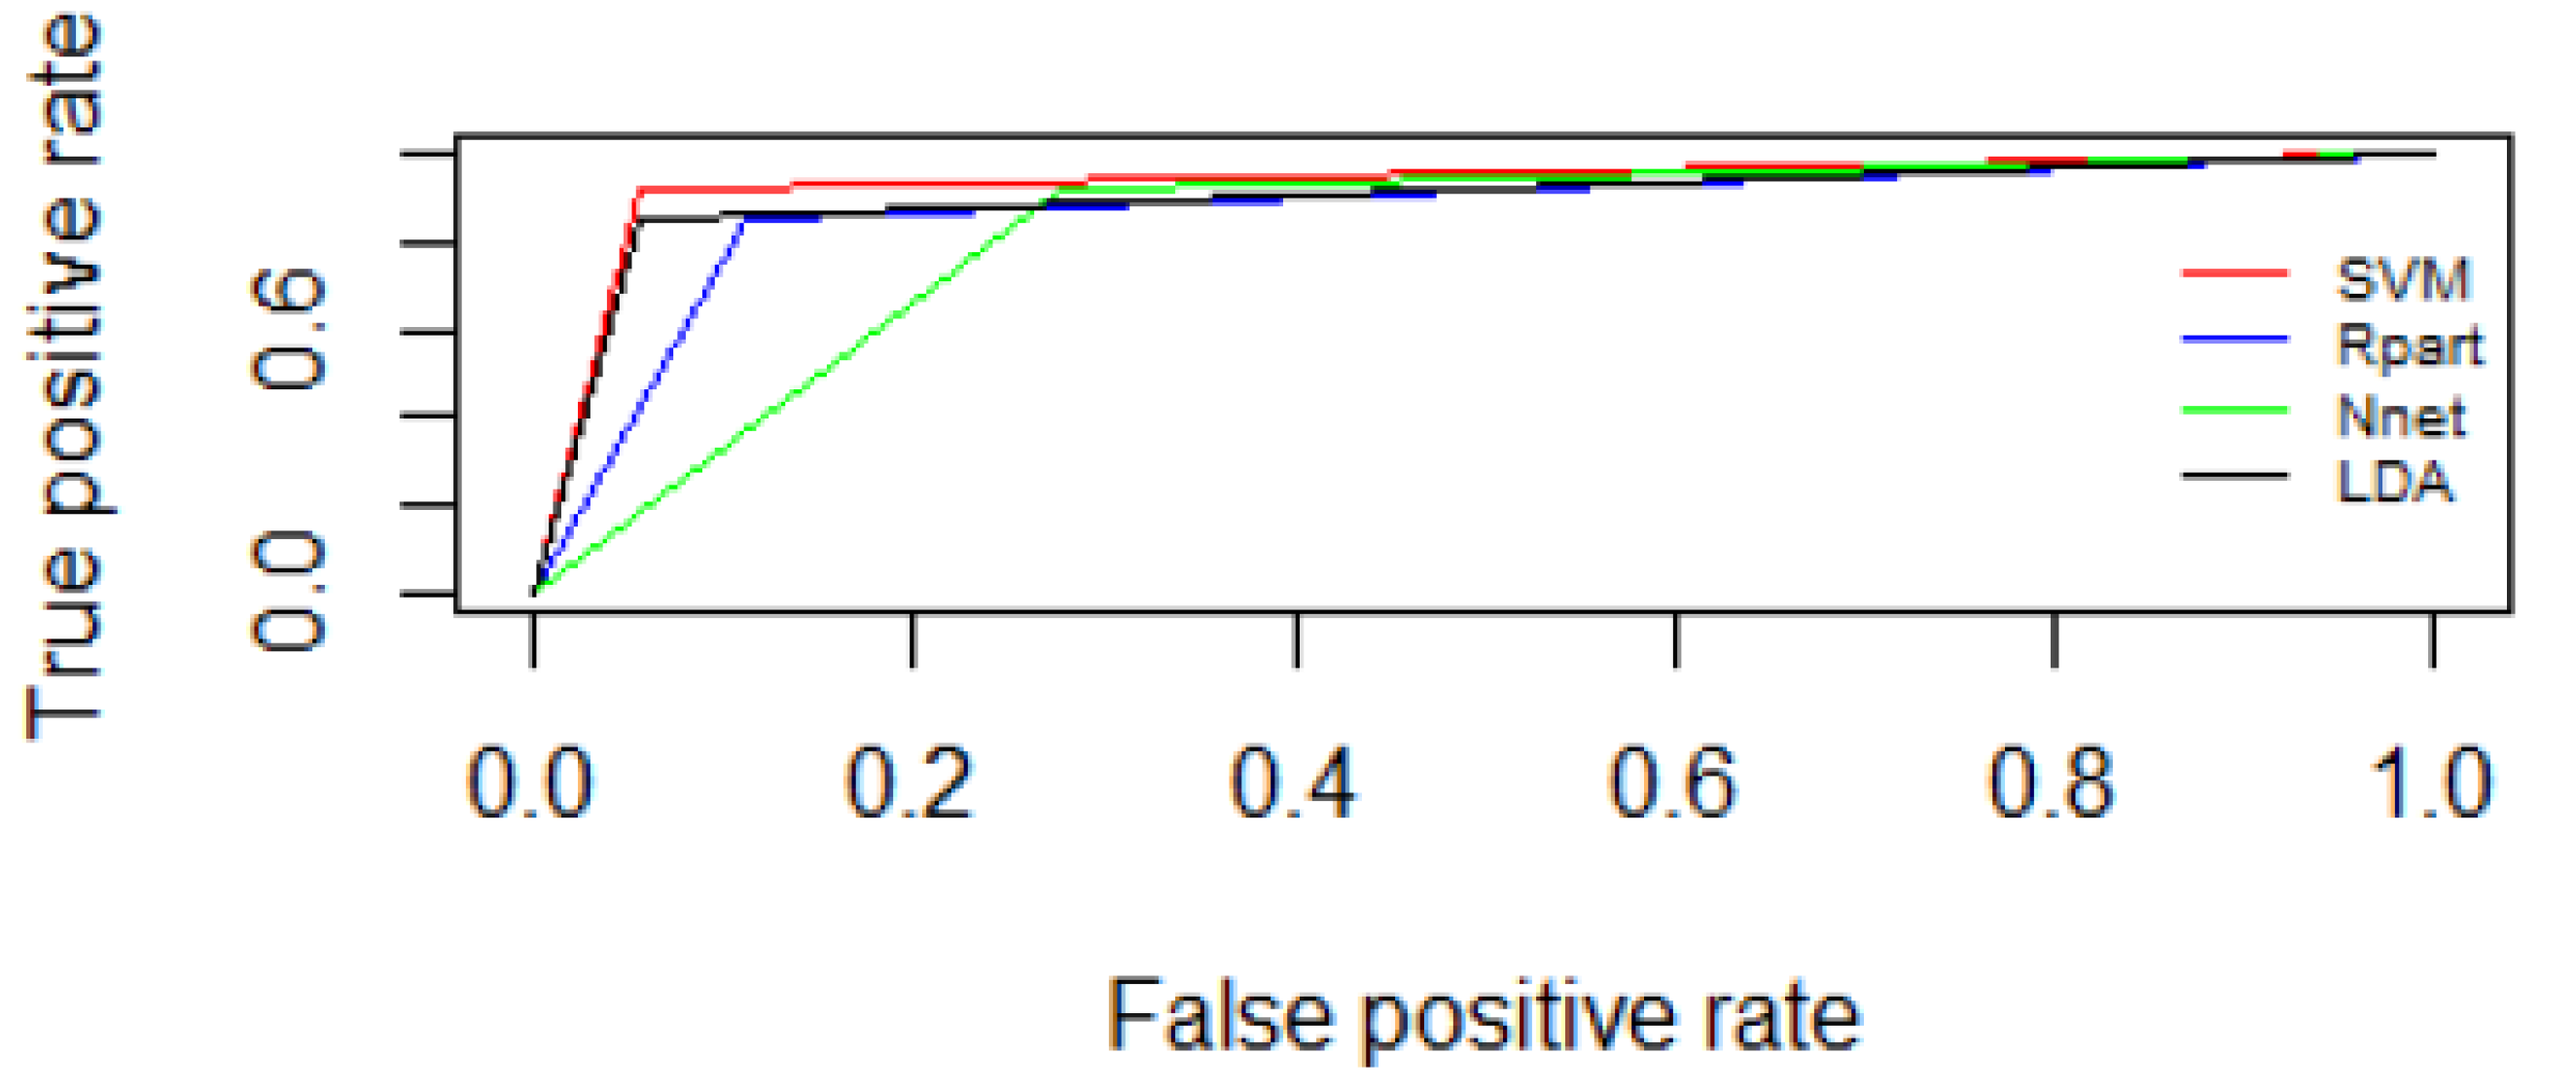
3. Results
4. Discussion
5. Conclusions
Author Contributions
Funding
Institutional Review Board Statement
Informed Consent Statement
Data Availability Statement
Conflicts of Interest
References
- Hall, P.; Easton, D. Breast cancer screening: Time to target women at risk. Br. J. Cancer 2013, 108, 2202–2204. [Google Scholar] [CrossRef] [PubMed]
- Howell, A.; Astley, S.; Warwick, J.; Stavrinos, P.; Sahin, S.; Ingham, S.; McBurney, H.; Eckersley, B.; Harvie, M.; Wilson, M.; et al. Prevention of breast cancer in the context of a national breast screening programme. J. Intern. Med. 2012, 271, 321–330. [Google Scholar] [CrossRef] [PubMed]
- Li, H.; Giger, M.L.; Olopade, O.I.; Margolis, A.; Lan, L.; Chinander, M.R. Computerized texture analysis of mammographic parenchymal patterns of digitized mammograms. Acad. Radiol. 2005, 12, 863–873. [Google Scholar] [CrossRef]
- Heywang-Köbrunner, S.; Viehweg, P.; Heinig, A.; Küchler, C. Contrast-enhanced MRI of the breast: Accuracy, value, controversies, solutions. Eur. J. Radiol. 1997, 24, 94–108. [Google Scholar] [CrossRef] [PubMed]
- McCormack, V.A.; dos Santos Silva, I. Breast Density and Parenchymal Patterns as Markers of Breast Cancer Risk: A Meta-analysis. Cancer Epidemiol. Biomark. Prev. 2006, 15, 1159–1169. [Google Scholar] [CrossRef]
- Boyd, N.F.; Martin, L.J.; Yaffe, M.J.; Minkin, S. Mammographic density and breast cancer risk: Current understanding and future prospects. Breast Cancer Res. 2011, 13, 223. [Google Scholar] [CrossRef]
- Spak, D.A.; Plaxco, J.S.; Santiago, L.; Dryden, M.J.; Dogan, B. BI-RADS ® fifth edition: A summary of changes. Diagn. Interv. Imaging 2017, 98, 179–190. [Google Scholar] [CrossRef]
- Carney, P.A.; Miglioretti, D.L.; Yankaskas, B.C.; Kerlikowske, K.; Rosenberg, R.; Rutter, C.M.; Geller, B.M.; Abraham, L.A.; Taplin, S.H.; Dignan, M.; et al. Individual and combined effects of age, breast density, and hormone replacement therapy use on the accuracy of screening mammography. Ann. Intern. Med. 2003, 138, 168–175. [Google Scholar] [CrossRef]
- Timmers, J.M.; van Doorne-Nagtegaal, H.J.; Zonderland, H.M.; van Tinteren, H.; Visser, O.; Verbeek, A.L.; den Heeten, G.J.; Broeders, M.J. The Breast Imaging Reporting and Data System (BI-RADS) in the Dutch breast cancer screening programme: Its role as an assessment and stratification tool. Eur Radiol. 2012, 22, 1717–1723. [Google Scholar] [CrossRef]
- Van Timmeren, J.E.; Cester, D.; Tanadini-Lang, S.; Alkadhi, H.; Baessler, B. Radiomics in medical imaging—“how-to” guide and critical reflection. Insights Imaging 2020, 11, 91. [Google Scholar] [CrossRef]
- Santone, A.; Brunese, M.C.; Donnarumma, F.; Guerriero, P.; Mercaldo, F.; Reginelli, A.; Miele, V.; Giovagnoni, A.; Brunese, L. Radiomic features for prostate cancer grade detection through formal verification. Radiol. Med. 2021, 126, 688–697. [Google Scholar] [CrossRef]
- Granata, V.; Fusco, R.; Costa, M.; Picone, C.; Cozzi, D.; Moroni, C.; La Casella, G.; Montanino, A.; Monti, R.; Mazzoni, F.; et al. Preliminary Report on Computed Tomography Radiomics Features as Biomarkers to Immunotherapy Selection in Lung Adenocarcinoma Patients. Cancers 2021, 13, 3992. [Google Scholar] [CrossRef]
- Granata, V.; Fusco, R.; Barretta, M.L.; Picone, C.; Avallone, A.; Belli, A.; Patrone, R.; Ferrante, M.; Cozzi, D.; Grassi, R.; et al. Radiomics in hepatic metastasis by colorectal cancer. Infect. Agent Cancer 2021, 16, 39. [Google Scholar] [CrossRef]
- Fusco, R.; Piccirillo, A.; Sansone, M.; Granata, V.; Rubulotta, M.R.; Petrosino, T.; Barretta, M.; Vallone, P.; Di Giacomo, R.; Esposito, E.; et al. Radiomics and Artificial Intelligence Analysis with Textural Metrics Extracted by Contrast-Enhanced Mammography in the Breast Lesions Classification. Diagnostics 2021, 11, 815. [Google Scholar] [CrossRef]
- Fusco, R.; Granata, V.; Mazzei, M.A.; Di Meglio, N.; Del Roscio, D.; Moroni, C.; Monti, R.; Cappabianca, C.; Picone, C.; Neri, E.; et al. Quantitative imaging decision support (QIDSTM) tool consistency evaluation and radiomic analysis by means of 594 metrics in lung carcinoma on chest CT scan. Cancer Control 2021, 28, 1073274820985786. [Google Scholar] [CrossRef]
- Granata, V.; Fusco, R.; Avallone, A.; De Stefano, A.; Ottaiano, A.; Sbordone, C.; Brunese, L.; Izzo, F.; Petrillo, A. Radiomics-Derived Data by Contrast Enhanced Magnetic Resonance in RAS Mutations Detection in Colorectal Liver Metastases. Cancers 2021, 13, 453. [Google Scholar] [CrossRef]
- Granata, V.; Fusco, R.; Risi, C.; Ottaiano, A.; Avallone, A.; De Stefano, A.; Grimm, R.; Grassi, R.; Brunese, L.; Izzo, F.; et al. Diffusion-Weighted MRI and Diffusion Kurtosis Imaging to Detect RAS Mutation in Colorectal Liver Metastasis. Cancers 2020, 12, 2420. [Google Scholar] [CrossRef]
- Gurgitano, M.; Angileri, S.A.; Rodà, G.M.; Liguori, A.; Pandolfi, M.; Ierardi, A.M.; Wood, B.J.; Carrafiello, G. Interventional Radiology ex-machina: Impact of Artificial Intelligence on practice. Radiol. Med. 2021, 126, 998–1006. [Google Scholar] [CrossRef]
- Scapicchio, C.; Gabelloni, M.; Barucci, A.; Cioni, D.; Saba, L.; Neri, E. A deep look into radiomics. Radiol. Med. 2021, 126, 1296–1311. [Google Scholar] [CrossRef]
- Carlo, R.; Renato, C.; Giuseppe, C.; Lorenzo, U.; Giovanni, I.; Domenico, S.; Valeria, R.; Elia, G.; Maria, C.L.; Mario, C. Distinguishing functional from non-functional pituitary macroadenomas with a machine learning analysis. In Mediterranean Conference on Medical and Biological Engineering and Computing; Springer: Berlin/Heidelberg, Germany, 2019; pp. 1822–1829. [Google Scholar]
- Donisi, L.; Cesarelli, G.; Castaldo, A.; De Lucia, D.R.; Nessuno, F.; Spadarella, G.; Ricciardi, C. A Combined Radiomics and Machine Learning Approach to Distinguish Clinically Significant Prostate Lesions on a Publicly Available MRI Dataset. J. Imaging 2021, 7, 215. [Google Scholar] [CrossRef]
- Benedetti, G.; Mori, M.; Panzeri, M.M.; Barbera, M.; Palumbo, D.; Sini, C.; Muffatti, F.; Andreasi, V.; Steidler, S.; Doglioni, C.; et al. CT-derived radiomic features to discriminate histologic characteristics of pancreatic neuroendocrine tumors. Radiol. Med. 2021, 126, 745–760. [Google Scholar] [CrossRef] [PubMed]
- Nardone, V.; Reginelli, A.; Grassi, R.; Boldrini, L.; Vacca, G.; D’Ippolito, E.; Annunziata, S.; Farchione, A.; Belfiore, M.P.; Desideri, I.; et al. Delta radiomics: A systematic review. Radiol. Med. 2021, 126, 1571–1583. [Google Scholar] [CrossRef] [PubMed]
- Granata, V.; Fusco, R.; Avallone, A.; Cassata, A.; Palaia, R.; Delrio, P.; Grassi, R.; Tatangelo, F.; Grazzini, G.; Izzo, F.; et al. Abbreviated MRI protocol for colorectal liver metastases: How the radiologist could work in pre surgical setting. PLoS ONE 2020, 15, e0241431. [Google Scholar] [CrossRef] [PubMed]
- Granata, V.; Fusco, R.; Setola, S.V.; Raso, M.M.; Avallone, A.; De Stefano, A.; Nasti, G.; Palaia, R.; Delrio, P.; Petrillo, A.; et al. Liver radiologic findings of chemotherapy-induced toxicity in liver colorectal metastases patients. Eur. Rev. Med Pharmacol. Sci. 2019, 23, 9697–9706. [Google Scholar] [PubMed]
- Granata, V.; Fusco, R.; Maio, F.; Avallone, A.; Nasti, G.; Palaia, R.; Albino, V.; Grassi, R.; Izzo, F.; Petrillo, A. Qualitative assessment of EOB-GD-DTPA and Gd-BT-DO3A MR contrast studies in HCC patients and colorectal liver metastases. Infect. Agents Cancer 2019, 14, 1–9. [Google Scholar] [CrossRef]
- Fusco, R.; Granata, V.; Petrillo, A. Introduction to Special Issue of Radiology and Imaging of Cancer. Cancers 2020, 12, 2665. [Google Scholar] [CrossRef]
- Caruso, D.; Pucciarelli, F.; Zerunian, M.; Ganeshan, B.; De Santis, D.; Polici, M.; Rucci, C.; Polidori, T.; Guido, G.; Bracci, B.; et al. Chest CT texture-based radiomics analysis in differentiating COVID-19 from other interstitial pneumonia. Radiol. Med. 2021, 126, 1415–1424. [Google Scholar] [CrossRef]
- Satake, H.; Ishigaki, S.; Ito, R.; Naganawa, S. Radiomics in breast MRI: Current progress toward clinical application in the era of artificial intelligence. Radiol. Med. 2021, 127, 39–56. [Google Scholar] [CrossRef]
- Fusco, R.; Granata, V.; Sansone, M.; Rega, D.; Delrio, P.; Tatangelo, F.; Romano, C.; Avallone, A.; Pupo, D.; Giordano, M.; et al. Validation of the standardized index of shape tool to analyze DCE-MRI data in the assessment of neo-adjuvant therapy in locally advanced rectal cancer. Radiol. Med. 2021, 126, 1044–1054. [Google Scholar] [CrossRef]
- Qin, H.; Que, Q.; Lin, P.; Li, X.; Wang, X.-R.; He, Y.; Chen, J.-Q.; Yang, H. Magnetic resonance imaging (MRI) radiomics of papillary thyroid cancer (PTC): A comparison of predictive performance of multiple classifiers modeling to identify cervical lymph node metastases before surgery. Radiol. Med. 2021, 126, 1312–1327. [Google Scholar] [CrossRef]
- Karmazanovsky, G.; Gruzdev, I.; Tikhonova, V.; Kondratyev, E.; Revishvili, A. Computed tomography-based radiomics approach in pancreatic tumors characterization. Radiol. Med. 2021, 126, 1388–1395. [Google Scholar] [CrossRef]
- Gregucci, F.; Fiorentino, A.; Mazzola, R.; Ricchetti, F.; Bonaparte, I.; Surgo, A.; Figlia, V.; Carbonara, R.; Caliandro, M.; Ciliberti, M.P.; et al. Radiomic analysis to predict local response in locally advanced pancreatic cancer treated with stereotactic body radiation therapy. Radiol. Med. 2021, 127, 100–107. [Google Scholar] [CrossRef]
- Fusco, R.; Granata, V.; Maio, F.; Sansone, M.; Petrillo, A. Textural radiomic features and time-intensity curve data analysis by dynamic contrast-enhanced MRI for early prediction of breast cancer therapy response: Preliminary data. Eur. Radiol. Exp. 2020, 4, 1–7. [Google Scholar] [CrossRef]
- Petrillo, A.; Fusco, R.; Granata, V.; Filice, S.; Sansone, M.; Rega, D.; Delrio, P.; Bianco, F.; Romano, G.M.; Tatangelo, F.; et al. Assessing response to neo-adjuvant therapy in locally advanced rectal cancer using Intra-voxel Incoherent Motion modelling by DWI data and Standardized Index of Shape from DCE-MRI. Ther. Adv. Med Oncol. 2018, 10, 1758835918809875. [Google Scholar] [CrossRef]
- Fusco, R.; Sansone, M.; Granata, V.; Grimm, R.; Pace, U.; Delrio, P.; Tatangelo, F.; Botti, G.; Avallone, A.; Pecori, B.; et al. Diffusion and perfusion MR parameters to assess preoperative short-course radiotherapy response in locally advanced rectal cancer: A comparative explorative study among Standardized Index of Shape by DCE-MRI, intravoxel incoherent motion- and diffusion kurtosis imaging-derived parameters. Abdom. Radiol. 2018, 44, 3683–3700. [Google Scholar] [CrossRef]
- Petrillo, A.; Fusco, R.; Granata, V.; Setola, S.V.; Sansone, M.; Rega, D.; Delrio, P.; Bianco, F.; Romano, G.M.; Tatangelo, F.; et al. MR imaging perfusion and diffusion analysis to assess preoperative Short Course Radiotherapy response in locally advanced rectal cancer: Standardized Index of Shape by DCE-MRI and intravoxel incoherent motion-derived parameters by DW-MRI. Med. Oncol. 2017, 34, 198. [Google Scholar] [CrossRef]
- Petrillo, A.; Fusco, R.; Petrillo, M.; Granata, V.; Delrio, P.; Bianco, F.; Pecori, B.; Botti, G.; Tatangelo, F.; Caracò, C.; et al. Standardized Index of Shape (DCE-MRI) and Standardized Uptake Value (PET/CT): Two quantitative approaches to discriminate chemo-radiotherapy locally advanced rectal cancer responders under a functional profile. Oncotarget 2016, 8, 8143–8153. [Google Scholar] [CrossRef]
- Petrillo, A.; Fusco, R.; Petrillo, M.; Granata, V.; Sansone, M.; Avallone, A.; Delrio, P.; Pecori, B.; Tatangelo, F.; Ciliberto, G. Standardized Index of Shape (SIS): A quantitative DCE-MRI parameter to discriminate responders by non-responders after neoadjuvant therapy in LARC. Eur. Radiol. 2015, 25, 1935–1945. [Google Scholar] [CrossRef]
- Van der Lubbe, M.F.J.A.; Vaidyanathan, A.; de Wit, M.; Burg, E.L.V.D.; Postma, A.A.; Bruintjes, T.D.; Bilderbeek-Beckers, M.A.L.; Dammeijer, P.F.M.; Bossche, S.V.; Van Rompaey, V.; et al. A non-invasive, automated diagnosis of Menière’s disease using radiomics and machine learning on conventional magnetic resonance imaging: A multicentric, case-controlled feasibility study. Radiol. Med. 2021, 127, 72–82. [Google Scholar] [CrossRef]
- Brunese, L.; Brunese, M.C.; Carbone, M.; Ciccone, V.; Mercaldo, F.; Santone, A. Automatic PI-RADS assignment by means of formal methods. Radiol. Med. 2021, 127, 83–89. [Google Scholar] [CrossRef]
- Vicini, S.; Bortolotto, C.; Rengo, M.; Ballerini, D.; Bellini, D.; Carbone, I.; Preda, L.; Laghi, A.; Coppola, F.; Faggioni, L. A narrative review on current imaging applications of artificial intelligence and radiomics in oncology: Focus on the three most common cancers. Radiol. Med. 2022, 127, 819–836. [Google Scholar] [CrossRef] [PubMed]
- Wang, F.-H.; Zheng, H.-L.; Li, J.-T.; Li, P.; Zheng, C.-H.; Chen, Q.-Y.; Huang, C.-M.; Xie, J.-W. Prediction of recurrence-free survival and adjuvant therapy benefit in patients with gastrointestinal stromal tumors based on radiomics features. Radiol. Med. 2022, 127, 1085–1097. [Google Scholar] [CrossRef] [PubMed]
- De Robertis, R.; Geraci, L.; Tomaiuolo, L.; Bortoli, L.; Beleù, A.; Malleo, G.; D’Onofrio, M. Liver metastases in pancreatic ductal adenocarcinoma: A predictive model based on CT texture analysis. Radiol. Med. 2022, 127, 1079–1084. [Google Scholar] [CrossRef] [PubMed]
- Chiti, G.; Grazzini, G.; Flammia, F.; Matteuzzi, B.; Tortoli, P.; Bettarini, S.; Pasqualini, E.; Granata, V.; Busoni, S.; Messserini, L.; et al. Gastroenteropancreatic neuroendocrine neoplasms (GEP-NENs): A radiomic model to predict tumor grade. Radiol. Med. 2022, 127, 928–938. [Google Scholar] [CrossRef] [PubMed]
- Yao, F.; Bian, S.; Zhu, D.; Yuan, Y.; Pan, K.; Pan, Z.; Feng, X.; Tang, K.; Yang, Y. Machine learning-based radiomics for multiple primary prostate cancer biological characteristics prediction with 18F-PSMA-1007 PET: Comparison among different volume segmentation thresholds. Radiol. Med. 2022, 127, 1170–1178. [Google Scholar] [CrossRef] [PubMed]
- Fiaschetti, V.; Ubaldi, N.; De Fazio, S.; Ricci, A.; Maspes, F.; Cossu, E. Digital tomosynthesis spot view in architectural distortions: Outcomes in management and radiation dose. Radiol. Med. 2022. [Google Scholar] [CrossRef] [PubMed]
- Xue, K.; Liu, L.; Liu, Y.; Guo, Y.; Zhu, Y.; Zhang, M. Radiomics model based on multi-sequence MR images for predicting preoperative immunoscore in rectal cancer. Radiol. Med. 2022, 127, 702–713. [Google Scholar] [CrossRef] [PubMed]
- Granata, V.; Fusco, R.; De Muzio, F.; Cutolo, C.; Setola, S.V.; Dell’Aversana, F.; Grassi, F.; Belli, A.; Silvestro, L.; Ottaiano, A.; et al. Radiomics and machine learning analysis based on magnetic resonance imaging in the assessment of liver mucinous colorectal metastases. Radiol. Med. 2022, 127, 763–772. [Google Scholar] [CrossRef]
- Cozzi, D.; Bicci, E.; Cavigli, E.; Danti, G.; Bettarini, S.; Tortoli, P.; Mazzoni, L.N.; Busoni, S.; Pradella, S.; Miele, V. Radiomics in pulmonary neuroendocrine tumours (NETs). Radiol. Med. 2022, 127, 609–615. [Google Scholar] [CrossRef]
- Granata, V.; Fusco, R.; De Muzio, F.; Cutolo, C.; Setola, S.V.; Grassi, R.; Grassi, F.; Ottaiano, A.; Nasti, G.; Tatangelo, F.; et al. Radiomics textural features by MR imaging to assess clinical outcomes following liver resection in colorectal liver metastases. Radiol. Med. 2022, 127, 461–470. [Google Scholar] [CrossRef]
- Autorino, R.; Gui, B.; Panza, G.; Boldrini, L.; Cusumano, D.; Russo, L.; Nardangeli, A.; Persiani, S.; Campitelli, M.; Ferrandina, G.; et al. Radiomics-based prediction of two-year clinical outcome in locally advanced cervical cancer patients undergoing neoadjuvant chemoradiotherapy. Radiol. Med. 2022, 127, 498–506. [Google Scholar] [CrossRef]
- Gitto, S.; Bologna, M.; Corino, V.D.A.; Emili, I.; Albano, D.; Messina, C.; Armiraglio, E.; Parafioriti, A.; Luzzati, A.; Mainardi, L.; et al. Diffusion-weighted MRI radiomics of spine bone tumors: Feature stability and machine learning-based classification performance. Radiol. Med. 2022, 127, 518–525. [Google Scholar] [CrossRef]
- Gao, W.; Wang, W.; Song, D.; Yang, C.; Zhu, K.; Zeng, M.; Rao, S.-X.; Wang, M. A predictive model integrating deep and radiomics features based on gadobenate dimeglumine-enhanced MRI for postoperative early recurrence of hepatocellular carcinoma. Radiol. Med. 2022, 127, 259–271. [Google Scholar] [CrossRef]
- Nicosia, L.; Bozzini, A.C.; Palma, S.; Montesano, M.; Signorelli, G.; Pesapane, F.; Latronico, A.; Bagnardi, V.; Frassoni, S.; Sangalli, C.; et al. Contrast-Enhanced Spectral Mammography and tumor size assessment: A valuable tool for appropriate surgical management of breast lesions. Radiol. Med. 2022, 127, 1228–1234. [Google Scholar] [CrossRef]
- Tsuchiya, M.; Masui, T.; Terauchi, K.; Yamada, T.; Katyayama, M.; Ichikawa, S.; Noda, Y.; Goshima, S. MRI-based radiomics analysis for differentiating phyllodes tumors of the breast from fibroadenomas. Eur. Radiol. 2022, 32, 4090–4100. [Google Scholar] [CrossRef]
- Palatresi, D.; Fedeli, F.; Danti, G.; Pasqualini, E.; Castiglione, F.; Messerini, L.; Massi, D.; Bettarini, S.; Tortoli, P.; Busoni, S.; et al. Correlation of CT radiomic features for GISTs with pathological classification and molecular subtypes: Preliminary and monocentric experience. Radiol. Med. 2022, 127, 117–128. [Google Scholar] [CrossRef]
- Chiloiro, G.; Cusumano, D.; de Franco, P.; Lenkowicz, J.; Boldrini, L.; Carano, D.; Barbaro, B.; Corvari, B.; Dinapoli, N.; Giraffa, M.; et al. Does restaging MRI radiomics analysis improve pathological complete response prediction in rectal cancer patients? A prognostic model development. Radiol. Med. 2021, 127, 11–20. [Google Scholar] [CrossRef]
- Bracci, S.; Dolciami, M.; Trobiani, C.; Izzo, A.; Pernazza, A.; D’Amati, G.; Manganaro, L.; Ricci, P. Quantitative CT texture analysis in predicting PD-L1 expression in locally advanced or metastatic NSCLC patients. Radiol. Med. 2021, 126, 1425–1433. [Google Scholar] [CrossRef]
- Ricciardi, C.; Cuocolo, R.; Verde, F.; Improta, G.; Stanzione, A.; Romeo, V.; Maurea, S.; D’Armiento, M.; Sarno, L.; Guida, M.; et al. Resolution resampling of ultrasound images in placenta previa patients: Influence on radiomics data relia- bility and usefulness for machine learning. In European Medical and Biological Engineering Conference; Springer: Berlin/Heidelberg, Germany, 2020; pp. 1011–1018. [Google Scholar]
- Ponsiglione, A.M.; Ricciardi, C.; Scala, A.; Fiorillo, A.; Sorrentino, A.; Triassi, M.; Orabona, G.D.; Improta, G. Application of DMAIC Cycle and Modeling as Tools for Health Technology Assessment in a University Hospital. J. Health Eng. 2021, 2021, 8826048. [Google Scholar] [CrossRef]
- Ponsiglione, A.M.; Cesarelli, G.; Amato, F.; Romano, M. Optimization of an artificial neural network to study accelerations of foetal heart rhythm. In Proceedings of the 2021 IEEE 6th International Forum on Research and Technology for Society and Industry (RTSI), Naples, Italy, 6–9 September 2021; pp. 159–164. [Google Scholar]
- Donisi, L.; Cesarelli, G.; Balbi, P.; Provitera, V.; Lanzillo, B.; Coccia, A.; D’Addio, G. Positive impact of short-term gait rehabilitation in Parkinson patients: A combined approach based on statistics and machine learning. Math. Biosci. Eng. 2021, 18, 6995–7009. [Google Scholar] [CrossRef]
- Ponsiglione, A.M.; Amato, F.; Romano, M. Multiparametric Investigation of Dynamics in Fetal Heart Rate Signals. Bioengineering 2021, 9, 8. [Google Scholar] [CrossRef]
- Ponsiglione, A.M.; Cosentino, C.; Cesarelli, G.; Amato, F.; Romano, M. A Comprehensive Review of Techniques for Processing and Analyzing Fetal Heart Rate Signals. Sensors 2021, 21, 6136. [Google Scholar] [CrossRef]
- Jang, S.-K.; Chang, J.Y.; Lee, J.S.; Lee, E.-J.; Kim, Y.-H.; Han, J.H.; Chang, D.-I.; Cho, H.J.; Cha, J.-K.; Yu, K.H.; et al. Reliability and Clinical Utility of Machine Learning to Predict Stroke Prognosis: Comparison with Logistic Regression. J. Stroke 2020, 22, 403–406. [Google Scholar] [CrossRef] [PubMed]
- Leite, A.F.; de Faria Vasconcelos, K.; Willems, H.; Jacobs, R. Radiomics and machine learning in oral healthcare. Proteom. Clin. Appl. 2020, 14, 1900040. [Google Scholar] [CrossRef] [PubMed]
- Recenti, M.; Ricciardi, C.; Edmunds, K.; Gislason, M.K.; Gargiulo, P. Machine learning predictive system based upon radiodensitometric distributions from mid-thigh CT images. Eur. J. Transl. Myol. 2020, 30, 121–124. [Google Scholar] [CrossRef] [PubMed]
- Scrutinio, D.; Ricciardi, C.; Donisi, L.; Losavio, E.; Battista, P.; Guida, P.; Cesarelli, M.; Pagano, G.; D’Addio, G. Machine learning to predict mortality after rehabilitation among patients with severe stroke. Sci. Rep. 2020, 10, 20127. [Google Scholar] [CrossRef]
- Trunfio, T.A.; Ponsiglione, A.M.; Ferrara, A.; Borrelli, A.; Gargiulo, P. A comparison of different regression and classification methods for predicting the length of hospital stay after cesarean sections. In Proceedings of the 2021 5th International Conference on Medical and Health Informatics, Kyoto Japan, 14–16 May 2021; pp. 63–67. [Google Scholar]
- Ricciardi, C.; Valente, A.S.; Edmund, K.; Cantoni, V.; Green, R.; Fiorillo, A.; Picone, I.; Santini, S.; Cesarelli, M. Linear discriminant analysis and principal com- ponent analysis to predict coronary artery disease. Health Inform. J. 2020, 26, 2181–2192. [Google Scholar] [CrossRef]
- Profeta, M.; Ponsiglione, A.M.; Ponsiglione, C.; Ferrucci, G.; Giglio, C.; Borrelli, A. Comparison of machine learning algorithms to predict length of hospital stay in patients undergoing heart bypass surgery. In Proceedings of the 2021 International Symposium on Biomedical Engineering and Computational Biology, Nanchang, China, 13–15 August 2021; pp. 1–5. [Google Scholar]
- Ge, L.; Chen, Y.; Yan, C.; Zhao, P.; Zhang, P.; Runa, A.; Liu, J. Study Progress of Radiomics with Machine Learning for Precision Medicine in Bladder Cancer Management. Front. Oncol. 2019, 9, 1296. [Google Scholar] [CrossRef]
- Gastounioti, A.; Oustimov, A.; Keller, B.M.; Pantalone, L.; Hsieh, M.-K.; Conant, E.F.; Kontos, D. Breast parenchymal patterns in processed versus raw digital mammograms: A large population study toward assessing differences in quantitative measures across image representations. Med. Phys. 2016, 43, 5862–5877. [Google Scholar] [CrossRef]
- Zheng, Y.; Keller, B.M.; Ray, S.; Wang, Y.; Conant, E.F.; Gee, J.C.; Kontos, D. Parenchymal texture analysis in digital mammography: A fully automated pipeline for breast cancer risk assessment. Med. Phys. 2015, 42, 4149–4160. [Google Scholar] [CrossRef]
- Haralick, R.M.; Shanmugam, K.; Dinstein, I. Textural features for image classification. IEEE Trans. Syst. Man Cybern. 1973, 3, 610–621. [Google Scholar] [CrossRef]
- Sacchetto, D.; Morra, L.; Agliozzo, S.; Bernardi, D.; Bjorklund, T.; Brancato, B.; Bravetti, P.; Carbonaro, L.A.; Correale, L.; Fanto, C.; et al. Mammographic density: Comparison of visual assessment with fully automatic calculation on a multivendor dataset. Eur. Radiol. 2016, 26, 175–183. [Google Scholar] [CrossRef]
- Zwanenburg, A.; Vallières, M.; Abdalah, M.A.; Aerts, H.J.W.L.; Andrearczyk, V.; Apte, A.; Ashrafinia, S.; Bakas, S.; Beukinga, R.J.; Boellaard, R.; et al. The Image Biomarker Standardization Initiative: Standardized Quantitative Radiomics for High-Throughput Im-age-based Phenotyping. Radiology 2020, 295, 328–338. [Google Scholar] [CrossRef]
- Kuhn, M.; Wing, J.; Weston, S.; Williams, A. The caret package. Gene Expr. 2007. [Google Scholar]
- Pietropaolo, A.; Geraghty, R.M.; Veeratterapillay, R.; Rogers, A.; Kallidonis, P.; Villa, L.; Boeri, L.; Montanari, E.; Atis, G.; Emiliani, E.; et al. A machine learning predictive model for post-ureteroscopy urosepsis needing intensive care unit admission: A case–control yau endourology study from nine euro- pean centres. J. Clin. Med. 2021, 10, 3888. [Google Scholar] [CrossRef]
- Fusco, R.; Sansone, M.; Filice, S.; Carone, G.; Amato, D.M.; Sansone, C.; Petrillo, A. Pattern Recognition Approaches for Breast Cancer DCE-MRI Classification: A Systematic Review. J. Med. Biol. Eng. 2016, 36, 449–459. [Google Scholar] [CrossRef]
- Copyright 2000–2020, R-Tools Technology Inc. Available online: https://www.r-tt.com/ (accessed on 15 May 2020).
- Pinker, K. Beyond Breast Density: Radiomic Phenotypes Enhance Assessment of Breast Cancer Risk. Radiology 2019, 290, 50–51. [Google Scholar] [CrossRef]
- Arslan, A.; Aktas, E.; Sengul, B.; Tekin, B. Dosimetric evaluation of left ventricle and left anterior descending artery in left breast radiotherapy. Radiol. Med. 2020, 126, 14–21. [Google Scholar] [CrossRef]
- Tagliafico, A.S.; Campi, C.; Bianca, B.; Bortolotto, C.; Buccicardi, D.; Francesca, C.; Prost, R.; Rengo, M.; Faggioni, L. Blockchain in radiology research and clinical practice: Current trends and future directions. Radiol. Med. 2022, 127, 391–397. [Google Scholar] [CrossRef]
- Qin, H.; Wu, Y.; Lin, P.; Gao, R.; Li, X.; Wang, X.; Chen, G.; He, Y.; Yang, H. Ultrasound Image–Based Radiomics: An Innovative Method to Identify Primary Tumorous Sources of Liver Metastases. J. Ultrasound Med. 2020, 40, 1229–1244. [Google Scholar] [CrossRef]
- Li, N.; Wakim, J.; Koethe, Y.; Huber, T.; Schenning, R.; Gade, T.P.; Hunt, S.J.; Park, B.J. Multicenter assessment of augmented reality registration methods for image-guided interventions. Radiol. Med. 2022, 127, 857–865. [Google Scholar] [CrossRef] [PubMed]
- Wei, S.; Han, Y.; Zeng, H.; Ye, S.; Cheng, J.; Chai, F.; Wei, J.; Zhang, J.; Hong, N.; Bao, Y.; et al. Radiomics diagnosed histopathological growth pattern in prediction of response and 1-year progression free survival for colorectal liver metastases patients treated with bevacizumab containing chemotherapy. Eur. J. Radiol. 2021, 142, 109863. [Google Scholar] [CrossRef] [PubMed]
- Spinelli, M.S.; Balbaa, M.F.; Gallazzi, M.B.; Eid, M.E.-E.; Kotb, H.T.; El Shafei, M.; Ierardi, A.M.; Daolio, P.A.; Barile, A.; Carrafiello, G. Role of percutaneous CT–guided radiofrequency ablation in treatment of intra-articular, in close contact with cartilage and extra-articular osteoid osteomas: Comparative analysis and new classification system. Radiol. Med. 2022, 127, 1142–1150. [Google Scholar] [CrossRef] [PubMed]
- Giannini, V.; Rosati, S.; DeFeudis, A.; Balestra, G.; Vassallo, L.; Cappello, G.; Mazzetti, S.; De Mattia, C.; Rizzetto, F.; Torresin, A.; et al. Radiomics predicts response of individual HER2-amplified colorectal cancer liver metastases in patients treated with HER2-targeted therapy. Int. J. Cancer 2020, 147, 3215–3223. [Google Scholar] [CrossRef]
- Caruso, D.; Polici, M.; Rinzivillo, M.; Zerunian, M.; Nacci, I.; Marasco, M.; Magi, L.; Tarallo, M.; Gargiulo, S.; Iannicelli, E.; et al. CT-based radiomics for prediction of therapeutic response to Everolimus in metastatic neuroendocrine tumors. Radiol. Med. 2022, 127, 691–701. [Google Scholar] [CrossRef]
- Han, D.; Yu, N.; Yu, Y.; He, T.; Duan, X. Performance of CT radiomics in predicting the overall survival of patients with stage III clear cell renal carcinoma after radical nephrectomy. Radiol. Med. 2022, 127, 837–847. [Google Scholar] [CrossRef]
- Donati, O.F.; Hany, T.F.; Reiner, C.S.; von Schulthess, G.K.; Marincek, B.; Seifert, B.; Weishaupt, D. Value of Retrospective Fusion of PET and MR Images in Detection of Hepatic Metastases: Comparison with 18F-FDG PET/CT and Gd-EOB-DTPA–Enhanced MRI. J. Nucl. Med. 2010, 51, 692–699. [Google Scholar] [CrossRef]
- Masci, G.M.; Ciccarelli, F.; Mattei, F.I.; Grasso, D.; Accarpio, F.; Catalano, C.; Laghi, A.; Sammartino, P.; Iafrate, F. Role of CT texture analysis for predicting peritoneal metastases in patients with gastric cancer. Radiol. Med. 2022, 127, 251–258. [Google Scholar] [CrossRef]
- Viganò, L.; Arachchige, V.S.J.; Fiz, F. Is precision medicine for colorectal liver metastases still a utopia? New perspectives by modern biomarkers, radiomics, and artificial intelligence. World J. Gastroenterol. 2022, 28, 608–623. [Google Scholar] [CrossRef]
- Sansone, M.; Marrone, S.; Di Salvio, G.; Belfiore, M.P.; Gatta, G.; Fusco, R.; Vanore, L.; Zuiani, C.; Grassi, F.; Vietri, M.T.; et al. Comparison between two packages for pectoral muscle removal on mammographic images. Radiol. Med. 2022, 127, 848–856. [Google Scholar] [CrossRef]
- Gastounioti, A.; Conant, E.F.; Kontos, D. Beyond breast density: Are view on the advancing role of parenchymal texture analysis in breast cancer risk assessment. Breast Cancer Res. 2016, 18, 91. [Google Scholar] [CrossRef]
- Pinker-Domenig, K.; Chin, J.; Melsaether, A.N.; Morris, E.A.; Moy, L. Precision Medicine and Radiogenomics in Breast Cancer: New Approaches toward Diagnosis and Treatment. Radiology 2018, 287, 732–747. [Google Scholar] [CrossRef]
- Kontos, D.; Winham, S.J.; Oustimov, A.; Pantalone, L.; Hsieh, M.-K.; Gastounioti, A.; Whaley, D.H.; Hruska, C.B.; Kerlikowske, K.; Brandt, K.; et al. Radiomic Phenotypes of Mammographic Parenchymal Complexity: Toward Augmenting Breast Density in Breast Cancer Risk Assessment. Radiology 2019, 290, 41–49. [Google Scholar] [CrossRef]
- Li, H.; Mendel, K.R.; Lan, L.; Sheth, D.; Giger, M.L. Digital Mammography in Breast Cancer: Additive Value of Radiomics of Breast Parenchyma. Radiology 2019, 291, 15–20. [Google Scholar] [CrossRef]
- Yala, A.; Lehman, C.; Schuster, T.; Portnoi, T.; Barzilay, R. A Deep Learning Mammography-based Model for Improved Breast Cancer Risk Prediction. Radiology 2019, 292, 60–66. [Google Scholar] [CrossRef]


| Age Group (yrs) | Breast Density | |||
|---|---|---|---|---|
| A | B | C | D | |
| Internal Cohort | ||||
| 15–44 | 0 | 6 | 2 | 7 |
| 45–54 | 4 | 18 | 25 | 9 |
| 55–64 | 8 | 41 | 5 | 15 |
| 65–78 | 5 | 14 | 0 | 5 |
| >78 | 0 | 3 | 1 | 0 |
| Sum | 17 | 82 | 33 | 36 |
| Validation Cohort | ||||
| 15–44 | 0 | 1 | 1 | 2 |
| 45–54 | 1 | 2 | 2 | 1 |
| 55–64 | 1 | 4 | 3 | 3 |
| 65–78 | 2 | 8 | 5 | 2 |
| >78 | 2 | 6 | 3 | 2 |
| Sum | 6 | 21 | 14 | 10 |
| Age Group (yrs) | Breast Density | |||
|---|---|---|---|---|
| A | B | C | D | |
| Internal Cohort | ||||
| Normal (<25 kg/m2) | 12 | 15 | 9 | 8 |
| Overweight (25–29 kg/m2) | 9 | 17 | 16 | 10 |
| Obese (≥30 kg/m2) | 11 | 35 | 13 | 13 |
| Sum | 32 | 67 | 38 | 31 |
| Validation Cohort | ||||
| Normal (<25 kg/m2) | 4 | 2 | 3 | 4 |
| Overweight (25–29 kg/m2) | 6 | 3 | 4 | 5 |
| Obese I (≥30 kg/m2) | 6 | 6 | 3 | 5 |
| Sum | 16 | 11 | 10 | 14 |
| Variable Number | Variable Name |
|---|---|
| V687 | Fractal dimensions |
| V685 | 95th percentile Hist feat |
| V684 | mean 5th percentile Hist feat |
| V682 | Entropy Hist feat |
| V679 | Std Hist feat |
| V678 | Min histogram value |
| V677 | Max histogram value |
| V674 | Kurtosis Diagonal comp. Wavelet 5° iteration |
| V672 | Kurtosis Vertical comp. Wavelet 5° iteration |
| V671 | Variance Vertical comp. Wavelet 5° iteration |
| V670 | Kurtosis Horizontal comp. Wavelet 5° iteration |
| V669 | Variance Horizontal comp. Wavelet 5° iteration |
| V669 | Kurtosis Diagonal comp. Wavelet 4° iteration |
| V668 | Kurtosis Vertical comp. Wavelet 4° iteration |
| V666 | Variance Vertical comp. Wavelet 4° iteration |
| V665 | Kurtosis Horizontal comp. Wavelet 4° iteration |
| V664 | Kurtosis Diagonal comp. Wavelet 3° iteration |
| V662 | Kurtosis Vertical comp. Wavelet 3° iteration |
| V660 | Kurtosis Horizontal comp. Wavelet 3° iteration |
| V656 | Kurtosis Diagonal comp. Wavelet 2° iteration |
| V654 | Kurtosis Vertical comp. Wavelet 2° iteration |
| V652 | Kurtosis Horizontal comp. Wavelet 2° iteration |
| V646 | Kurtosis Horizontal comp. Wavelet 1° iteration |
| V641 | Run Percentage RL 180 degrees |
| V636 | Low Gray Level Run Emphasys RL 90 degrees |
| V633 | Run Percentage RL 90 degrees |
| V631 | Short Run Emphasys RL 90 degrees |
| V618 | Short Run Emphasys RL 0 degrees |
| V607 | Mean Map8 Law |
| V598 | Standard Deviation Map6 Law |
| V569 | Haralick D120 Measure of correlation I |
| V530 | Haralick D30 Energy |
| V518 | Haralick D15 Correlation |
| V473 | Maximal Correl. Coeff. (Mean 0°, 45°, 90°, 135°) |
| V469 | Haralick Entropy (Mean 0°, 45°, 90°, 135°) |
| Variable Number | Variable Name |
|---|---|
| V558 | Energy Haralick D120 |
| V552 | Entropy Haralick D60 |
| V544 | Energy Haralick D60 |
| V566 | Sum Entropy Haralick D120 |
| V530 | Energy Haralick D30 |
| V614 | Skewness Map9 Law |
| V516 | Energy Haralick D15 |
| Method | Accuracy | 95% CI | Kappa | Sensitivity | Specificity | p Value |
|---|---|---|---|---|---|---|
| SVM | 0.93 | 0.79–0.99 | 0.86 | 1.00 | 0.85 | <0.001 |
| Random Forest Tree | 0.91 | 0.79–0.99 | 0.86 | 1.00 | 0.85 | <0.001 |
| LDA | 0.84 | 0.66–0.94 | 0.68 | 0.778 | 0.92 | <0.01 |
| ANN using the nnet package | 0.74 | 0.55–0.88 | 0.47 | 0.778 | 0.69 | <0.01 |
| Decision Tree using the Rpart package | 0.74 | 0.55–0.88 | 0.47 | 0.778 | 0.69 | <0.01 |
| Method | Accuracy | 95% CI | Kappa | Sensitivity | Specificity | p Value |
|---|---|---|---|---|---|---|
| SVM | 0.93 | 0.79–0.99 | 0.87 | 0.94 | 0.92 | <0.001 |
| LDA | 0.90 | 0.74–0.98 | 0.80 | 0.94 | 0.85 | <0.01 |
| ANN using the nnet package | 0.68 | 0.49–0.83 | 0.34 | 0.83 | 0.46 | <0.01 |
| Decision Tree using the Rpart package | 0.87 | 0.70–0.96 | 0.73 | 0.89 | 0.85 | <0.01 |
Disclaimer/Publisher’s Note: The statements, opinions and data contained in all publications are solely those of the individual author(s) and contributor(s) and not of MDPI and/or the editor(s). MDPI and/or the editor(s) disclaim responsibility for any injury to people or property resulting from any ideas, methods, instructions or products referred to in the content. |
© 2023 by the authors. Licensee MDPI, Basel, Switzerland. This article is an open access article distributed under the terms and conditions of the Creative Commons Attribution (CC BY) license (https://creativecommons.org/licenses/by/4.0/).
Share and Cite
Sansone, M.; Fusco, R.; Grassi, F.; Gatta, G.; Belfiore, M.P.; Angelone, F.; Ricciardi, C.; Ponsiglione, A.M.; Amato, F.; Galdiero, R.; et al. Machine Learning Approaches with Textural Features to Calculate Breast Density on Mammography. Curr. Oncol. 2023, 30, 839-853. https://doi.org/10.3390/curroncol30010064
Sansone M, Fusco R, Grassi F, Gatta G, Belfiore MP, Angelone F, Ricciardi C, Ponsiglione AM, Amato F, Galdiero R, et al. Machine Learning Approaches with Textural Features to Calculate Breast Density on Mammography. Current Oncology. 2023; 30(1):839-853. https://doi.org/10.3390/curroncol30010064
Chicago/Turabian StyleSansone, Mario, Roberta Fusco, Francesca Grassi, Gianluca Gatta, Maria Paola Belfiore, Francesca Angelone, Carlo Ricciardi, Alfonso Maria Ponsiglione, Francesco Amato, Roberta Galdiero, and et al. 2023. "Machine Learning Approaches with Textural Features to Calculate Breast Density on Mammography" Current Oncology 30, no. 1: 839-853. https://doi.org/10.3390/curroncol30010064
APA StyleSansone, M., Fusco, R., Grassi, F., Gatta, G., Belfiore, M. P., Angelone, F., Ricciardi, C., Ponsiglione, A. M., Amato, F., Galdiero, R., Grassi, R., Granata, V., & Grassi, R. (2023). Machine Learning Approaches with Textural Features to Calculate Breast Density on Mammography. Current Oncology, 30(1), 839-853. https://doi.org/10.3390/curroncol30010064