
Lentil-Based Yogurt Alternatives Fermented with Multifunctional Strains of Lactic Acid Bacteria—Techno-Functional, Microbiological, and Sensory Characteristics

 , ,
, , 
 and
and
Abstract
:
1. Introduction
2. Materials and Methods
2.1. Raw Materials and Chemicals
2.2. LPI Emulsion Production
2.3. Lentil YA Production
2.4. Evaluation of Microbial Growth and Acidification
2.5. Determination of FODMAP and Sucrose Content
2.6. Rheological and Tribological Measurements
2.6.1. Three Interval Thixotropy Test
2.6.2. Structure Formation
2.6.3. Tribological Analysis
2.7. Textural Properties
2.8. Water Holding Capacity
2.9. Whiteness Index
2.10. Ultrastructure of YA
2.11. Quantification of Antifungal Compounds
2.12. GC-MS Metabolomics
2.13. Sensory Analysis
2.14. Statistical Analysis
3. Results and Discussion
3.1. Microbial Growth, Acidification and Color of the YA
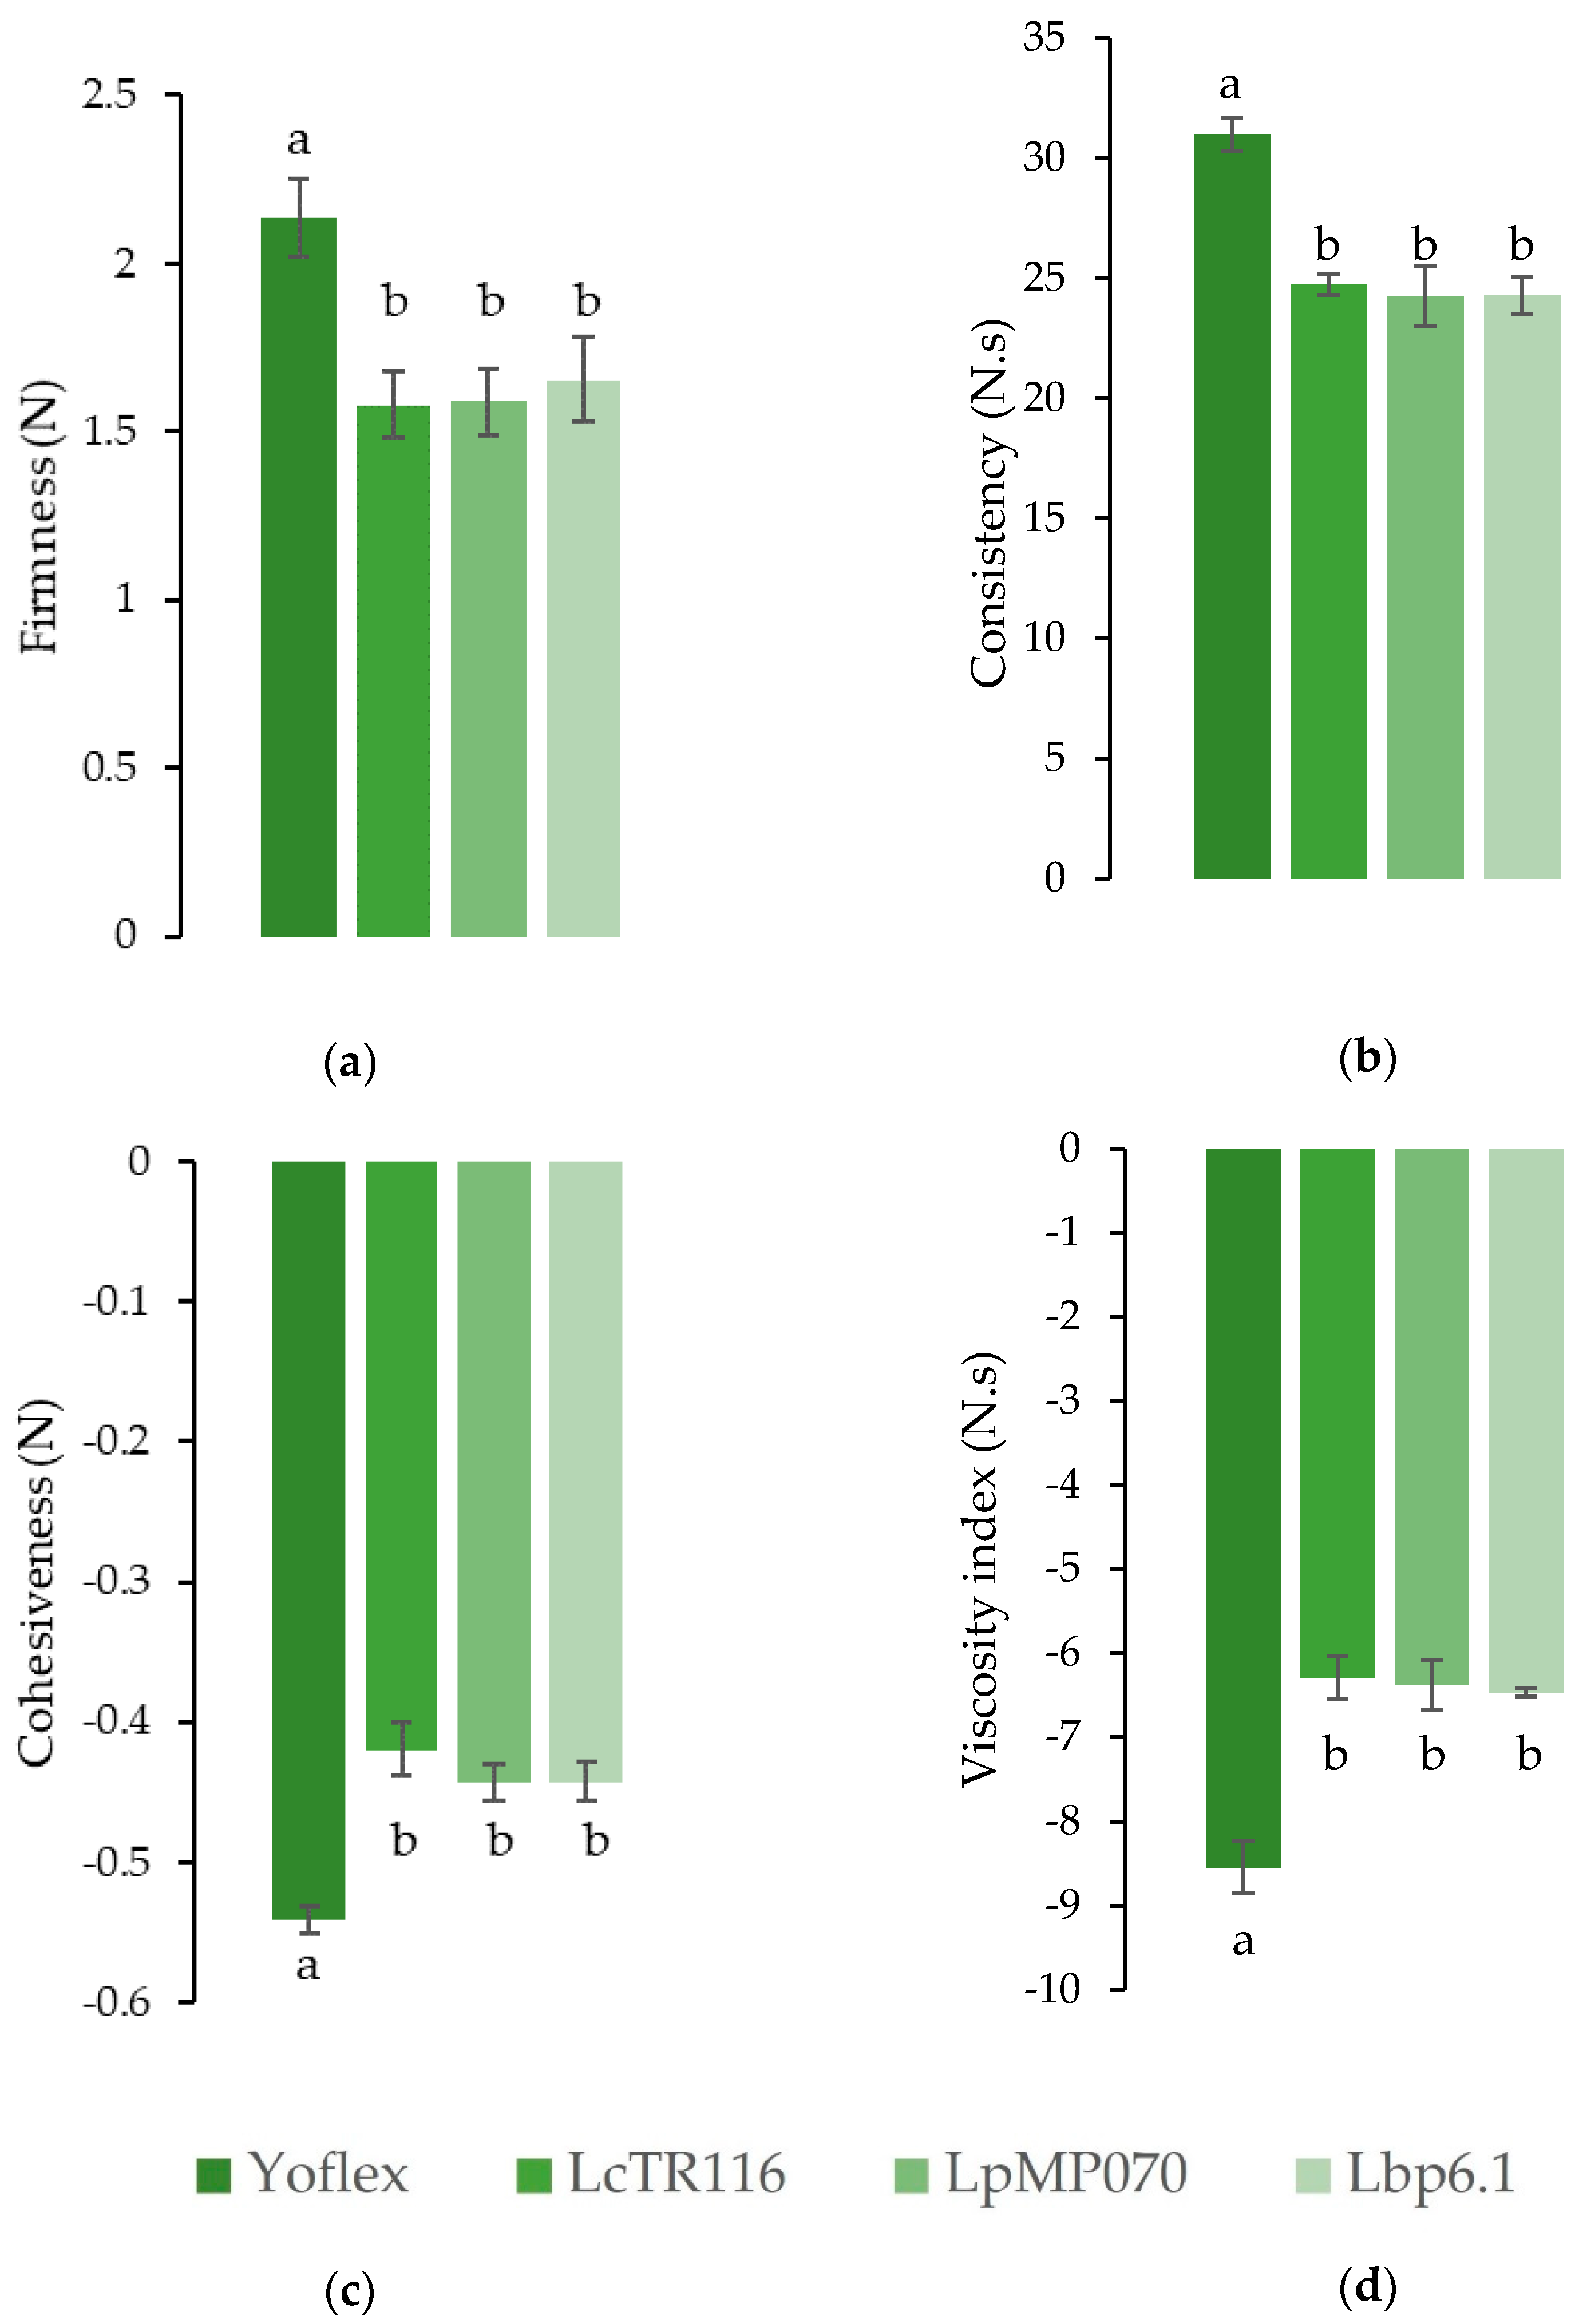
3.2. Uniaxial Compression Testing
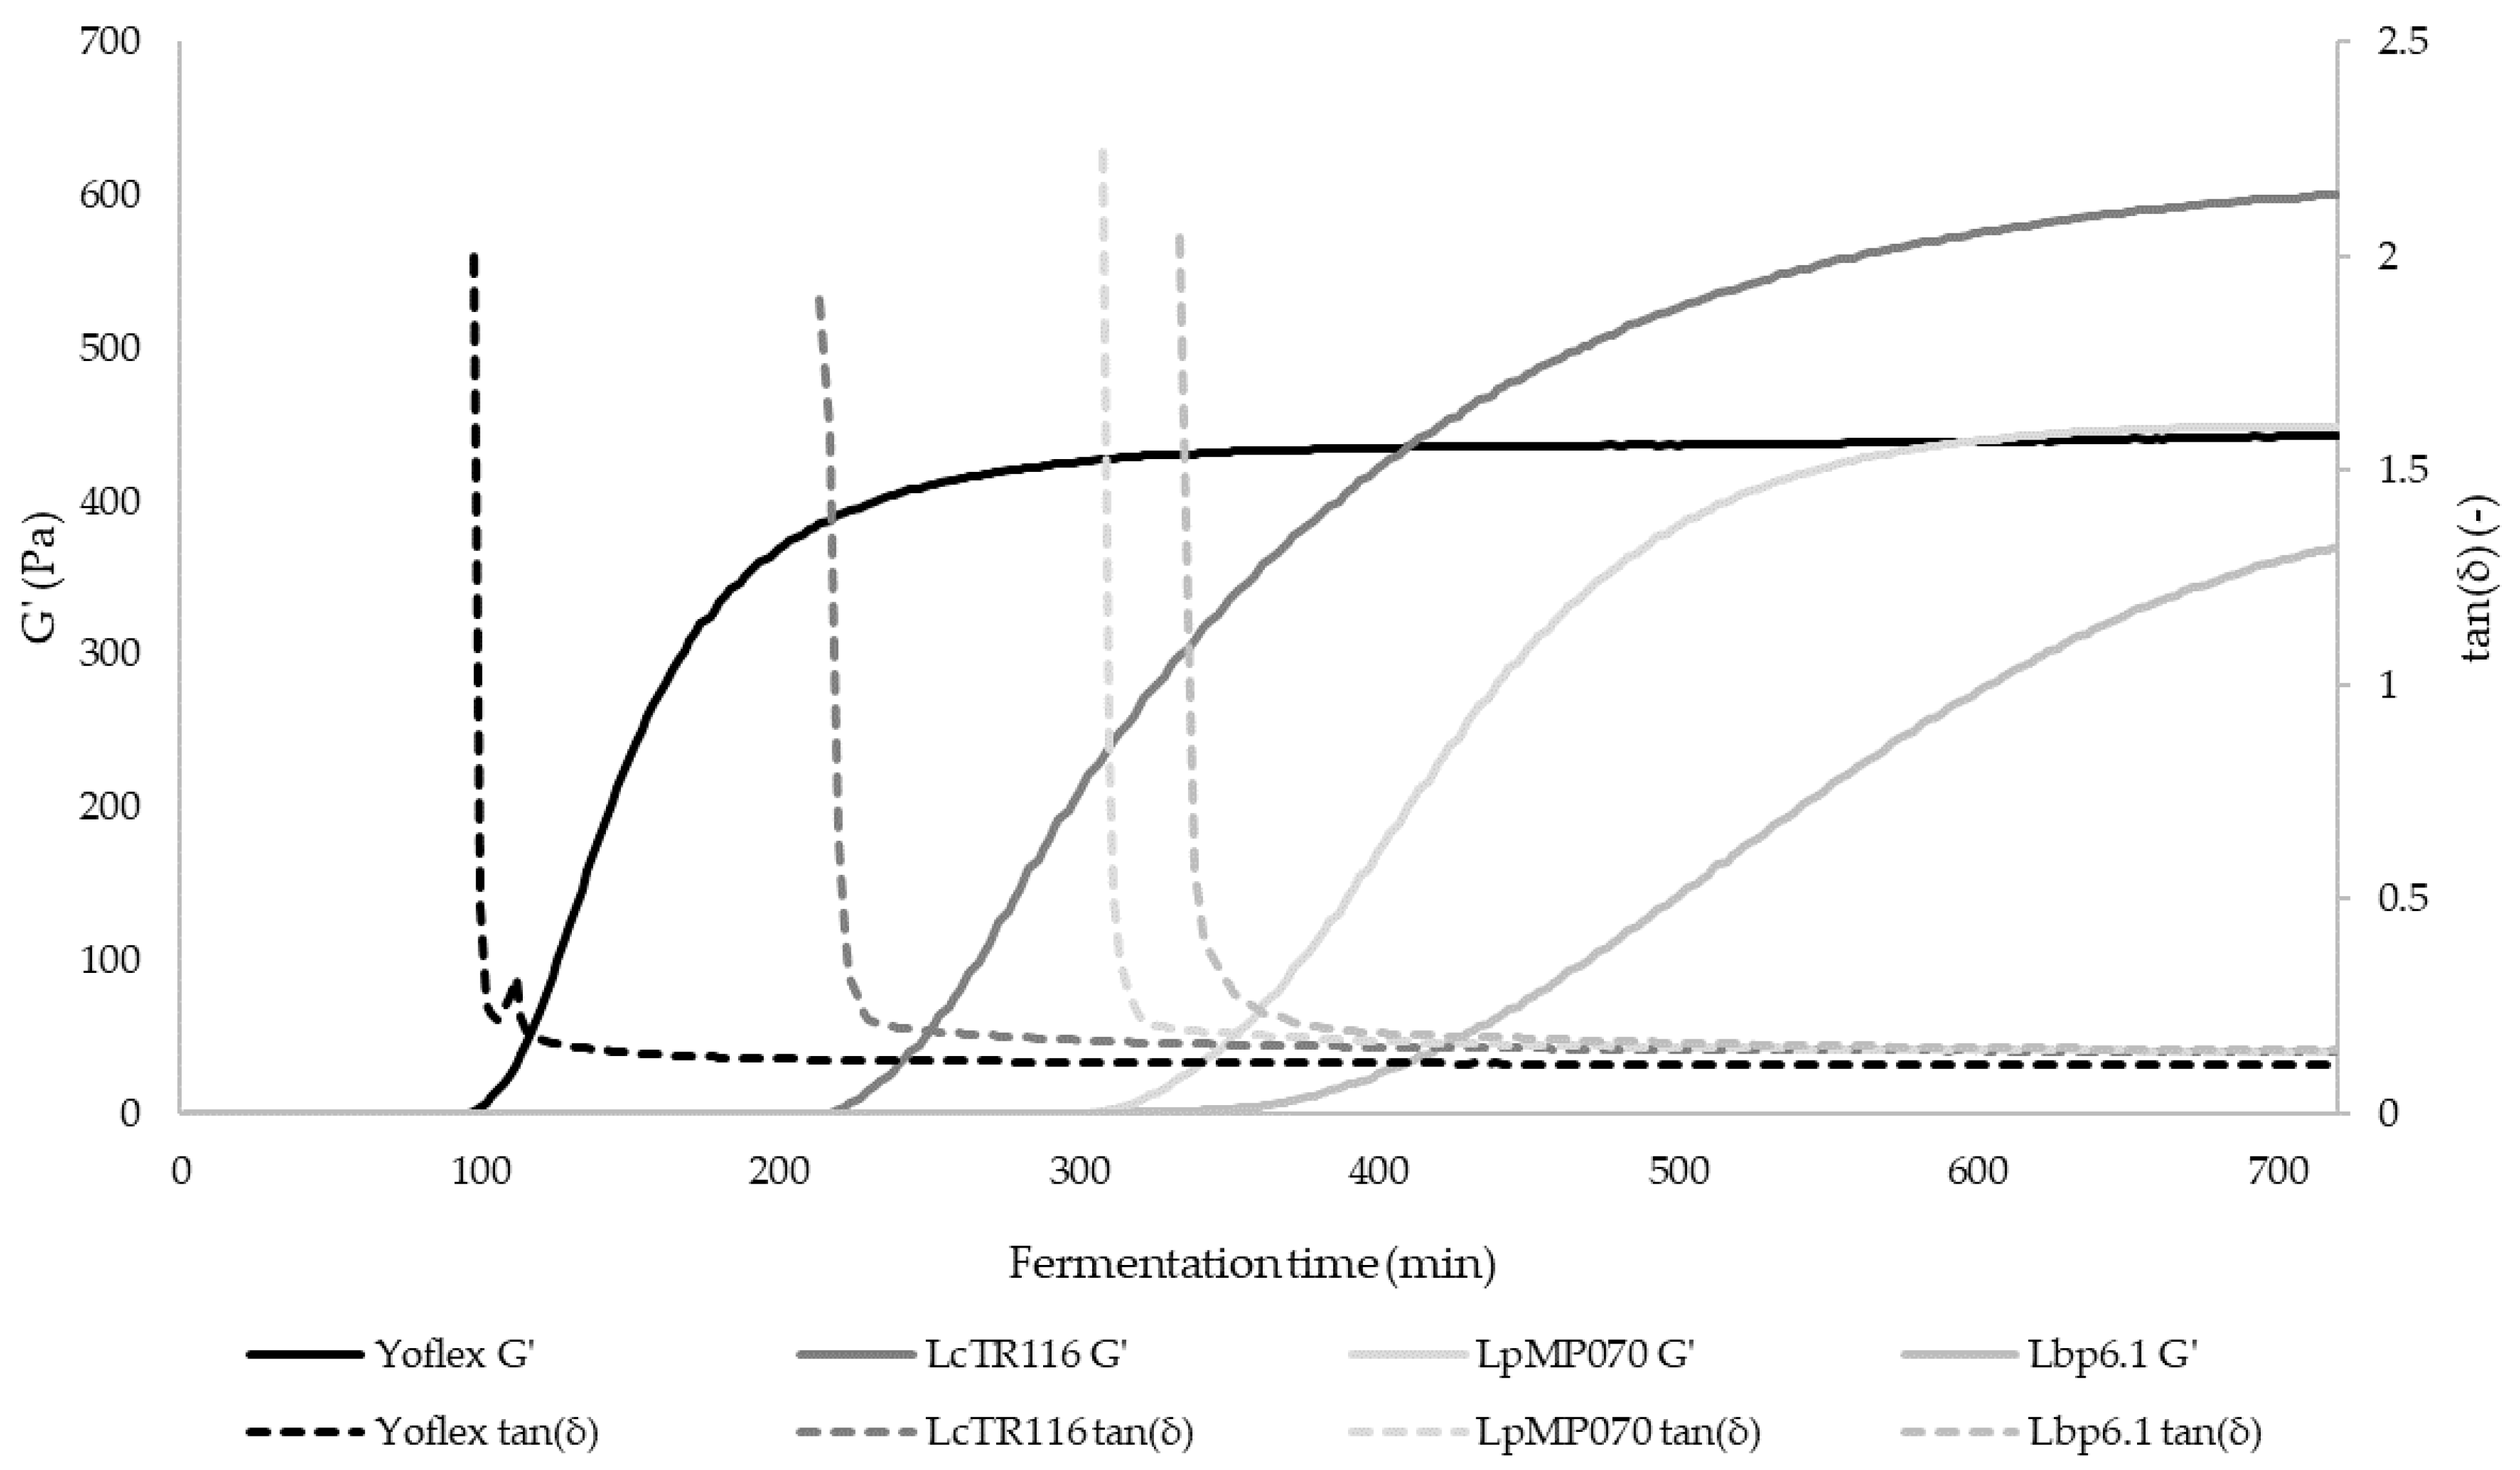
3.3. Rheological and Tribological Behavior
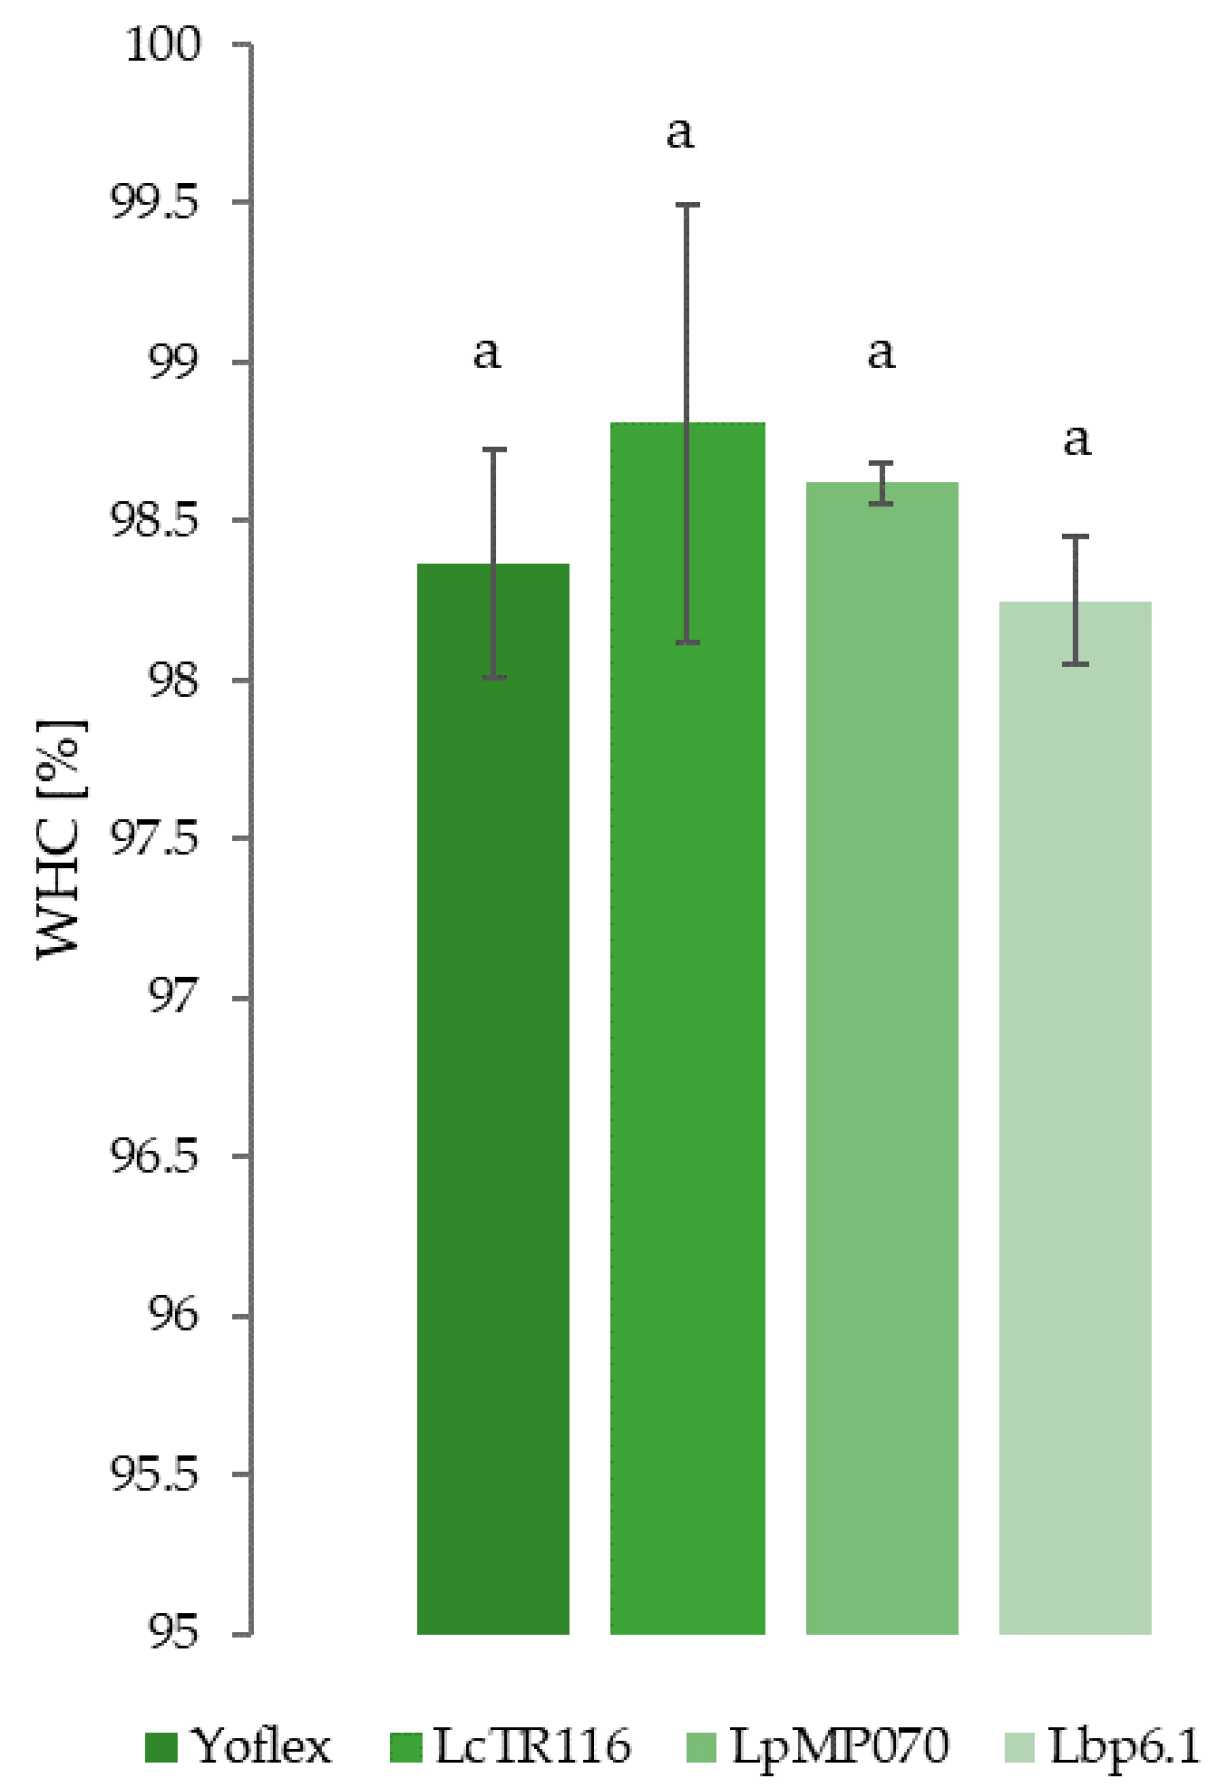
3.4. Water Holding Capacity
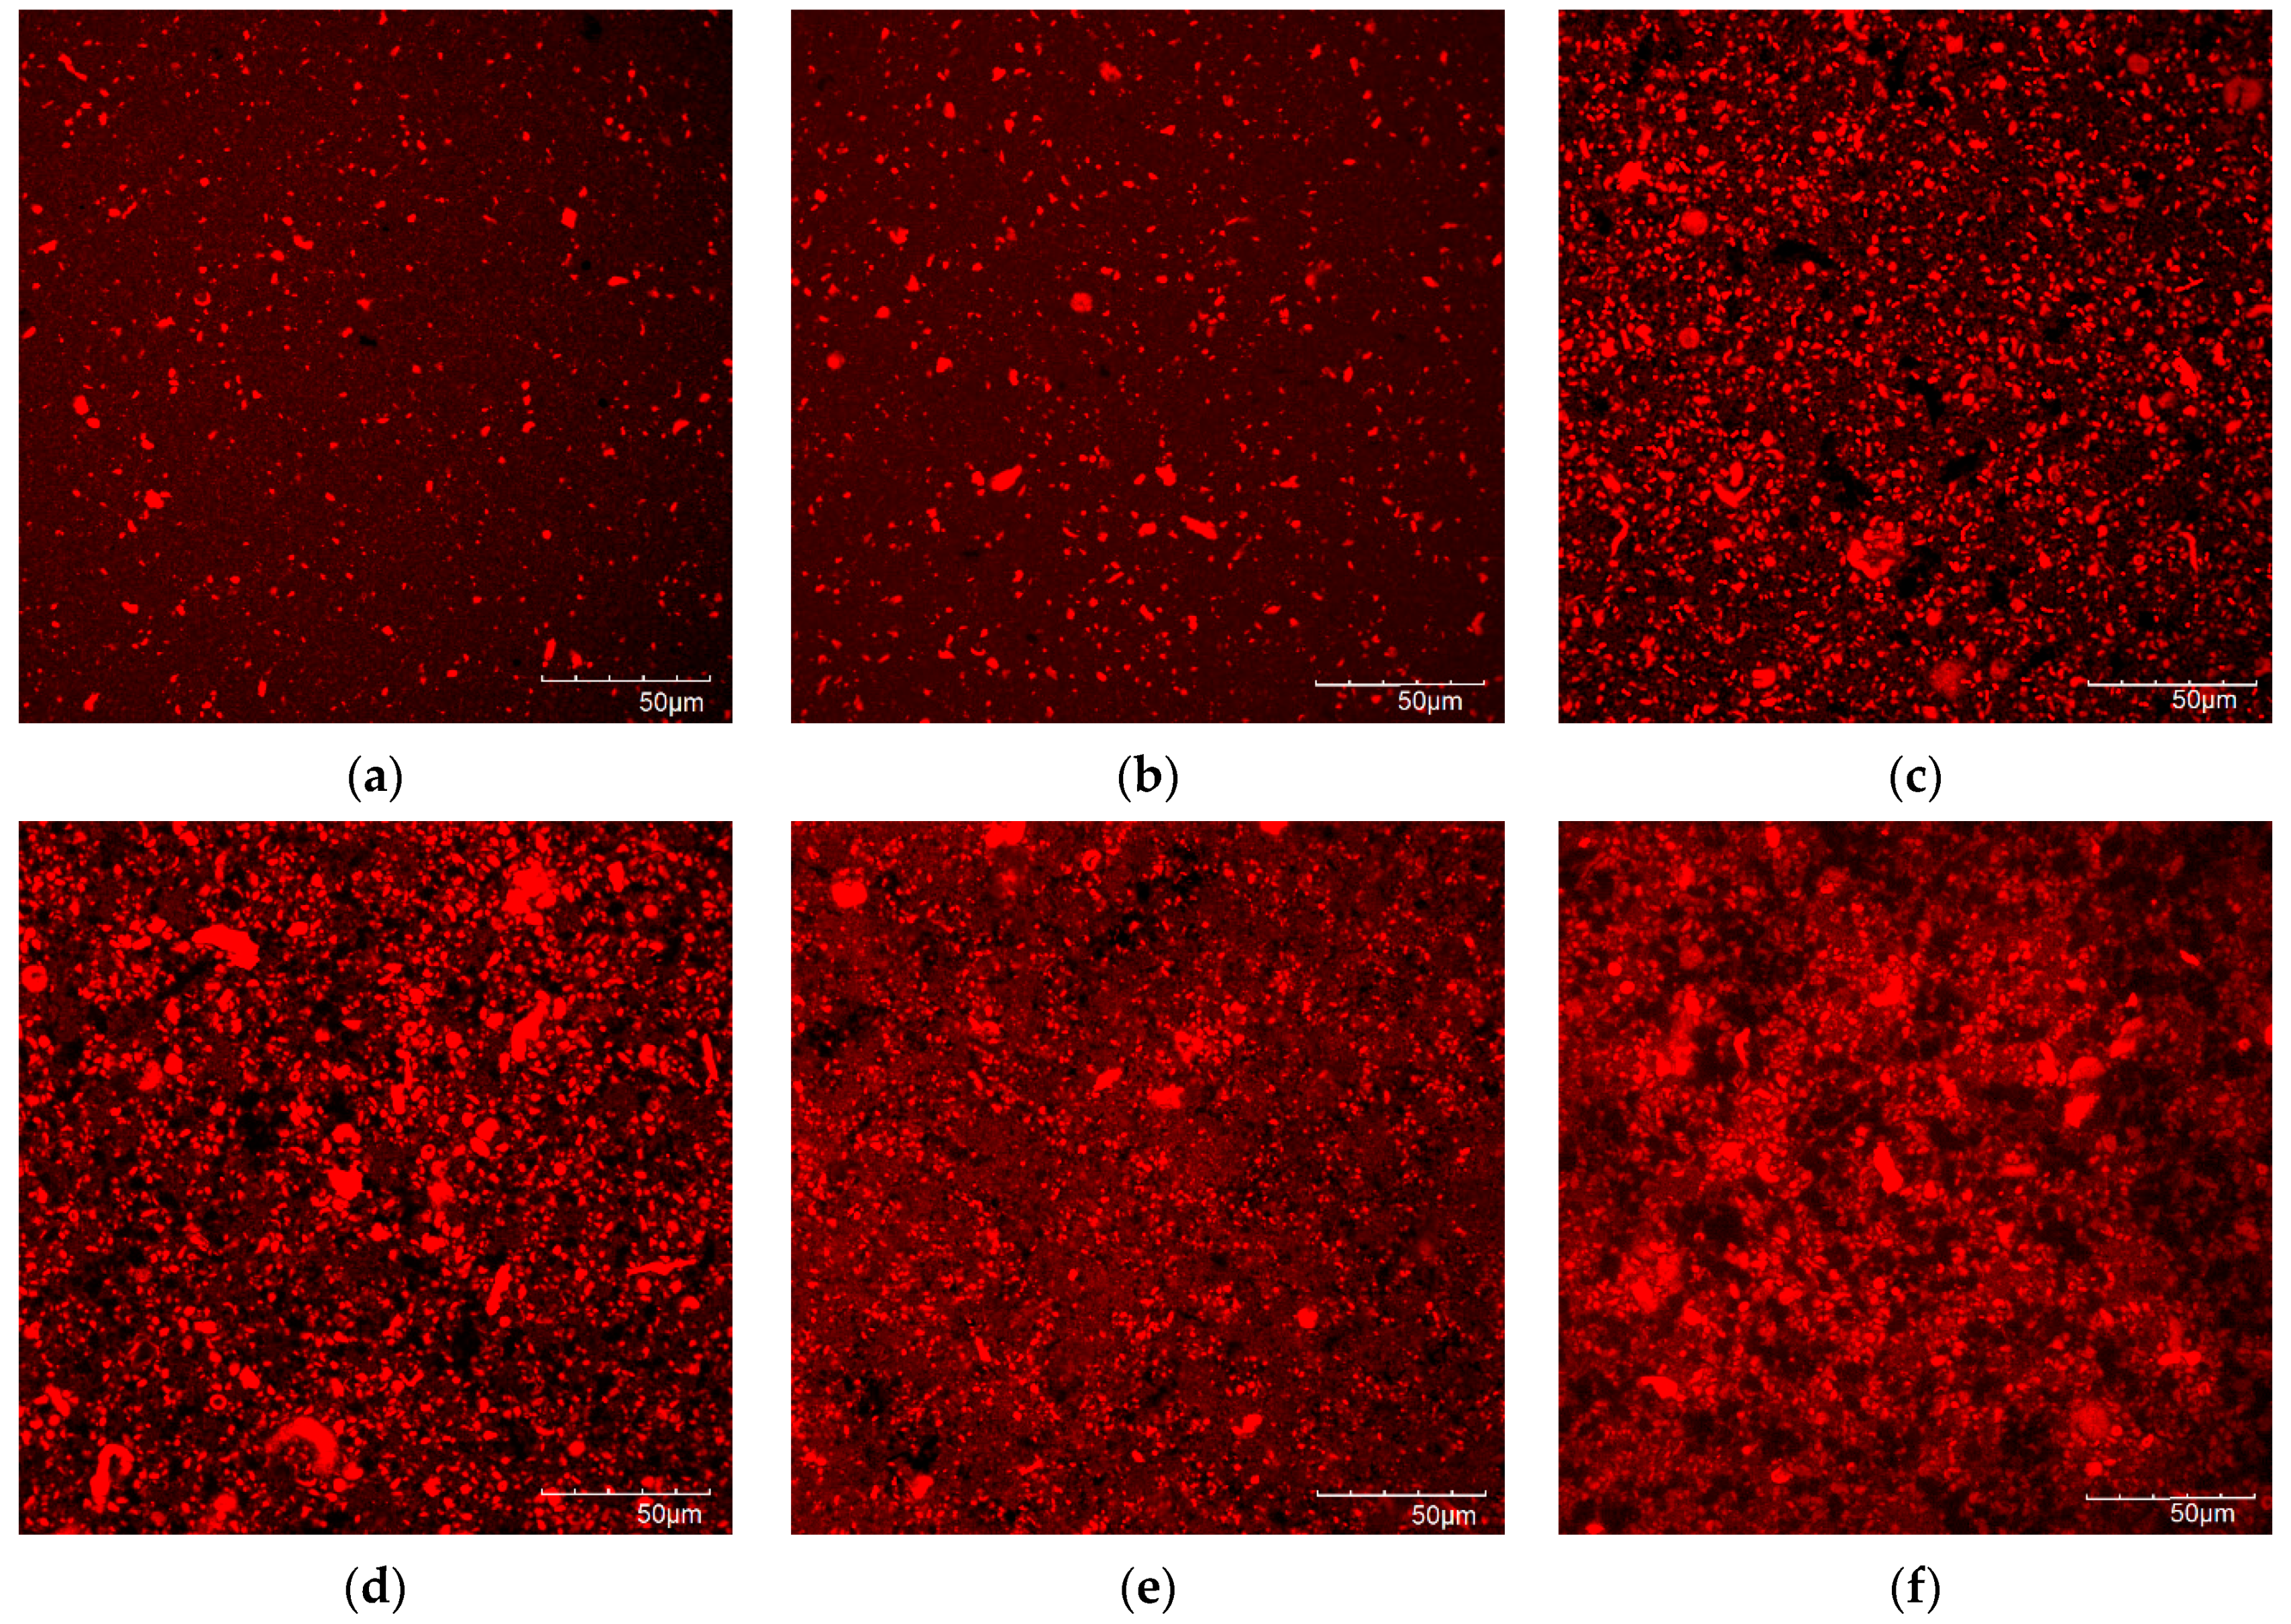
3.5. Microstructure of the Protein Gels
3.6. Content of FODMAPs and Sucrose
3.7. Content of Antifungal Phenolic Acids
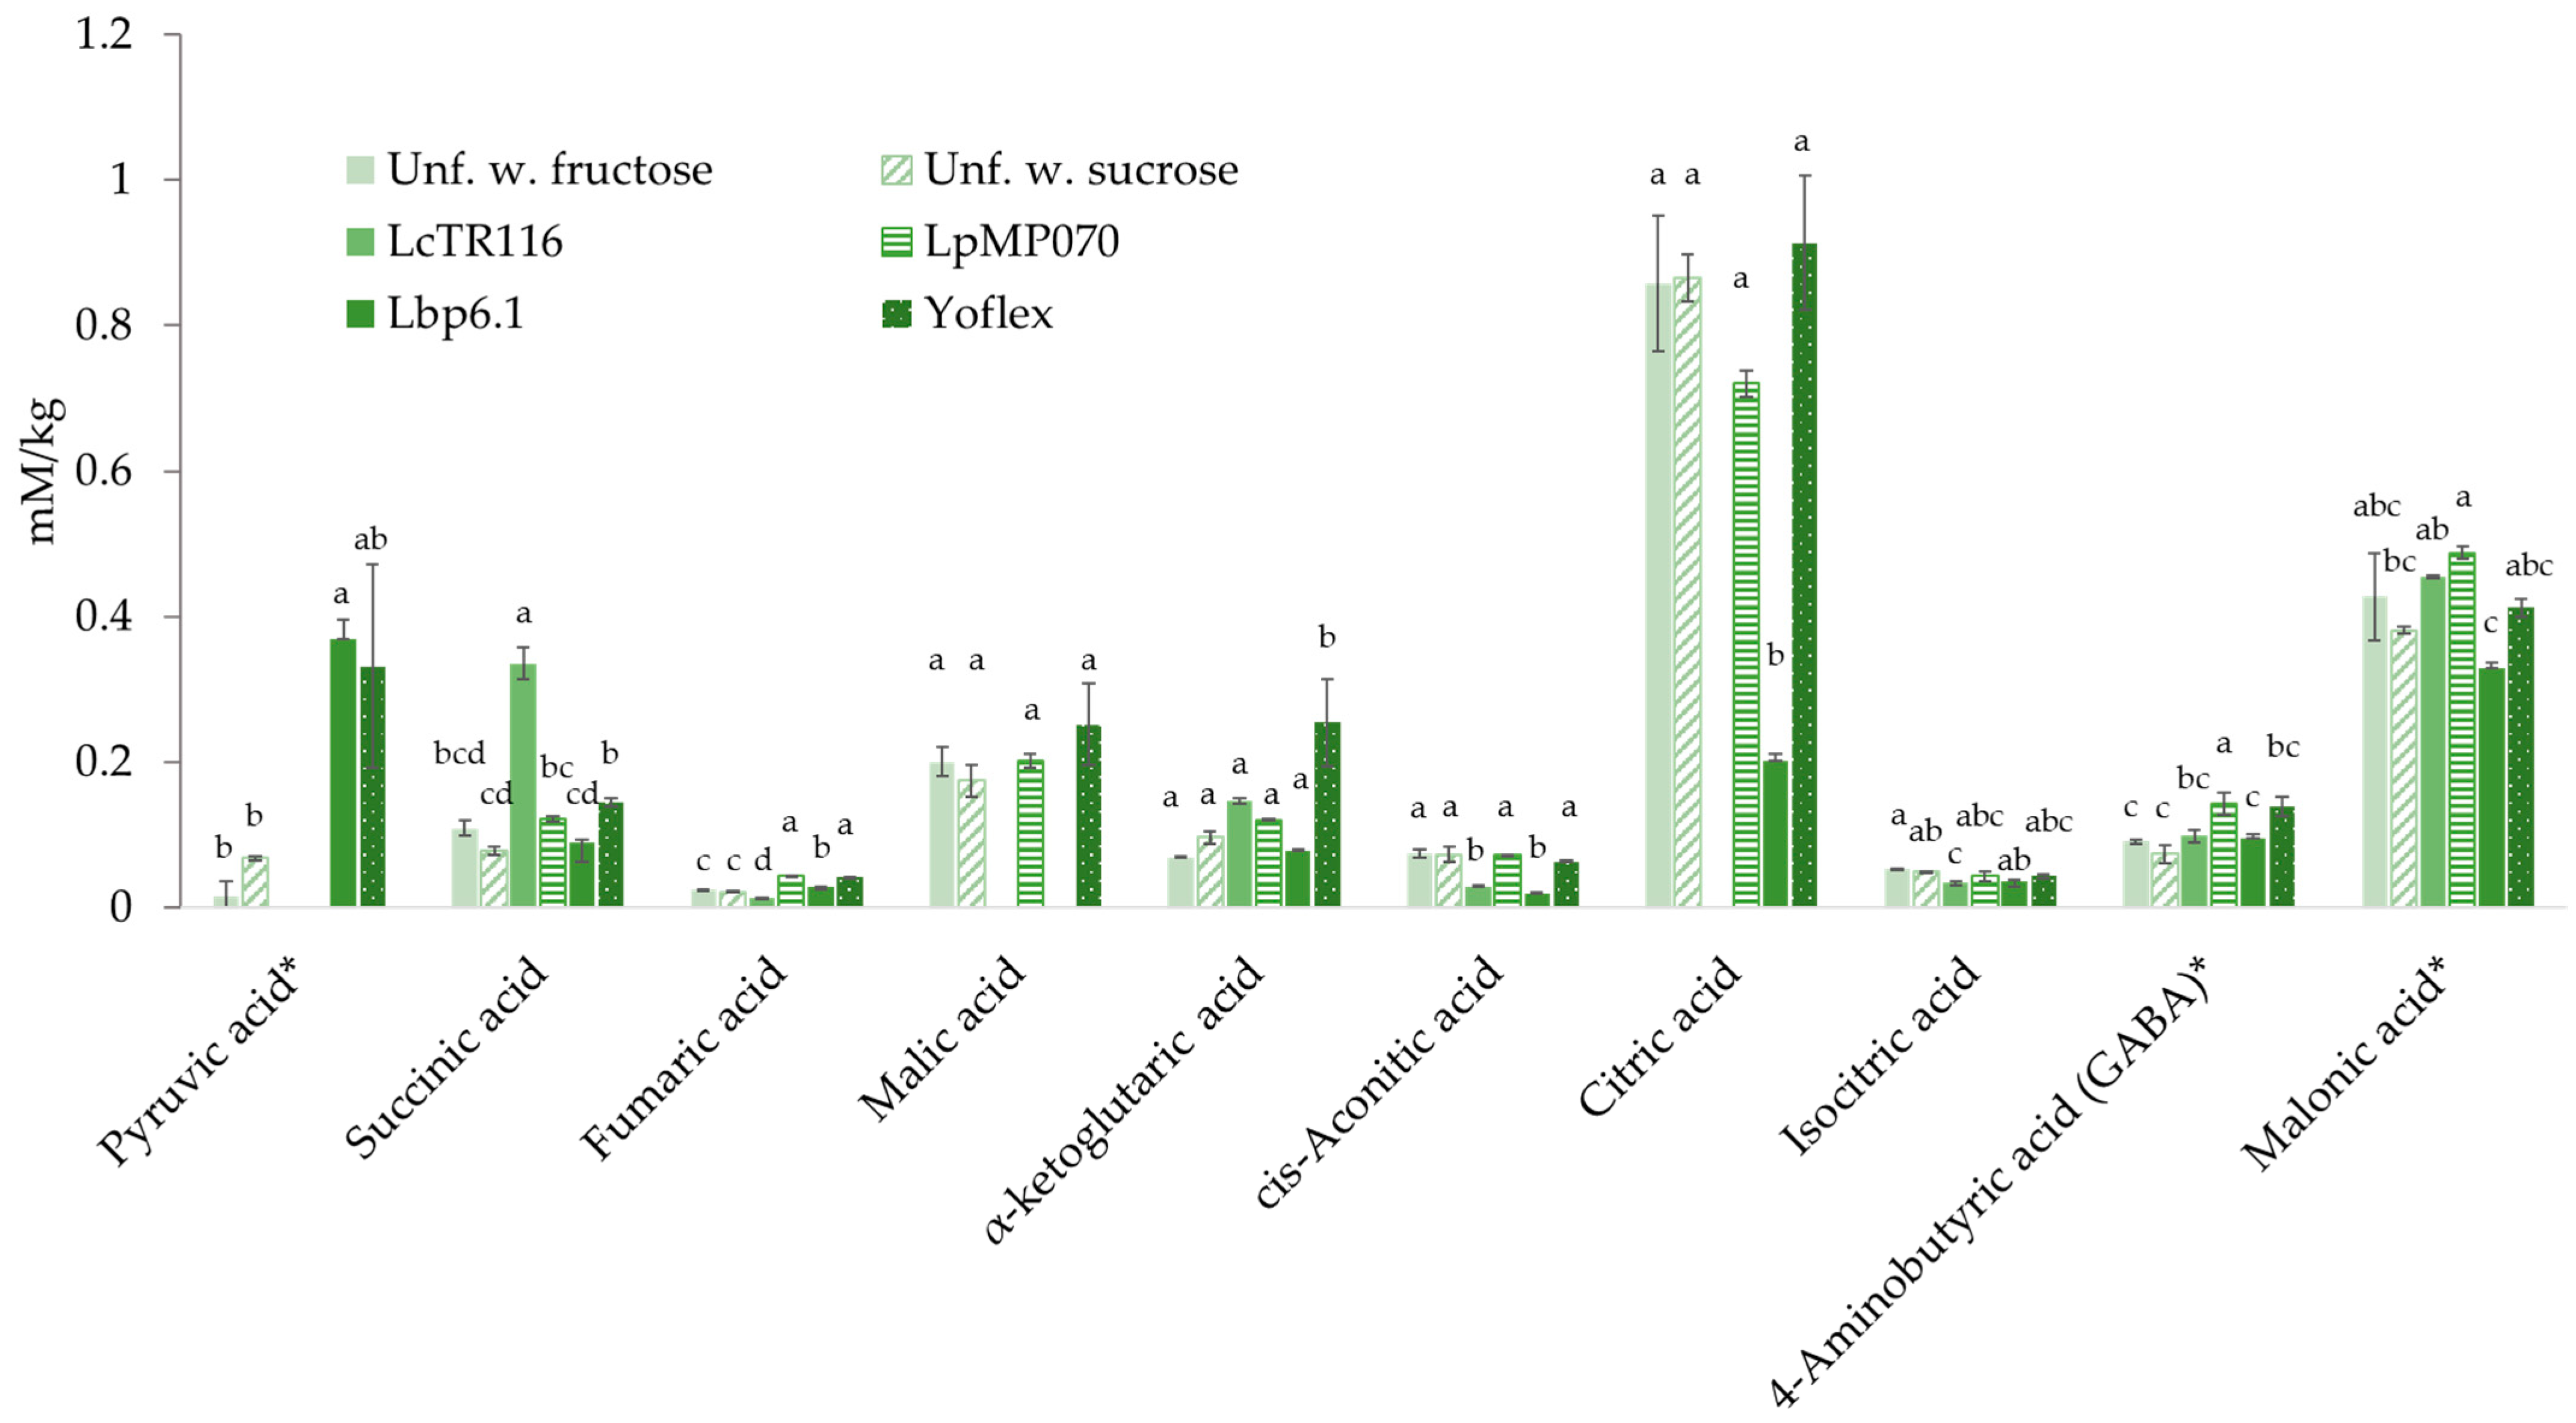
3.8. Analysis of Metabolites
3.9. Sensory Analysis
4. Conclusions
Supplementary Materials
Author Contributions
Funding
Institutional Review Board Statement
Informed Consent Statement
Data Availability Statement
Acknowledgments
Conflicts of Interest
References
- Willett, W.; Rockström, J.; Loken, B.; Springmann, M.; Lang, T.; Vermeulen, S.; Garnett, T.; Tilman, D.; DeClerck, F.; Wood, A.; et al. Food in the Anthropocene: The EAT–Lancet Commission on healthy diets from sustainable food systems. Lancet 2019, 393, 447–492. [Google Scholar] [CrossRef]
- Day, L. Proteins from land plants—Potential resources for human nutrition and food security. Trends Food Sci. Technol. 2013, 32, 25–42. [Google Scholar] [CrossRef]
- Liu, K.; Blackshaw, R.E.; Johnson, E.N.; Hossain, Z.; Hamel, C.; St-Arnaud, M.; Gan, Y. Lentil enhances the productivity and stability of oilseed-cereal cropping systems across different environments. Eur. J. Agron. 2019, 105, 24–31. [Google Scholar] [CrossRef]
- Detzel, A.; Krüger, M.; Busch, M.; Blanco-Gutiérrez, I.; Varela, C.; Manners, R.; Bez, J.; Zannini, E. Life cycle assessment of animal-based foods and plant-based protein-rich alternatives: An environmental perspective. J. Sci. Food Agric. 2021, 1–13. [Google Scholar] [CrossRef]
- European Commission. Report form the Commission to the Council and the European Parliament on the development of plant proteins in the European Union. Eur. Comm. 2018, 757, 1–15. [Google Scholar]
- Alonso-Miravalles, L.; Jeske, S.; Bez, J.; Detzel, A.; Busch, M.; Krueger, M.; Wriessnegger, C.L.; O’Mahony, J.A.; Zannini, E.; Arendt, E.K. Membrane filtration and isoelectric precipitation technological approaches for the preparation of novel, functional and sustainable protein isolate from lentils. Eur. Food Res. Technol. 2019, 245, 1855–1869. [Google Scholar] [CrossRef]
- Boeck, T.; Zannini, E.; Sahin, A.W.; Bez, J.; Arendt, E.K. Nutritional and Rheological Features of Lentil Protein Isolate for Yoghurt-Like Application. Foods 2021, 10, 1692. [Google Scholar] [CrossRef]
- Grasso, N.; Alonso-Miravalles, L.; O’Mahony, J.A. Composition, physicochemical and sensorial properties of commercial plant-based yogurts. Foods 2020, 9, 252. [Google Scholar] [CrossRef] [Green Version]
- Sethi, S.; Tyagi, S.K.; Anurag, R.K. Plant-based milk alternatives an emerging segment of functional beverages: A review. J. Food Sci. Technol. 2016, 53, 3408–3423. [Google Scholar] [CrossRef]
- Vogelsang-O’Dwyer, M.; Sahin, A.W.; Zannini, E.; Arendt, E.K. Physicochemical and nutritional properties of high protein emulsion-type lupin-based model milk alternatives: Effect of protein source and homogenization pressure. J. Sci. Food Agric. 2021, 1–12. [Google Scholar] [CrossRef]
- CXS 243-20; Standards for Fermented Milks. Codex Alimentarius Comission: Rome, Italy, 2018.
- Montemurro, M.; Pontonio, E.; Coda, R.; Rizzello, C.G. Plant-based alternatives to yogurt: State-of-the-art and perspectives of new biotechnological challenges. Foods 2021, 10, 316. [Google Scholar] [CrossRef]
- Boeck, T.; Zannini, E.; Arendt, E.K. Nutritional properties and health aspects of pulses and their use in plant-based yogurt alternatives. Compr. Rev. Food Sci. Food Saf. 2021, 20, 1–23. [Google Scholar] [CrossRef]
- Zannini, E.; Jeske, S.; Lynch, K.; Arendt, E.K. Development of novel quinoa-based yoghurt fermented with dextran producer Weissella cibaria MG. Int. J. Food Microbiol. 2018, 268, 19–26. [Google Scholar] [CrossRef]
- Gu, Q.; Zhang, C.; Song, D.; Li, P.; Zhu, X. Enhancing vitamin B12 content in soy-yogurt by Lactobacillus reuteri. Int. J. Food Microbiol. 2015, 206, 56–59. [Google Scholar] [CrossRef]
- Wu, Q.Q.; You, H.J.; Ahn, H.J.; Kwon, B.; Ji, G.E. Changes in growth and survival of Bifidobacterium by coculture with Propionibacterium in soy milk, cow’s milk, and modified MRS medium. Int. J. Food Microbiol. 2012, 157, 65–72. [Google Scholar] [CrossRef]
- Lee, J.H.; Hwang, C.E.; Cho, E.J.; Song, Y.H.; Kim, S.C.; Cho, K.M. Improvement of nutritional components and in vitro antioxidative properties of soy-powder yogurts using Lactobacillus plantarum. J. Food Drug Anal. 2018, 26, 1054–1065. [Google Scholar] [CrossRef]
- Coda, R.; Lanera, A.; Trani, A.; Gobbetti, M.; Di Cagno, R. Yogurt-like beverages made of a mixture of cereals, soy and grape must: Microbiology, texture, nutritional and sensory properties. Int. J. Food Microbiol. 2012, 155, 120–127. [Google Scholar] [CrossRef]
- Jeske, S.; Zannini, E.; Lynch, K.M.; Coffey, A.; Arendt, E.K. Polyol-producing lactic acid bacteria isolated from sourdough and their application to reduce sugar in a quinoa-based milk substitute. Int. J. Food Microbiol. 2018, 286, 31–36. [Google Scholar] [CrossRef]
- Sahin, A.W.; Rice, T.; Zannini, E.; Axel, C.; Coffey, A.; Lynch, K.M.; Arendt, E.K. Leuconostoc citreum TR116: In-situ production of mannitol in sourdough and its application to reduce sugar in burger buns. Int. J. Food Microbiol. 2019, 302, 80–89. [Google Scholar] [CrossRef]
- Hoehnel, A.; Bez, J.; Sahin, A.W.; Coffey, A.; Arendt, E.K.; Zannini, E. Leuconostoc citreum TR116 as a Microbial Cell Factory to Functionalise High-Protein Faba Bean Ingredients for Bakery Applications. Foods 2020, 9, 1706. [Google Scholar] [CrossRef]
- Minervini, F. Lactic Acid Bacteria—Lactobacillus spp.: Lactobacillus casei Group. In Encyclopedia of Dairy Sciences; Fuquay, J.W., Ed.; Academic Press: Cambridge, MA, USA, 2011; pp. 96–104. ISBN 9780123744074. [Google Scholar]
- Sahin, A.W.; Rice, T.; Coffey, A. Genomic analysis of Leuconostoc citreum TR116 with metabolic reconstruction and the effects of fructose on gene expression for mannitol production. Int. J. Food Microbiol. 2021, 354, 109327. [Google Scholar] [CrossRef]
- Rice, T.; Sahin, A.W.; Lynch, K.M.; Arendt, E.K.; Coffey, A. Isolation, characterisation and exploitation of lactic acid bacteria capable of efficient conversion of sugars to mannitol. Int. J. Food Microbiol. 2020, 321, 108546. [Google Scholar] [CrossRef]
- Vogelsang-O’Dwyer, M.; Sahin, A.W.; Bot, F.; Mahony, J.A.O.; Bez, J.; Arendt, E.K.; Zannini, E. Enzymatic Hydrolysis of Lentil Protein Isolate for Modification of Physicochemical and Functional Properties (Under review). Eur. Food Res. Technol. 2022, 1–34. [Google Scholar]
- EFSA BIOHAZ Panel (EFSA Panel on Biological Hazards); Koutsoumanis, K.; Allende, A.; Alvarez-Ordóñez, A.; Bolton, D.; Bover-Cid, S.; Chemaly, M.; Davies, R.; De Cesare, A.; Hilbert, F.; et al. Statement on the update of the list of QPS-recommended biological agents intentionally added to food or feed as notified to EFSA 15: Suitability of taxonomic units notified to EFSA until September 2021. EFSA J. 2022, 20, e07045. [Google Scholar] [CrossRef]
- Jeske, S.; Bez, J.; Arendt, E.K.; Zannini, E. Formation, stability, and sensory characteristics of a lentil-based milk substitute as affected by homogenisation and pasteurisation. Eur. Food Res. Technol. 2019, 245, 1519–1531. [Google Scholar] [CrossRef]
- Ispiryan, L.; Heitmann, M.; Hoehnel, A.; Zannini, E.; Arendt, E.K. Optimization and Validation of an HPAEC-PAD Method for the Quantification of FODMAPs in Cereals and Cereal-Based Products. J. Agric. Food Chem. 2019, 67, 4384–4392. [Google Scholar] [CrossRef]
- Klost, M.; Drusch, S. Structure formation and rheological properties of pea protein-based gels. Food Hydrocoll. 2019, 94, 622–630. [Google Scholar] [CrossRef] [Green Version]
- Nguyen, P.T.M.; Kravchuk, O.; Bhandari, B.; Prakash, S. Effect of different hydrocolloids on texture, rheology, tribology and sensory perception of texture and mouthfeel of low-fat pot-set yoghurt. Food Hydrocoll. 2017, 72, 90–104. [Google Scholar] [CrossRef] [Green Version]
- Di Cicco, F.; Oosterlinck, F.; Tromp, H.; Sein, A. Comparative study of whey protein isolate gel and polydimethylsiloxane as tribological surfaces to differentiate friction properties of commercial yogurts. Food Hydrocoll. 2019, 97, 105204. [Google Scholar] [CrossRef]
- Fox, D.; Sahin, A.W.; De Schutter, D.P.; Arendt, E.K. Mouthfeel of Beer: Development of Tribology Method and Correlation with Sensory Data from an Online Database. J. Am. Soc. Brew. Chem. 2021, 80, 1–21. [Google Scholar] [CrossRef]
- Silva, J.V.C.; O’Mahony, J.A. Microparticulated whey protein addition modulates rheological and microstructural properties of high-protein acid milk gels. Int. Dairy J. 2018, 78, 145–151. [Google Scholar] [CrossRef]
- Hickisch, A.; Bindl, K.; Vogel, R.F.; Toelstede, S. Thermal treatment of lupin-based milk alternatives—Impact on lupin proteins and the network of respective lupin-based yogurt alternatives. Food Res. Int. 2016, 89, 850–859. [Google Scholar] [CrossRef]
- Axel, C.; Brosnan, B.; Zannini, E.; Peyer, L.C.; Furey, A.; Coffey, A.; Arendt, E.K. Antifungal activities of three different Lactobacillus species and their production of antifungal carboxylic acids in wheat sourdough. Appl. Microbiol. Biotechnol. 2016, 100, 1701–1711. [Google Scholar] [CrossRef]
- Crowley, S.; Mahony, J.; Van Sinderen, D. Current perspectives on antifungal lactic acid bacteria as natural bio-preservatives. Trends Food Sci. Technol. 2013, 33, 93–109. [Google Scholar] [CrossRef]
- Brosnan, B.; Coffey, A.; Arendt, E.K.; Furey, A. The QuEChERS approach in a novel application for the identification of antifungal compounds produced by lactic acid bacteria cultures. Talanta 2014, 129, 364–373. [Google Scholar] [CrossRef]
- AACC International. Cereals & Grains Association AACC Method 44-15.02 Moisture–Air-Oven Methods. In AACC Approved Methods of Analysis, 11th ed.; American Association of Cereal Chemists: St. Paul, MN, USA, 1999. [Google Scholar]
- Smart, K.F.; Aggio, R.B.M.; Van Houtte, J.R.; Villas-Bôas, S.G. Analytical platform for metabolome analysis of microbial cells using methyl chloroformate derivatization followed by gas chromatography-mass spectrometry. Nat. Protoc. 2010, 5, 1709–1729. [Google Scholar] [CrossRef]
- Jiménez-Martínez, C.; Hernández-Sánchez, H.; Dávila-Ortiz, G. Production of a yogurt-like product from Lupinus campestris seeds. J. Sci. Food Agric. 2003, 83, 515–522. [Google Scholar] [CrossRef]
- Li, H.; Liu, F.; Kang, L.; Zheng, M. Study on the buffering capacity of wort. J. Inst. Brew. 2016, 122, 138–142. [Google Scholar] [CrossRef]
- Chang, R. Physical Chemistry for the Biosciences; University Science Books: Mill Valley, CA, USA, 2004; ISBN 1891389335. [Google Scholar]
- Tirloni, E.; Bernardi, C.; Celandroni, F.; Ghelardi, E.; Stella, S. Effectiveness of lactic and acetic acids on the growth of Listeria monocytogenes and Bacillus cereus in primo sale fresh cheese. Lwt 2021, 151, 112170. [Google Scholar] [CrossRef]
- Aryana, K.J.; Olson, D.W. A 100-Year Review: Yogurt and other cultured dairy products. J. Dairy Sci. 2017, 100, 9987–10013. [Google Scholar] [CrossRef] [Green Version]
- Al-dabbas, M.M.; Al-ismail, K.; Taleb, R.A.; Ibrahim, S. Acid-Base Buffering Properties of Five Legumes and Selected Food in vitro. Am. J. Agric. Biol. Sci. 2010, 5, 154–160. [Google Scholar] [CrossRef] [Green Version]
- Lee, S.-Y.; Yeo, Y.-S.; Park, S.-Y.; Lee, S.-G.; Lee, S.-M.; Cho, H.-S.; Chung, N.-J.; Oh, S.-W. Compositional Analysis of Lentil (Lens culinaris) Cultivars Related to Colors and Their Antioxidative Activity. Plant Breed. Biotechnol. 2017, 5, 192–203. [Google Scholar] [CrossRef] [Green Version]
- Boon, C.S.; McClements, D.J.; Weiss, J.; Decker, E.A. Factors influencing the chemical stability of carotenoids in foods. Crit. Rev. Food Sci. Nutr. 2010, 50, 515–532. [Google Scholar] [CrossRef] [PubMed]
- Wrolstad, R.E.; Durst, R.W.; Lee, J. Tracking color and pigment changes in anthocyanin products. Trends Food Sci. Technol. 2005, 16, 423–428. [Google Scholar] [CrossRef]
- Milovanovic, B.; Djekic, I.; Miocinovic, J.; Djordjevic, V.; Lorenzo, J.M.; Barba, F.J.; Mörlein, D.; Tomasevic, I. What is the color of milk and dairy products and how is it measured? Foods 2020, 9, 1629. [Google Scholar] [CrossRef]
- Hickisch, A.; Beer, R.; Vogel, R.F.; Toelstede, S. Influence of lupin-based milk alternative heat treatment and exopolysaccharide-producing lactic acid bacteria on the physical characteristics of lupin-based yogurt alternatives. Food Res. Int. 2016, 84, 180–188. [Google Scholar] [CrossRef]
- Angioloni, A.; Collar, C. Small and large deformation viscoelastic behaviour of selected fibre blends with gelling properties. Food Hydrocoll. 2009, 23, 742–748. [Google Scholar] [CrossRef]
- Sun, X.D.; Arntfield, S.D. Gelation properties of salt-extracted pea protein induced by heat treatment. Food Res. Int. 2010, 43, 509–515. [Google Scholar] [CrossRef]
- Beal, C.; Skokanova, J.; Latrille, E.; Martin, N.; Corrieu, G. Combined effects of culture conditions and storage time on acidification and viscosity of stirred yogurt. J. Dairy Sci. 1999, 82, 673–681. [Google Scholar] [CrossRef]
- Toker, O.S.; Karasu, S.; Yilmaz, M.T.; Karaman, S. Three interval thixotropy test (3ITT) in food applications: A novel technique to determine structural regeneration of mayonnaise under different shear conditions. Food Res. Int. 2015, 70, 125–133. [Google Scholar] [CrossRef]
- Arab, M.; Yousefi, M.; Khanniri, E.; Azari, M.; Ghasemzadeh-Mohammadi, V.; Mollakhalili-Meybodi, N. A comprehensive review on yogurt syneresis: Effect of processing conditions and added additives. J. Food Sci. Technol. 2022, 1–10. [Google Scholar] [CrossRef]
- Harwalkar, V.R.; Kalab, M. Susceptibility of yoghurt to syneresis—Comparison of centrifugation and drainage methods. Milchwissenschaft 1983, 38, 517–522. [Google Scholar]
- Renkema, J.M.S. Relations between rheological properties and network structure of soy protein gels. Food Hydrocoll. 2004, 18, 39–47. [Google Scholar] [CrossRef]
- Bi, C.; Li, D.; Wang, L.-J.; Adhikari, B. Viscoelastic properties and fractal analysis of acid-induced SPI gels at different ionic strength. Carbohydr. Polym. 2013, 92, 98–105. [Google Scholar] [CrossRef]
- Fedewa, A.; Rao, S.S.C. Dietary fructose intolerance, fructan intolerance and FODMAPs. Curr. Gastroenterol. Rep. 2014, 16, 1–8. [Google Scholar] [CrossRef] [Green Version]
- Gibson, P.R.; Halmos, E.P.; Muir, J.G. Review article: FODMAPS, prebiotics and gut health-the FODMAP hypothesis revisited. Aliment. Pharmacol. Ther. 2020, 52, 233–246. [Google Scholar] [CrossRef]
- Staudacher, H.M.; Whelan, K.; Irving, P.M.; Lomer, M.C.E. Comparison of symptom response following advice for a diet low in fermentable carbohydrates (FODMAPs) versus standard dietary advice in patients with irritable bowel syndrome. J. Hum. Nutr. Diet. 2011, 24, 487–495. [Google Scholar] [CrossRef]
- Ispiryan, L.; Kuktaite, R.; Zannini, E.; Arendt, E.K. Fundamental study on changes in the FODMAP profile of cereals, pseudo-cereals, and pulses during the malting process. Food Chem. 2021, 343, 128549. [Google Scholar] [CrossRef]
- Joehnke, M.S.; Jeske, S.; Ispiryan, L.; Zannini, E.; Arendt, E.K.; Bez, J.; Sørensen, J.C.; Petersen, I.L. Nutritional and anti-nutritional properties of lentil (Lens culinaris) protein isolates prepared by pilot-scale processing. Food Chem. X 2020, 9, 100112. [Google Scholar] [CrossRef]
- Carr, F.J.; Chill, D.; Maida, N. The lactic acid bacteria: A literature survey. Crit. Rev. Microbiol. 2002, 28, 281–370. [Google Scholar] [CrossRef]
- Ortiz, M.E.; Bleckwedel, J.; Fadda, S.; Picariello, G.; Hebert, E.M.; Raya, R.R.; Mozzi, F. Global analysis of mannitol 2-dehydrogenase in lactobacillus reuteri CRL 1101 during mannitol production through enzymatic, genetic and proteomic approaches. PLoS ONE 2017, 12, 1–21. [Google Scholar] [CrossRef] [Green Version]
- Varney, J.; Barrett, J.; Scarlata, K.; Catsos, P.; Gibson, P.R.; Muir, J.G. FODMAPs: Food composition, defining cutoff values and international application. J. Gastroenterol. Hepatol. 2017, 32, 53–61. [Google Scholar] [CrossRef]
- McKinley, M.C. The nutrition and health benefits of yoghurt. Int. J. Dairy Technol. 2005, 58, 1–12. [Google Scholar] [CrossRef]
- Wisselink, H.W.; Weusthuis, R.A.; Eggink, G.; Hugenholtz, J.; Grobben, G.J. Mannitol production by lactic acid bacteria: A review. Int. Dairy J. 2002, 12, 151–161. [Google Scholar] [CrossRef]
- Chen, M.; Zhang, W.; Wu, H.; Guang, C.; Mu, W. Mannitol: Physiological functionalities, determination methods, biotechnological production, and applications. Appl. Microbiol. Biotechnol. 2020, 104, 6941–6951. [Google Scholar] [CrossRef]
- Papagianni, M. Metabolic engineering of lactic acid bacteria for the production of industrially important compounds. Comput. Struct. Biotechnol. J. 2012, 3, e201210003. [Google Scholar] [CrossRef] [Green Version]
- Ghosh, S.; Sudha, M.L. A review on polyols: New frontiers for health-based bakery products. Int. J. Food Sci. Nutr. 2012, 63, 372–379. [Google Scholar] [CrossRef]
- Kyaw, M.H.; Mayberry, J.F. Fructose malabsorption: True condition or a variance from normality. J. Clin. Gastroenterol. 2011, 45, 16–21. [Google Scholar] [CrossRef]
- Lavermicocca, P.; Valerio, F.; Visconti, A. Antifungal activity of phenyllactic acid against molds isolated from bakery products. Appl. Environ. Microbiol. 2003, 69, 634–640. [Google Scholar] [CrossRef] [Green Version]
- Schmidt, M.; Lynch, K.M.; Zannini, E.; Arendt, E.K. Fundamental study on the improvement of the antifungal activity of Lactobacillus reuteri R29 through increased production of phenyllactic acid and reuterin. Food Control 2018, 88, 139–148. [Google Scholar] [CrossRef]
- Lodovici, M.; Guglielmi, F.; Meoni, M.; Dolara, P. Effect of natural phenolic acids on DNA oxidation in vitro. Food Chem. Toxicol. 2001, 39, 1205–1210. [Google Scholar] [CrossRef]
- Vinayagam, R.; Jayachandran, M.; Xu, B. Antidiabetic Effects of Simple Phenolic Acids: A Comprehensive Review. Phyther. Res. 2016, 30, 184–199. [Google Scholar] [CrossRef] [PubMed]
- Rashmi, H.B.; Negi, P.S. Phenolic acids from vegetables: A review on processing stability and health benefits. Food Res. Int. 2020, 136, 109298. [Google Scholar] [CrossRef]
- Lafay, S.; Gil-Izquierdo, A. Bioavailability of phenolic acids. Phytochem. Rev. 2008, 7, 301–311. [Google Scholar] [CrossRef]
- Degrain, A.; Manhivi, V.; Remize, F.; Garcia, C.; Sivakumar, D. Effect of lactic acid fermentation on color, phenolic compounds and antioxidant activity in african nightshade. Microorganisms 2020, 8, 1324. [Google Scholar] [CrossRef]
- Mishra, S.; Sachan, A.; Vidyarthi, A.S.; Sachan, S.G. Transformation of ferulic acid to 4-vinyl guaiacol as a major metabolite: A microbial approach. Rev. Environ. Sci. Biotechnol. 2014, 13, 377–385. [Google Scholar] [CrossRef]
- Valerio, F.; Lavermicocca, P.; Pascale, M.; Visconti, A. Production of phenyllactic acid by lactic acid bacteria: An approach to the selection of strains contributing to food quality and preservation. FEMS Microbiol. Lett. 2004, 233, 289–295. [Google Scholar] [CrossRef]
- Li, X.; Ning, Y.; Liu, D.; Yan, A.; Wang, Z.; Wang, S.; Miao, M.; Zhu, H.; Jia, Y. Metabolic mechanism of phenyllactic acid naturally occurring in Chinese pickles. Food Chem. 2015, 186, 265–270. [Google Scholar] [CrossRef]
- Lavermicocca, P.; Valerio, F.; Evidente, A.; Lazzaroni, S.; Corsetti, A.; Gobbetti, M. Purification and characterization of novel antifungal compounds from the sourdough Lactobacillus plantarum strain 21B. Appl. Environ. Microbiol. 2000, 66, 4084–4090. [Google Scholar] [CrossRef] [Green Version]
- Ryan, L.A.M.; Dal Bello, F.; Czerny, M.; Koehler, P.; Arendt, E.K. Quantification of phenyllactic acid in wheat sourdough using high resolution gas chromatography-mass spectrometry. J. Agric. Food Chem. 2009, 57, 1060–1064. [Google Scholar] [CrossRef]
- Thierry, A.; Maillard, M.B. Production of cheese flavour compounds derived from amino acid catabolism by Propionibacterium freudenreichii. Lait 2002, 82, 17–32. [Google Scholar] [CrossRef] [Green Version]
- Bonke, A.; Sieuwerts, S.; Petersen, I.L. Amino acid composition of novel plant drinks from oat, lentil and pea. Foods 2020, 9, 429. [Google Scholar] [CrossRef] [Green Version]
- Iqbal, A.; Khalil, I.A.; Ateeq, N.; Sayyar Khan, M. Nutritional quality of important food legumes. Food Chem. 2006, 97, 331–335. [Google Scholar] [CrossRef]
- Mu, W.; Yu, S.; Zhu, L.; Zhang, T.; Jiang, B. Recent research on 3-phenyllactic acid, a broad-spectrum antimicrobial compound. Appl. Microbiol. Biotechnol. 2012, 95, 1155–1163. [Google Scholar] [CrossRef]
- Vermeulen, N.; Gánzle, M.G.; Vogel, R.F. Influence of peptide supply and cosubstrates on phenylalanine metabolism of Lactobacillus sanfranciscensis DSM20451T and Lactobacillus plantarum TMW1. J. Agric. Food Chem. 2006, 54, 3832–3839. [Google Scholar] [CrossRef]
- Von Wright, A.; Axelsson, L. Lactic Acid Bacteria—An Introduction. In Lactic Acid Bacteria—Microbiological and Functional Aspects; Vinderola, G., Ouwehand, A.C., Salminen, S., von Wright, A., Eds.; CRC Press: Boca Raton, FL, USA, 2019; pp. 1–17. ISBN 9780815366485. [Google Scholar]
- Wagner, N.; Tran, Q.H.; Richter, H.; Selzer, P.M.; Unden, G. Pyruvate fermentation by Oenococcus oeni and Leuconostoc mesenteroides and role of pyruvate dehydrogenase in anaerobic fermentation. Appl. Environ. Microbiol. 2005, 71, 4966–4971. [Google Scholar] [CrossRef] [Green Version]
- Laëtitia, G.; Pascal, D.; Yann, D. The Citrate Metabolism in Homo- and Heterofermentative LAB: A Selective Means of Becoming Dominant over Other Microorganisms in Complex Ecosystems. Food Nutr. Sci. 2014, 5, 953–969. [Google Scholar] [CrossRef] [Green Version]
- Gänzle, M.G. Lactic metabolism revisited: Metabolism of lactic acid bacteria in food fermentations and food spoilage. Curr. Opin. Food Sci. 2015, 2, 106–117. [Google Scholar] [CrossRef]
- Budinich, M.F.; Perez-Díaz, I.; Cai, H.; Rankin, S.A.; Broadbent, J.R.; Steele, J.L. Growth of Lactobacillus paracasei ATCC 334 in a cheese model system: A biochemical approach. J. Dairy Sci. 2011, 94, 5263–5277. [Google Scholar] [CrossRef] [Green Version]
- Díaz-Muñiz, I.; Banavara, D.S.; Budinich, M.F.; Rankin, S.A.; Dudley, E.G.; Steele, J.L. Lactobacillus casei metabolic potential to utilize citrate as an energy source in ripening cheese: A bioinformatics approach. J. Appl. Microbiol. 2006, 101, 872–882. [Google Scholar] [CrossRef]
- Herve-Jimenez, L.; Guillouard, I.; Guedon, E.; Boudebbouze, S.; Hols, P.; Monnet, V.; Maguin, E.; Rul, F. Postgenomic analysis of Streptococcus thermophilus cocultivated in milk with Lactobacillus delbrueckii subsp. bulgaricus: Involvement of nitrogen, purine, and iron metabolism. Appl. Environ. Microbiol. 2009, 75, 2062–2073. [Google Scholar] [CrossRef] [Green Version]
- Tanous, C.; Kieronczyk, A.; Helinck, S.; Chambellon, E.; Yvon, M. Glutamate dehydrogenase activity: A major criterion for the selection of flavour-producing lactic acid bacteria strains. Antonie Van Leeuwenhoek Int. J. Gen. Mol. Microbiol. 2002, 82, 271–278. [Google Scholar] [CrossRef]
- Yvon, M.; Rijnen, L. Cheese flavour formation by amino acid catabolism. Int. Dairy J. 2001, 11, 185–201. [Google Scholar] [CrossRef]
- Chen, C.; Zhao, S.; Hao, G.; Yu, H.; Tian, H.; Zhao, G. Role of lactic acid bacteria on the yogurt flavour: A review. Int. J. Food Prop. 2017, 20, S316–S330. [Google Scholar] [CrossRef] [Green Version]
- Cui, Y.; Miao, K.; Niyaphorn, S.; Qu, X. Production of gamma-aminobutyric acid from lactic acid bacteria: A systematic review. Int. J. Mol. Sci. 2020, 21, 995. [Google Scholar] [CrossRef] [Green Version]
- Savage, K.; Firth, J.; Stough, C.; Sarris, J. GABA-modulating phytomedicines for anxiety: A systematic review of preclinical and clinical evidence. Phyther. Res. 2018, 32, 3–18. [Google Scholar] [CrossRef]
- Soltani, N.; Qiu, H.; Aleksic, M.; Glinka, Y.; Zhao, F.; Liu, R.; Li, Y.; Zhang, N.; Chakrabarti, R.; Ng, T.; et al. GABA exerts protective and regenerative effects on islet beta cells and reverses diabetes. Proc. Natl. Acad. Sci. USA. 2011, 108, 11692–11697. [Google Scholar] [CrossRef] [Green Version]
- Shimada, M.; Hasegawa, T.; Nishimura, C.; Kan, H.; Kanno, T.; Nakamura, T.; Matsubayashi, T. Anti-hypertensive effect of γ-aminobutyric acid (GABA)-rich chlorella on high-normal blood pressure and borderline hypertension in placebo-controlled double blind study. Clin. Exp. Hypertens. 2009, 31, 342–354. [Google Scholar] [CrossRef]
- Moore, J.F.; DuVivier, R.; Johanningsmeier, S.D. Formation of γ-aminobutyric acid (GABA) during the natural lactic acid fermentation of cucumber. J. Food Compos. Anal. 2021, 96, 103711. [Google Scholar] [CrossRef]
- Rizzello, C.G.; Cassone, A.; Di Cagno, R.; Gobbetti, M. Synthesis of angiotensin I-converting enzyme (ACE)-inhibitory peptides and γ-aminobutyric acid (GABA) during sourdough fermentation by selected lactic acid bacteria. J. Agric. Food Chem. 2008, 56, 6936–6943. [Google Scholar] [CrossRef]
- Cadena, R.S.; Caimi, D.; Jaunarena, I.; Lorenzo, I.; Vidal, L.; Ares, G.; Deliza, R.; Giménez, A. Comparison of rapid sensory characterization methodologies for the development of functional yogurts. Food Res. Int. 2014, 64, 446–455. [Google Scholar] [CrossRef] [Green Version]
- Berardy, A.; Costello, C.; Seager, T.P. Life Cycle Assessment of Soy Protein Isolate. In Proceedings of the International Symposium on Sustainable Systems and Technologies, Dearborn, MI, USA, 18–20 May 2015; Volume 3. [Google Scholar] [CrossRef]


| Moisture (%) | 5.9 ± 0.1 | AACC Method 44-17.01 |
| Protein content (% DM) | 74.94 ± 0.71 | Kjeldahl (Factor 6.25) |
| Fat (% DM) | 5.24 ± 0.16 | Soxhlet |
| Ash (% DM) | 6.55 ± 0.04 | AACC Method 08-01.01 |
| Solubility (%) 1 | 63.26 ± 1.46 | Kjeldahl |
| Species | Leuconostoc citreum | Leuconostoc pseudomesenteroides | Lacticasei- bacillus paracasei | Control: Streptococcus thermophilus |
|---|---|---|---|---|
| Strain | TR116 | MP070 | FST6.1 | YOFLEX® YF-L01 DA 1 |
| Metabolism | Hetero- fermentative | Hetero- fermentative | Homo- fermentative | Homo- fermentative |
| Carbon source | Fructose | Fructose | Fructose | Sucrose |
| Incubation | 30 °C | 30 °C | 30 °C | 42 °C |
| Source | Yellow pea sourdough | Kombucha | Water kefir | - |
| Special Traits | Antifungal compounds & mannitol producer | Antifungal compounds & mannitol producer | Dairy flavor producer | Marketed for fermentation of dairy alternatives |
| LcTR116 | LpMP070 | Lbp6.1 | Yoflex | Unfermented (Fructose) | Unfermented (Sucrose) | |
|---|---|---|---|---|---|---|
| Fermentation parameters | ||||||
| T0 (CFU × 107/g) | 1.37 ± 0.40 ab | 1.12 ± 0.09 a | 1.22 ± 0.24 ab | 1.66 ± 0.27 b | n.d. 1 | n.d. 1 |
| T12 (CFU × 107/g) | 111.85 ± 13.24 b | 368.89 ± 140.63 a | 45.03 ± 11.04 c | 27.07 ± 9.02 d | n.d. 1 | n.d. 1 |
| pH | 4.31 ± 0.01 bc | 4.10 ± 0.01 a | 4.41 ± 0.06 b | 4.12 ± 0.02 cd | 6.89 ± 0.10 a | 6.95 ± 0.12 a |
| TTA (mL/g) | 0.64 ± 0.01 b | 0.86 ± 0.07 a | 0.39 ± 0.02 d | 0.49 ± 0.01 c | 0.09 ± 0.01 e | 0.08 ± 0.02 e |
| Lactic acid (g/kg) | 3.36 ± 0.03 c | 3.63 ± 0.03 b | 3.68 ± 0.03 b | 4.58 ± 0.05 a | n.d. 2 | n.d. 2 |
| Acetic acid (g/kg) | 1.70 ± 0.06 b | 1.90 ± 0.02 a | n.d. 2 | n.d. 2 | n.d. 2 | n.d. 2 |
| Color parameters | ||||||
| L* | 77.84 ± 0.06 b | 78.00 ± 0.15 b | 77.73 ± 0.07 c | 78.28 ± 0.03 a | 74.45 ± 0.20 d | 74.34 ± 0.04 d |
| a* | 5.54 ± 0.06 a | 5.55 ± 0.07 a | 5.84 ± 0.11 b | 5.21 ± 0.06 ac | 5.30 ± 0.34 a | 6.37 ± 0.02 d |
| b* | 4.89 ± 0.08 a | 5.16 ± 0.25 abd | 5.42 ± 0.08 b | 6.47 ± 0.03 c | 5.18 ± 0.26 abd | 5.30 ± 0.01 d |
| WI | 76.64 ± 0.05 a | 76.73 ± 0.09 ac | 76.35 ± 0.09 b | 76.74 ± 0.05 c | 73.40 ± 0.24 d | 73.04 ± 0.03 e |
| LcTR116 | LpMP070 | Lbp6.1 | Yoflex | |
|---|---|---|---|---|
| Gel point (min) | 212.8 ± 1.0 c | 306.1 ± 5.4 b | 328.3 ± 16.5 a | 100.7 ± 8.3 d |
| ΔG′ (%) | 29.80 ± 2.44 c | 26.37 ± 2.69 d | 36.55 ± 2.41 b | 43.52 ± 1.52 a |
| Δ″ (%) | 38.21 ± 2.71 c | 40.72 ± 2.45 c | 45.09 ± 2.12 b | 53.15 ± 1.80 a |
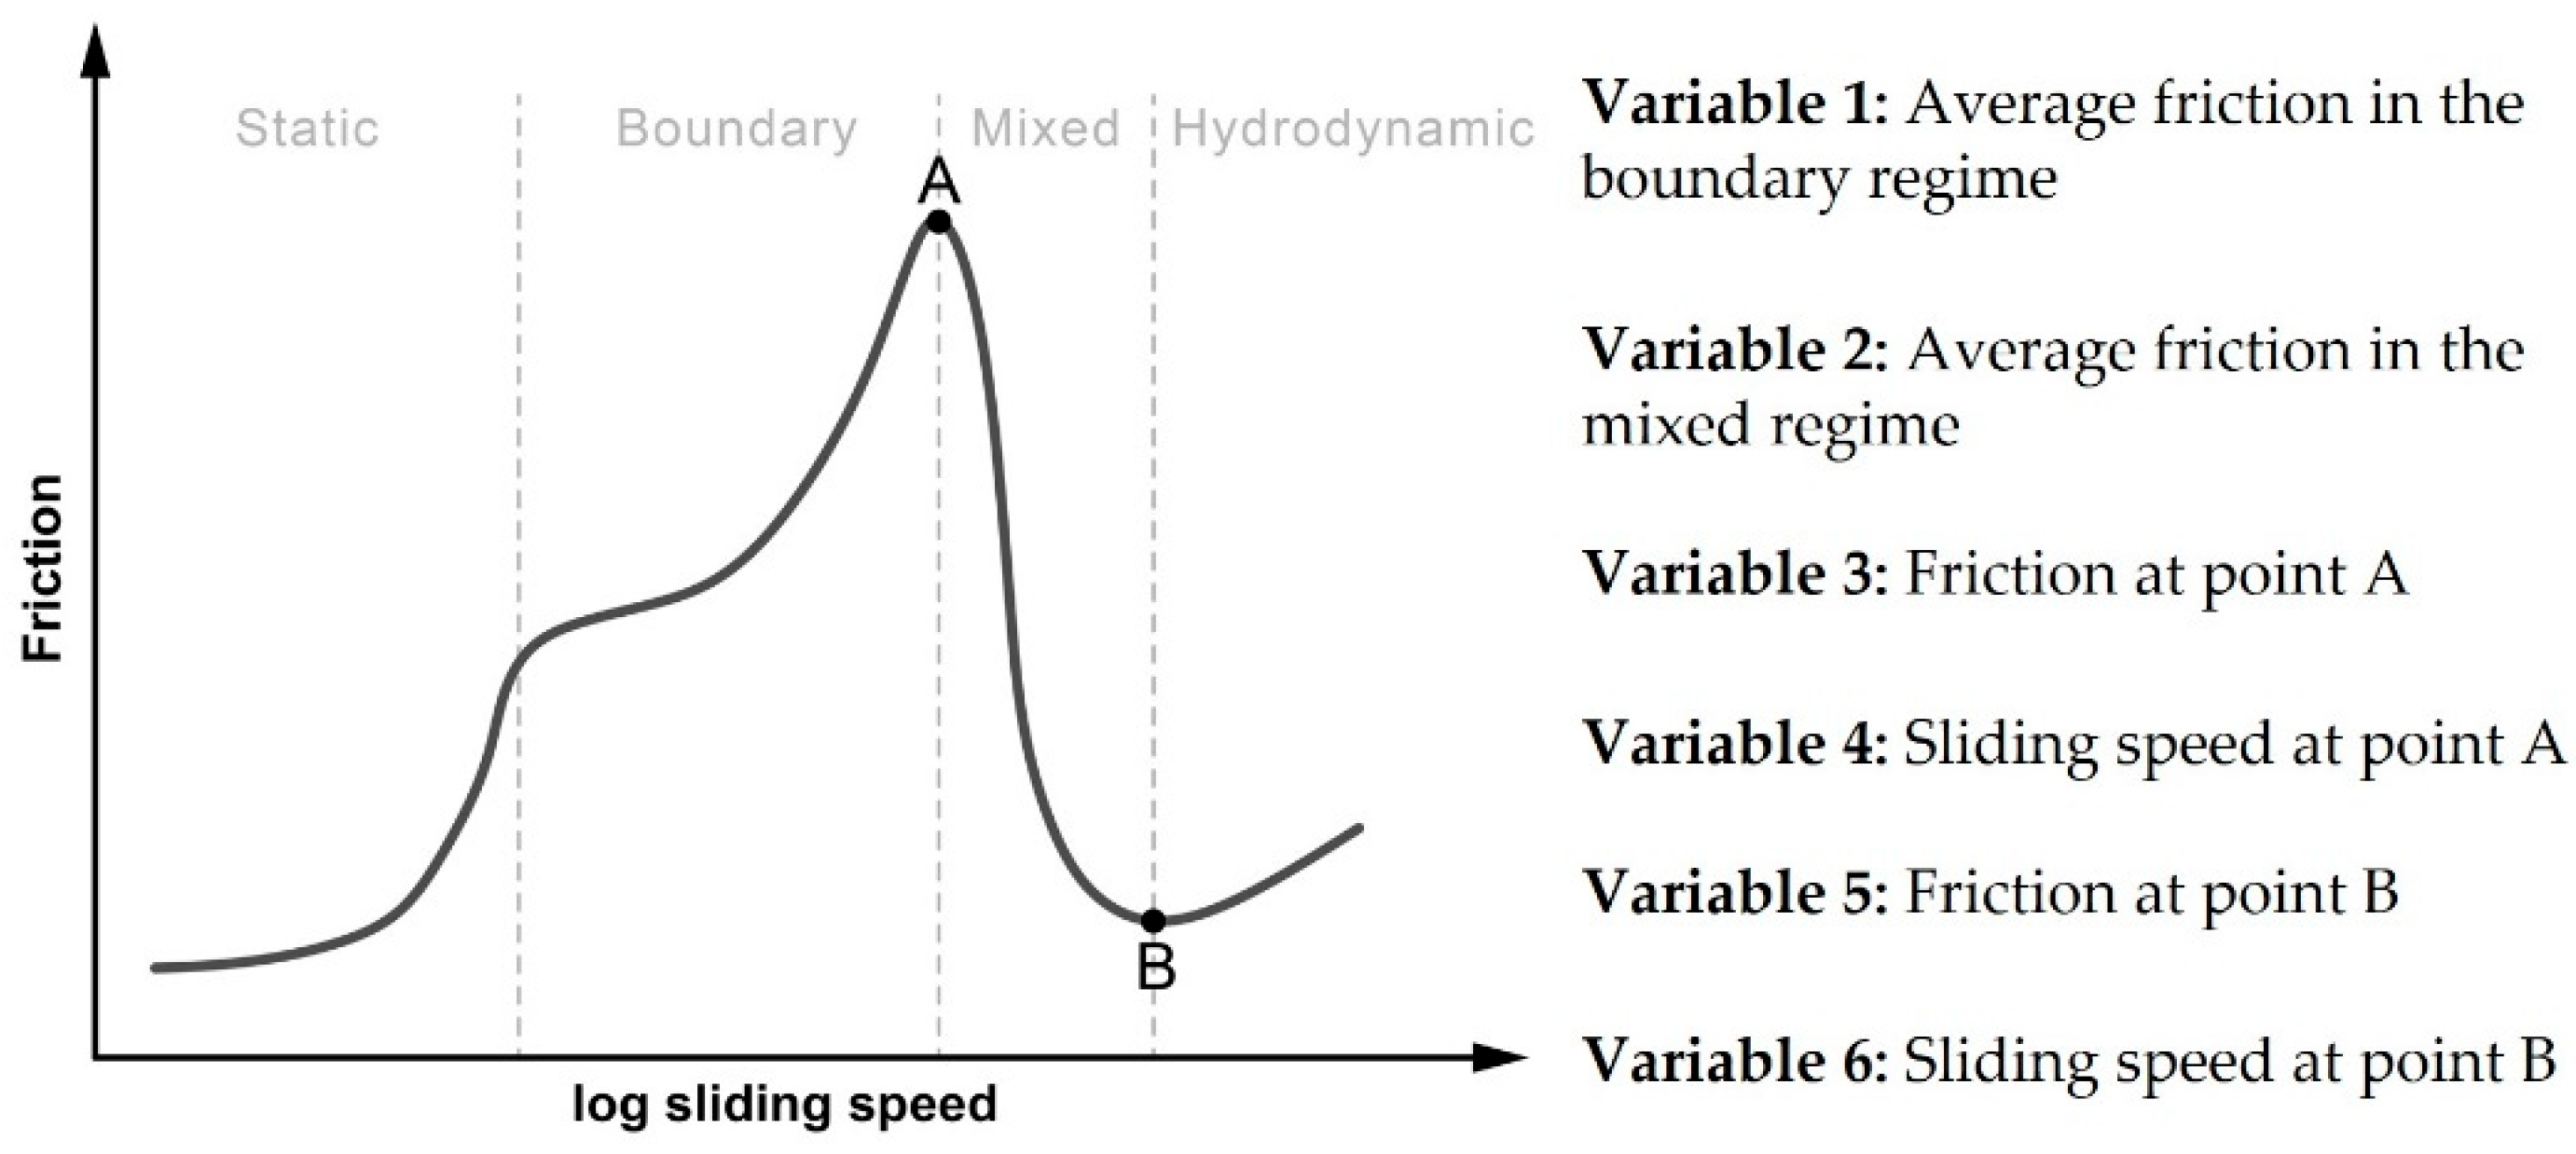
| Var 4 (m/s) * | 0.018 ± 0.003 a | 0.023 ± 0.007 ab | 0.009 ± 0.000 b | 0.020 ± 0.004 ab |
| Var 5 (-) * | 0.018 ± 0.001 a | 0.018 ± 0.001 a | 0.013 ± 0.001 b | 0.020 ± 0.001 a |
| Var 6 (m/s) * | 0.751 ± 0.205 ab | 0.633 ± 0.000 a | 0.406 ± 0.036 b | 0.633 ± 0.000 a |
| Mono-/Disaccharides A | Polyols | Oligosaccharides B | Sucrose | ||||
|---|---|---|---|---|---|---|---|
| Glucose | Fructose | EF C | Mannitol | Raffinose/ Stachyose | Verbascose | ||
| UfF D | 0.05 ± 0.00 a | 4.55 ± 0.05 a | 4.50 a | n.d. | 0.10 ± 0.00 a | 0.05 ± 0.00 ab | 0.07 ± 0.00 c |
| UfS E | 0.04 ± 0.00 b | n.d. | - | n.d. | 0.010 ± 0.00 a | 0.05 ± 0.00 ab | 4.60 ± 0.05 a |
| LcTR116 | n.d. | 3.42 ± 0.05 c | 3.41 c | 0.66 ± 0.02 b | 0.05 ± 0.00 b | 0.05 ± 0.00 ab | n.d. |
| LpMP070 | n.d. | 3.51 ± 0.02 c | 3.49 c | 0.81 ± 0.01 a | 0.10 ± 0.00 a | 0.04 ± 0.00 ab | n.d. |
| Lbp6.1 | n.d. | 4.29 ± 0.02 b | 4.27 b | n.d. | 0.10 ± 0.00 a | 0.05 ± 0.00 a | 0.07 ± 0.00 c |
| Yoflex | 0.03 ± 0.00 b | 0.06 ± 0.00 c | 0.03 d | n.d. | 0.10 ± 0.00 a | 0.04 ± 0.00 b | 4.25 ± 0.02 b |
| Unfermented (Fructose) | Unfermented (Sucrose) | LcTR116 | LpMP070 | Lbp6.1 | Yoflex | |
|---|---|---|---|---|---|---|
| Phenyllactic acid | n.d. | n.d. | 5.52 ± 0.21 b | 8.28 ± 1.05 a | 4.40 ± 2.14 b | 1.55 ± 0.46 c |
| Coumaric acid | 0.27 ± 0.04 c | 0.34 ± 0.01 c | 0.55 ± 0.01 b | 0.66 ± 0.09 a | 0.51 ± 0.05 b | 0.49 ± 0.01 b |
| Salicylic acid | 0.20 ± 0.03 c | 0.24 ± 0.01 c | 0.62 ± 0.06 a | 0.57 ± 0.07 a | 0.41 ± 0.06 b | 0.36 ± 0.04 b |
| Benzoic acid | 0.14 ± 0.04 b | 0.18 ± 0.01 b | 0.27 ± 0.02 a | 0.25 ± 0.03 a | 0.17 ± 0.05 b | 0.09 ± 0.01 c |
| 4-Hydroxybenzoic acid | 0.25 ± 0.04 e | 0.28 ± 0.00 de | 0.39 ± 0.01 ab | 0.42 ± 0.05 a | 0.35 ± 0.03 bc | 0.33 ± 0.01 cd |
| Vanillic acid | 0.10 ± 0.02 b | 0.10 ± 0.00 ab | 0.01 ± 0.00 c | 0.02 ± 0.00 c | 0.02 ± 0.00 c | 0.13 ± 0.03 a |
| LcTR116 | LpMP070 | Lbp6.1 | Yoflex | |
|---|---|---|---|---|
| Odor: Overall intensity | 4.3 ± 1.8 ab | 3.2 ± 2.1 b | 5.5 ± 1.5 a | 5.9 ± 2.1 a |
| Odor: Yogurt-like | 2.4 ± 1.5 b | 2.1 ± 1.0 b | 5.2 ± 2.2 a | 5.9 ± 2.6 a |
| Flavor: Overall intensity | 6.2 ± 1.2 ab | 6.3 ± 1.4 a | 5.2 ± 1.7 ab | 4.8 ± 1.3 b |
| Sourness | 5.4 ± 1.2 b | 7.1 ± 1.3 a | 2.6 ± 1.5 c | 4.1 ± 1.6 bc |
| Bitterness | 4.2 ± 2.1 a | 3.8 ± 2.2 a | 2.4 ± 2.0 a | 2.9 ± 1.8 a |
| Beany flavor | 4.4 ± 2.3 a | 4.5 ± 1.7 a | 6.1 ± 2.1 a | 4.7 ± 2.2 a |
| Yogurt-like flavor | 2.9 ± 1.3 b | 2.9 ± 1.4 b | 5.3 ± 2.0 a | 5.7 ± 2.0 a |
| Sour cream-like flavor | 4.5 ± 2.3 ab | 4.8 ± 2.2 a | 2.5 ± 2.0 b | 3.7 ± 2.4 ab |
| Mouthfeel: Firmness | 3.9 ± 2.0 a | 3.9 ± 1.8 a | 3.3 ± 1.8 a | 3.8 ± 1.9 a |
| Mouthfeel: Smoothness | 5.7 ± 1.7 a | 5.8 ± 1.6 a | 6.0 ± 2.2 a | 6.4 ± 1.9 a |
| Aftertaste | 5.9 ± 1.9 a | 6.2 ± 1.7 a | 4.5 ± 2.0 ab | 3.6 ± 1.6 b |
| Overall acceptability | 3.7 ± 2.1 b | 3.4 ± 1.7 b | 5.0 ± 1.9 ab | 6.7 ± 1.3 a |
Publisher’s Note: MDPI stays neutral with regard to jurisdictional claims in published maps and institutional affiliations. |
© 2022 by the authors. Licensee MDPI, Basel, Switzerland. This article is an open access article distributed under the terms and conditions of the Creative Commons Attribution (CC BY) license (https://creativecommons.org/licenses/by/4.0/).
Share and Cite
Boeck, T.; Ispiryan, L.; Hoehnel, A.; Sahin, A.W.; Coffey, A.; Zannini, E.; Arendt, E.K. Lentil-Based Yogurt Alternatives Fermented with Multifunctional Strains of Lactic Acid Bacteria—Techno-Functional, Microbiological, and Sensory Characteristics. Foods 2022, 11, 2013. https://doi.org/10.3390/foods11142013
Boeck T, Ispiryan L, Hoehnel A, Sahin AW, Coffey A, Zannini E, Arendt EK. Lentil-Based Yogurt Alternatives Fermented with Multifunctional Strains of Lactic Acid Bacteria—Techno-Functional, Microbiological, and Sensory Characteristics. Foods. 2022; 11(14):2013. https://doi.org/10.3390/foods11142013
Chicago/Turabian StyleBoeck, Theresa, Lilit Ispiryan, Andrea Hoehnel, Aylin W. Sahin, Aidan Coffey, Emanuele Zannini, and Elke K. Arendt. 2022. "Lentil-Based Yogurt Alternatives Fermented with Multifunctional Strains of Lactic Acid Bacteria—Techno-Functional, Microbiological, and Sensory Characteristics" Foods 11, no. 14: 2013. https://doi.org/10.3390/foods11142013