Article

Influence of Ultrasound Application in Fermented Pineapple Peel on Total Phenolic Content and Antioxidant Activity

by
Anna María Polanía
1,*,
Liliana Londoño
2,
Cristina Ramírez
1 and
German Bolívar
1
1
MIBIA Group, Biology Department, Faculty of Natural and Exact Sciences, Universidad del Valle, Cali 760031, Colombia
2
BIOTICS Group, School of Basic Sciences, Technology and Engineering, Universidad Nacional Abierta y a Distancia-UNAD, Palmira 763531, Colombia
*
Author to whom correspondence should be addressed.
Fermentation 2022, 8(7), 314; https://doi.org/10.3390/fermentation8070314
Submission received: 25 May 2022 / Revised: 27 June 2022 / Accepted: 29 June 2022 / Published: 30 June 2022

Abstract

:
Antioxidant phenolic compounds were extracted from fermented samples of Golden pineapple peels via an ultrasound method. The fermentation conditions to maximize the production of phenolic content and antioxidant activity were previously determined (pH: 5.5, T: 37.3 °C and 85% moisture content). A central composite design with 20 treatments was applied to evaluate the effect of the ethanol concentration, time, and temperature on the production of phenolic compounds and antioxidant activity of the extracts. The statistical analysis showed that the optimal conditions to produce extracts with high phenolic content and antioxidant activity were: 62 °C, 30 min and 58% ethanol. We obtained 866.26 mg gallic acid equivalents (GAE)/g d.m in total phenolic content and for antioxidant activity expressed as percentage inhibition, 80.06 ± 1.02% for ABTS and 63.53 ± 2.02% for DPPH, respectively. The bioactive compound profile in the extracts was identified and quantified using ultra-high performance liquid chromatography (UHPLC), this method showed the presence of rosmarinic acid, caffeic acid, vanillic acid, p-coumaric acid, ferulic acid, quercetin-3 glucoside, rutine, quercetin, kaempherol-3 glucoside and gallic acid, demonstrating the great potential of these by-products to obtain components that can benefit the consumer’s health.

1. Introduction

The use of agro-industrial wastes to produce bioactive compounds has been studied in recent years [1,2,3]. Due to the lignocellulosic composition of these substrates, they can be used as sources of macro or micronutrients, and as sources of carbon and nitrogen in fermentation processes [4].
Pineapple (Ananas comosus) is one of the most consumed fruits worldwide, its world production was estimated at 25.4 million metric tons in 2019 [5]. The wastes generated during the processing of pineapple are mainly peels, cores and crowns, which represent 45–65% of the total weight of the fruit [6]. It has been reported that during the commercial production of pineapple juice, wastes comprising mostly peels and cores, are generated at around 20–40% [7]. The production is focused in Asia and the Americas, specifically in Costa Rica, the Philippines, Brazil, China, and Colombia [8]. In recent years in Colombia, the area planted for pineapple crops has grown by 49%, from 22,000 hectares in 2014 to 32,736 hectares in 2018. Likewise, production has increased by 62%, from 652,759 tons to 1,058,109 tons in 2018 [9]. Particularly in Colombia, by-products generated from crops are usually kept and used as ruminant animal feed. Also, the fruit crowns are used as an alternative feed for growing dairy cattle [10].
The importance of bioactive compounds presents in pineapple by-products (catechin, epicatechin, gallic acid, ferulic acid, among others), could be attributed to the fact that they represent a potential source of functional food ingredients, natural antimicrobials, and antioxidants that exhibit health benefits [11]. Catechin, kampferol and quercetin are polyphenolic compounds that have been widely studied to reduce the risk of chronic diseases such as diabetes, obesity, cardiovascular disease and cancer [12]. In this way, the nutritional composition of these by-products has been used to develop ingredients of higher added value, as several studies had reported the potential of pineapple peels to produce bacterial cellulose, bromelain production, bioethanol, biohydrogen, biogas and polyphenols [13,14,15].
Research conducted in recent years evidence the development of more environmentally friendly alternatives for the extraction of these compounds, in which microwave-assisted extraction, pulsed electric fields, supercritical fluids, ultrasound-assisted extraction, among others, stand out. Compared to the conventional methods, such as Soxhlet and maceration, these emerging technologies can significantly increase yields, improving efficiency, reducing solvent and energy consumption, etc. [16].
Solid-state fermentation (SSF) is a promising alternative to increase the bioavailability of bioactive compounds, such as gallic, ellagic, citric, lactic, gluconic acid, among others, from lignocellulosic residues [17,18]. In recent years organic materials such as Castilla Rose (Purshia plicata), aqueous extracts of wood bio treated with Ceriporiopsis subvermispora and Grape stalks, which have a high lignocellulosic content, have been used as substrates in the SSF. When Castilla Rose is used, it is possible to obtain different functional compounds such as ellagitannins, flavonols, catechins, hydroxycinnamic acids; from grape stalks it is possible to obtain phenolic-oxidizing enzymes such as peroxidases; and finally, from bio-treated wood, several water-soluble phenols are obtained, that exert antioxidant or pro-oxidant effects, converting H2O2 into OH radicals [3,19,20]. In addition, the microorganisms involved in the fermentation process produce enzymes, helping with the extraction and release of these bioactive compounds; and those compounds can also be produced via secondary metabolic pathways [21]. The SSF has been employed as a suitable strategy to improve the synthesis of microbial metabolites with biological properties using different substrates to obtain various functional benefits such as anti-diabetic, antihypertensive and antioxidant activities [22,23].
Rhizopus oryzae has been used in the industry because it is capable of synthesizing a wide variety of products such as organic acids (lactic and fumaric acids), volatile compounds and enzymes (cellulases, proteases, tannases, xylanases, pyruvate decarboxylases, lipases, etc.). Several characteristics make this genus interesting for mass application in the biotechnology industry, such as a wide growth temperature and pH range (25 to 45 °C) and (4.5 to 7.5), respectively. In addition, these species are categorized as GRAS (Generally Recognized as Safe) according to the Food and Drug Administration of the United States government, since there are no reports of them being mycotoxin producers; this classification is very desirable when working with animal and human food [24]. Many studies have been reported showing that Rhizopus oryzae is a microorganism that increases the bioactive compounds present in the substrate and has potential for other biotechnological processes [25,26,27].
On the other hand, ultrasound offers some advantages, such as: shorter contact time between the sample and the solvent, thus generating a faster process; a greater incidence of the solvent inside the cell wall, which provides a higher yield and reproducibility of the compounds obtained; among others [28]. One of the reasons why this method is efficient is attributed to the cavitation process, which generates and propagates ultrasonic waves combined with changes in pressure and temperature, leading to the rupture of the cell walls and thus releasing the cell contents into the medium [29]. There have been studies reporting the benefits of combining these two technologies, for example, Sabers et al. [30] applied ultrasound to lignocellulosic biomass obtained from wheat grains before fermentation processes with microorganisms (Phanerochaete chrysosporium or Trametes sp.). This synergy increased the concentration of lignin degradation products (guaiacol and syringol) and the in vitro digestibility of wheat grain also improved. Leite et al. [31] applied ultrasound as a pre-treatment on olive pomace with the aim of using this substrate in a solid-state fermentation process with Aspergillus niger and evaluated if there was an increase in the production of xylanase and cellulase. Their results showed a positive effect in the production of xylanase (3.6-fold increase) and cellulase (1.2-fold increase). According to these results, the objective of this work was to evaluate the synergistic effect of both technologies, but in a different order than usually employed, i.e., the solid-state fermentation process with Rhizopus oryzae was performed first in pineapple peels of the Golden variety and then an ultrasound-assisted extraction was applied. Finally, the total phenolic content and antioxidant activity of the obtained extracts were evaluated and determined.

2. Materials and Methods

2.1. Raw Material (Fermented Peels)

Pineapple peels were provided by the IDEMA market plaza located in the city of Cali (Colombia); the samples were obtained at maturity grade 3 as reported in the NTC 729 (Colombian technical standard). The peel was previously washed and cut into 5 ± 1 mm2 pieces, next the samples were dehydrated at 50 °C for 24 h, after this process the particle size of the samples ranged from 2.35–2.80 mm. The SSF process was realized in sterile aluminum trays of 12 × 10 × 4 cm in size, in which 15 g of peel was placed, keeping 1 cm of height per tray. The dehydrated peels were inoculated with Rhizopus oryzae spores (1.8 × 10⁷ spores/g) at 85% moisture content (wet base), pH 5.5 and incubated in an oven at 37.3 °C for 24 h. These optimized conditions were determined in previous experimental designs, where different levels of temperature (30, 36 °C), pH (4.5, 6) and moisture content (60, 80%) were evaluated. In this central compound design (CCD), 8 cube points, 6 central points and 6 axial points with α = 1.68179 were considered, for a total of 20 treatments. Once the fermentation process was completed, the samples were dried at 50 °C (Universal Oven UN30 Memmert, Schwabach, Germany) for 24 h, to be used subsequently in the ultrasonic extraction process.

2.2. Ultrasound-Assisted Extraction Process

The extraction process was carried out in an ultrasonic bath (Transsonic 460/H, Elma, Germany) with a frequency of 35 kHz. The ultrasound-assisted extraction conditions were defined by means of a central compound design (CCD), evaluating two levels for each variable: ethanol concentration, temperature, and time. On the total phenolic content (TPC) and antioxidant activity by DPPH and ABTS (3 factors with 2 levels), 8 cube points, 6 central points and 6 axial points with α = 1.68179 were considered, for a total of 20 treatments. The conditions tested are shown in the Table 1. Preliminary tests were carried out to select the number and variation of levels of the process variables in the experimental design. Fermented samples were used in ratios (10:1 mL solvent/g solid sample) and three measurements were performed for each treatment for each response variable.

2.3. Scanning Electron Microscopy

The visualization of the superficial morphology of the fermented and unfermented peels was performed using a scanning electron microscope (Phenom Pro X, Thermo Scientific, Waltham, MA, USA). The peels were previously cut with a scalpel to obtain a transverse sample. Subsequently, they were placed on a support containing a platinum coating Auto-Fine Coater JFC-1600 (Jeol, USA Inc., Peabody, MA, USA). The images of the cross sections were obtained with an accelerating voltage of 15 kV.

2.4. Total Phenolic Content

The TPC was determined by a spectrophotometric method using the Folin-Ciocalteau reagent, described by Avella et al. [32]. For quantification, in a test tube, 500 μL of the diluted extract was mixed with 750 μL of Folin-Ciocalteau reagent (1 mol·L−1) in a ratio of 1:40, then shaken and left to stand for 5 min. Subsequently, 750 μL of sodium carbonate (0.01 mol·L−1) was added and left to stand for 5 min. The TPC was determined after 90 min of incubation at room temperature (30 °C). The absorbance of the resulting blue color was measured at 760 nm by colorimetry using a Model 2100 spectrophotometer (Unico®, Princeton, NJ, USA). A standard curve was performed using different concentrations of gallic acid (0–100 ppm).

2.5. Antioxidant Activity DPPH (2,2-Diphenyl-1-picrylhydrazyl)

The free radical elimination activity (DPPH) of the extracts was determined according to the methodology reported by Ballesteros et al. [33]. For which 100 µL of each extract were taken, 2900 µL of the DPPH solution were added, agitated in a vortex, and kept in the dark for 30 min. Subsequently, the absorbance was measured in a Model 2100 spectrophotometer (Unico®, Princeton, NJ, USA) at 517 nm. A standard curve was performed using different concentrations of Trolox. The radical scavenging activity (RSA) was calculated according to Equation (1).
R S A   % = A c A s A c × 100
where Ac is the absorbance of the control (reagent DPPH-methanol) and As is the absorbance of the sample (extract).

2.6. Antioxidant Capacity ABTS (2,2X-Azino-bis (3-ethylbenzothiazoline-6-sulfonic Acid)

For the determination of the ABTS antioxidant activity of the extracts, the methodology described by Mesa et al. (2015) was applied [34]. The preparation of the ABTS+ radical was carried out through oxidation of ABTS (7 mmol·L−1) with potassium persulfate (2.45 mmol·L−1), being left in the dark for 16 h before use. The ABTS+ solution was diluted with 80% methanol to obtain an absorbance of 0.70 ± 0.02 at 734 nm. For the samples, 100 μL of the extract were taken and 1800 μL of the methanolic ABTS+ solution was added. The absorbance of the samples was read exactly 30 min after initial mixture in a Model 2100 spectrophotometer (UnicoPrinceton, NJ, USA) at 734 nm. The calibration curve was developed using Trolox as a standard. The ABTS+ radical scavenging activity was calculated using Equation (2).
R S A   % = A 0 A t A 0 × 100
where A0 is the absorbance of the sample at the initial time and At is the absorbance of the sample at thirty minutes.

2.7. Identification of Bioactive Compounds by High Performance Liquid Chromatography (UHPLC)

The extracts obtained after the ultrasound-assisted extraction were centrifuged at 4000 rpm for 30 min (Hettich® ROTOFIX 32A, Tuttlingen, Germany),then the samples were filtered on 0.45 µm cellulose nitrate filters (Sartorious stedim biotech, Göttingen, Lower Saxony, Germany), the solvent was removed using a rotary evaporator (Rotavapor IKA RV-10, Staufen, Baden-Württemberg, Germany) at 40 °C for 2 h. The extracts were dissolved in 0.2% methanol: water mixture in formic acid (1:1), agitated (5 min) and sonicated (5 min), then injected into the ultra-high efficiency liquid chromatograph (UHPLC), Dionex Ultimate 3000 (Thermo Scientific, Sunnyvale, CA, USA), equipped with a binary gradient pump (HP G3400RS), an automatic sample injector (WPS 300TRS) and a thermostated column unit (TCC 3000, Sunnyvale, CA, USA). The LC-MS interface was electronebulization and the mass spectrometer was high resolution with an Obitrap ion current detection system operated in positive mode with a capillary voltage of 4.5 kV. A Hypersil GOLD Aq column (Thermo Scientific, Sunnyvale, CA, USA; 100 × 2.1 mm, 1.9 μm particle size) was used at 30 °C, the mobile phase was A: 0.2% ammonium formate aqueous solution and B: acetonitrile with 0.2% ammonium formate. The initial gradient condition was 100% A, changing linearly to 100% B (8 min); it was maintained for 4 min; the return to initial conditions in 1 min; the total run time was 13 min, with 3 min for post-run. The reference standards used were the xanthines: caffeine, theobromine and theophylline; the catechins: (±)-catechin (C), (-)-epigallocatechin gallate (EGCG), (-)-epicatechin (EC), (-)-epicateqin gallate (ECG), (-)-epigallocateqin (EGC); flavonoids: caffeic acid, p-coumaric acid, rosmarinic acid, quercetin, naringenin, luteolin, kaempferol, pinocembrin, apigenin; anthocyanins: cyanidin 3-rutinoside, pelargonidin 3-glucoside, quercetin 3-glucoside, these reagents were from Sigma-Aldrich.
The compound identification of the extracts was performed using the full scan acquisition mode and extraction of ionic currents (EIC) corresponding to the [M + H]+ of the compounds of interest, mass measurement with accuracy and precision of Δppm < 1 and using a standard solution-mix of the compounds (certified standard substances), for the quantification of the analytes of interest calibration curves were performed using the certified reference materials.

2.8. Statistical Analysis

The statistical analyses were performed with Minitab 2019 software. Pareto diagrams were realized to determine which parameters had the most influence on the response variables. Also, an analysis of variance (ANOVA) for each of the response variables was performed as well as contour plots to evaluate the behavior of each of the variables in the studied ranges. Finally, to determine the optimal conditions of the process, a desirability function (d) was applied, which is represented in different graphs.

3. Results and Discussion

3.1. Ultrasound-Assisted Extraction Process

Following the methodology described in Section 2.2, the ultrasound extraction was performed on the previously fermented samples. The results, according to the treatment for each of the variables studied, are presented in Table 2.
As seen in Table 2, the TPC was higher in samples that had ethanol-water solutions compared to those extracted with water or pure ethanol. This behavior can be attributed to the fact that alcohol-water mixtures allow a major extraction of bioactive compounds compared to the solvents individually [35]. According to the results, the highest value of TPC was obtained under the conditions (T: 62 °C, 30 min, 50% ethanol and a solvent to sample ratio of 10:1 mL ethanol/g solid sample), obtaining 779.92 mg GAE/g d.m, which reflects better results compared to conventional methodologies such as Soxhlet extraction and maceration [36]. It is also possible to observe that, as the temperature increased, the TPC and antioxidant activity also increased.
Ethanol was chosen as the extraction solvent because of its reported low toxicity and high ability to dissolve phenolic compounds [37]. Both solvents contributed to the extraction process, water acting as a swelling agent and ethanol, acting on the cell wall of the substrate [38]. The highest value obtained in the treatments performed (779.92 mg GAE/g d.m) was higher than that reported by [39] who performed ultrasound assisted extraction on the Merr variety of pineapple peels, obtaining under the optimal conditions (5 min; 50% ethanol: water; 65% amplitude; 35:1 mL/g liquid-solid) a value of 708.10 mg GAE/g d.m.
The increase in temperature had a positive influence on the antioxidant activity. This behavior is directly related to better extraction yields of the phenolic compounds since a rupture in the matrix bonds is generated, the solvent diffusion rate is increased as well as the solubility of the compounds and, additionally, there is a greater mass transfer, which reduces the viscosity and surface tension of the solvent [40]. Celli et al. [41] also concluded that higher antioxidant activities are obtained at medium-high temperatures.
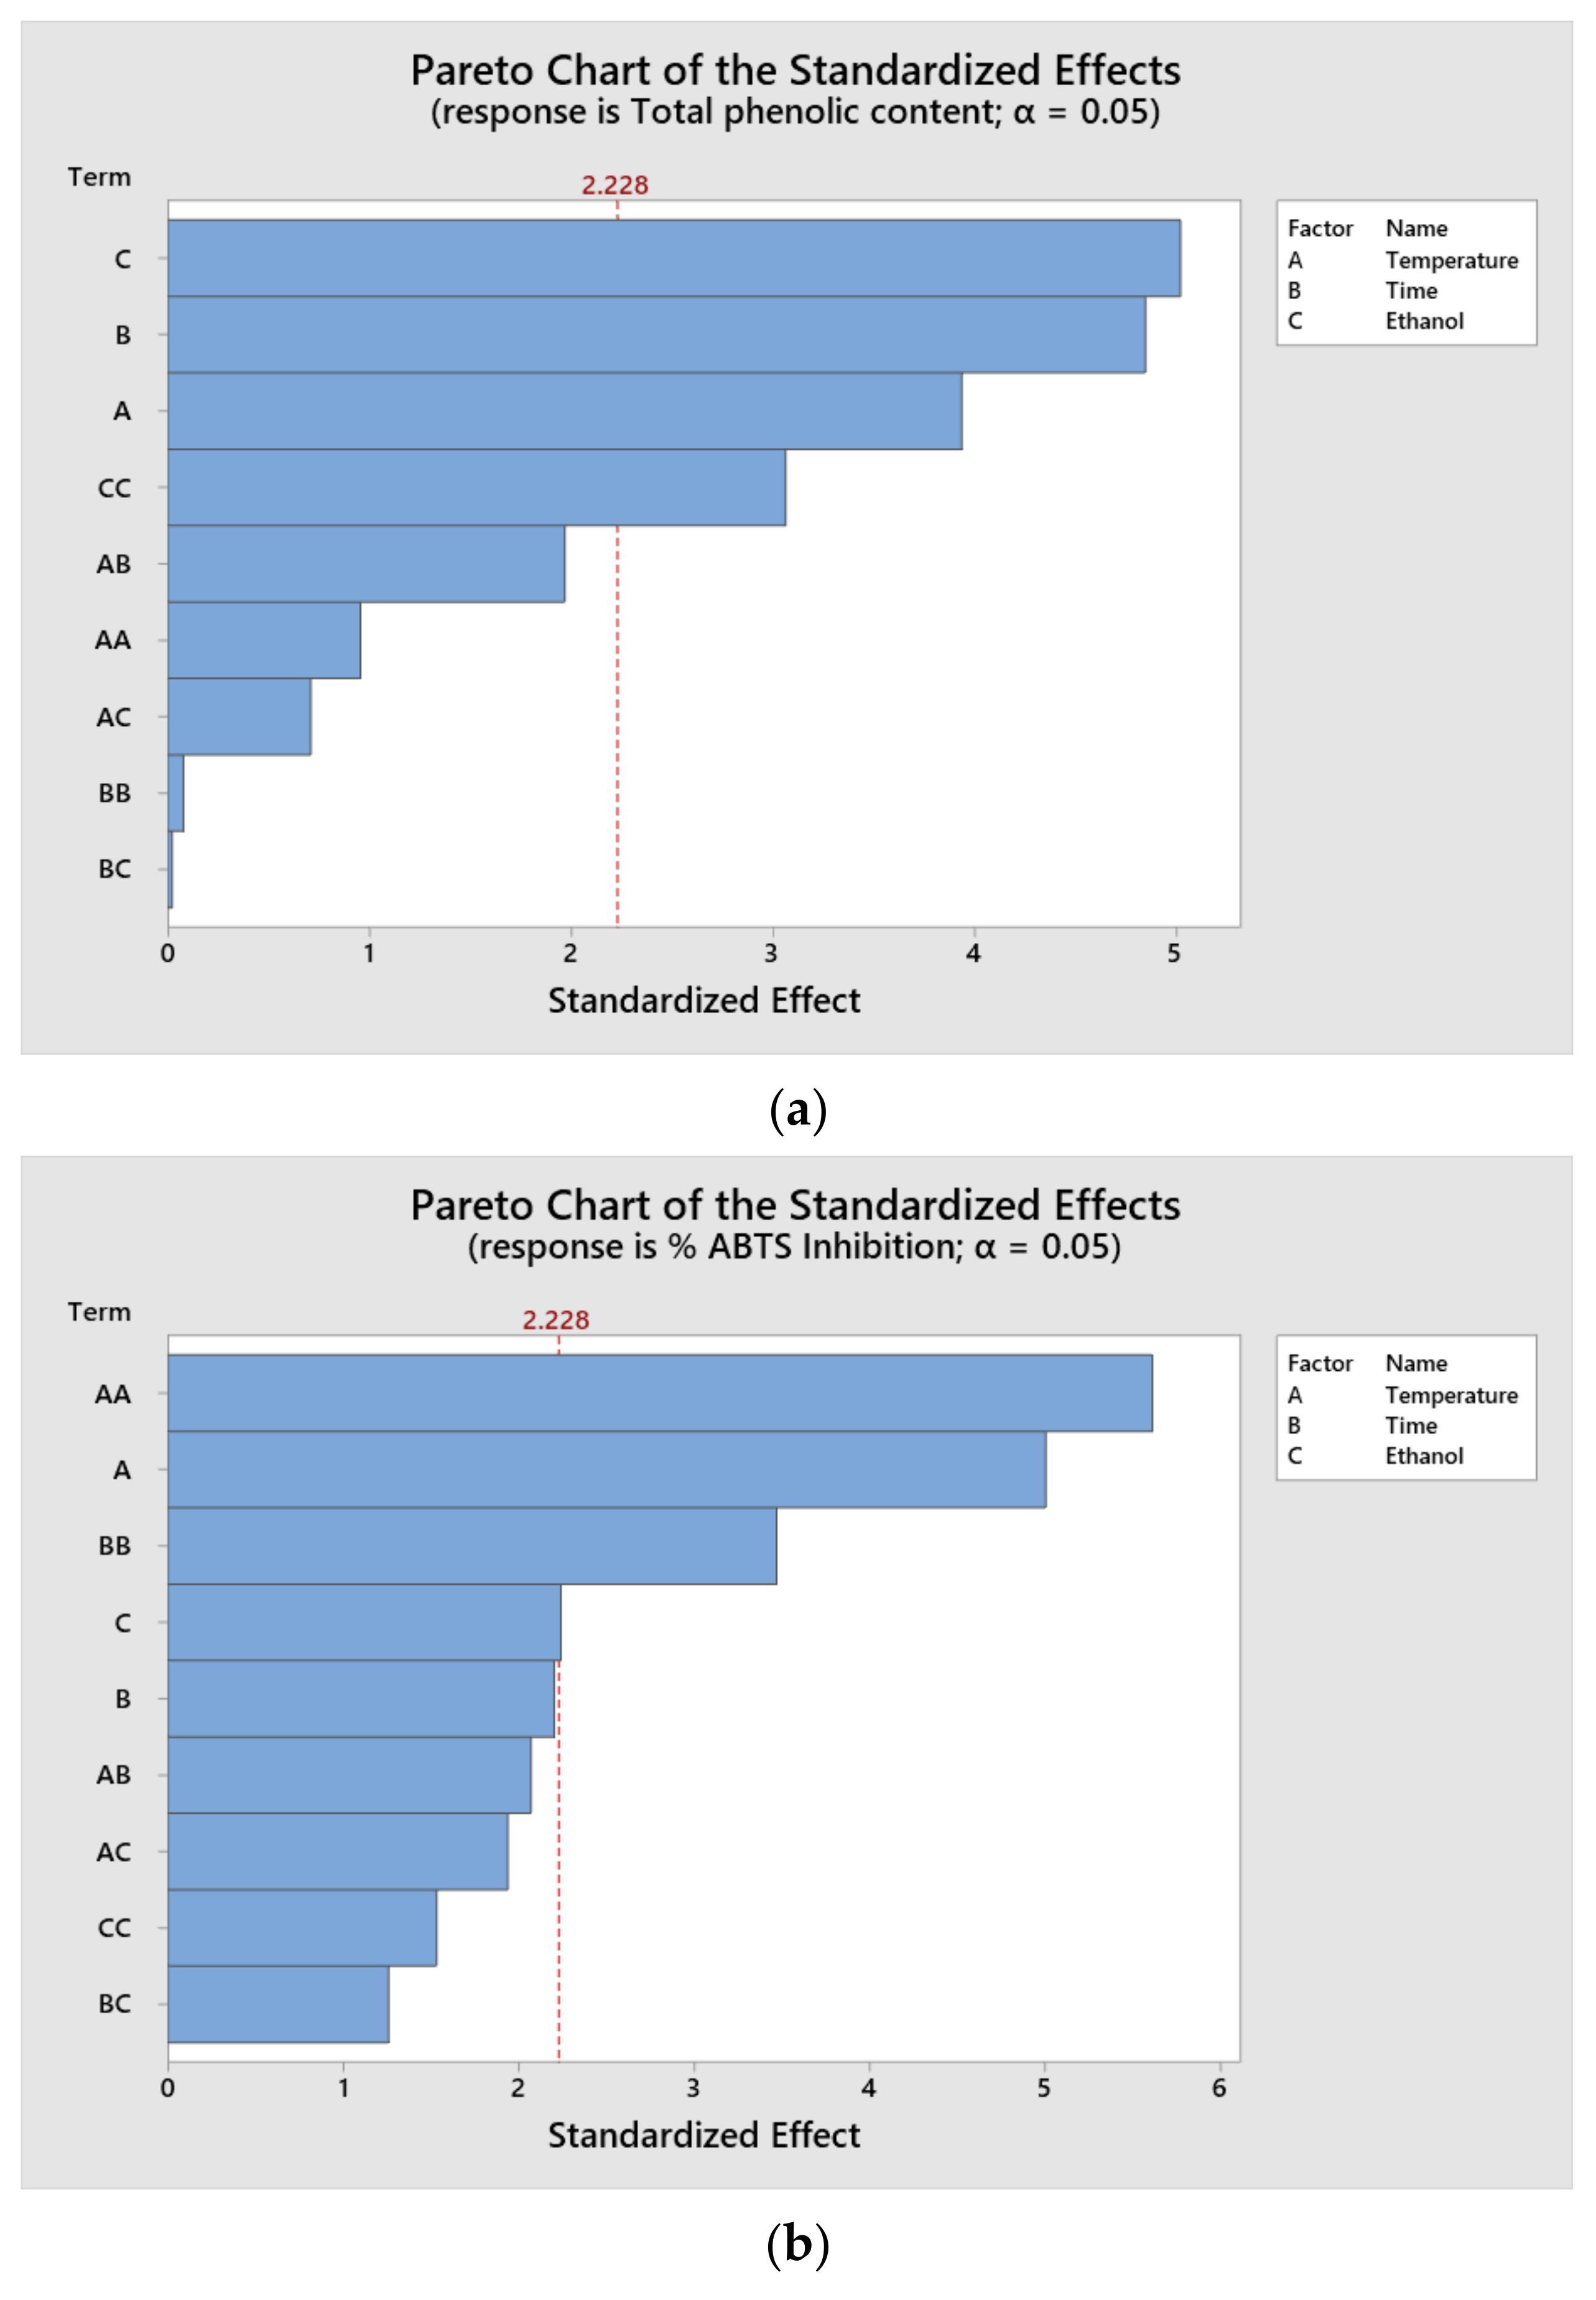
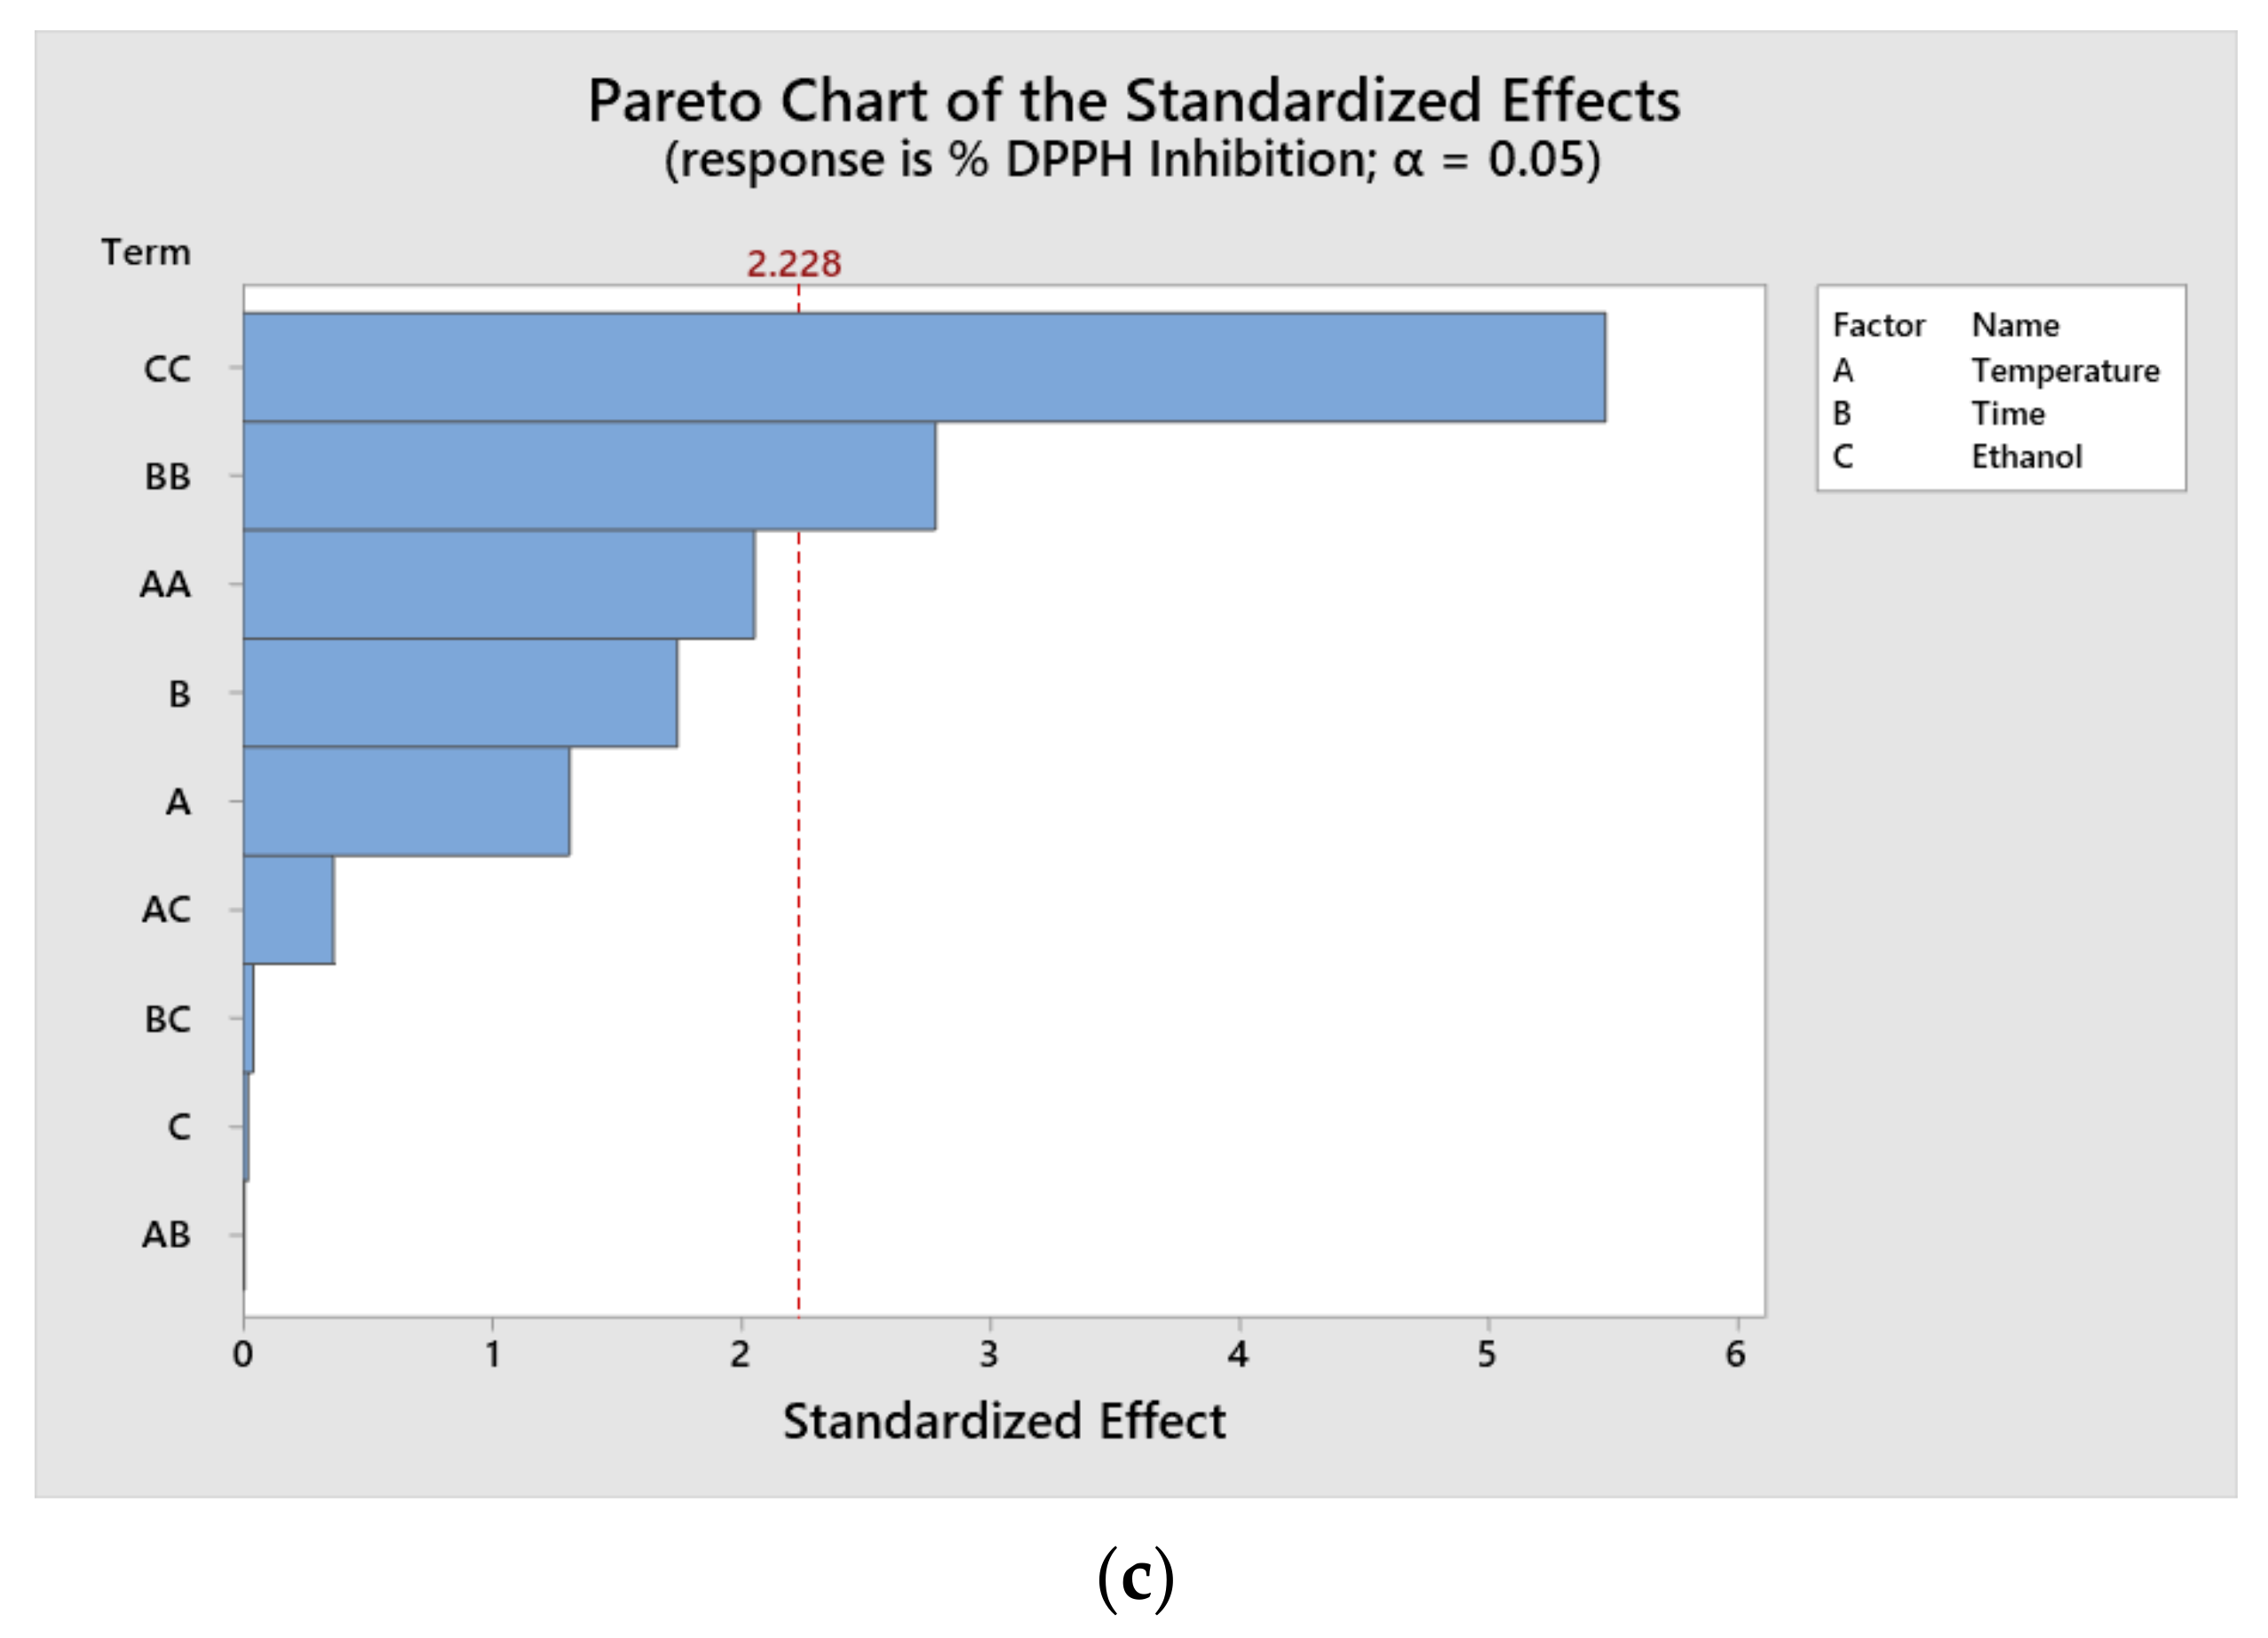
Pareto diagrams were plotted to determine which parameters had the greatest influence on the response variables of the treatments (Figure 1). The results indicate that the individual significant factors at a 95% confidence level were time, ethanol concentration and temperature for TPC; the quadratic terms of temperature and time for ABTS and the quadratic terms of time and ethanol for DPPH. It is important to consider that the relative influence of each parameter varies according to the nature of the extracted compound.
According to the results of the Pareto diagram, it is possible to appreciate that the values of TPC and ABTS were influenced by the time and temperature variables. It has been reported that, with an increase in the extraction time, it is possible to increase the extraction capacity for all of the components. In the case of the antioxidant capacity by DPPH, one of the most influential variables was the interaction with ethanol. This has a positive effect on extraction yields.
Time was one of the variables that positively influenced the increase in the TPC and ABTS, which can be explained as mass transfer is a time dependent process [41]. Regarding temperature, authors such as Gullón et al. [42] have evidenced that high temperatures favor the extraction efficiency of bioactive compounds due to the increase in acoustic cavitation, surface contact area and the decrease in viscosity and density of the solvent. Likewise, Palma et al. [41], who performed ultrasound extraction on Eucalyptus globulus leaves concluded that high temperatures were adequate to obtain higher values in TPC. Bhuyan et al. [43] found that temperature, followed by time and power, presented a significant influence on the extraction efficiency of phenolic compounds.
Some authors have shown that a higher ethanol concentration results in better extraction yields [37,44] and that ethanol-water mixtures favor the release of polyphenols [45]. For this reason, this was one of the parameters that most affected the antioxidant activity by DPPH.
To obtain the models to find the best relationship between ethanol concentration, time and temperature that predict the behavior of the TPC, DPPH radical scavenging activity and ABTS as response variables, a surface response design was applied, using the data in Table 2. A central composite design (Table 1) was applied with twenty treatments, six central points and six axial points allowing the incorporation of quadratic terms in the model. To assess the quality of the model, the correlation coefficient R2 was selected, and the root mean square error (RMSE) was estimated. The results of the ANOVA analysis of variance for each of the response variables are shown in Table 3.
For the TPC, the results show that the linear model presented a significant effect p < 0.05 on the response variable, however, it can be observed that, although the quadratic model and the interactions did not present a significant effect (0.051 and 0.284), the quadratic factor of time did present a major influence on this variable (p = 0.012). For the adequate prediction of this response variable, all the linear and quadratic terms and the interactions were considered, obtaining an R2 value of 0.8883, indicating that the selected terms explain 88.83% of the variability of the response and presenting a strong correlation (0.7 < R2 < 1) [46]. The root mean square error was 44.36 which indicates that there is no significant difference between the values obtained and those predicted by the model. For DPPH radical inhibition, the quadratic model presented a significant effect p < 0.05, except for the temperature (0.068). Similarly, all the terms of the variables studied were considered to guarantee the quality of the model. The R2 value obtained was 0.8074, indicating that the selected terms explain 80.74% of the variability of the response. Likewise, the RMSE value was 2.01, indicating a good fit of the model to the experimental data.
Finally, for the inhibition percentage of ABTS radicals, both the linear and quadratic models showed a significant effect (p < 0.05). The only terms that did not present a significant effect were time in the linear model (0.060) and the quadratic factor of ethanol (0.172), however, it is not possible to exclude them because they affect the precision of the model. The interactions did not show a significant influence. The R2 value was 0.9029, which is considered a good fit and therefore can effectively represent the studied variable.
According to the results of the ANOVA table, models were proposed for each of the response variables studied, considering the coefficients of the temperature (T), time (t) and ethanol (E) components. The equations obtained are shown in Table 4.
To observe the fit of the models to the experimental data, Table 5 is presented.
According to the data reported in Table 5, it is possible to observe that there is a good fit of the models with the experimental data obtained. The percentage inhibition of ABTS, the one that presented the best fit, the values of R2 and RMSE were 90.29% and 1.43, respectively. For the TPC and percentage inhibition by DPPH the values for R2 were 88.83% and 80.74%, indicating a strong correlation; for the RMSE 44.36 and 2.01, evidencing a good performance for the models.

3.2. Scanning Electron Microscopy (SEM)

The structural changes in the fermented and fermented and sonicated peel samples were analyzed by SEM images. The images were observed at 400× and 1500×. The micrographs obtained for both samples are shown in Figure 2.
Figure 2a,b shows the growth of Rhizopus oryzae during the fermentation of pineapple peels. A rigid and rough structure was observed in the fermented peels, probably attributed to the presence of cellulose, hemicellulose, lignin, and pectin; these micrographs were similar to those reported by Zain et al. [47], who used solid-state fermentation of pineapple waste to produce lactic acid. Figure 2c,d shows the decompaction and rupture of the cell walls in the pineapple peels, which are attributed to the ultrasound process, which can cause the destruction of the tissues by mechanical rupture. In addition, during the ultrasound process, the cells were also elongated and flattened to form microchannels [48,49]. The microchannels were formed by tissue rupture due to shear forces resulting from bubble collapse during cavitation. This behavior was similar to that observed by Rani et al. (2019) [49], who evaluated the ultrasound pretreatment on pineapple samples subjected to drying.

3.3. Total Phenolic Content and Antioxidant Activity by DPPH and ABTS

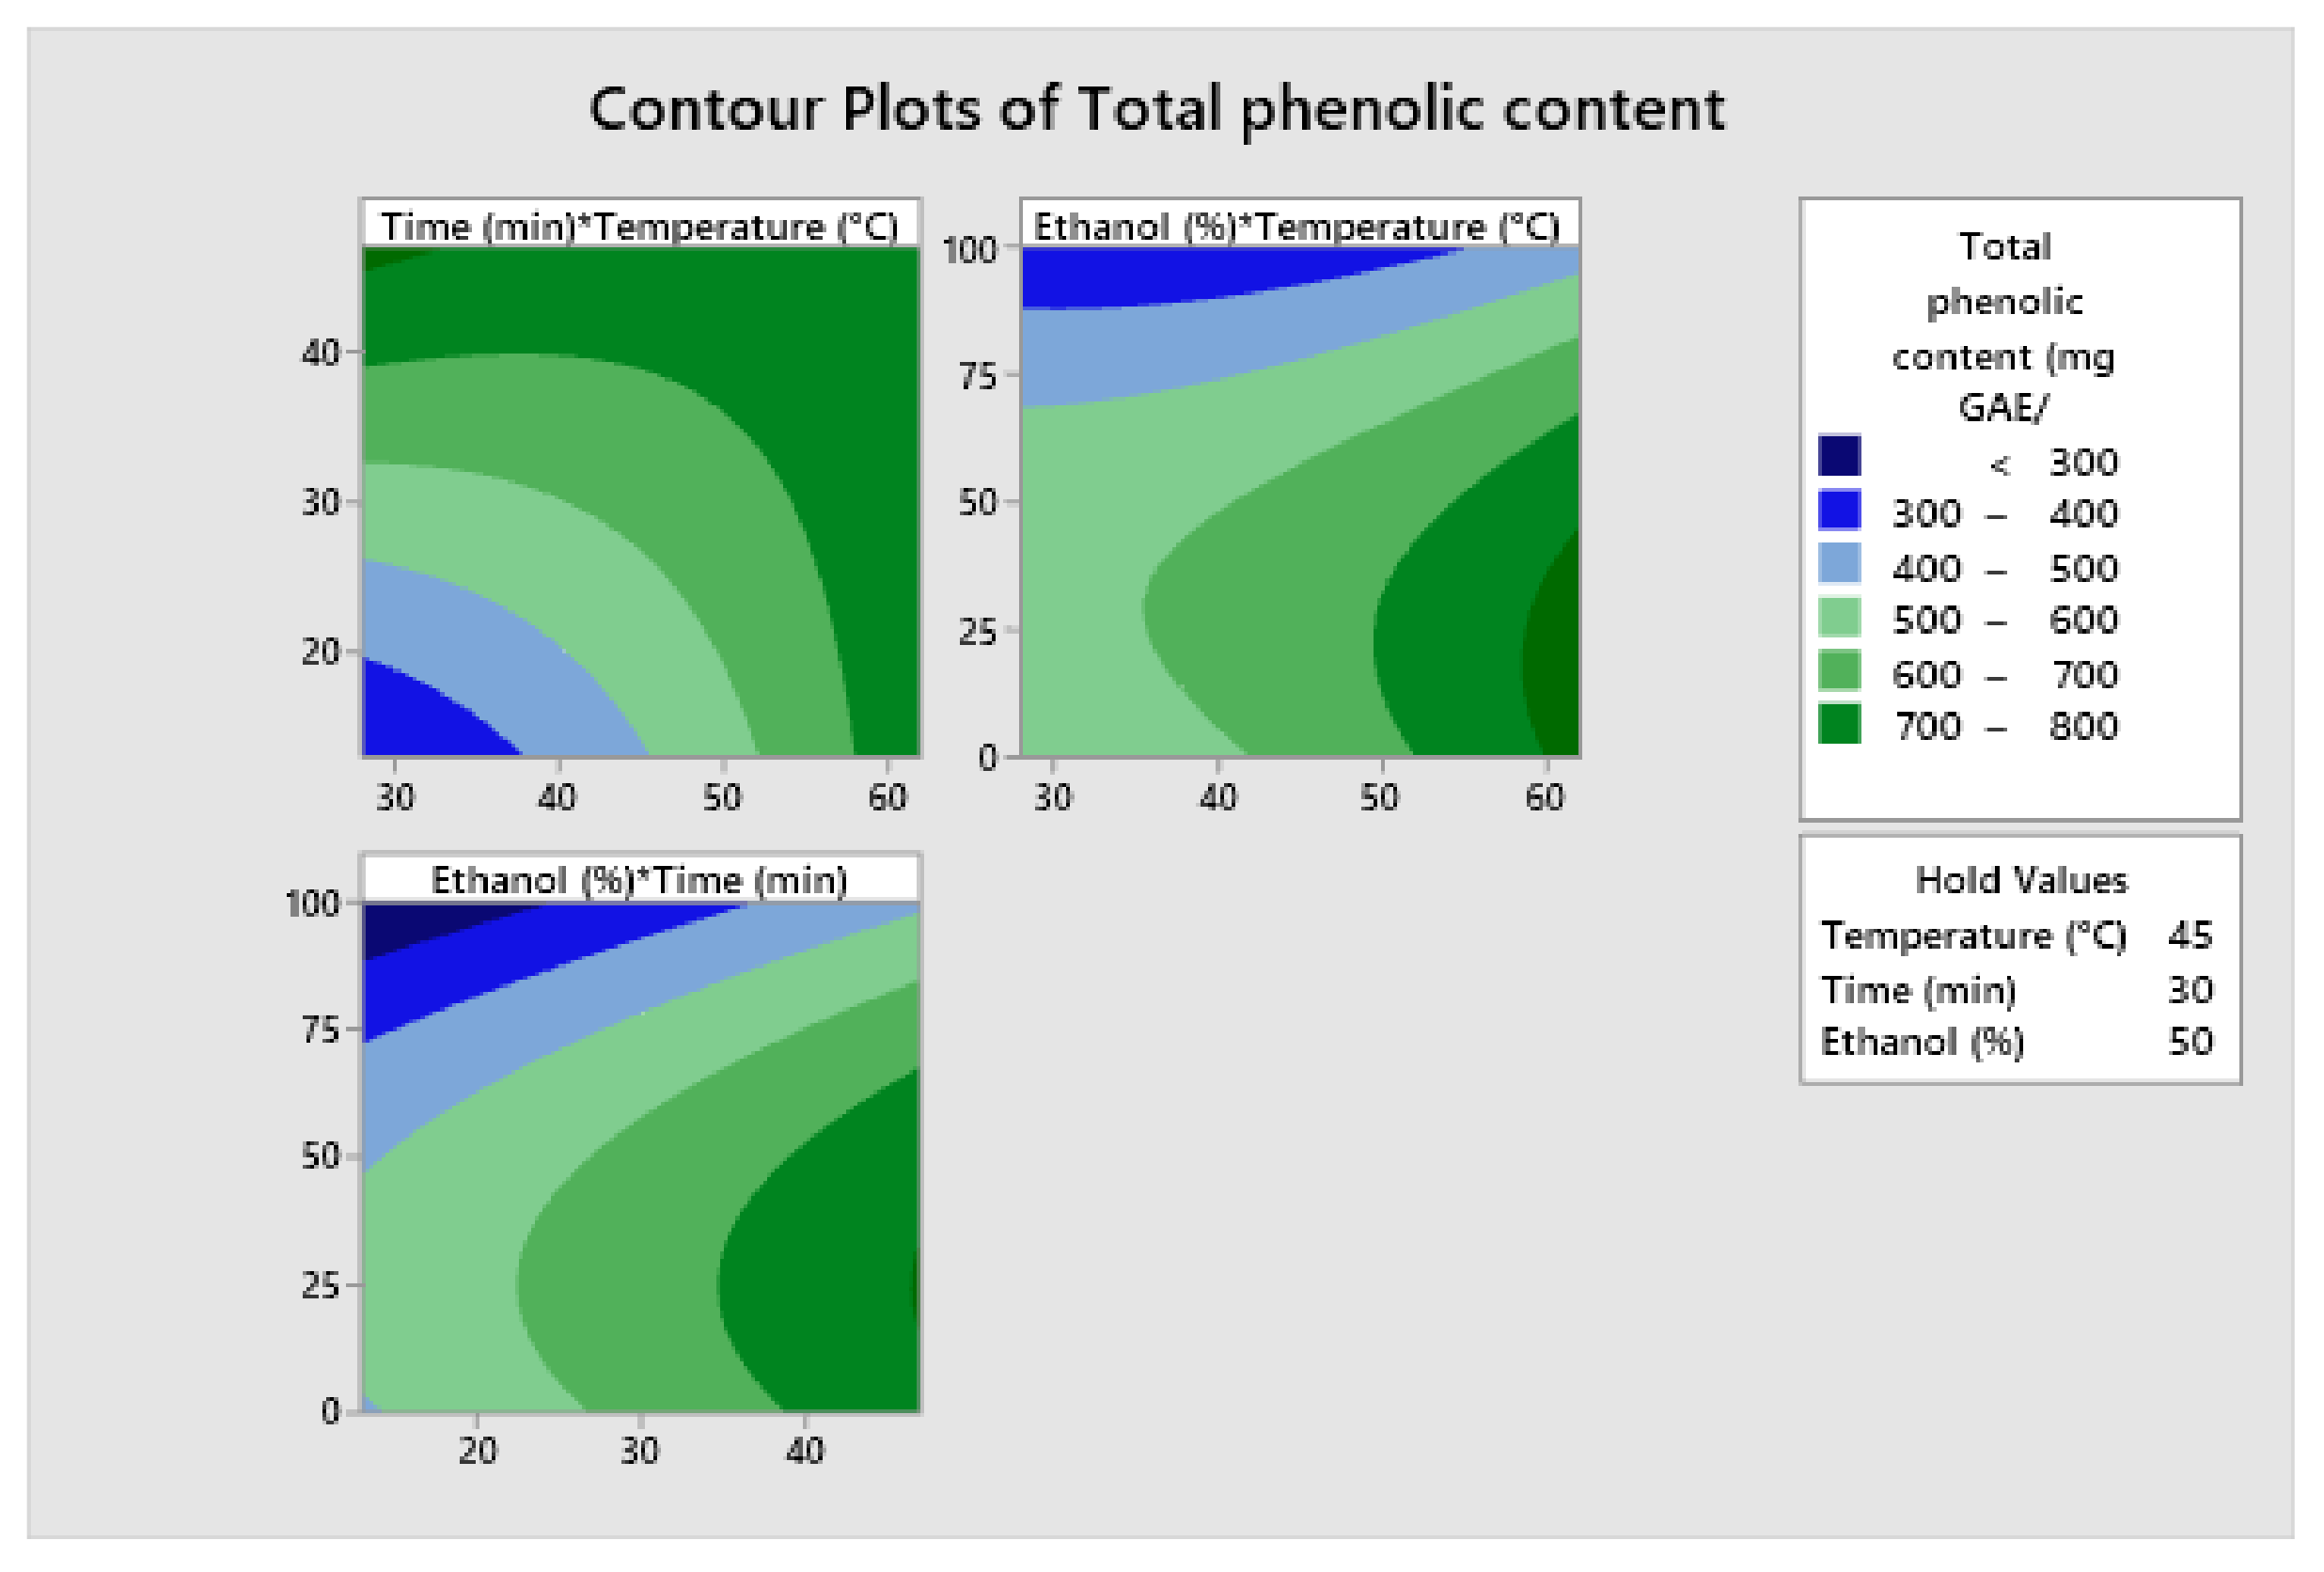
Contour plots were made to analyze the behavior of each of the variables studied, (Figure 3, Figure 4 and Figure 5). These graphs show the lowest or highest values of each variable through shade variations, allowing the identification of the region of interest and predicting at what levels the factors (temperature, time and ethanol concentration) must be to find the desired response values.
Figure 3 shows the contour plot for the behavior of the TPC under the different combinations of the analyzed factors. The blue color represents the zone where the lowest TPC values are obtained after the combined process of SSF and ultrasound, and the green color represents the zone where the highest values are obtained. It can be seen that the areas where the highest values are obtained are those where the factors of temperature, time and ethanol concentration are greater than the conditions (T: 45 °C, 30 min and 50% ethanol).
In Figure 3 it is possible to observe that, as the time increases, there is an increase in the TPC, with the highest value (779.92 mg GAE/g d.m) at 30 min. The same behavior was observed by Bouafia et al. [50], who reported that, at 30 min, the highest amount of phenols were obtained (40.01 ± 1.49 mg GAE/g m.s) in Centaurea sp. extracts, and Wang et al. [51], who used ultrasound to extract phenolic compounds from wheat bran, found that the optimal extraction conditions were at an ethanol concentration of 60%, temperature of 50 °C and a time of 29 min.
It was observed that, at temperatures above 45 °C, higher TPC was obtained. This factor has a great influence on the results, since at higher temperatures, the bonds in the substrate start to break, leading to greater extraction yields, as well as an increase in the solubility of the compounds [52]. Bouafia et al. [50] showed that the extraction yield of phenolic compounds from Centaurea sp. leaves increased remarkably at a temperature range of 35–50 °C, in which the optimal value were at the highest temperatures evaluated.
As shown in Figure 4 and Figure 5, there was an increase in the inhibition percentage by DPPH and ABTS when the extraction time and temperature were increased. The effect of the temperature observed can be attributed to the fact that, at higher temperatures, the extraction of phenolic compounds is greater, due to solvent molecules moving faster and easier, facilitating the extraction process [53].
According to the results in Figure 4 and Figure 5, it is shown that heating at moderate temperatures (50 °C to 70 °C) is adequate to soften the plant tissues and thus, release large amounts of bioactive compounds [54]. Gónzalez-Centeno et al. [55] observed this behavior when performing ultrasound extraction on grape pomace and these findings match with the ones shown in this research, since an increase in the inhibition percentage of DPPH and ABTS radicals at temperatures higher than 45 °C was observed.
Comparing the results obtained by the combination of these two technologies, Table 6 shows the TPC values and antioxidant activity of the control sample (untreated peel), fermented peel, sonicated peel and fermented with sonicated peel.
According to the analysis of variance (one way ANOVA), there was a statistically significant difference (p < 0.05) between the treatments, and the POST-ANOVA (Tukey) analysis showed that the highest value was obtained with the combination of treatments. The TPC of the control sample (30 ± 0.93 mg GAE/g d.m) was similar to that reported by Lourenço et al. [56] who encapsulated Golden pineapple peel extracts using 80% ethanol as solvent. However, it was higher than the value reported by Azizan et al. [57] who also worked with the MD2 variety and obtained 10.73 mg GAE/g d.m, while the percentage inhibition by DDPH (72.67%) was higher than that determined in this research (37.02%). Regarding the antioxidant activity by ABTS, the control sample presented (5.64 µmol/g d.m) a similar value to that reported by Kuskoski et al. [58], who evaluated this property in freeze-dried pineapple products, obtaining a value of 3.4 µmol/g d.m. Martínez et al. [59] reported a lower value (1.7 ± 0.2 µmol/g d.m) in dehydrated pineapple by-products (peel and core). Regarding the antioxidant activity of DPPH and ABTS, there was a statistically significant difference between the treatments (p < 0.05), but there were no representative differences between the fermented and the ultrasound-fermented samples, indicating that the combination of treatments did not significantly increase the antioxidant capacity with respect to the fermented sample. It is important to highlight that all treatments presented higher values of TPC and antioxidant activity with respect to the control.
It is possible to observe that both the TPC and the antioxidant activity increased in the samples submitted to the two processes (SSF and UAE), TPC was 28 times higher compared to the control, the percentage inhibition by DPPH was 1.7 times higher and the percentage inhibition by ABTS 1.3 times. The increment in the TPC and the antioxidant activity could be attributed to the combined process of SSF and ultrasound. Fermentation allows the production of various hydrolyzing enzymes such as β-glucosidase, α-amylase, xylanase, esterases, etc., which are associated with the release of phenolic compounds soluble in water and/or organic solvents used for extraction [35]. In addition to the enzymatic release of these compounds, other biochemical pathways could be involved, increasing the phenolic content and antioxidant activities in pineapple peels. Similarly, other water-soluble bioactive compounds such as small xylooligosaccharides, peptides, etc., produced through the fermentation process could contribute to enhance the antioxidant properties of the substrate [60]. On the other hand, the acoustic and mechanical effects that occur during the ultrasound method generate the formation and subsequent decomposition of bubbles in the liquid extraction medium. The dynamically formed cavitation bubbles that implode in the surrounding liquid disintegrate the cell wall of the substrate, thereby releasing phenolic compounds that were not released during the fermentation process. It is relevant to highlight that these effects can only occur in liquids and solid materials containing liquids [39]. These beneficial effects have been evidenced in a wide variety of plant substrates [61,62].
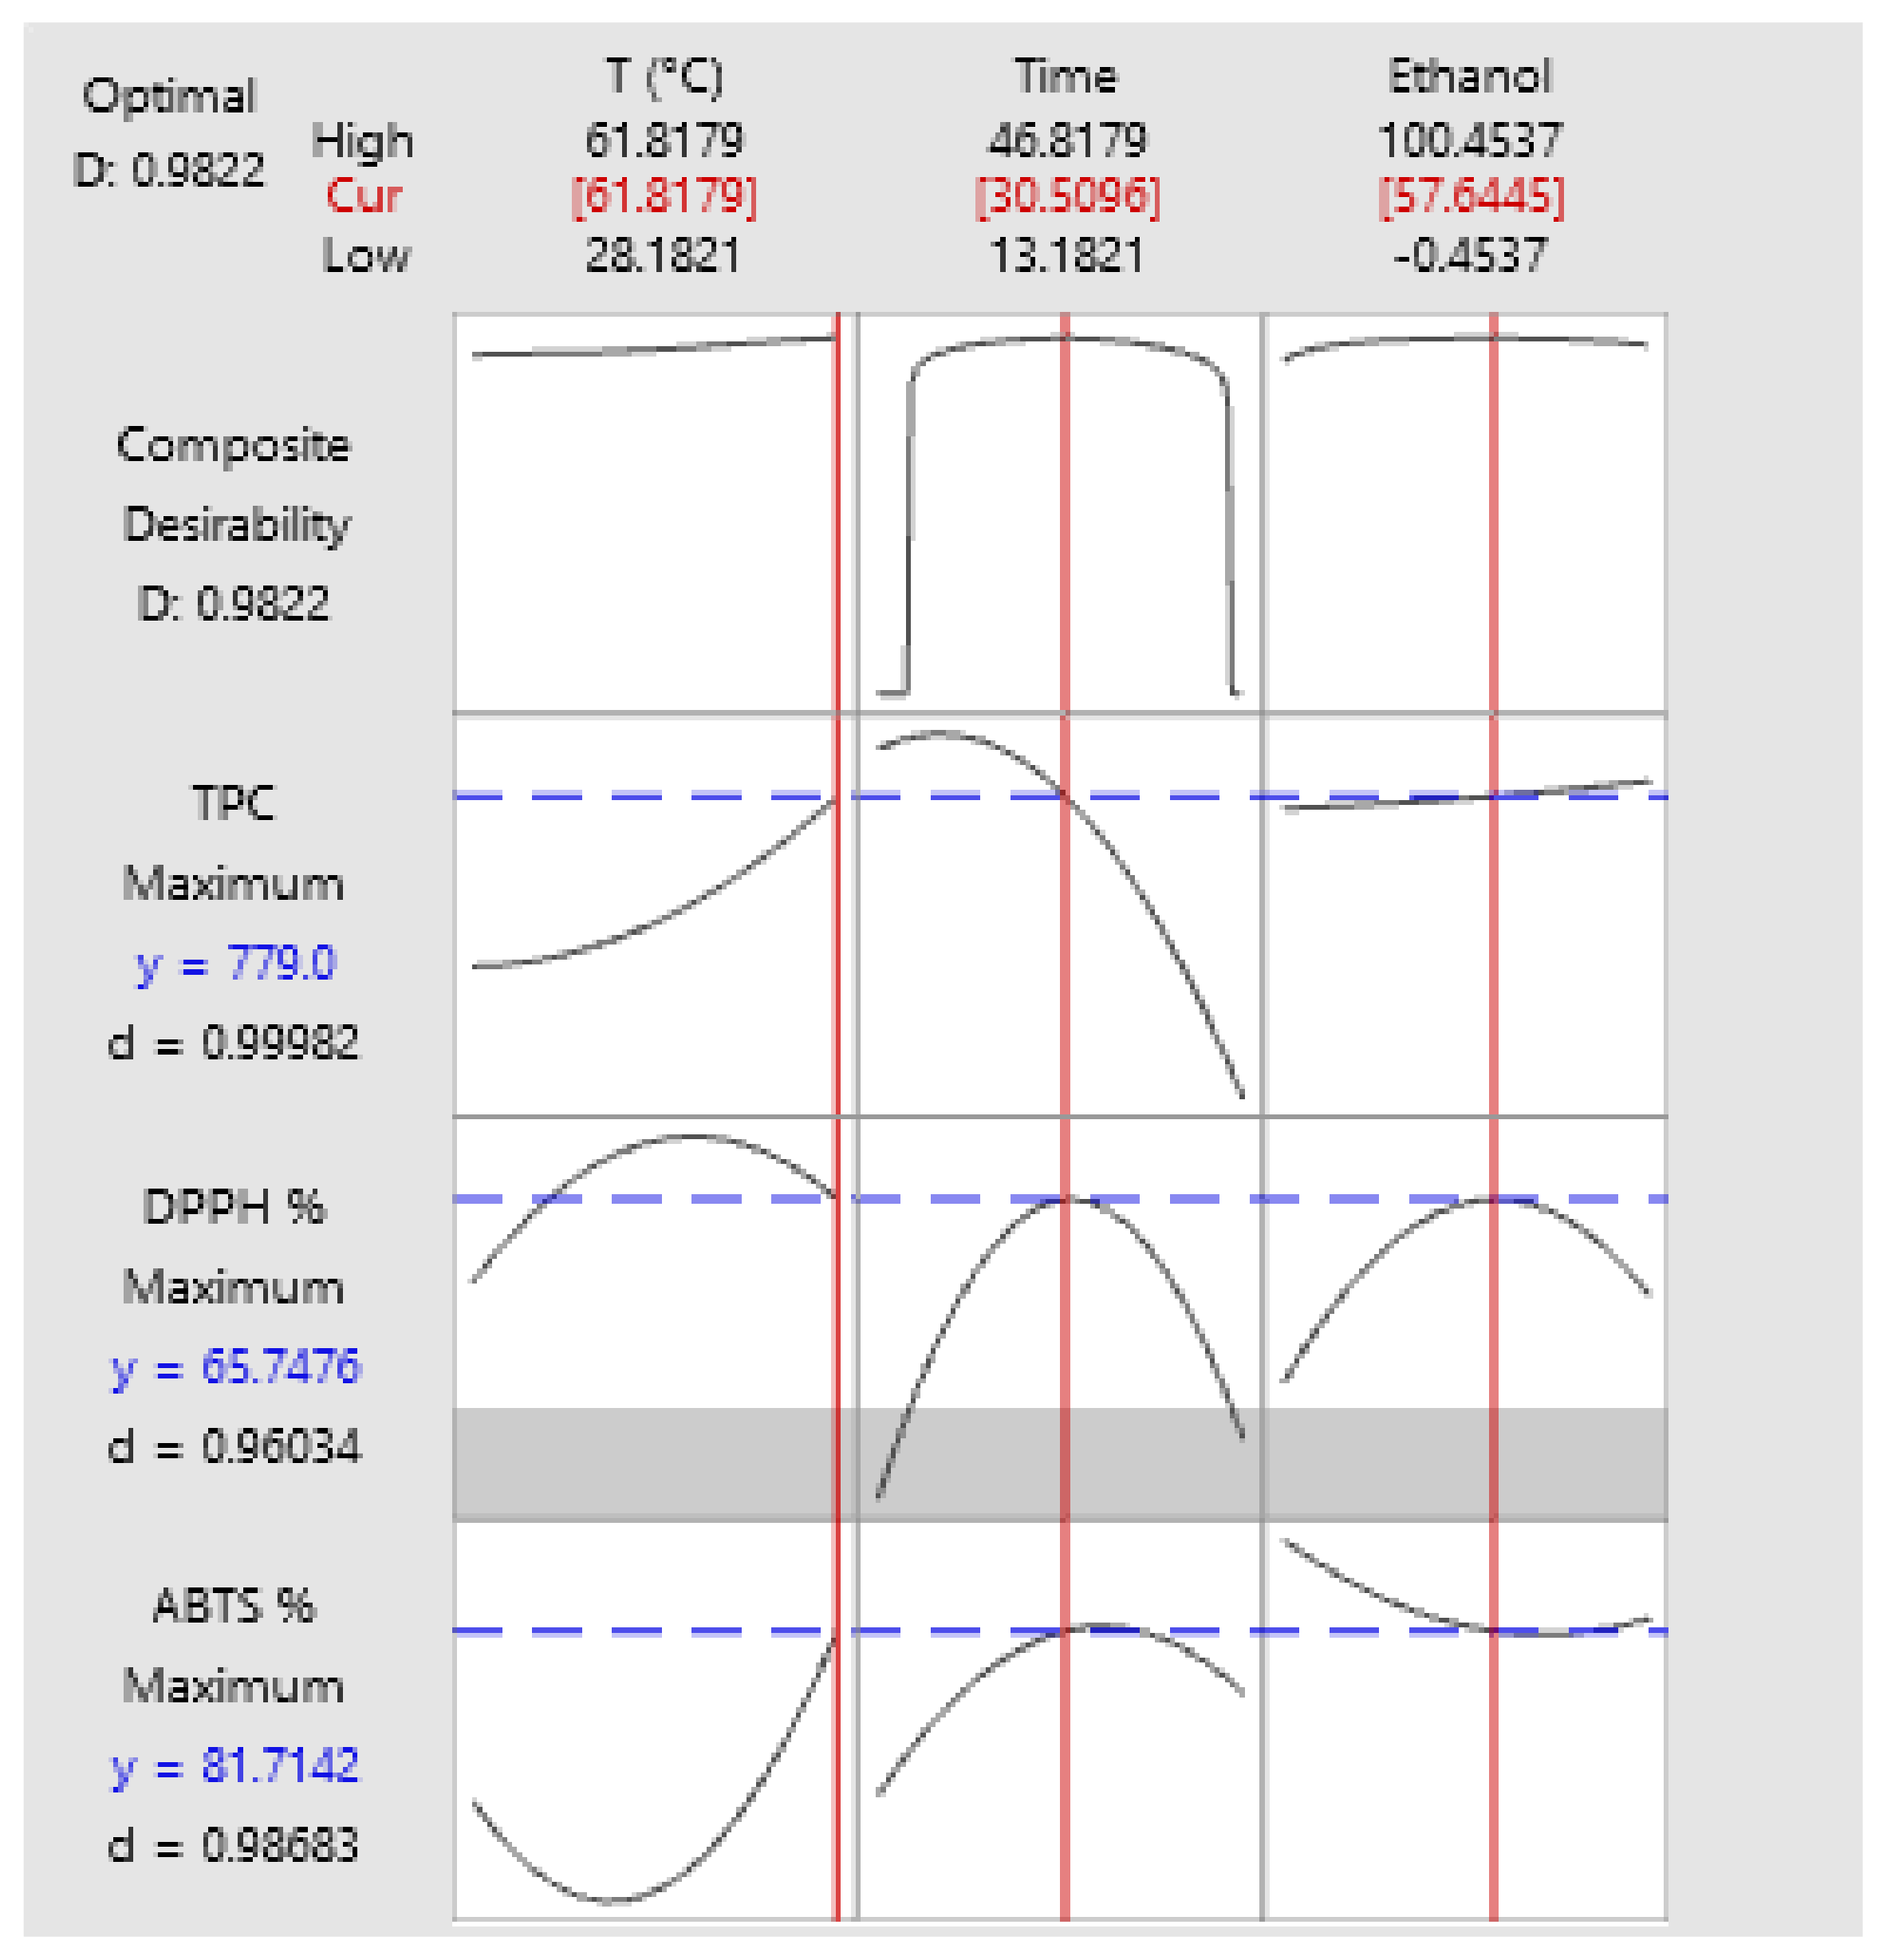
To optimize the process, a desirability function (d) was obtained, represented in the following graphs. The d value is equivalent to the degree of desirability of the response; values close to 1 indicate that the response is desirable. To apply this function, we sought to maximize the value of TPC and antioxidant activity (DPPH and ABTS). Figure 6 shows the graph of the desirability compound. The response found presented a high desirability value (d = 0.980622), which therefore, achieves an overall optimal response. The appropriate factors for the process, as found in the function, were temperature at 62 °C, 58% ethanol and 32 min, obtaining 866.26 mg GAE/g d.m for TPC, 63.53% inhibition for DPPH and 80.06% for ABTS; values very similar to those obtained by the program.
As shown in Figure 6, the temperature evaluated between 28 and 62 °C, presented an ascending value until it reached a maximum at 62 °C. For the ethanol concentration, on the other hand, it reached a maximum at 50% and then declined. In the case of temperature, thermal effects are associated with increased cell wall disruption, which enhances the release of certain compounds.
With respect to Figure 6, it was possible to observe that the higher the temperature, the better results obtained for TPC and antioxidant activity. Authors such as Shivamathi et al. [63] reported a better performance when obtaining pectin with ultrasound from pineapple peels when the temperature was evaluated in a range of 50–70 °C. The research realized by Yahya et al. (2020) [39], who used ultrasound on pineapple peels, showed an increase in the TPC when increasing the ethanol concentration up to a maximum of 50%; at higher values, it began to decrease due to the intermiscibility and similarity of the extracted components with the solvent mixture. Also, these results are similar to those reported by Živković et al. (2018) [38] and Xu et al. (2017) [37] who performed ultrasound extraction on pomegranate peels and Limonium sinuatum flowers, respectively. According to other research conducted, when water was used as extraction solvent, lower extraction yields of phenolic compounds were obtained [64], as presented in this work. As reported by Do et al. [65], the polarity of the solvent plays a relevant role in increasing the solubility of phenolic compounds. Particularly, ethanol is one of the solvents that increases solubility in solutes that present low polarity; for this reason, using water in different proportions of ethanol leads to the formation of a medium that achieves a better extraction [66].

3.4. Identification of Bioactive Compounds by High Performance Liquid Chromatography (HPLC)

The identification profile of the polyphenolic compounds of the fermented pineapple peel subjected to the ultrasound process was obtained by UHPLC analysis, following the methodology described previously. The identified compounds in the extracts obtained by optimized conditions are presented in 
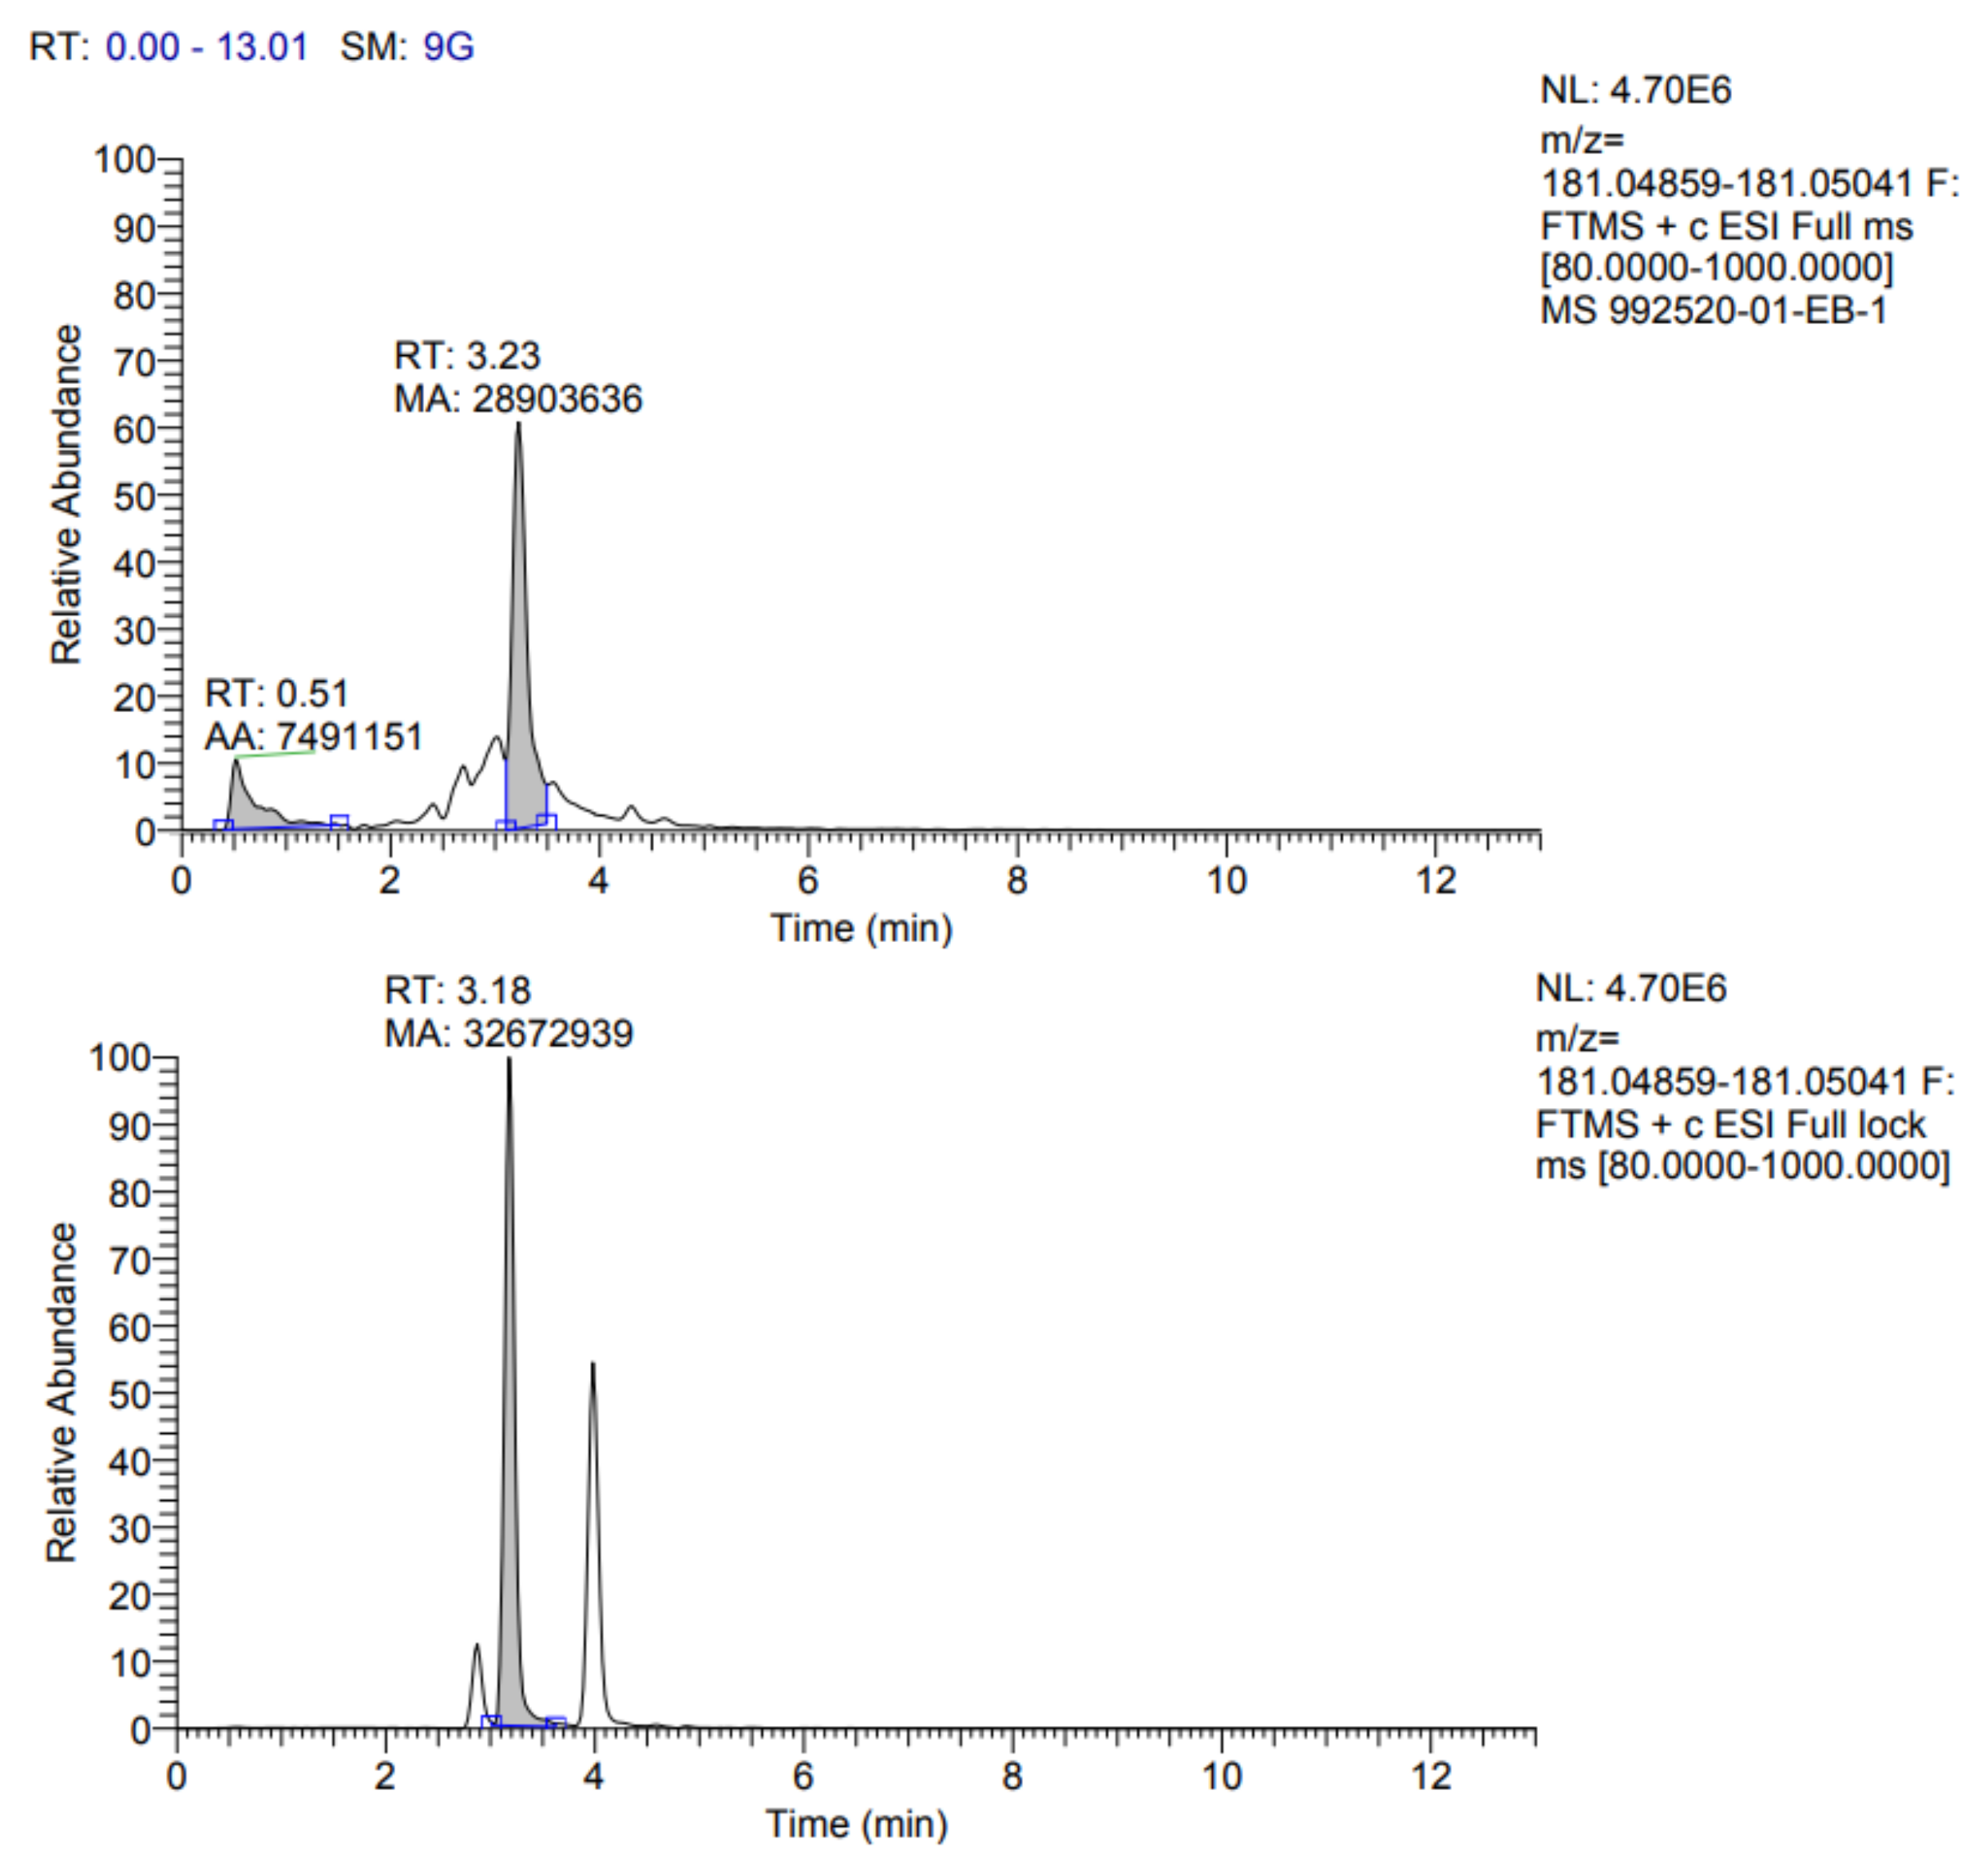
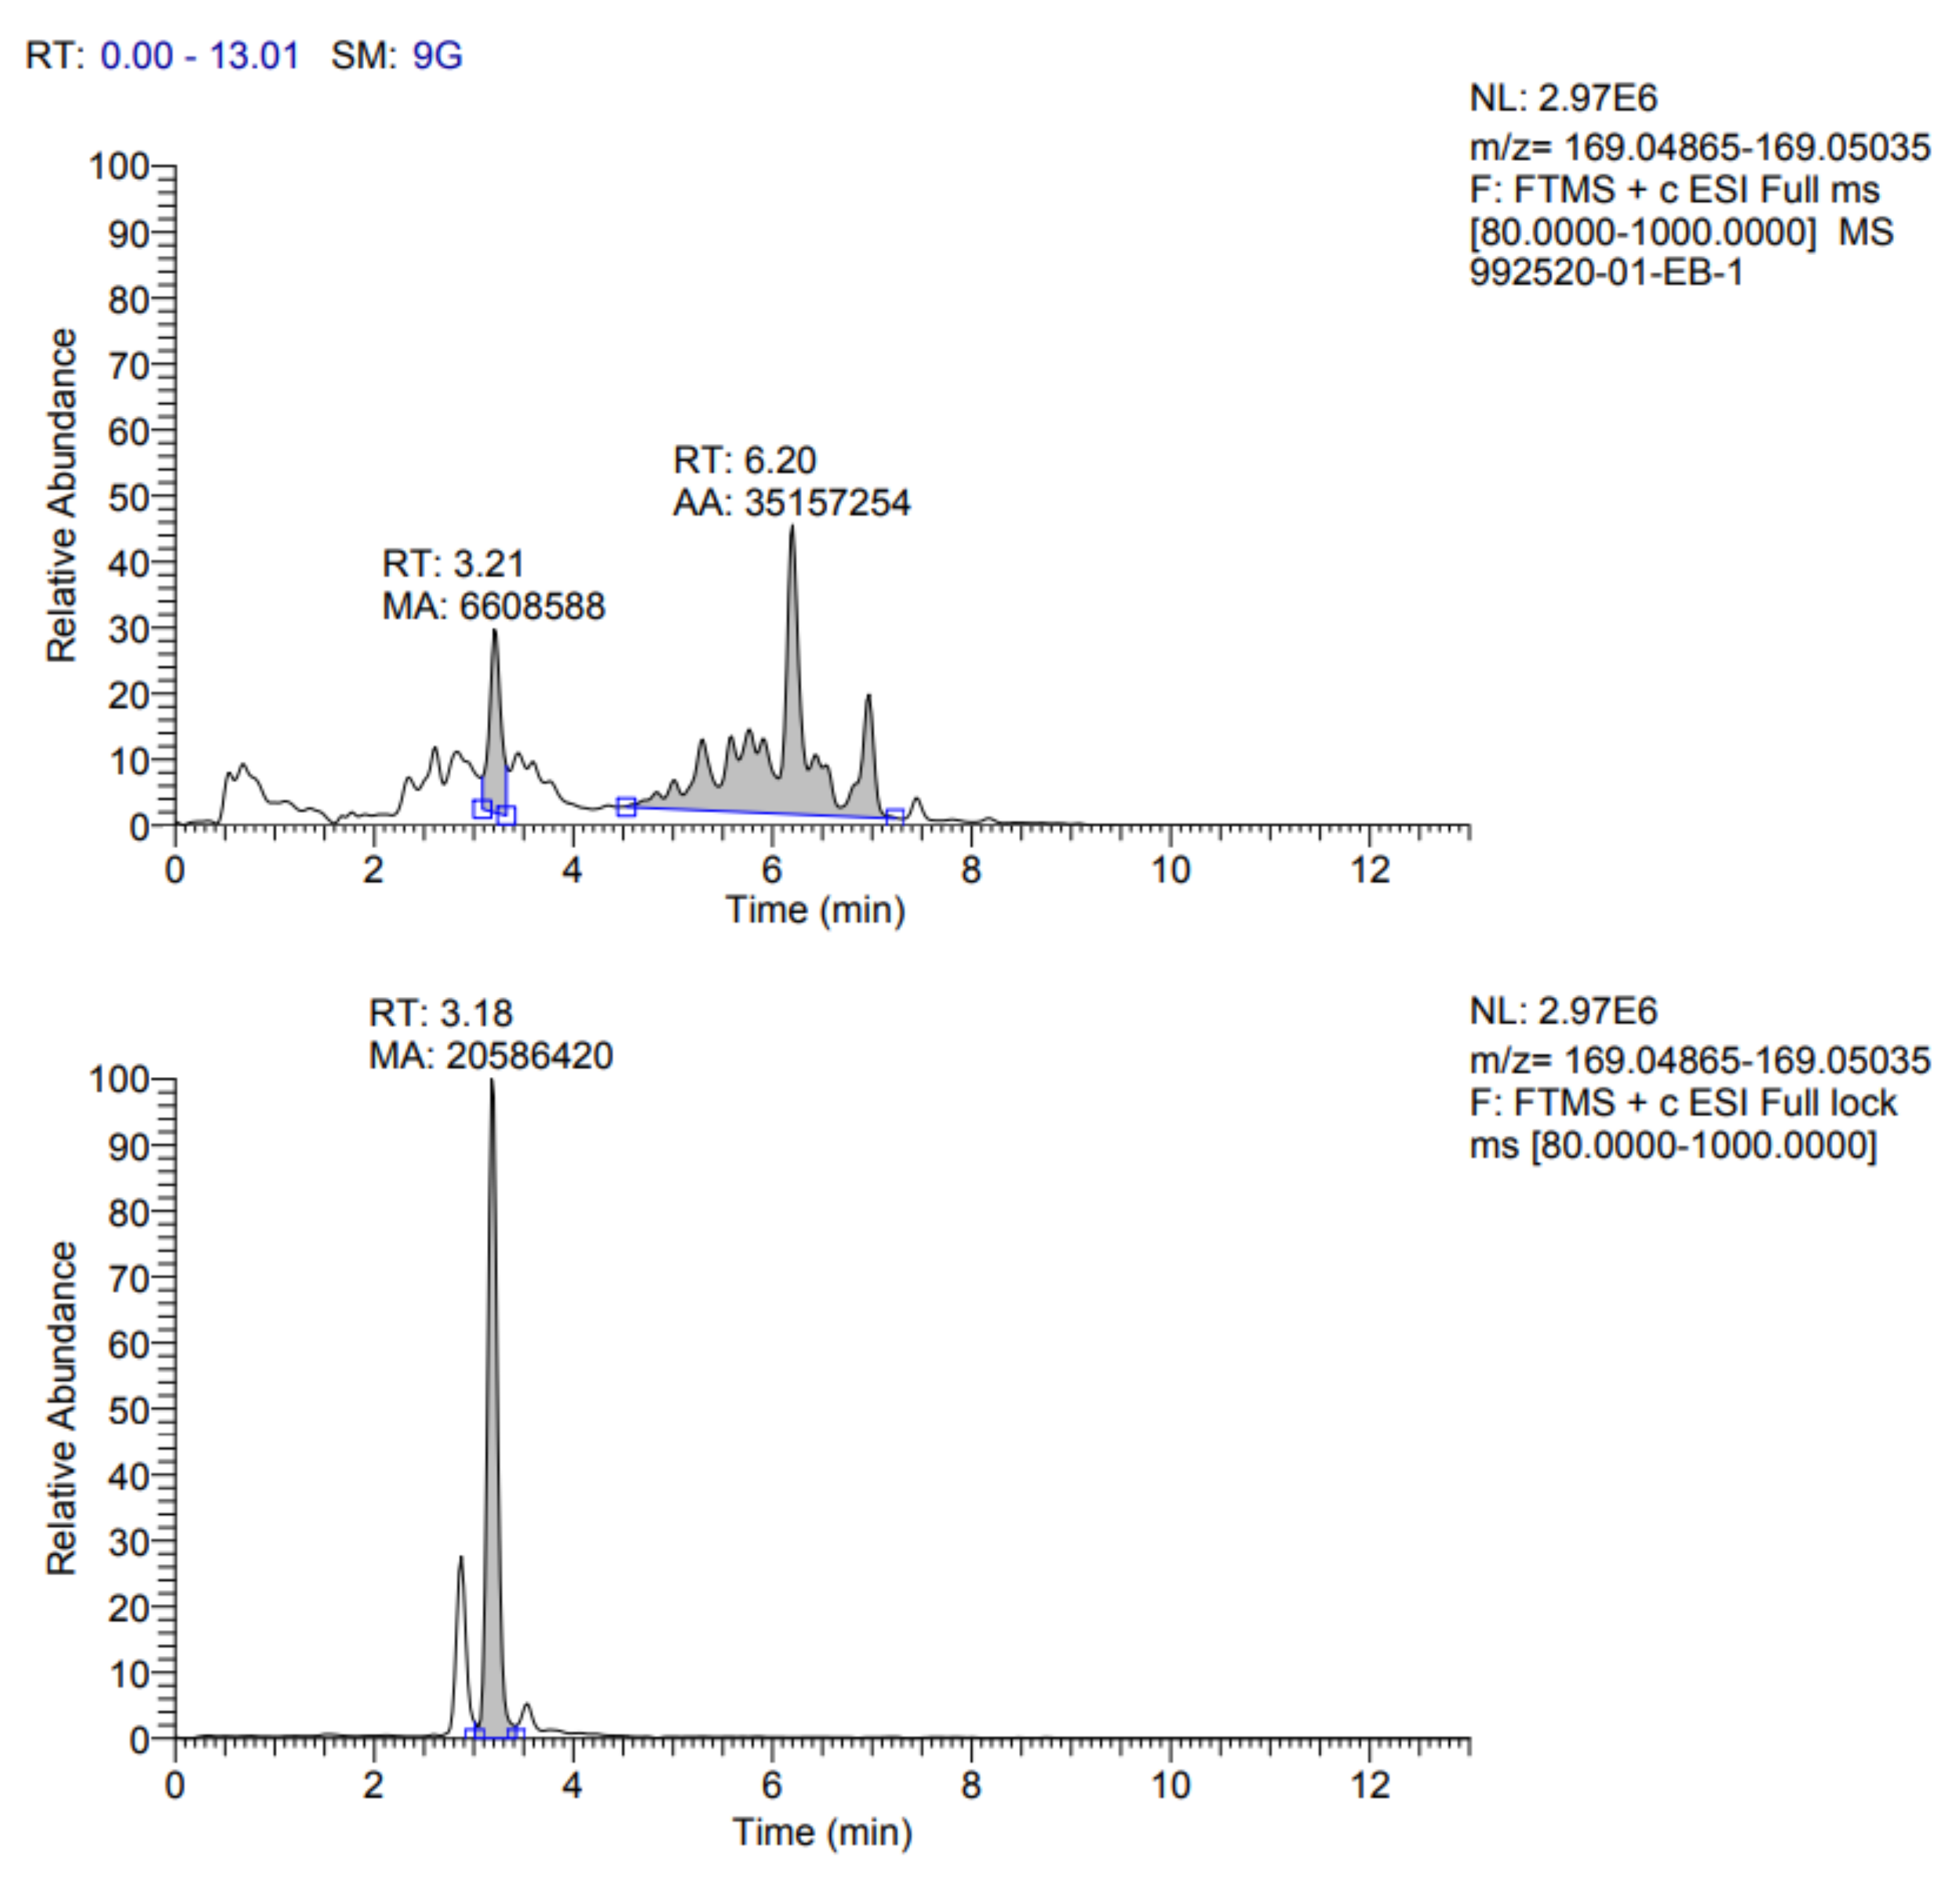
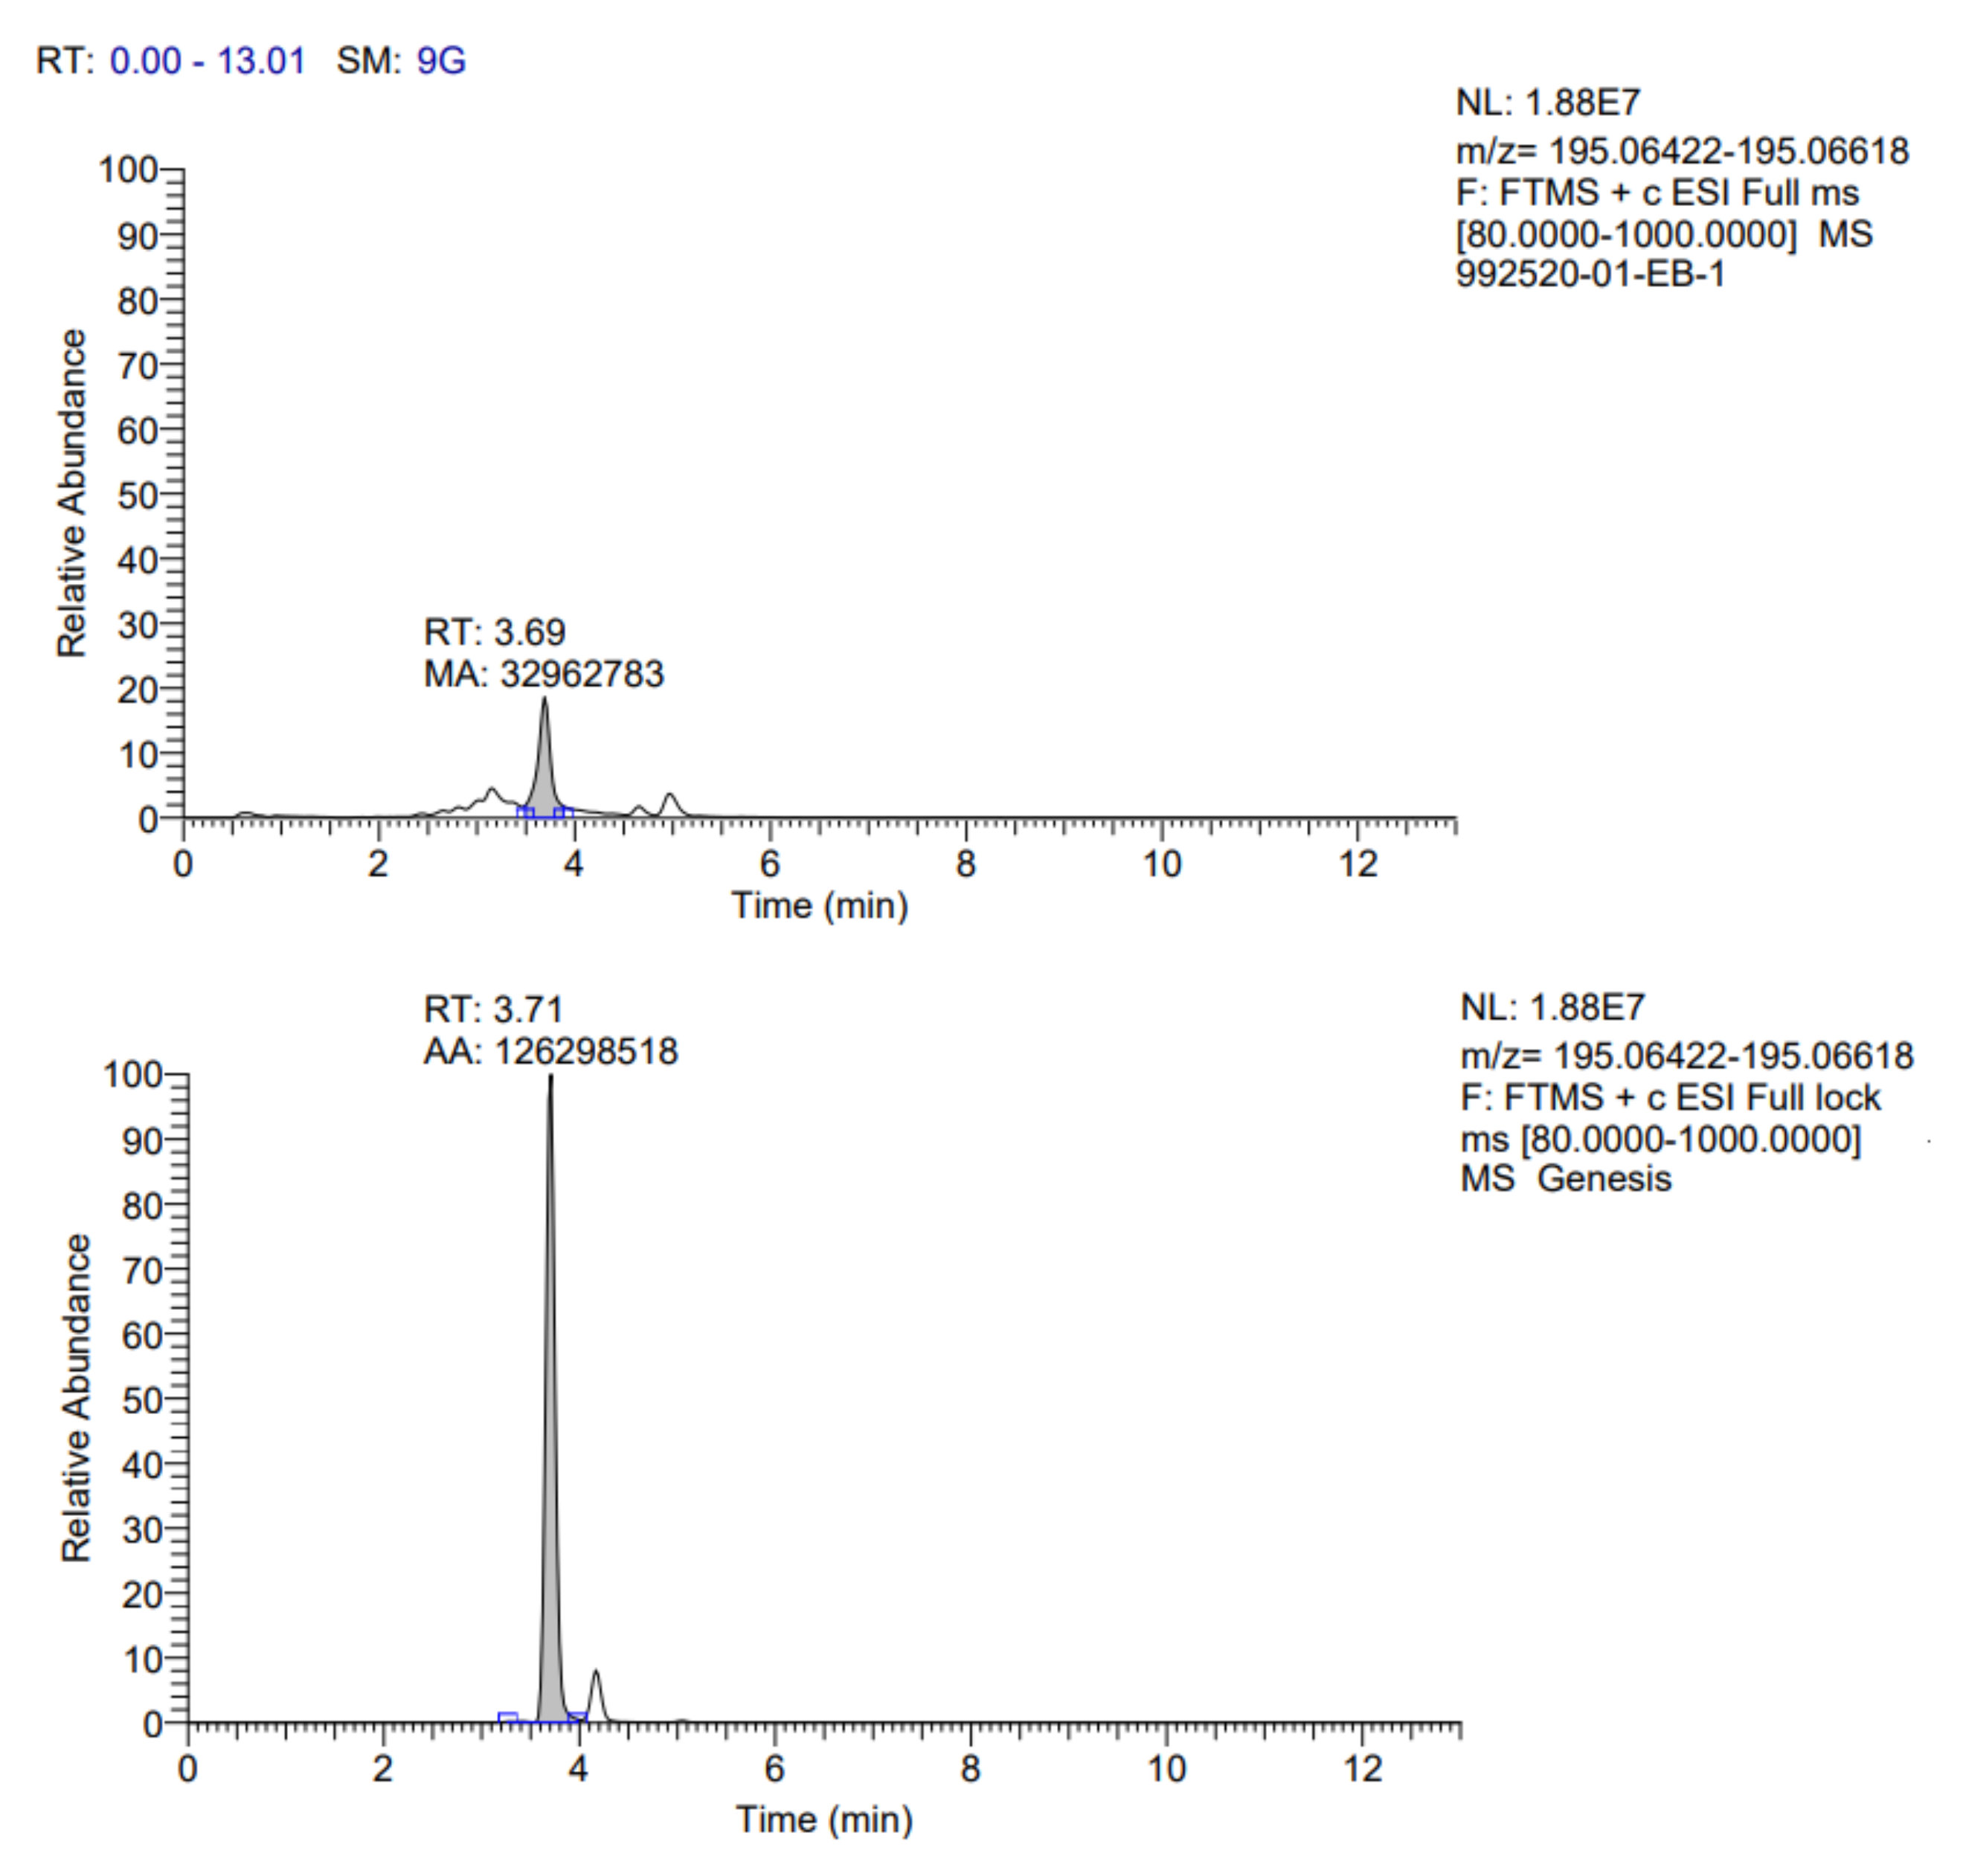
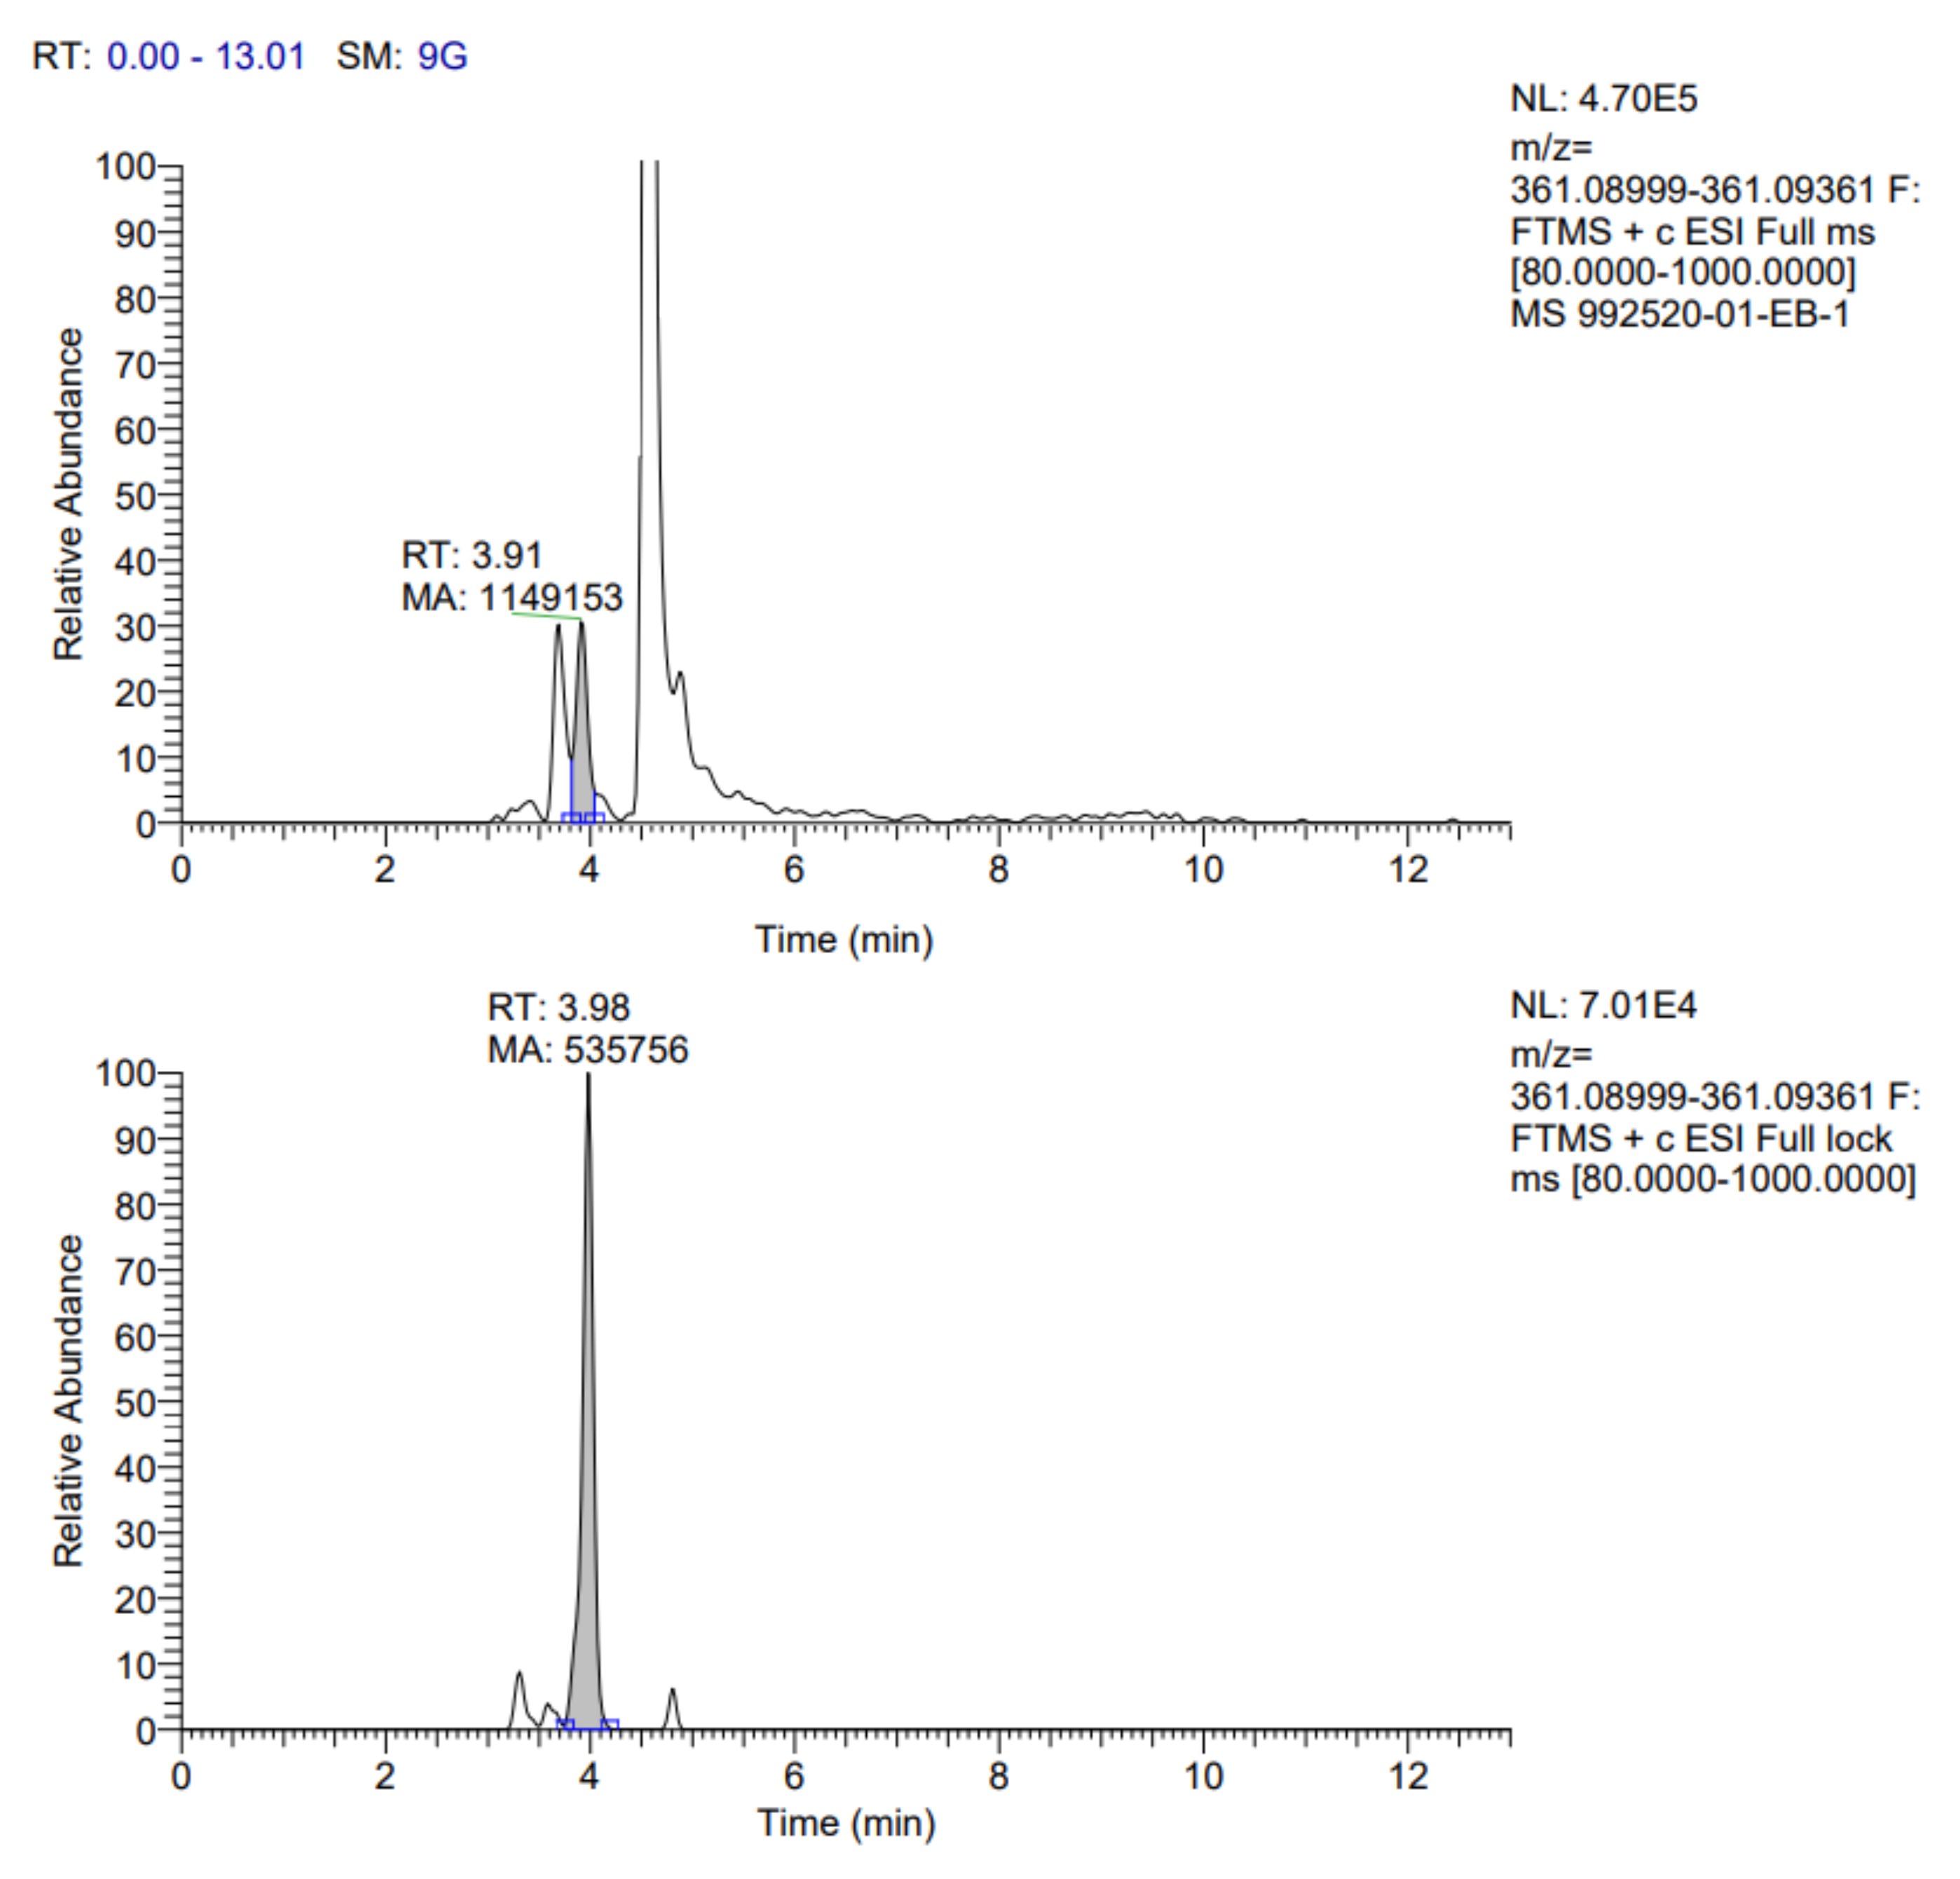
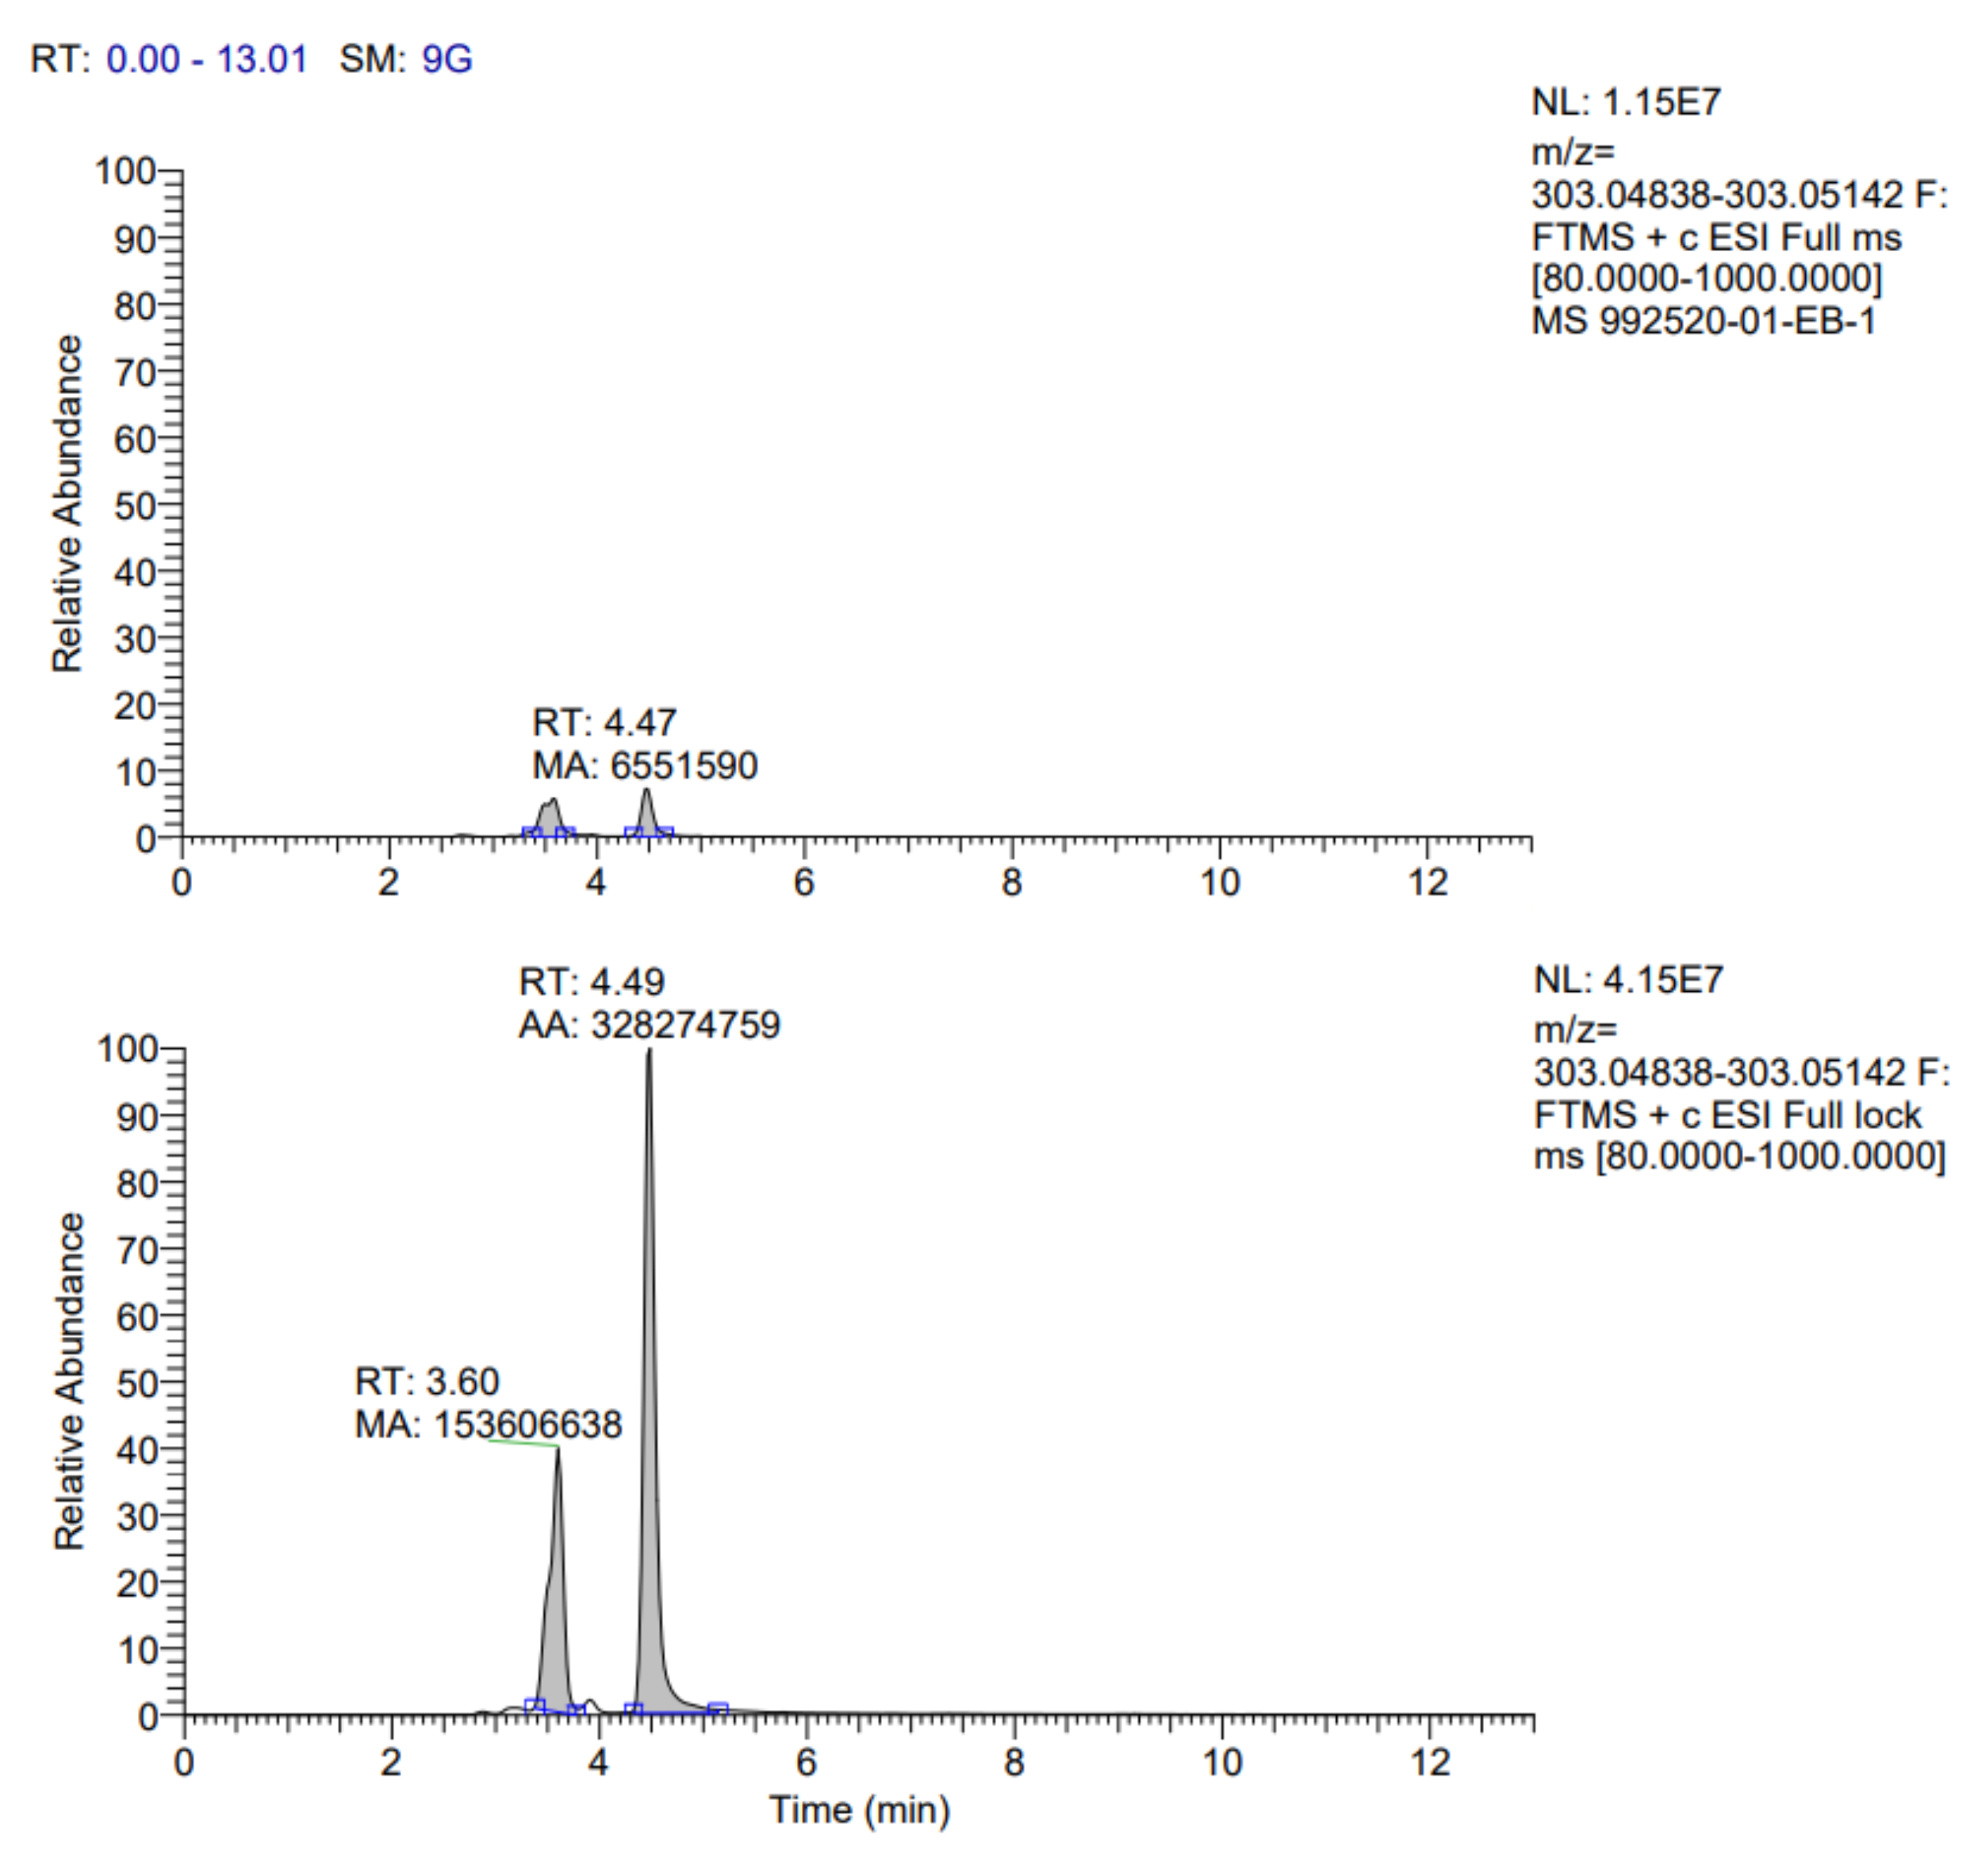
Table 7. In addition, the fragmentograms of the compounds identified and quantified in the extract can be found in Appendix A.
Concerning the TPC, different values are often observed when applying the same processing method, mainly due to the difference in cultivars, maturity stage, sample heterogeneity, processing, as well as the extraction conditions and techniques used in each research [67]. Phenolic compounds account for more than half of the total antioxidant capacity present in fruits, demonstrating the efficiency of these to scavenge free radicals and some reactive oxygen species [68].
According to the results reported in Table 7, it is possible to observe that ten compounds were quantified, including rosmarinic acid, caffeic acid, vanillic acid, coumaric acid, ferulic acid, quercetin 3-glucoside, rutin, quercetin, kaempferol 3-glucoside and gallic acid.
Rosmarinic acid (RA) was the main compound identified; this one belongs to the group of hydroxycinnamic acids and was isolated for the first time from the leaves of Rosmarinus officinalis, although it can be found in many other plant species [69]. RA is structurally formed from an esterification reaction between caffeic and 3,4-dihydroxyphenyl acids and is currently available in powder form. This acid has been widely investigated because it has been shown to act as an anti-aging, anti-allergic, anti-diabetic, anti-microbial, anti-depressant, anti-inflammatory agent, anti-cancer agent, and its hepatoprotective, nephroprotective, cardioprotective and neuroprotective properties have been well recognized and mainly associated with its antioxidant potential [70,71].
These identified compounds are similar to those reported by Li et al. [72], who found them in pineapple peel extracts using methanol as solvent (gallic acid, catechin, epicatechin and ferulic acid), however, catechin and epicatechin were found below the limit of quantification. Yahya et al. [39] identified in ethanolic extracts of pineapple peels obtained by ultrasound assisted extraction the following compounds: gallic acid, catechin and quercetin. Yapo et al. [73] identified eight phenolic compounds, all belonging to the family of hydroxybenzoic and hydroxycinnamic acids, which matches with the results found. In the work of Campos et al. [74] where they identified the compounds present in the liquid residues of pineapple peels, they reported chlorogenic acid, caffeic acid, syringaldehyde and ferulic acid, of which the only one not reported is syringaldehyde, however, these differences may be attributed to the fact that the extracts were not obtained under the same conditions. Likewise, the compounds identified are consistent with four of the five compounds quantified by Lourenço et al. [75], who identified: gallic, chlorogenic, caffeic, p-coumaric and ferulic acid in samples of pineapple peel extracts obtained by conventional extraction with 80% ethanol.
The combined process of SSF with ultrasound allowed us to increase the bioactive compounds present in pineapple peel extracts, compared to those reported by Lubaina et al. [76], who quantified by HPLC, ethanol extracts of the Mauritius variety pineapple peels (the most popular cultivar grown in Kerala, India), reporting 0.068 ug/mg of caffeic acid, 0.533 ug/mg of p-coumaric acid and 1.828 ug/mg of ferulic acid, while in this research 7.0 ug/mg of caffeic acid, 2.60 ug/mg of p-coumaric acid and 2.10 ug/mg of ferulic acid were obtained. These compounds are of great interest because they present beneficial properties for health; for example, caffeic acid is an antioxidant which boosts immunity and controls lipid levels in blood; p-coumaric acid is recognized for its antioxidant behavior reducing the formation of carcinogenic nitrosamines in the stomach [77] and ferulic acid is well-known for its physiological functions such as antimicrobial, anti-inflammatory and anti-cancer activities [76].

4. Conclusions

The combination of SSF with ultrasound extraction on pineapple peels allowed an increase in the phenolic content and antioxidant activity. The optimal conditions were 58% ethanol, 30 min of extraction time and 62 °C. The results obtained were 866.26 mg GAE/g m.s for TPC and for antioxidant activity expressed as percentage inhibition, 80.06 ± 1.02% for ABTS and 63.53 ± 2.02% for DPPH, respectively. This methodology allows to obtain extracts containing compounds such as rosmarinic acid, caffeic acid, vanillic acid, and p-coumaric acid, among others, which have been widely investigated and have been reported to have high antioxidant capacity and therefore have a positive influence on the consumers health. They could be used in the food, pharmaceutical or cosmetic industry. However, it is important to mention that further studies are required to evaluate the stability of the extracts when incorporated into products and how the absorption process would be through the digestive tract.

Author Contributions

Conceptualization, C.R. and L.L.; methodology, A.M.P.; software, A.M.P.; validation, L.L.; formal analysis, A.M.P.; investigation, A.M.P.; resources, C.R.; data curation, L.L.; writing—original draft preparation, A.M.P.; writing—review and editing, A.M.P. and L.L.; supervision, C.R.; project administration, C.R. and G.B.; funding acquisition, C.R., G.B. and L.L. All authors have read and agreed to the published version of the manuscript.

Funding

This research received no external funding.

Institutional Review Board Statement

Not applicable.

Informed Consent Statement

Not applicable.

Data Availability Statement

All the data are available in the manuscript file.

Acknowledgments

The authors would like to thank the Universidad del Valle for providing economic support through “CIAM-2021” to carry out research residency and to be able to perform some necessary analyses for the culmination of the investigation. They would also like to thank all the people who collaborated to cover the publication costs: Alexis Garcia, Paola Almeida, Jimena Trejos, Jean Paul Lepineux, Jorge Eduardo Angulo, Carolina Losoya, Andres Ceballos, Manuel Fernando Valois, Cesar Giraldo, Laura Castellar, Angela Torres, Diana Polo, Richard Salazar, Jorge Presiga, Katherine Ramirez, Lorena Benavides, Johan Moreno, Andrea Sanchez, Katherine Henao, Estefania Hidalgo, Daniel López, Israel Zarza, Jhon Valencia, Simena Dinas, Alex MG, Diana Montoya, Leslie Castillo, Martha Almeida, Johan Alejandro Alvarez, Jenny Guerrero, Laura Cajiao, David Leandro Rengifo, Karina Murillo, Juan Chacon, Diego Díaz, Luis Castellanos, Christian Moreno, Naya, Ana M. Porras.

Conflicts of Interest

The authors declare no conflict of interest.

Appendix A

Figure A1. Fragmentogram of caffeic acid.
Fermentation 08 00314 g0a1
Figure A2. Fragmentogram of vanillic acid.
Fermentation 08 00314 g0a2
Figure A3. Fragmentogram of p-coumaric acid.
Fermentation 08 00314 g0a3
Figure A4. Fragmentogram of ferulic acid.
Fermentation 08 00314 g0a4
Figure A5. Fragmentogram of quercetin.
Fermentation 08 00314 g0a5
Figure A6. Fragmentogram of rosmarinic acid.
Fermentation 08 00314 g0a6

References

  1. Rolim, P.M.; Hu, Y.; Gänzle, M.G. Sensory analysis of juice blend containing isomalto-oligosaccharides produced by fermentation with Weissella cibaria. Food Res. Int. 2019, 124, 86–92. [Google Scholar] [CrossRef] [PubMed]
  2. Cizeikiene, D.; Juodeikiene, G.; Damasius, J. Use of wheat straw biomass in production of L-lactic acid applying biocatalysis and combined lactic acid bacteria strains belonging to the genus Lactobacillus. Biocatal. Agric. Biotechnol. 2018, 15, 185–191. [Google Scholar] [CrossRef]
  3. Carlos, D.L.-M.J.; Leonardo, S.; Jesús, M.-C.; Paola, M.-R.; Alejandro, Z.-C.; Juan, A.-V.; Noé, A.C. Solid-State Fermentation with Aspergillus niger GH1 to Enhance Polyphenolic Content and Antioxidative Activity of Castilla Rose (Purshia plicata). Plants 2020, 9, 1518. [Google Scholar] [CrossRef] [PubMed]
  4. Micanquer-Carlosama, A.; Cortés-Rodríguez, M.; Serna-Cock, L. Formulation of a fermentation substrate from pineapple and sacha inchi wastes to grow Weissella cibaria. Heliyon 2020, 6, e03790. [Google Scholar] [CrossRef] [PubMed]
  5. Hikal, W.M.; Mahmoud, A.A.; Ahl, H.A.H.S.-A.; Bratovcic, A.; Tkachenko, K.G.; Kačániová, M.; Rodriguez, R.M. Pineapple (Ananas comosus L. Merr.), Waste Streams, Characterisation and Valorisation: An Overview. Open J. Ecol. 2021, 11, 610–634. [Google Scholar] [CrossRef]
  6. Selani, M.; Guidolin, S.; Tadeu, C.; Ratnayake, W.S.; Flores, R.A.; Bianchini, A. Characterisation and potential application of pineapple pomace in an extruded product for fibre enhancement. Food Chem. 2014, 163, 23–30. [Google Scholar] [CrossRef] [Green Version]
  7. Khedkar, M.A.; Nimbalkar, P.R.; Gaikwad, S.G.; Chavan, P.v.; Bankar, S.B. Sustainable biobutanol production from pineapple waste by using Clostridium acetobutylicum B 527: Drying kinetics study. Bioresour. Technol. 2017, 225, 359–366. [Google Scholar] [CrossRef] [Green Version]
  8. The Food and Agriculture Organization Corporate Statistical Database, FAOSTAT. 2018. Available online: http://faostat3.fao.org/download/T/TP/E (accessed on 14 April 2022).
  9. Perez, W.G.; Mayorga, D.M.A. Cadena Productiva de la Piña. Ministerio de Agricultura y Desarrollo Rural, Dirección de Cadenas Agrícolas y Forestales, Colombia, Jun. 2019. Available online: https://sioc.minagricultura.gov.co/Pasifloras/Documentos/2019-06-30%20Cifras%20Sectoriales%20PI%C3%91A.pdf (accessed on 15 January 2022).
  10. López-Herrera, M.; WingChing-Jones, R.; Rojas-Baurrillón, A. Meta-análisis de los subproductos de piña (Ananas comosus) para la alimentación animal. Agron. Mesoam. 2014, 25, 383–392. [Google Scholar] [CrossRef] [Green Version]
  11. Banerjee, S.; Ranganathan, V.; Patti, A.; Arora, A. Valorisation of pineapple wastes for food and therapeutic applications. Trends Food Sci. Technol. 2018, 82, 60–70. [Google Scholar] [CrossRef]
  12. Dabeek, W.M.; Marra, M.V. Dietary Quercetin and Kaempferol: Bioavailability and Potential Cardiovascular-Related Bioactivity in Humans. Nutrients 2019, 11, 2288. [Google Scholar] [CrossRef] [Green Version]
  13. Gautam, S.S.; Mishra, S.K.; Dash, V.; Goyal, A.K.; Rath, G. Comparative study of extraction, purification and estimation of bromelain from stem and fruit of pineapple plant. Thai J. Pharm. Sci. 2010, 34, 67–76. [Google Scholar]
  14. Nga, N.T.; Trang, N.T. Influence of the Fermentation of Pineapple Wastes with the Use of Methanobacterium Strains Separated in Vietnam on the Production of Biogas from them. J. Eng. Phys. Thermophys. 2015, 88, 392–397. [Google Scholar] [CrossRef]
  15. Kumbhar, J.V.; Rajwade, J.M.; Paknikar, K.M. Fruit peels support higher yield and superior quality bacterial cellulose production. Appl. Microbiol. Biotechnol. 2015, 99, 6677–6691. [Google Scholar] [CrossRef] [PubMed]
  16. Bruno, S.F.; Ekorong, F.J.A.A.; Karkal, S.S.; Cathrine, M.S.B.; Kudre, T.G. Green and innovative techniques for recovery of valuable compounds from seafood by-products and discards: A review. Trends Food Sci. Technol. 2019, 85, 10–22. [Google Scholar] [CrossRef]
  17. Yadegary, M.; Hamidi, A.; Alavi, S.A.; Khodaverdi, E.; Yahaghi, H.; Sattari, S.; Bagherpour, G.; Yahaghi, E. Citric Acid Production from Sugarcane Bagasse through Solid State Fermentation Method Using Aspergillus niger Mold and Optimization of Citric Acid Production by Taguchi Method. Jundishapur J. Microbiol. 2013, 6, e7625. [Google Scholar] [CrossRef] [Green Version]
  18. Sepúlveda, L.; Wong-Paz, J.E.; Buenrostro-Figueroa, J.; Ascacio-Valdés, J.A.; Aguilera-Carbó, A.; Aguilar, C.N. Solid state fermentation of pomegranate husk: Recovery of ellagic acid by SEC and identification of ellagitannins by HPLC/ESI/MS. Food Biosci. 2018, 22, 99–104. [Google Scholar] [CrossRef]
  19. Fernandes, J.; Fraga, I.; Sousa, R.; Rodrigues, M.; Sampaio, A.; Bezerra, R.; Dias, A. Pretreatment of Grape Stalks by Fungi: Effect on Bioactive Compounds, Fiber Composition, Saccharification Kinetics and Monosaccharides Ratio. Int. J. Environ. Res. Public Health 2020, 17, 5900. [Google Scholar] [CrossRef]
  20. Aguiar, A.; Ferraz, A. Effect of aqueous extracts from Ceriporiopsis subvermispora-biotreated wood on the decolorization of Azure B by Fenton-like reactions. Int. Biodeterior. Biodegrad. 2012, 74, 61–66. [Google Scholar] [CrossRef]
  21. Handa, C.L.; de Lima, F.S.; Guelfi, M.F.G.; Fernandes, M.d.; Georgetti, S.R.; Ida, E.I. Parameters of the fermentation of soybean flour by Monascus purpureus or Aspergillus oryzae on the production of bioactive compounds and antioxidant activity. Food Chem. 2019, 271, 274–283. [Google Scholar] [CrossRef] [PubMed]
  22. Bier, M.C.J.; Medeiros, A.B.P.; de Kimpe, N.; Soccol, C.R. Evaluation of antioxidant activity of the fermented product from the biotransformation of R-(+)-limonene in solid-state fermentation of orange waste by Diaporthe sp. Biotechnol. Res. Innov. 2019, 3, 168–176. [Google Scholar] [CrossRef]
  23. Fujita, A.; Sarkar, D.; Genovese, M.I.; Shetty, K. Improving anti-hyperglycemic and anti-hypertensive properties of camu-camu (Myriciaria dubia Mc. Vaugh) using lactic acid bacterial fermentation. Process. Biochem. 2017, 59, 133–140. [Google Scholar] [CrossRef]
  24. Ibarruri, J.; Hernández, I. Rhizopus oryzae as Fermentation Agent in Food Derived Sub-products. Waste Biomass Valorization 2018, 9, 2107–2115. [Google Scholar] [CrossRef]
  25. Londoño-Hernandez, L.; Ramírez-Toro, C.; Ruiz, H.A.; Ascacio-Valdés, J.A.; Aguilar-Gonzalez, M.A.; Rodríguez-Herrera, R.; Aguilar, C.N. Rhizopus oryzae—Ancient microbial resource with importance in modern food industry. Int. J. Food Microbiol. 2017, 257, 110–127. [Google Scholar] [CrossRef] [PubMed]
  26. Londoño-Hernandez, L.; Ruiz, H.A.; Ramírez, T.C.; Ascacio, J.A.; Rodríguez-Herrera, R.; Aguilar, C.N. Fungal detoxification of coffee pulp by solid-state fermentation. Biocatal. Agric. Biotechnol. 2020, 23, 101467. [Google Scholar] [CrossRef]
  27. Peña-Lucio, E.M.; Londoño-Hernández, L.; Ascacio-Valdes, J.A.; Chavéz-González, M.L.; Bankole, O.E.; Aguilar, C.N. Use of coffee pulp and sorghum mixtures in the production of n-demethylases by solid-state fermentation. Bioresour. Technol. 2020, 305, 123112. [Google Scholar] [CrossRef]
  28. Barba, F.J.; Zhu, Z.; Koubaa, M.; Sant’Ana, A.S.; Orlien, V. Green alternative methods for the extraction of antioxidant bioactive compounds from winery wastes and by-products: A review. Trends Food Sci. Technol. 2016, 49, 96–109. [Google Scholar] [CrossRef]
  29. Medina-Torres, N.; Ayora-Talavera, T.; Espinosa-Andrews, H.; Sánchez-Contreras, A.; Pacheco, N. Ultrasound Assisted Extraction for the Recovery of Phenolic Compounds from Vegetable Sources. Agronomy 2017, 7, 47. [Google Scholar] [CrossRef]
  30. Sabarez, H.; Oliver, C.M.; Mawson, R.; Dumsday, G.; Singh, T.; Bitto, N.; McSweeney, C.; Augustin, M.A. Synergism between ultrasonic pretreatment and white rot fungal enzymes on biodegradation of wheat chaff. Ultrason. Sonochem. 2014, 21, 2084–2091. [Google Scholar] [CrossRef]
  31. Leite, P.; Salgado, J.M.; Venâncio, A.; Domínguez, J.M.; Belo, I. Ultrasounds pretreatment of olive pomace to improve xylanase and cellulase production by solid-state fermentation. Bioresour. Technol. 2016, 214, 737–746. [Google Scholar] [CrossRef] [Green Version]
  32. Marina, D.; Avella, G.; Christopher, A.; García, A.O.; Mendoza, C. Medición de Fenoles y Actividad Antioxidante en Malezas Usadas para Alimentación Animal. Centro Nacional de Metrología. Simposio de Metrología. Universidad Autónoma de Querétaro, México. 2008, pp. 1–5. Available online: https://www.cenam.mx/simposio2008/sm_2008/memorias/M2/SM2008-M220-1108.pdf (accessed on 14 April 2022).
  33. Ballesteros, L.F.; Cerqueira, M.A.; Teixeira, J.A.; Mussatto, S.I. Characterization of polysaccharides extracted from spent coffee grounds by alkali pretreatment. Carbohydr. Polym. 2015, 127, 347–354. [Google Scholar] [CrossRef] [Green Version]
  34. Mesa-Vanegas, A.M.; Zapata-Uribe, S.; Arana, L.M.; Zapata, I.C.; Monsalve, Z.; Rojano, B. Actividad antioxidante de extractos de diferente polaridad de Ageratum conyzoides L. Bol. Latinoam. Caribe Plantas Med. Aromát. 2015, 14, 1–10. [Google Scholar]
  35. Drosou, C.; Kyriakopoulou, K.; Bimpilas, A.; Tsimogiannis, D.; Krokida, M. A comparative study on different extraction techniques to recover red grape pomace polyphenols from vinification byproducts. Ind. Crops Prod. 2015, 75, 141–149. [Google Scholar] [CrossRef]
  36. Dey, T.B.; Kuhad, R.C. Enhanced production and extraction of phenolic compounds from wheat by solid-state fermentation with Rhizopus oryzae RCK2012. Biotechnol. Rep. 2014, 4, 120–127. [Google Scholar] [CrossRef] [Green Version]
  37. Xu, D.-P.; Zheng, J.; Zhou, Y.; Li, Y.; Li, S.; Li, H.-B. Ultrasound-assisted extraction of natural antioxidants from the flower of Limonium sinuatum: Optimization and comparison with conventional methods. Food Chem. 2017, 217, 552–559. [Google Scholar] [CrossRef] [PubMed]
  38. Živković, J.; Šavikin, K.; Janković, T.; Ćujić, N.; Menković, N. Optimization of ultrasound-assisted extraction of polyphenolic compounds from pomegranate peel using response surface methodology. Sep. Purif. Technol. 2018, 194, 40–47. [Google Scholar] [CrossRef]
  39. Yahya, N.A.; Wahab, R.A.; Xine, T.L.S.; Hamid, M.A. Ultrasound-assisted extraction of polyphenols from pineapple skin. AIP Conf. Proc. 2019, 2155, 020002. [Google Scholar] [CrossRef]
  40. Celli, G.B.; Ghanem, A.; Brooks, M.S.-L. Optimization of ultrasound-assisted extraction of anthocyanins from haskap berries (Lonicera caerulea L.) using Response Surface Methodology. Ultrason. Sonochem. 2015, 27, 449–455. [Google Scholar] [CrossRef]
  41. Palma, A.; Díaz, M.J.; Ruiz-Montoya, M.; Morales, E.; Giráldez, I. Ultrasound extraction optimization for bioactive molecules from Eucalyptus globulus leaves through antioxidant activity. Ultrason. Sonochem. 2021, 76, 105654. [Google Scholar] [CrossRef]
  42. Gullón, B.; Gullón, P.; Lú-Chau, T.A.; Moreira, M.T.; Lema, J.M.; Eibes, G. Optimization of solvent extraction of antioxidants from Eucalyptus globulus leaves by response surface methodology: Characterization and assessment of their bioactive properties. Ind. Crop. Prod. 2017, 108, 649–659. [Google Scholar] [CrossRef]
  43. Bhuyan, D.J.; Vuong, Q.v.; Chalmers, A.C.; van Altena, I.A.; Bowyer, M.C.; Scarlett, C.J. Development of the ultrasonic conditions as an advanced technique for extraction of phenolic compounds from Eucalyptus robusta. Sep. Sci. Technol. 2017, 52, 100–112. [Google Scholar] [CrossRef]
  44. Mane, S.; Bremner, D.H.; Tziboula-Clarke, A.; Lemos, M.A. Effect of ultrasound on the extraction of total anthocyanins from Purple Majesty potato. Ultrason. Sonochem. 2015, 27, 509–514. [Google Scholar] [CrossRef] [PubMed]
  45. Tomšik, A.; Pavlić, B.; Vladić, J.; Ramić, M.; Brindza, J.; Vidović, S. Optimization of ultrasound-assisted extraction of bioactive compounds from wild garlic (Allium ursinum L.). Ultrason. Sonochem. 2016, 29, 502–511. [Google Scholar] [CrossRef]
  46. Dancey, C.; Reidy, J. Statistics without Maths for Psychology: Using SPSS for Windows, 4th ed.; Prentice Hall: Hoboken, NJ, USA, 2008. [Google Scholar]
  47. Zain, N.A.M.; Aziman, S.N.; Suhaimi, M.S.; Idris, A. Optimization of L(+) Lactic Acid Production from Solid Pineapple Waste (SPW) by Rhizopus oryzae NRRL 395. J. Polym. Environ. 2021, 29, 230–249. [Google Scholar] [CrossRef]
  48. Fernandes, F.A.N.; Gallão, M.I.; Rodrigues, S. Effect of osmosis and ultrasound on pineapple cell tissue structure during dehydration. J. Food Eng. 2009, 90, 186–190. [Google Scholar] [CrossRef]
  49. Rani, P.; Tripathy, P.P. Effect of ultrasound and chemical pretreatment on drying characteristics and quality attributes of hot air dried pineapple slices. J. Food Sci. Technol. 2019, 56, 4911–4924. [Google Scholar] [CrossRef] [PubMed]
  50. Bouafia, M.; Colak, N.; Ayaz, F.A.; Benarfa, A.; Harrat, M.; Gourine, N.; Yousfi, M. The optimization of ultrasonic-assisted extraction of Centaurea sp. antioxidative phenolic compounds using response surface methodology. J. Appl. Res. Med. Aromat. Plants 2021, 25, 100330. [Google Scholar] [CrossRef]
  51. Wang, J.; Sun, B.; Cao, Y.; Tian, Y.; Li, X. Optimisation of ultrasound-assisted extraction of phenolic compounds from wheat bran. Food Chem. 2008, 106, 804–810. [Google Scholar] [CrossRef]
  52. Katsampa, P.; Valsamedou, E.; Grigorakis, S.; Makris, D.P. A green ultrasound-assisted extraction process for the recovery of antioxidant polyphenols and pigments from onion solid wastes using Box–Behnken experimental design and kinetics. Ind. Crop. Prod. 2015, 77, 535–543. [Google Scholar] [CrossRef]
  53. Casagrande, M.; Zanela, J.; Wagner, A.; Busso, C.; Wouk, J.; Iurckevicz, G.; Montanher, P.F.; Yamashita, F.; Malfatti, C.R.M. Influence of time, temperature and solvent on the extraction of bioactive compounds of Baccharis dracunculifolia: In vitro antioxidant activity, antimicrobial potential, and phenolic compound quantification. Ind. Crop. Prod. 2018, 125, 207–219. [Google Scholar] [CrossRef]
  54. Sang, J.; Sang, J.; Ma, Q.; Hou, X.; Li, C. Extraction optimization and identification of anthocyanins from Nitraria tangutorun Bobr. seed meal and establishment of a green analytical method of anthocyanins. Food Chem. 2017, 218, 386–395. [Google Scholar] [CrossRef]
  55. González-Centeno, M.R.; Comas-Serra, F.; Femenia, A.; Rosselló, C.; Simal, S. Effect of power ultrasound application on aqueous extraction of phenolic compounds and antioxidant capacity from grape pomace (Vitis vinifera L.): Experimental kinetics and modeling. Ultrason. Sonochem. 2015, 22, 506–514. [Google Scholar] [CrossRef] [PubMed] [Green Version]
  56. Lourenço, S.C.; Moldão-Martins, M.; Alves, V.D. Microencapsulation of Pineapple Peel Extract by Spray Drying Using Maltodextrin, Inulin, and Arabic Gum as Wall Matrices. Foods 2020, 9, 718. [Google Scholar] [CrossRef] [PubMed]
  57. Azizan, A.; Lee, A.X.; Hamid, N.A.A.; Maulidiani, M.; Mediani, A.; Ghafar, S.Z.A.; Zolkeflee, N.K.Z.; Abas, F. Potentially Bioactive Metabolites from Pineapple Waste Extracts and Their Antioxidant and α-Glucosidase Inhibitory Activities by 1H NMR. Foods 2020, 9, 173. [Google Scholar] [CrossRef] [Green Version]
  58. Kuskoski, E.M.; Asuero, A.G.; Troncoso, A.M.; Mancini-Filho, J.; Fett, R. Aplicación de diversos métodos químicos para determinar actividad antioxidante en pulpa de frutos. Cienc. Tecnol. Aliment. 2005, 25, 726–732. [Google Scholar] [CrossRef] [Green Version]
  59. Martínez, R.; Torres, P.; Meneses, M.A.; Figueroa, J.G.; Pérez-Álvarez, J.A.; Viuda-Martos, M. Chemical, technological and in vitro antioxidant properties of mango, guava, pineapple and passion fruit dietary fibre concentrate. Food Chem. 2012, 135, 1520–1526. [Google Scholar] [CrossRef] [PubMed]
  60. Veenashri, B.R.; Muralikrishna, G. In vitro anti-oxidant activity of xylo-oligosaccharides derived from cereal and millet brans—A comparative study. Food Chem. 2011, 126, 1475–1481. [Google Scholar] [CrossRef]
  61. Chan, C.-H.; See, T.-Y.; Yusoff, R.; Ngoh, G.-C.; Kow, K.-W. Extraction of bioactives from Orthosiphon stamineus using microwave and ultrasound-assisted techniques: Process optimization and scale up. Food Chem. 2017, 221, 1382–1387. [Google Scholar] [CrossRef]
  62. Chen, S.; Zeng, Z.; Hu, N.; Bai, B.; Wang, H.; Suo, Y. Simultaneous optimization of the ultrasound-assisted extraction for phenolic compounds content and antioxidant activity of Lycium ruthenicum Murr. fruit using response surface methodology. Food Chem. 2018, 242, 1–8. [Google Scholar] [CrossRef]
  63. Shivamathi, C.S.; Gunaseelan, S.; Soosai, M.R.; Vignesh, N.S.; Varalakshmi, P.; Kumar, R.S.; Karthikumar, S.; Baskar, R.; Rigby, S.P.; Syed, A.; et al. Process optimization and characterization of pectin derived from underexploited pineapple peel biowaste as a value-added product. Food Hydrocoll. 2022, 123, 107141. [Google Scholar] [CrossRef]
  64. Rasheed, A.A.; Cobham, E.I.; Zeighami, M.; Ong, S.P. Extraction of phenolic compounds from pineapple fruit. In Proceedings of the 2nd International Symposium on Processing & Drying of Foods, Fruits & Vegetables, Semenyih, Malaysia, 18–19 June 2012; pp. 1–8. [Google Scholar]
  65. Do, Q.-D.; Angkawijaya, A.E.; Tran-Nguyen, P.L.; Huynh, L.H.; Soetaredjo, F.E.; Ismadji, S.; Ju, Y.-H. Effect of extraction solvent on total phenol content, total flavonoid content, and antioxidant activity of Limnophila aromatica. J. Food Drug Anal. 2014, 22, 296–302. [Google Scholar] [CrossRef] [Green Version]
  66. Lutz, M.; Hernandez, J.; Henríquez, C. Phenolic content and antioxidant capacity in fresh and dry fruits and vegetables grown in Chile. CyTA—J. Food 2015, 13, 541–547. [Google Scholar]
  67. Hossain, M.A.; Rahman, S.M.M. Total phenolics, flavonoids and antioxidant activity of tropical fruit pineapple. Food Res. Int. 2011, 44, 672–676. [Google Scholar] [CrossRef]
  68. Veras, K.S.; Fachel, F.N.S.; Teixeira, H.F.; Koester, L.S. Technological strategies applied for rosmarinic acid delivery through different routes—A review. J. Drug Deliv. Sci. Technol. 2022, 68, 103054. [Google Scholar] [CrossRef]
  69. Rahbardar, M.G.; Hosseinzadeh, H. Effects of rosmarinic acid on nervous system disorders: An updated review. Naunyn-Schmiedeberg’s Arch. Pharmacol. 2020, 393, 1779–1795. [Google Scholar] [CrossRef]
  70. Sik, B.; Kapcsándi, V.; Székelyhidi, R.; Hanczné, E.L.; Ajtony, Z. Recent Advances in the Analysis of Rosmarinic Acid From Herbs in the Lamiaceae Family. Natural Product Commun. 2019, 14, 1934578X1986421. [Google Scholar] [CrossRef] [Green Version]
  71. Nadeem, M.; Imran, M.; Aslam Gondal, T.; Imran, A.; Shahbaz, M.; Muhammad Amir, R.; Wasim Sajid, M.; Batool Qaisrani, T.; Atif, M.; Hussain, G.; et al. Therapeutic Potential of Rosmarinic Acid: A Comprehensive Review. Appl. Sci. 2019, 9, 3139. [Google Scholar] [CrossRef] [Green Version]
  72. Li, T.; Shen, P.; Liu, W.; Liu, C.; Liang, R.; Yan, N.; Chen, J. Major Polyphenolics in Pineapple Peels and their Antioxidant Interactions. Int. J. Food Prop. 2014, 17, 1805–1817. [Google Scholar] [CrossRef]
  73. Yapo, E.S.; Kouakou, H.T.; Kouakou, L.K.; Kouadio, J.Y.; Kouamé, P.; Mérillon, J.M. Phenolic profiles of pineapple fruits (Ananas comosus L. Merrill) influence of the origin of suckers. Aust. J. Basic Appl. Sci. 2011, 5, 1372–1378. [Google Scholar]
  74. Campos, D.; Ribeiro, T.B.; Teixeira, J.A.; Pastrana, L.; Pintado, M.M. Integral Valorization of Pineapple (Ananas comosus L.) By-Products through a Green Chemistry Approach towards Added Value Ingredients. Foods 2020, 9, 60. [Google Scholar] [CrossRef] [Green Version]
  75. Lourenço, S.; Campos, D.; Gómez-García, R.; Pintado, M.; Oliveira, M.; Santos, D.; Corrêa-Filho, L.; Moldão-Martins, M.; Alves, V. Optimization of Natural Antioxidants Extraction from Pineapple Peel and Their Stabilization by Spray Drying. Foods 2021, 10, 1255. [Google Scholar] [CrossRef]
  76. Lubaina, A.S.; Renjith, P.R.; Roshni, A.S. Identification and Quantification of Polyphenols from Pineapple Peel by High Performance Liquid Chromatography Analysis. Adv. Zool. Bot. 2020, 8, 431–438. [Google Scholar] [CrossRef]
  77. Vinayagam, R. Preventive effect of Syringic acid on hepatic marker enzymes and lipid profile against acetaminophen-induced hepatotoxicity rats. Int. J. Pharm. Biol. Arch. 2010, 1, 393–398. [Google Scholar]
Figure 1. Pareto plot of the factors on (a) TPC (b) ABTS+ radical scavenging (c) DPPH radical scavenging after combined effect of SSF with ultrasound.
Fermentation 08 00314 g001aFermentation 08 00314 g001b
Figure 2. Scanning electron microscopy of fermented sample (a,b) and fermented samples with ultra-sound treatment (c,d) at 400× (left side) and 1500× (right side) magnifications.
Fermentation 08 00314 g002
Figure 3. Contour plot for the behavior of TPC in the combined process of SSF with ultrasound.
Fermentation 08 00314 g003
Figure 4. Contour plot for the performance of % inhibition by DPPH in the combined SSF process with ultrasound.
Fermentation 08 00314 g004
Figure 5. Contour plot for the performance of percentage inhibition by ABTS in the combined SSF process with ultrasound.
Fermentation 08 00314 g005
Figure 6. Optimization plot for the solid-state fermentation combined with ultrasound.
Fermentation 08 00314 g006
Table 1. Conditions tested in the experimental design and corresponding parameters.
FactorsUnitLevels
(Low) −1(Central) 0(Hight) +1
Temperature°C354555
Ethanol%205080
Timemin203040
Table 2. Results of the parameters evaluated after the solid-state fermentation process combined with ultrasound.
AssayTemperature (°C)Time (min)Ethanol (%)TPC (mg GAE/g d.m)% DPPH Inhibition% ABTS Inhibition
1352020447.5159.1370.21
2552020759.9557.4472.63
3352080422.7059.1362.87
4552080508.4059.8071.83
5354020772.9360.1674.18
6554020746.9758.6571.66
7354080582.2760.4971.60
8554080657.1360.3173.86
9283050503.4159.9569.31
10623050779.9270.2884.64
1145300634.1758.9565.48
124530100273.8156.6661.07
13451350451.5059.4969.77
14454750749.9767.6371.88
15453050688.0866.9169.13
16453050646.1567.6368.87
17453050660.1367.5768.94
18453050572.2868.0867.90
19453050615.2167.6369.77
20453050581.2770.2869.37
Table 3. ANOVA of the response surface model.
SourceValue p
TPC (mg GAE/g d.m.)DPPH (% Inhibition)ABTS (% Inhibition)
Regression
Linear0.0000.2510.001
Temperature0.0030.1940.001
Time0.0010.9630.060
Ethanol0.0010.1220.044
Square0.0510.0010.000
Temperature × Temperature0.3620.0680.000
Time × Time0.0120.0000.006
Ethanol × Ethanol0.9380.0190.172
Interaction0.2840.9730.067
Temperature × Time0.4940.6570.077
Temperature × Ethanol0.0770.9350.070
Time × Ethanol0.9820.9640.206
R-squared (%)88.8380.7490.29
RMSE44.362.011.43
Table 4. Models proposed to the response variables (TPC, DPPH and ABTS).
VariableModelEquation
TPC (mg GAE/g d.m)Y = −231 + 4.5 T + 29 t +9.19 E+ 0.158 (T2) – 0.506 (t2) + 0.0015 (E2) – 0.157 (T × t) – 0.1455 (T × E) – 0.0017 (t × E)(3)
DPPH (% inhibition)Y = −7.6 + 1.365 T + 2.276 t + 0.292 E – 0.01536 (T2) – 0.04120 (t2) −0.002317 (E2) + 0.0046 (T × t) – 0.00028 (T × E) – 0.00015 (t × E)(4)
ABTS (% inhibition)Y = 116.4 – 2.577 T + 0.215 t + 0.076 E + 0.02961 (T2) – 0.01883 (t2) + 0.000874 (E2) + 0.01415 (T × t) – 0.00485 (T × E) + 0.00323 (t × E)(5)
Table 5. Evaluation of the models with the evaluated parameters.
VariablesExperimental DataPredicted Data
T (°C)Time (min)Ethanol (%)TPCABTS %DPPH %TPCABTS %DPPH %
352020447.5170.2159.13469.9769.6458.28
552020759.9572.6357.44723.5775.1159.66
354020422.762.8759.13332.1963.2657.52
554020508.471.8359.8522.9974.4060.74
352080772.9374.1860.16723.8373.1361.13
552080746.9771.6658.65803.4372.7962.17
354080582.2771.660.49584.0170.6360.19
554080657.1373.8660.31600.8175.9563.07
283050503.4169.3159.95559.2973.9761.83
623050779.9284.6470.28789.1383.1465.46
451350634.1765.4858.95626.9965.9356.12
454750273.8161.0756.66337.6563.1956.24
45300451.569.7759.49494.1070.0860.13
4530100749.9771.8867.63770.5074.2964.45
453050688.0869.1366.91628.5570.0068.08
453050646.1568.8767.63628.5570.0068.08
453050660.1368.9467.57628.5570.0068.08
453050572.2867.968.08628.5570.0068.08
453050615.2169.7767.63628.5570.0068.08
453050581.2769.3770.28628.5570.0068.08
Table 6. Results of TPC and antioxidant activity for the control, fermented, sonicated and fermented with ultrasound samples.
SampleTPC (mg GAE/g d.m)DPPH (% Inhibition)ABTS (% Inhibition)
Control30 ± 0.93 a37.02 ± 0.27 a61.55 ± 2.2 a
Fermented52.7 ± 2.02 b61.46 ± 1.05 b77.39 ± 1.18 b
Ultrasonic570.35 ± 0.26 c39.66 ± 1.03 c67.16 ± 1.8 c
Fermented and Ultrasonic866.26 ± 2.13 d63.53 ± 2.02 b80.06 ± 1.02 b
Means that do not share a letter are significantly different.
Table 7. Minimum quantification level (MQL = 2MQL), retention time (tR) and results of the determination of phenolic compounds in extracts by UHPLC-ESI + Obitrap-MS.
CompoundtR (min)MQL * (mg/kg)Concentration (mg/kg)
Theobromine2.60.1<0.1
Theophylline2.80.1<0.1
Epigallocatechin2.90.1<0.1
Catechin3.00.1<0.1
Epicatechin3.20.1<0.1
p-Hydroxybenzoic acid3.20.1<0.1
Caffeine3.10.1<0.1 *
Caffeic acid3.20.17.0
Vanillic acid3.20.12.6
Epigallocatechin gallate3.20.1<0.1
p-coumaric acid3.60.12.6
Epicatechin gallate3.60.1<0.1 *
Ferulic acid3.70.12.1
Quercetin4.50.10.2
Rosmarinic acid4.02.016.9
Cyanidin3.80.10.1
Luteolin4.40.1<0.1 *
Kaempferol4.90.1<0.1 *
Trans-cinnamic acid3.70.4<0.4
Naringenine4.80.1<0.1 *
Pelargonidine3.60.1<0.1 *
Apigenin4.80.1<0.1 *
Pinocembrin5.80.1<0.1 *
Carnosic acid7.30.4<0.4
Ursolic acid8.60.1<0.1
Cyanidin 3-rutinoside3.00.1<0.1
Pelargonidin 3-glucoside3.10.1<0.1
Quercetin 3-glucoside3.60.10.5
Kaempferol 3-glucoside3.80.10.1
Rutin3.50.10.5
Gallic acid1.80.10.1
* Detected below the limit of quantification and above the limit of detection.
Publisher’s Note: MDPI stays neutral with regard to jurisdictional claims in published maps and institutional affiliations.

