
Evaluation of Observed and Future Climate Change Projection for Uttarakhand, India, Using CORDEX-SA


 , ,
, ,  and
and 
Abstract
1. Introduction
2. Materials and Methods
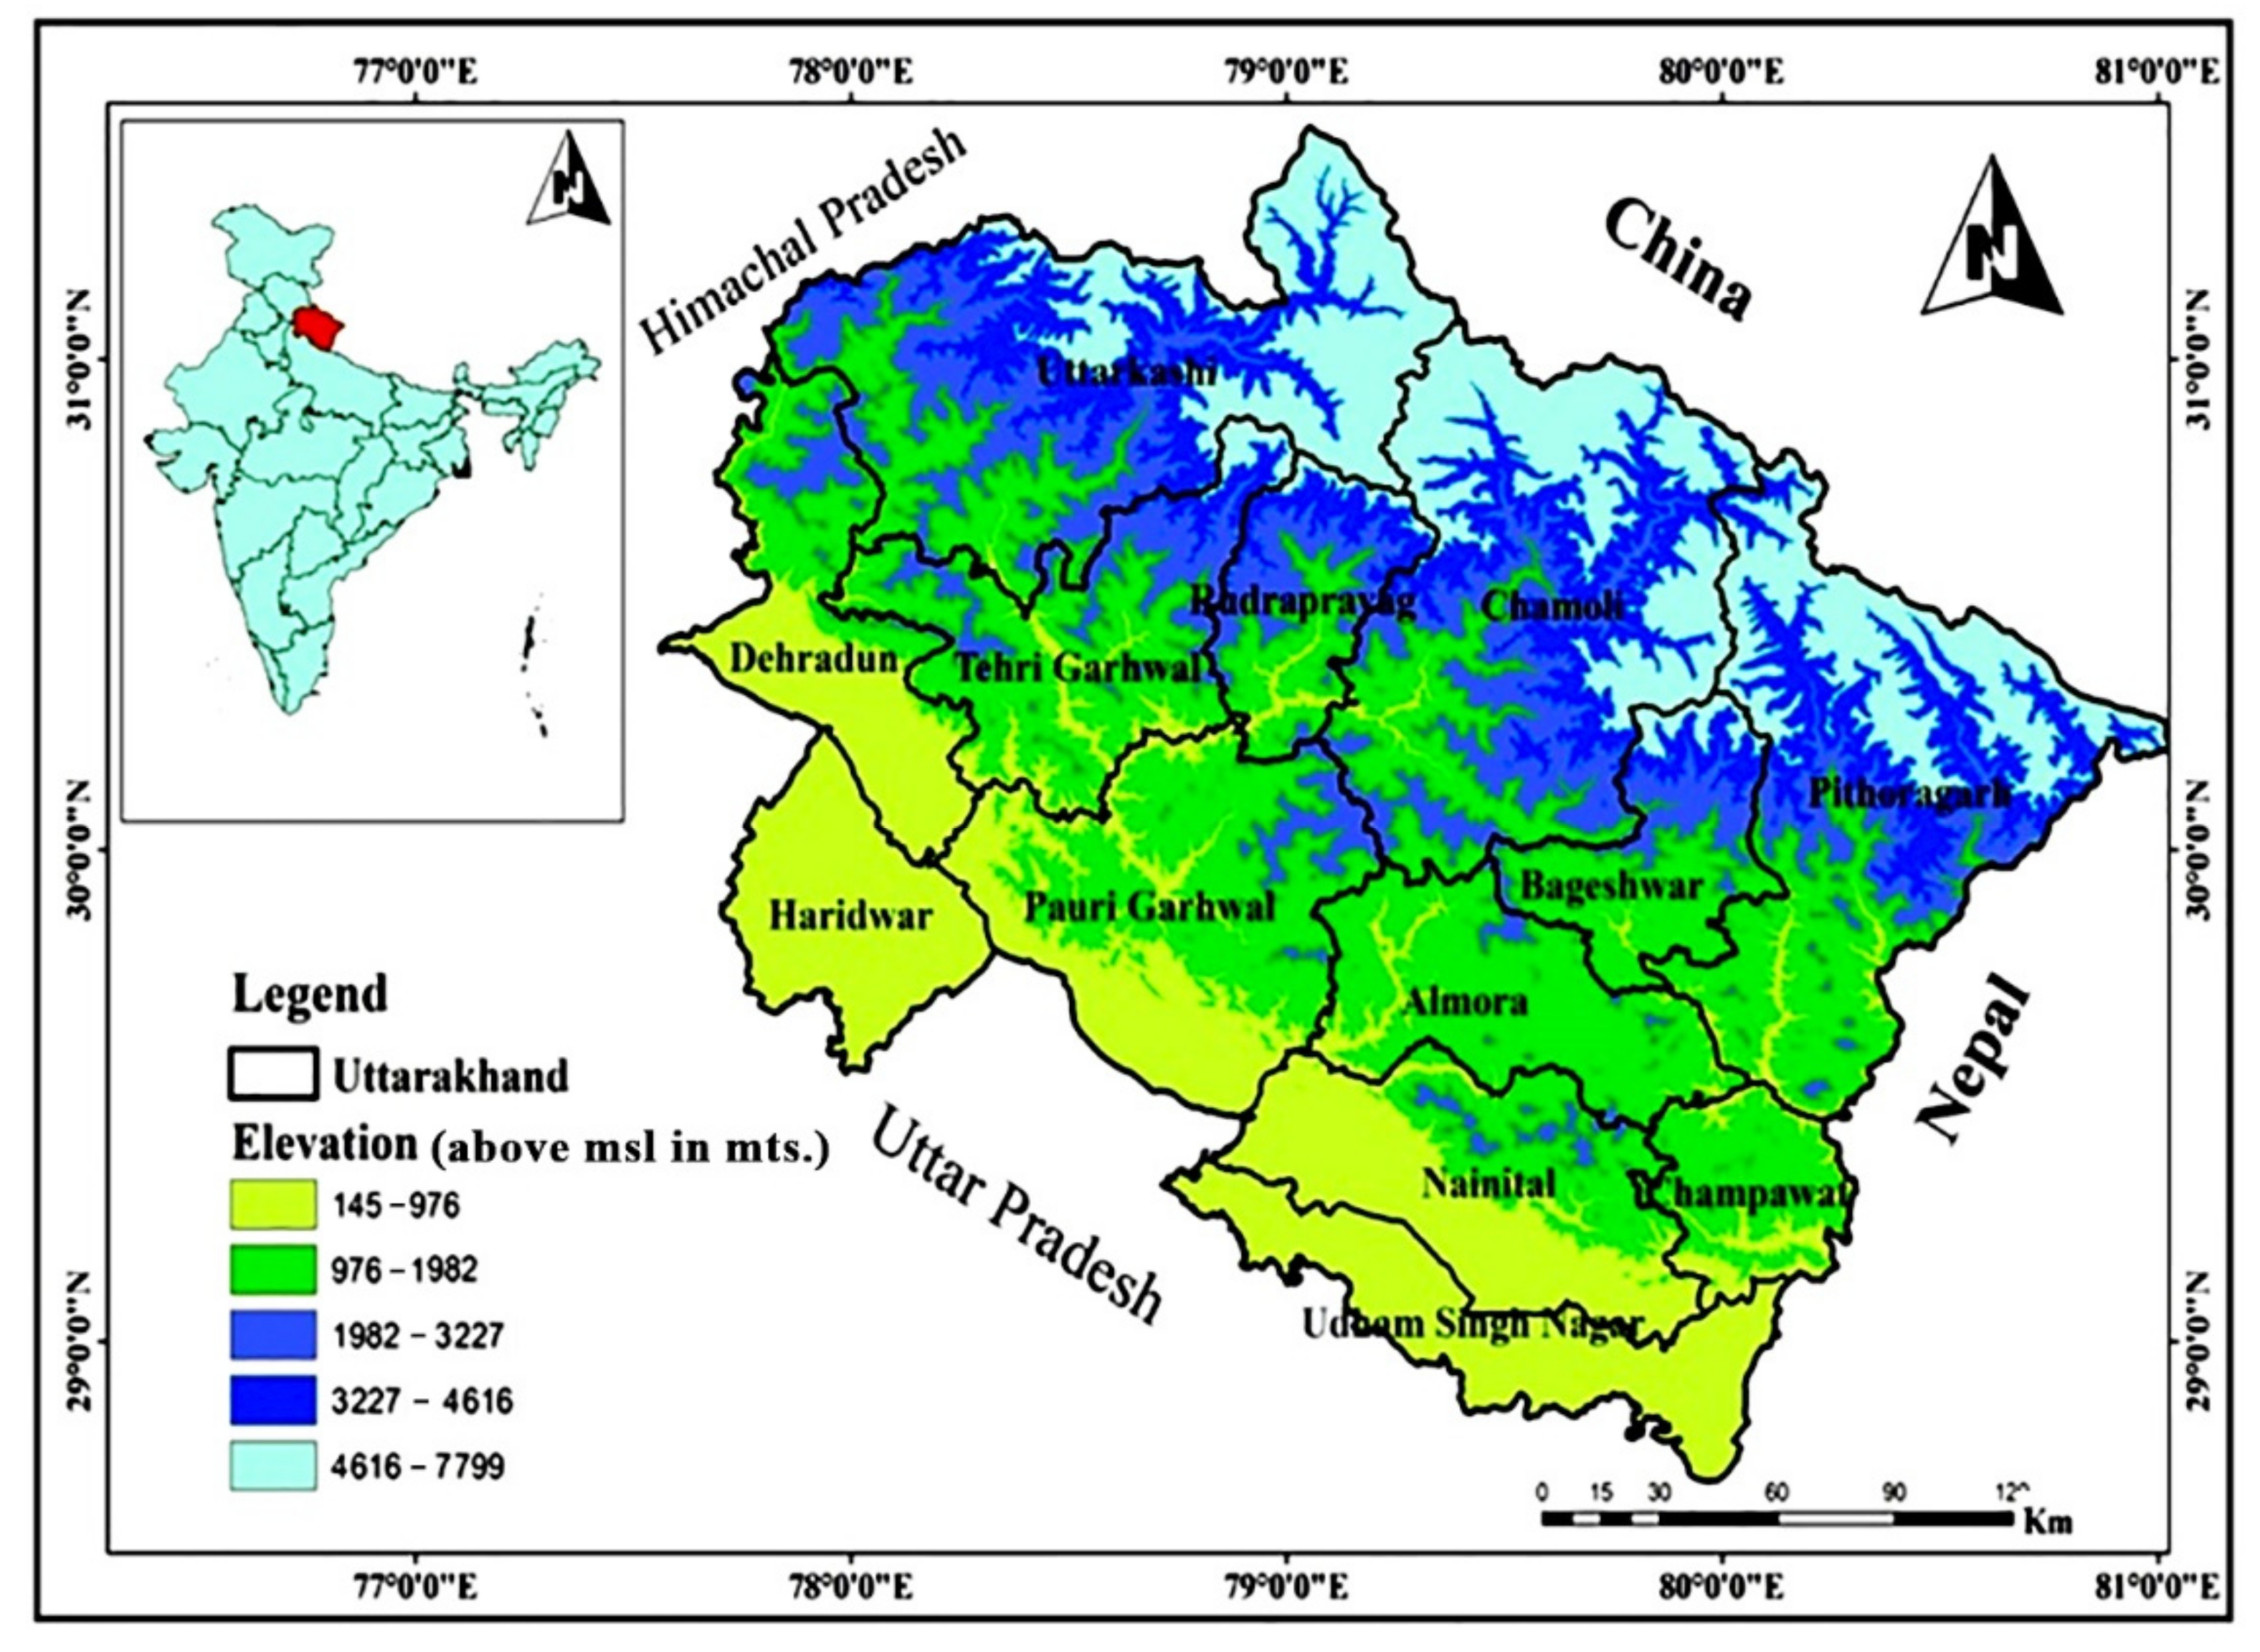
2.1. Study Area
2.2. Data
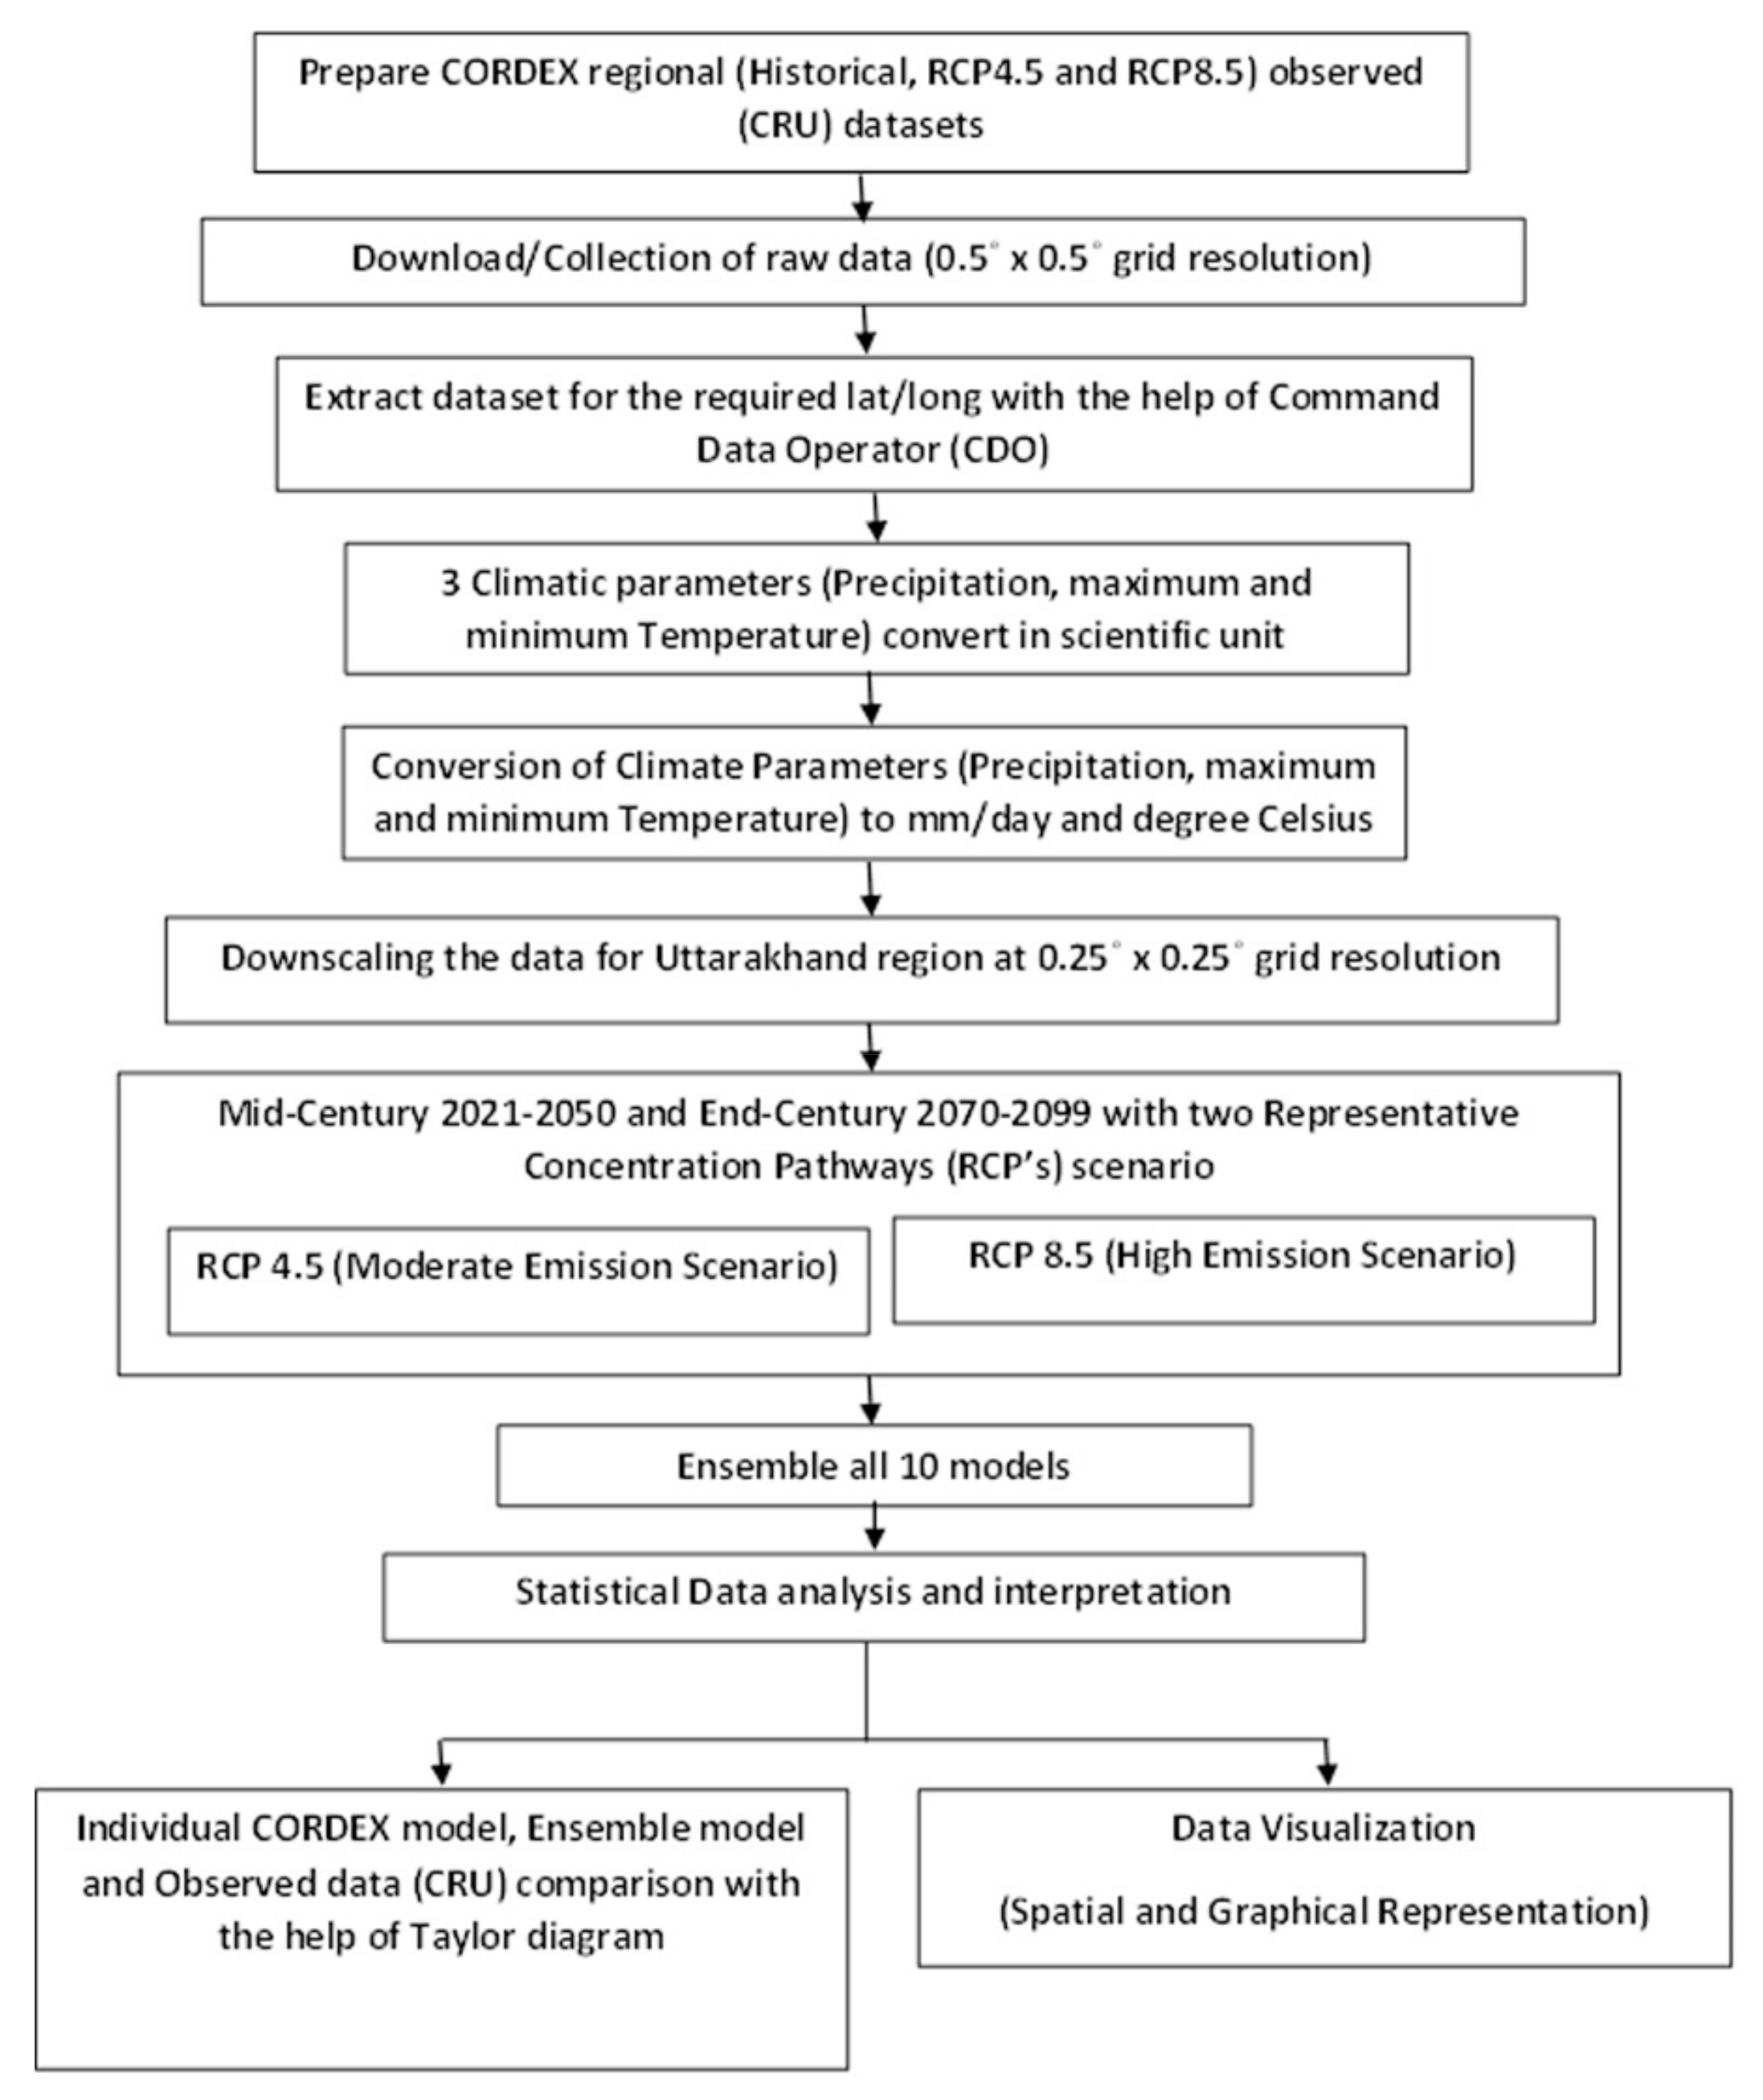
2.3. Methods
3. Results and Discussion
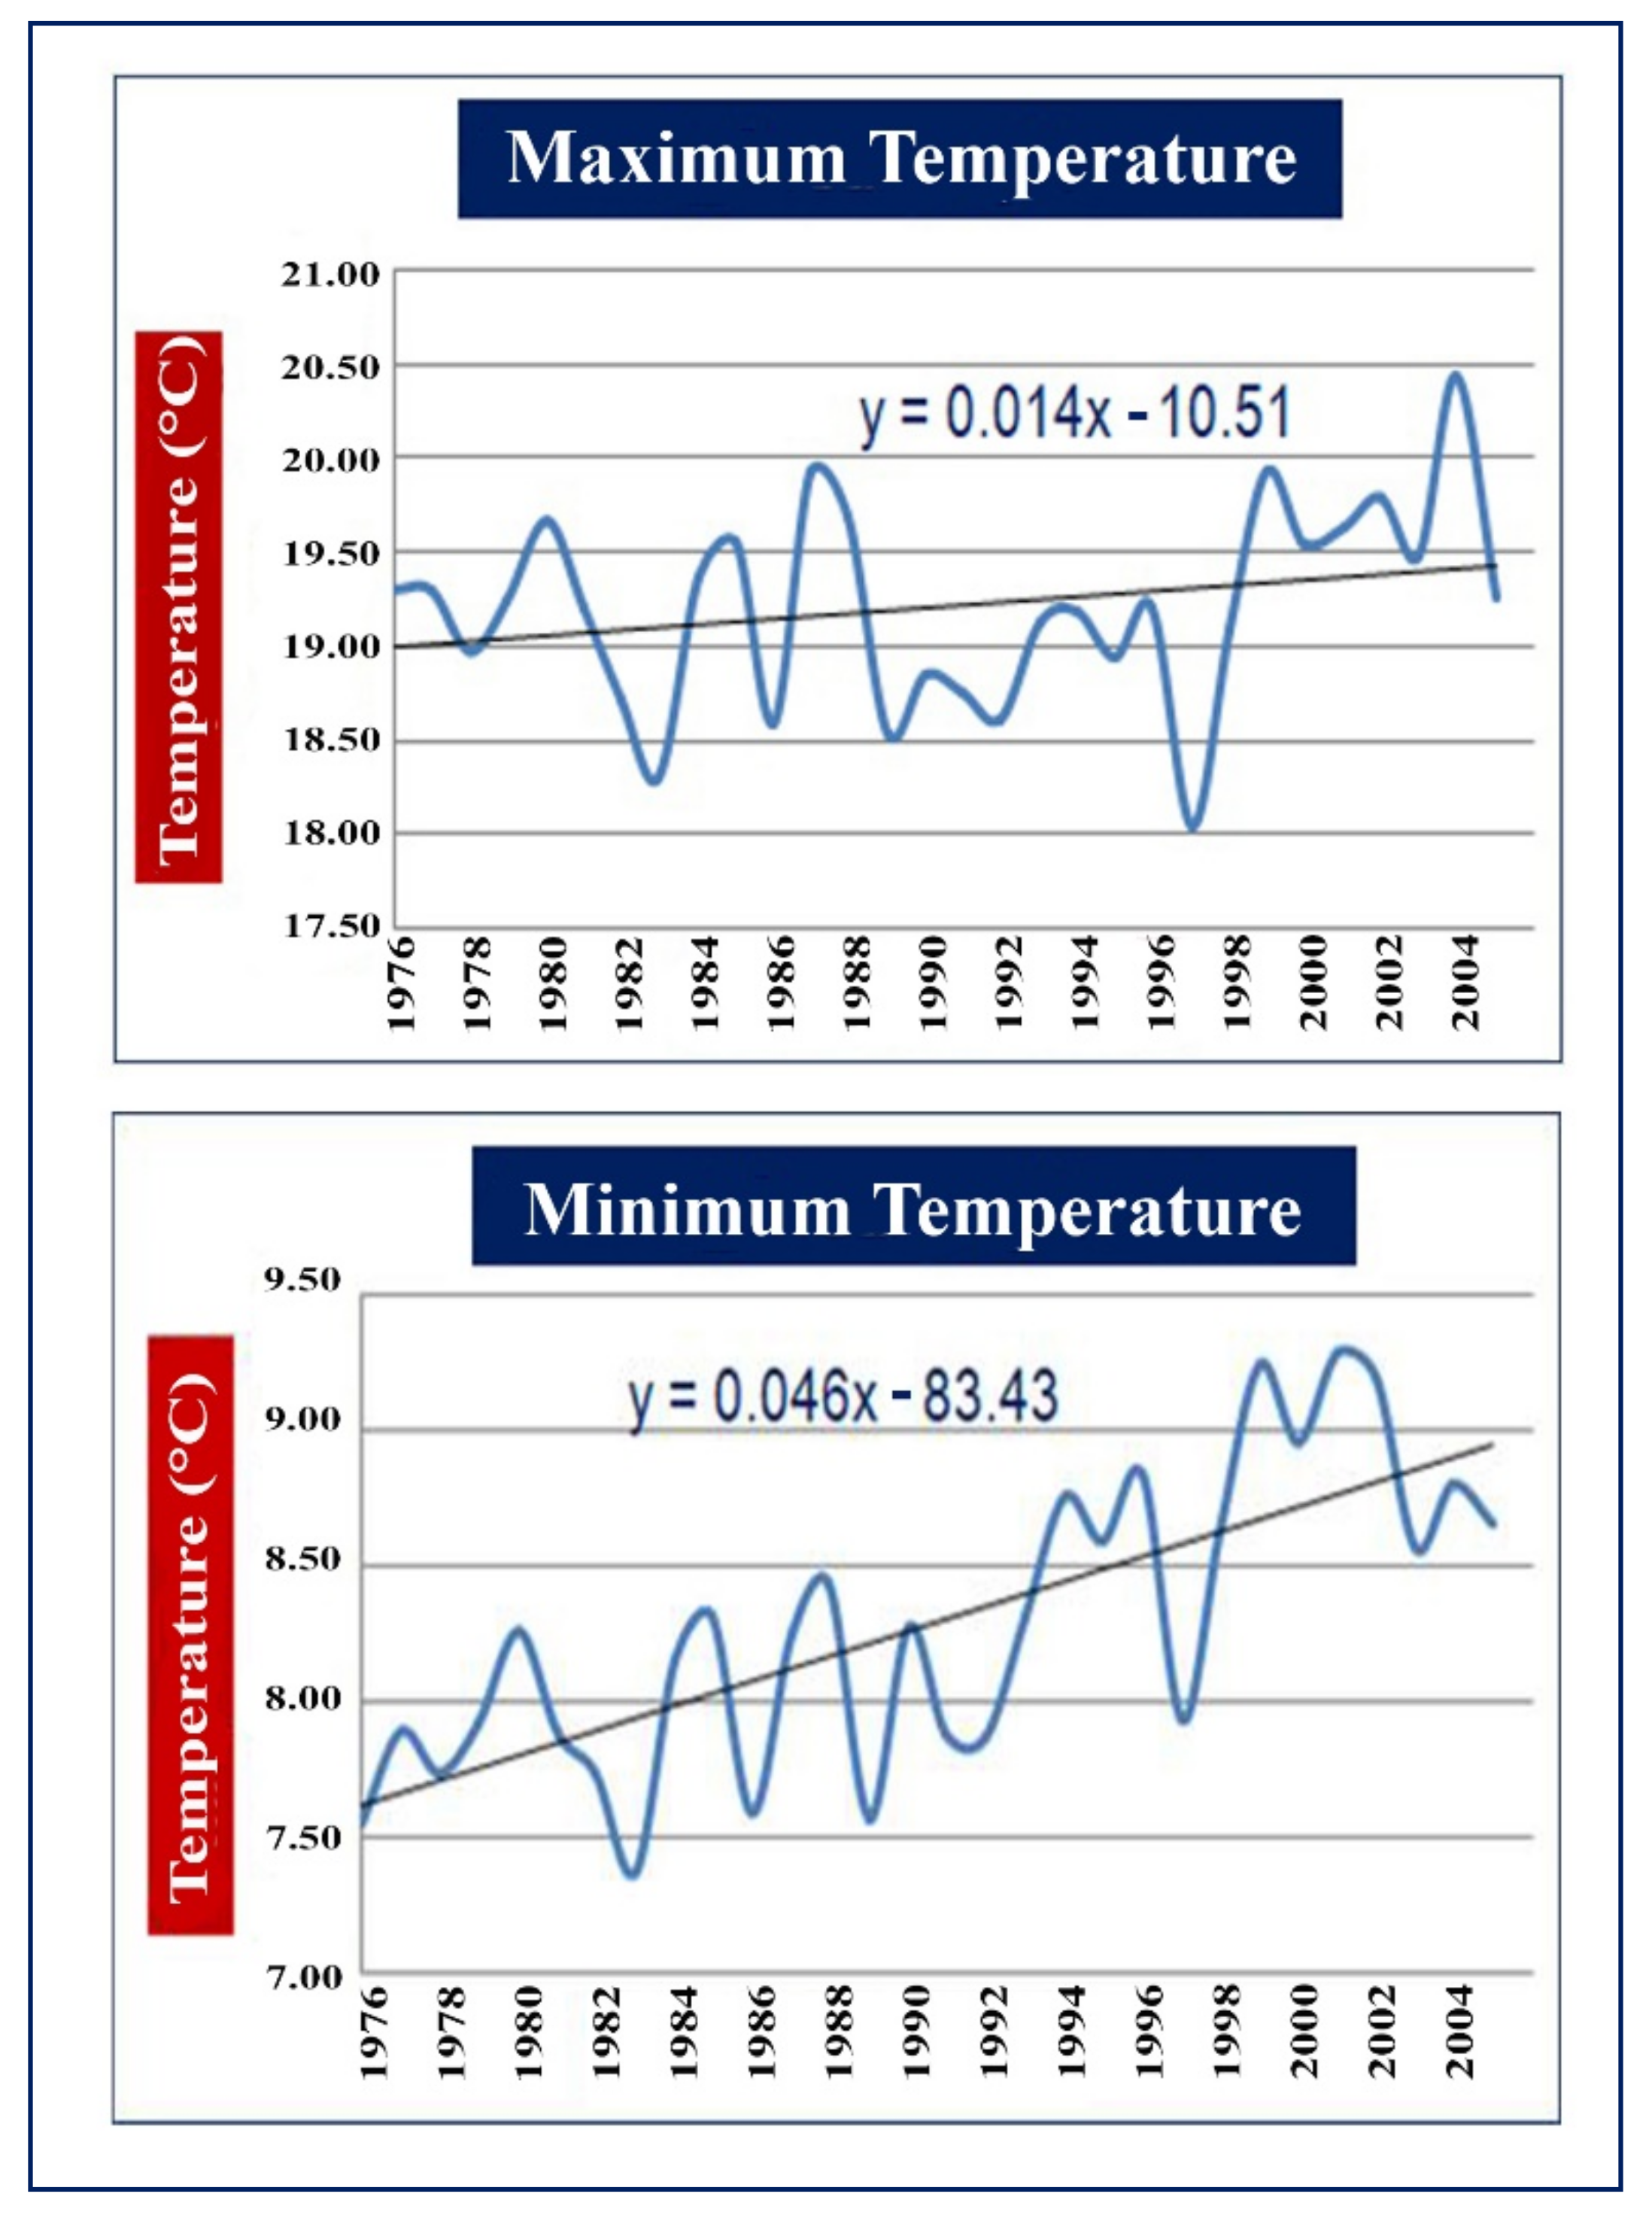
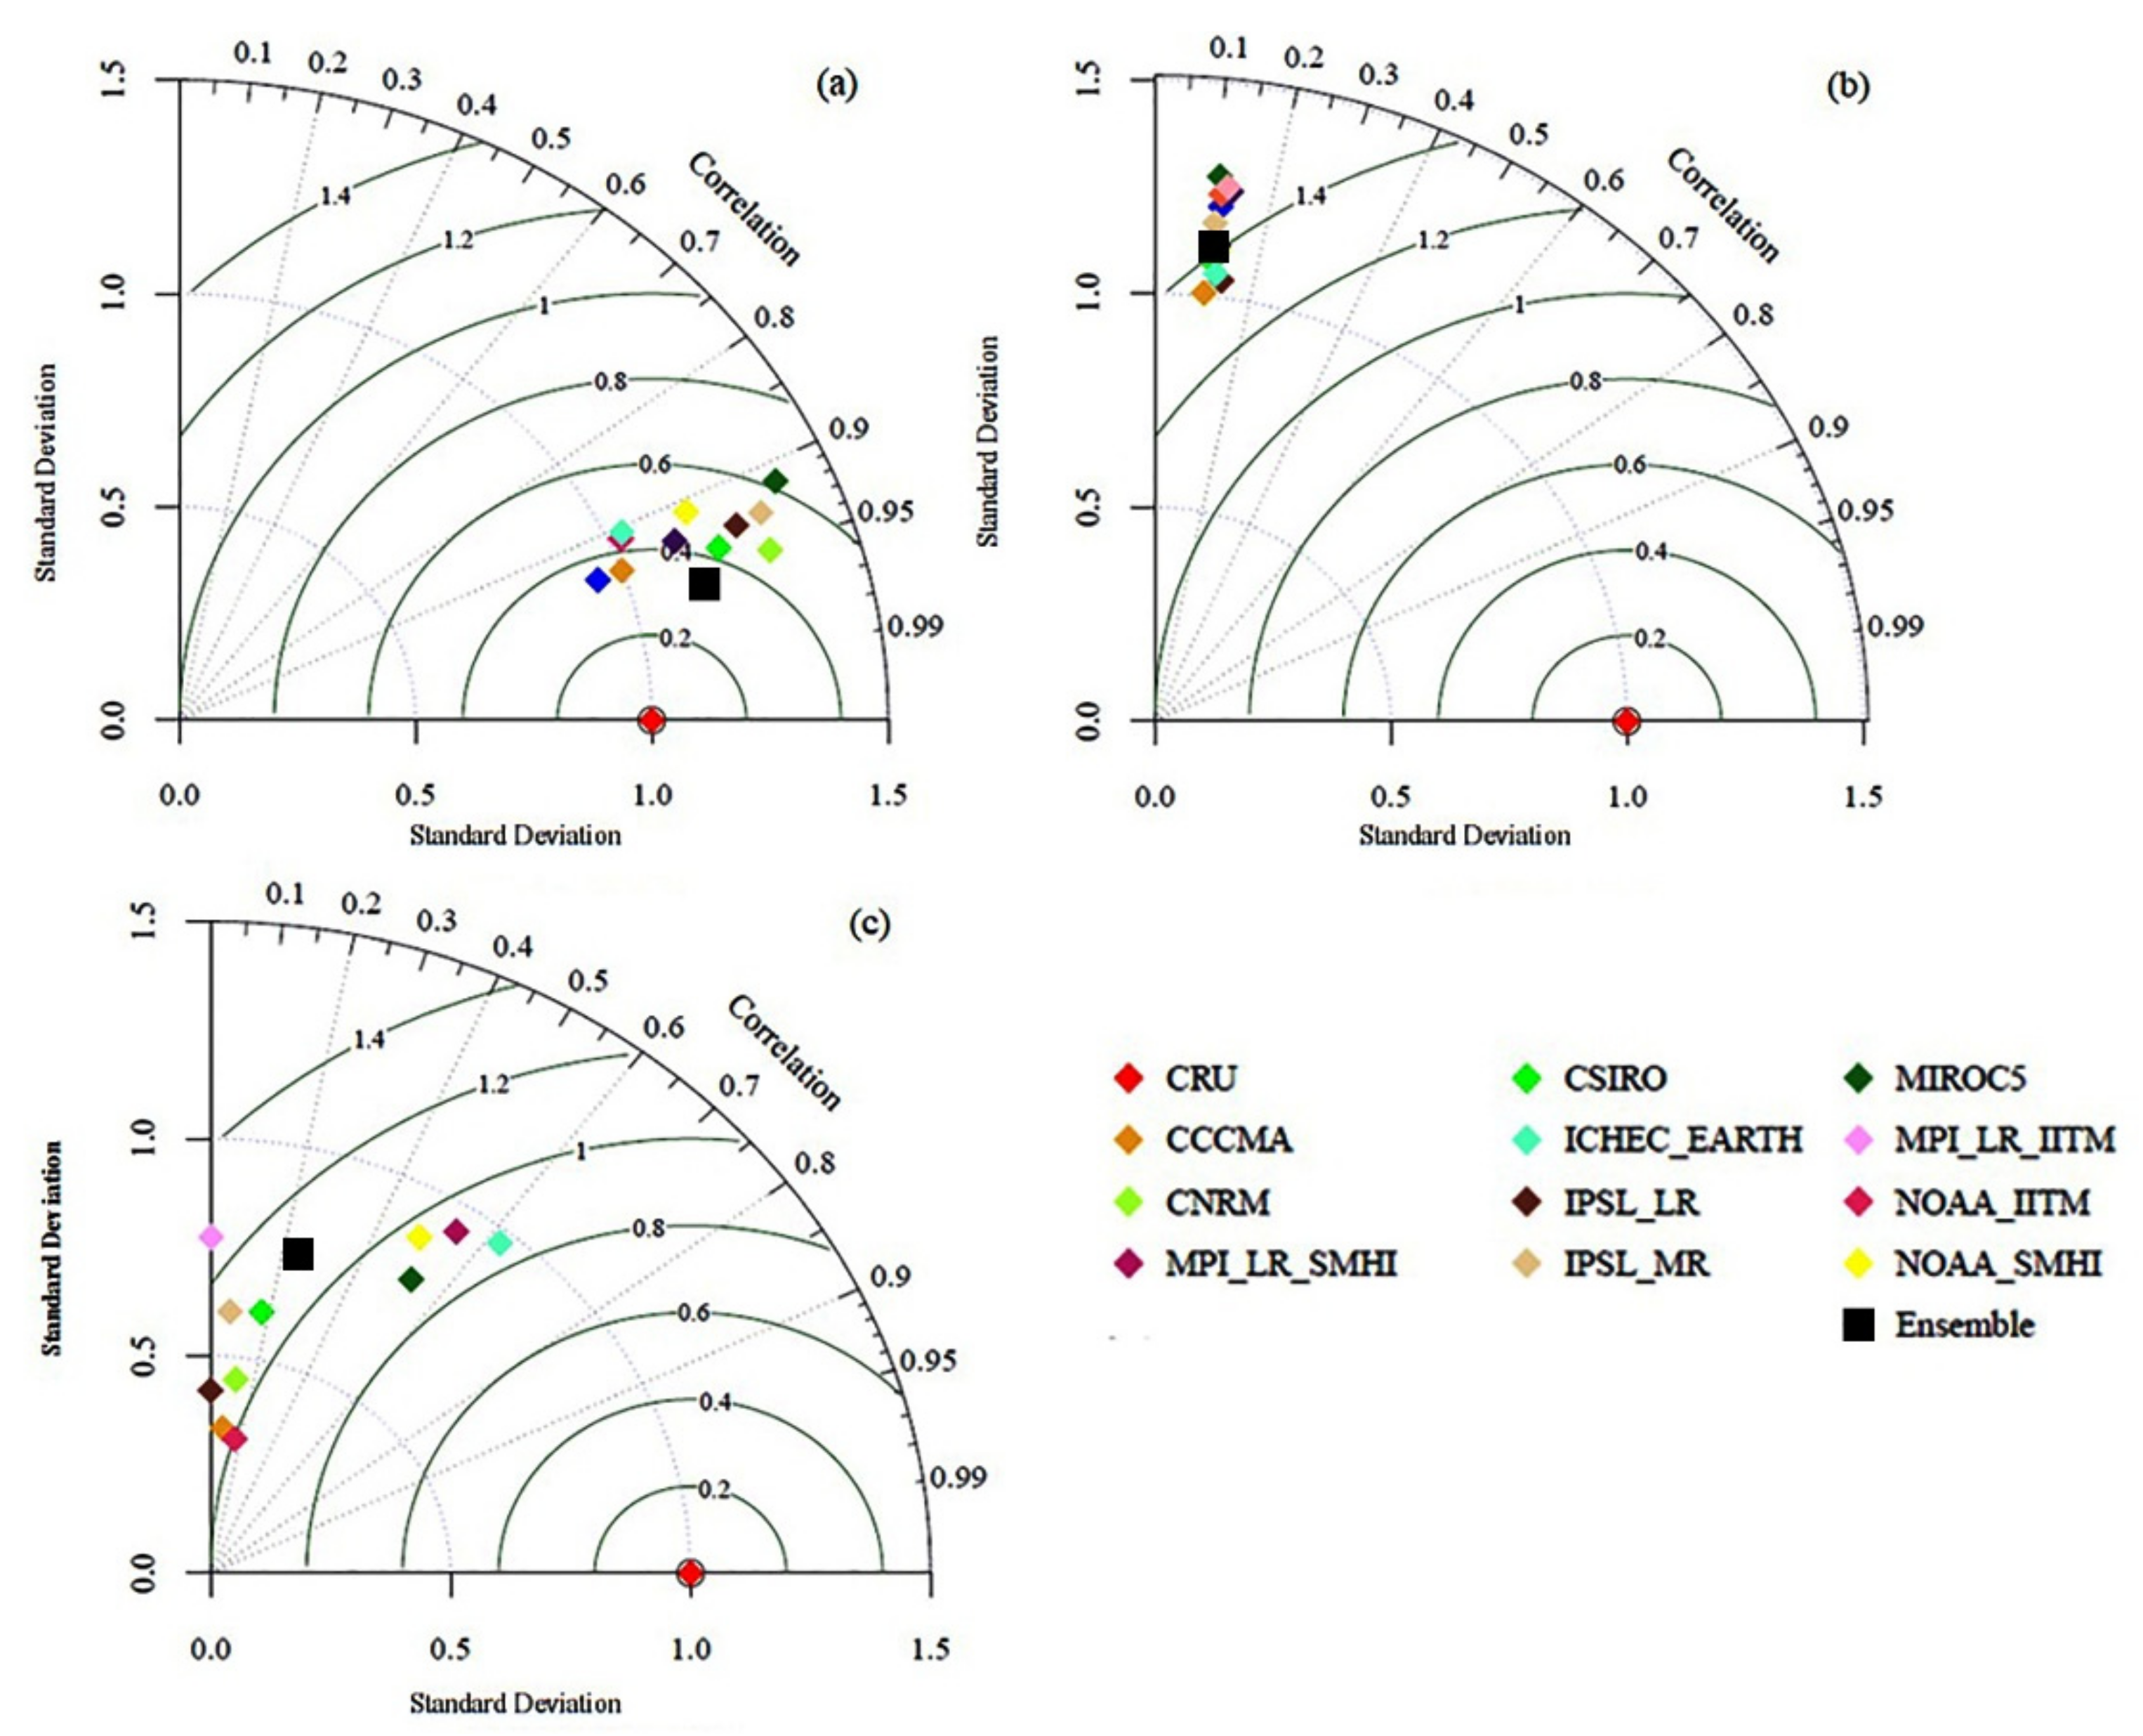
3.1. Intercomparison of Historical Data (CRU and CORDEX-SA)
3.2. CORDEX-SA and Future Projections
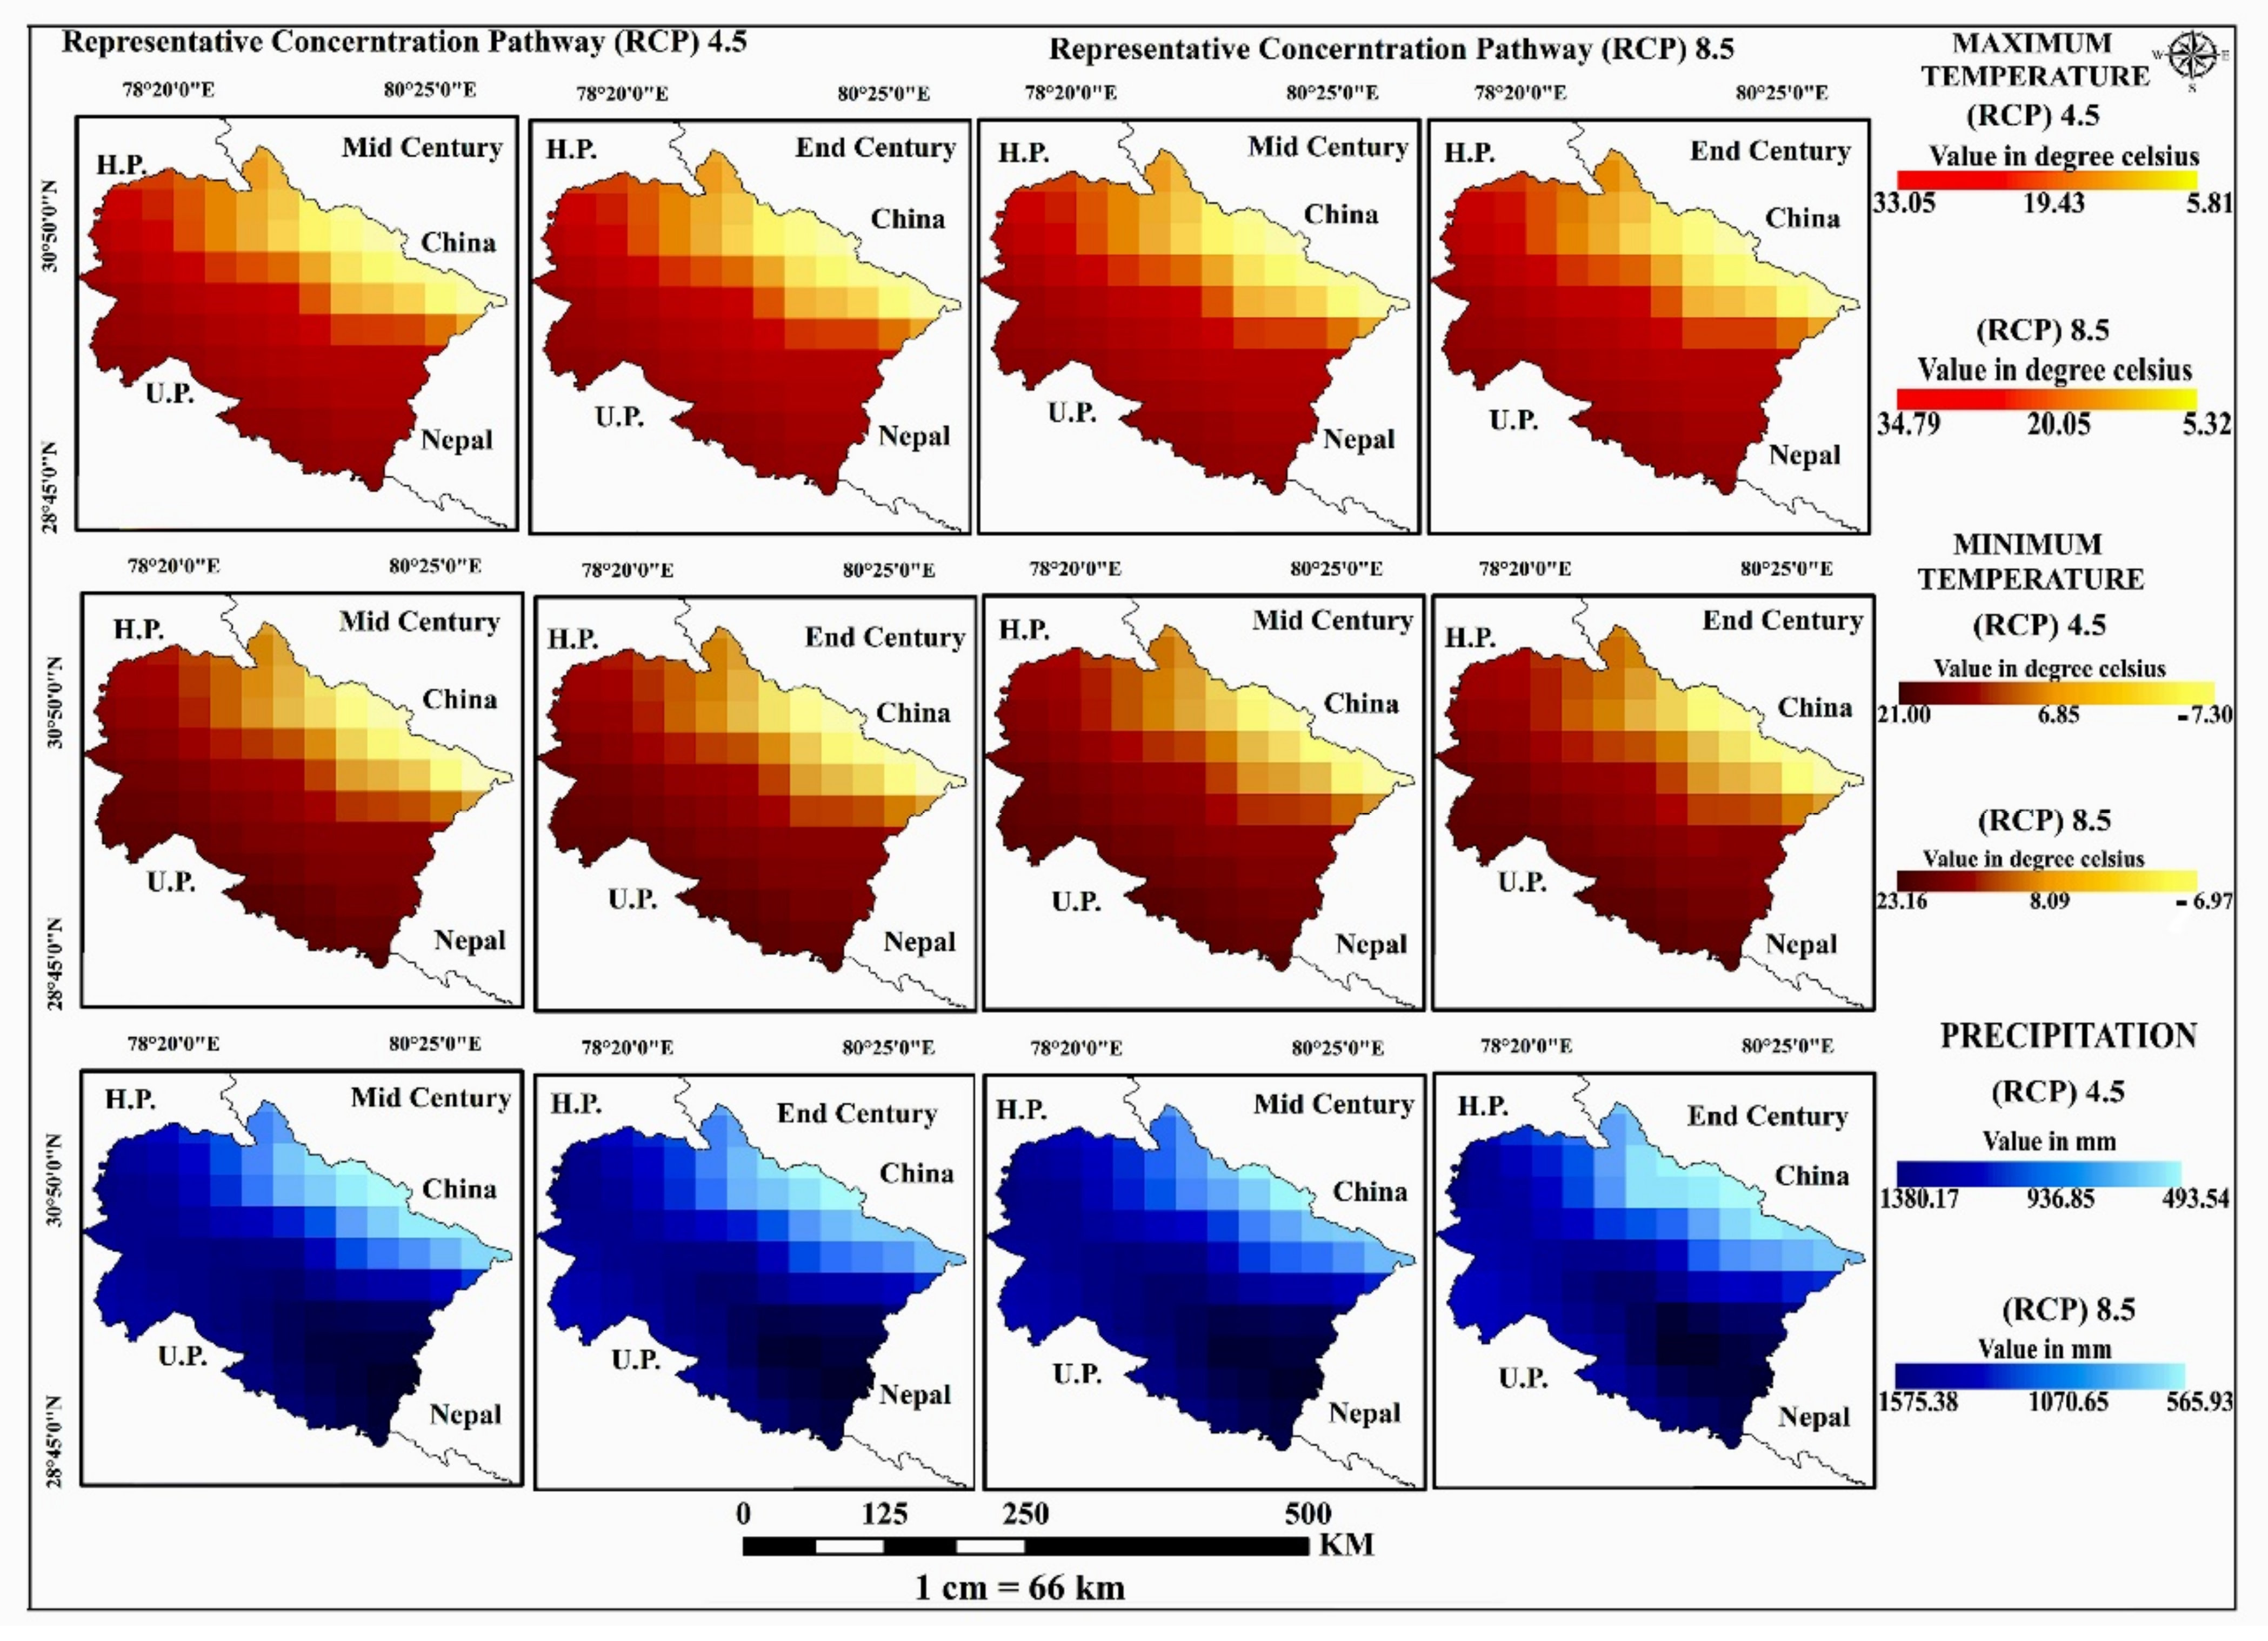
3.2.1. Annual Projections
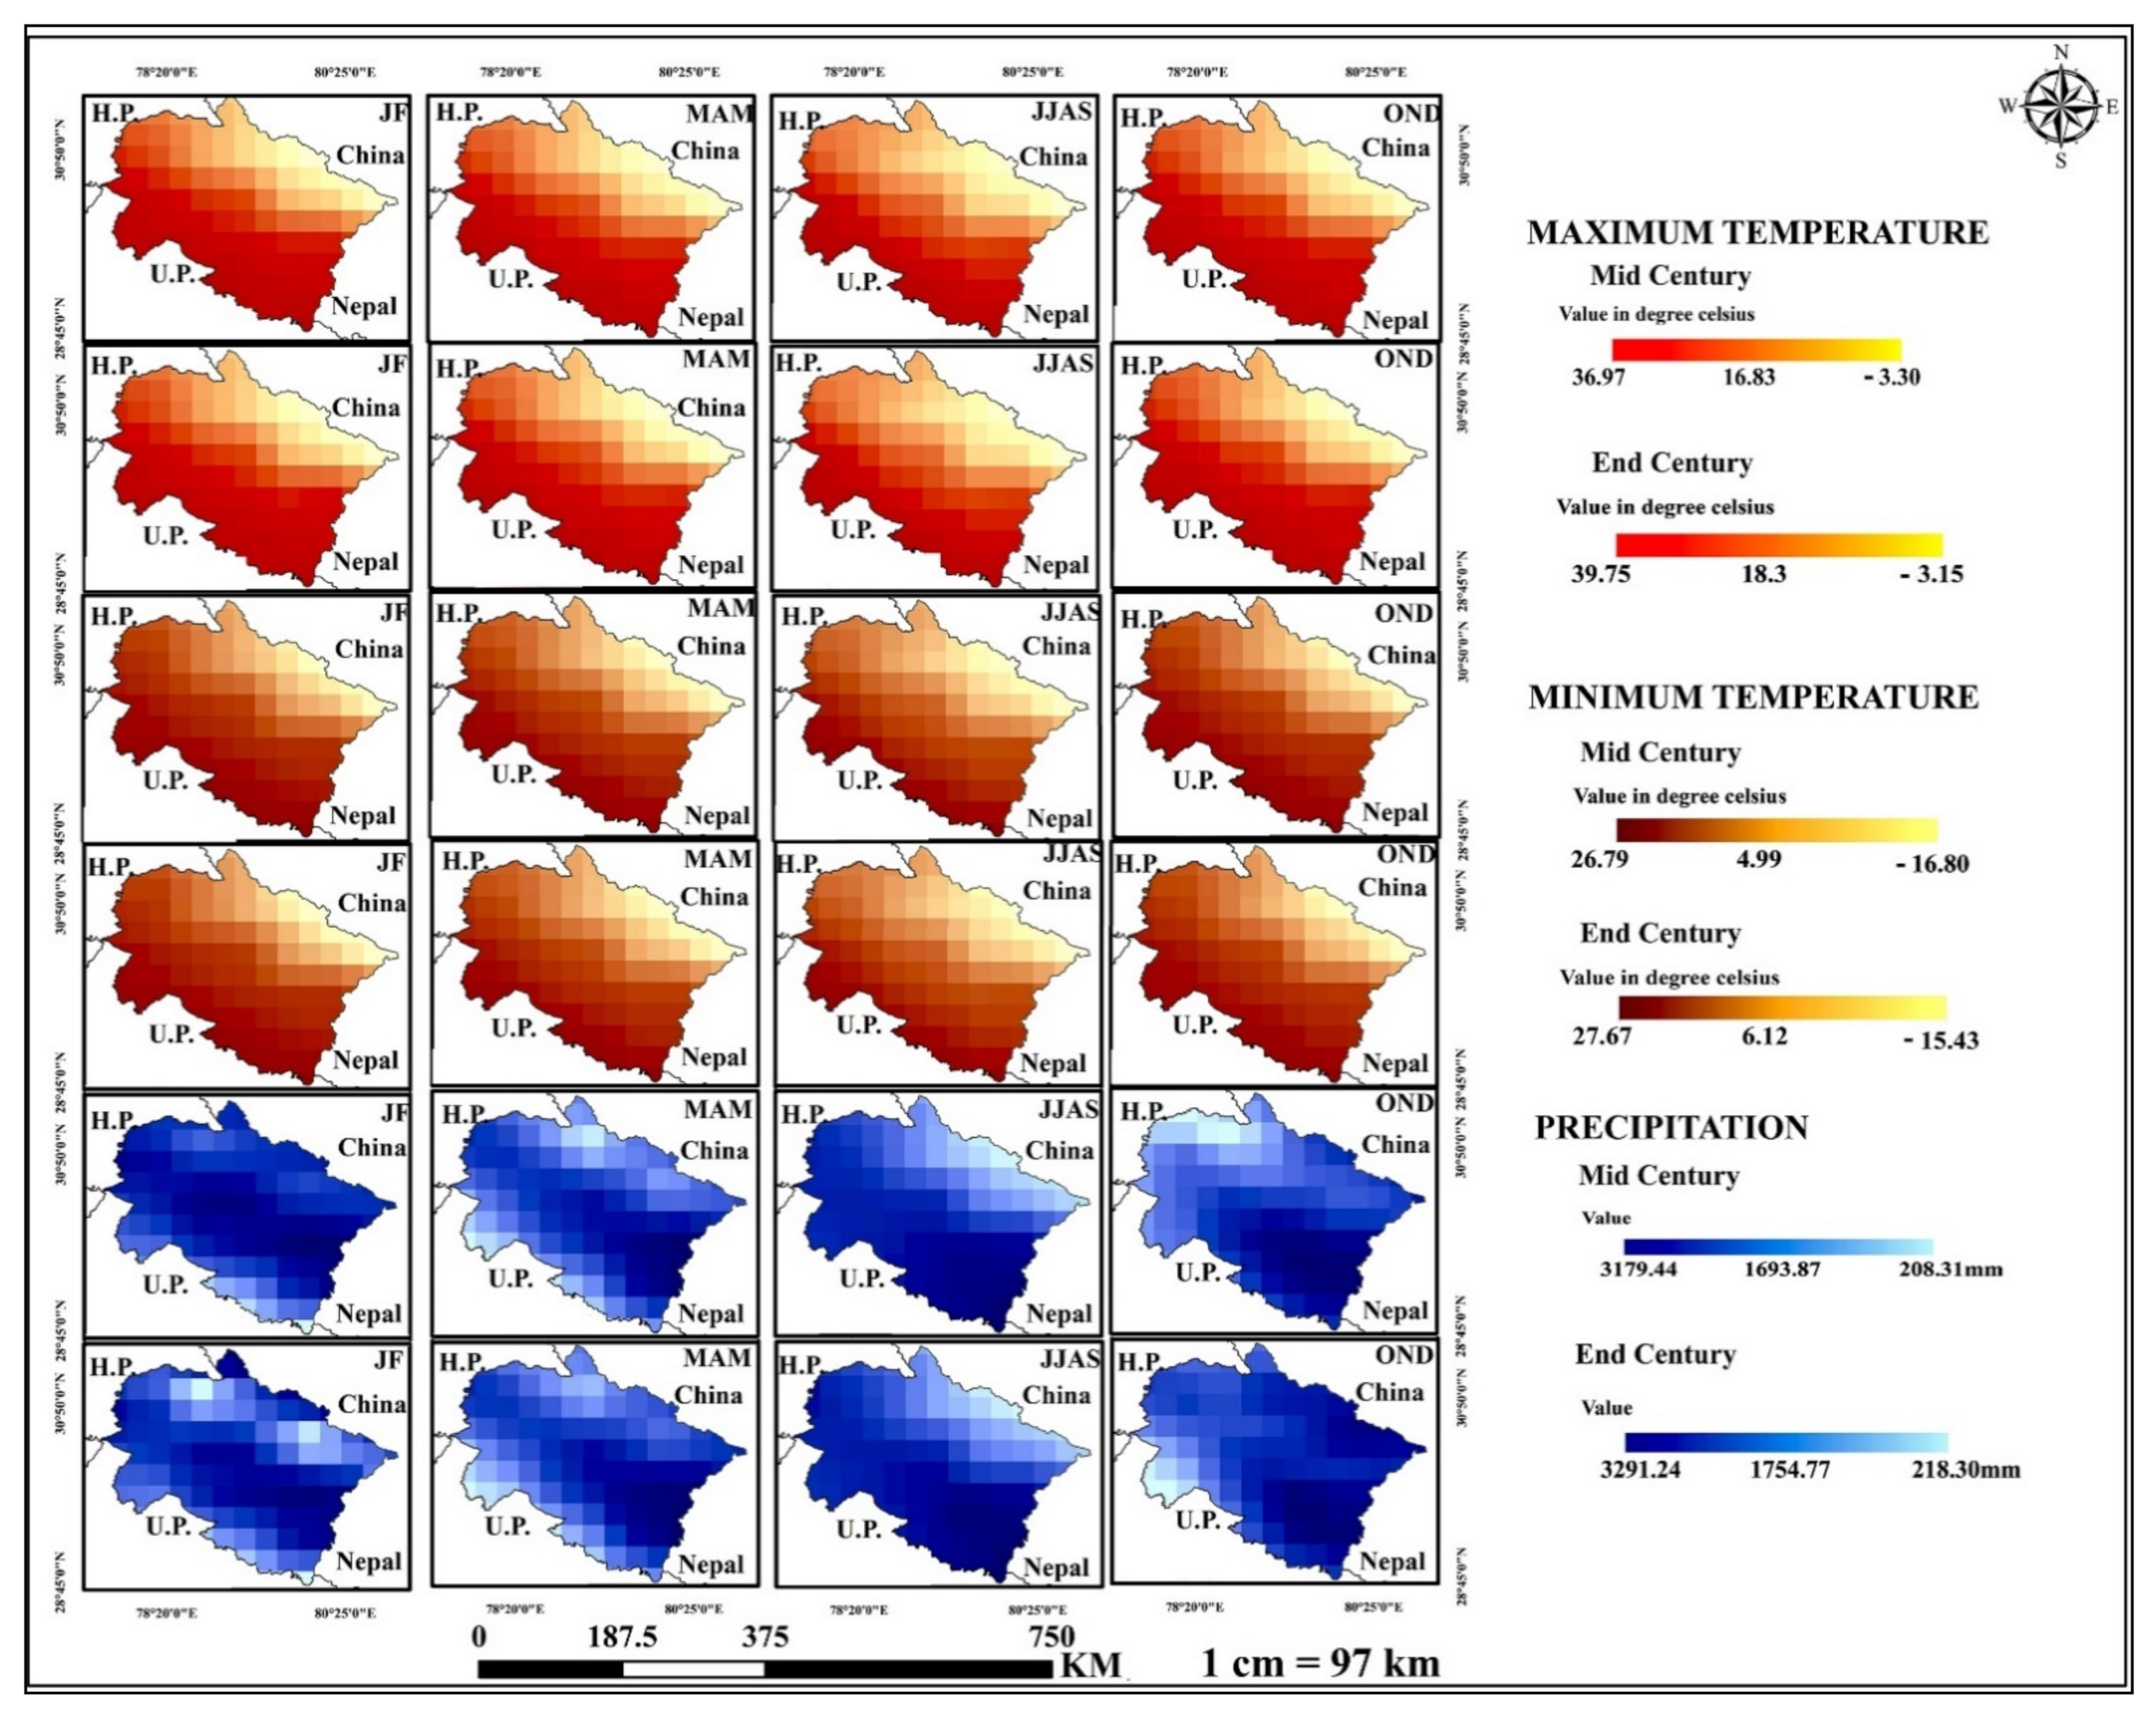
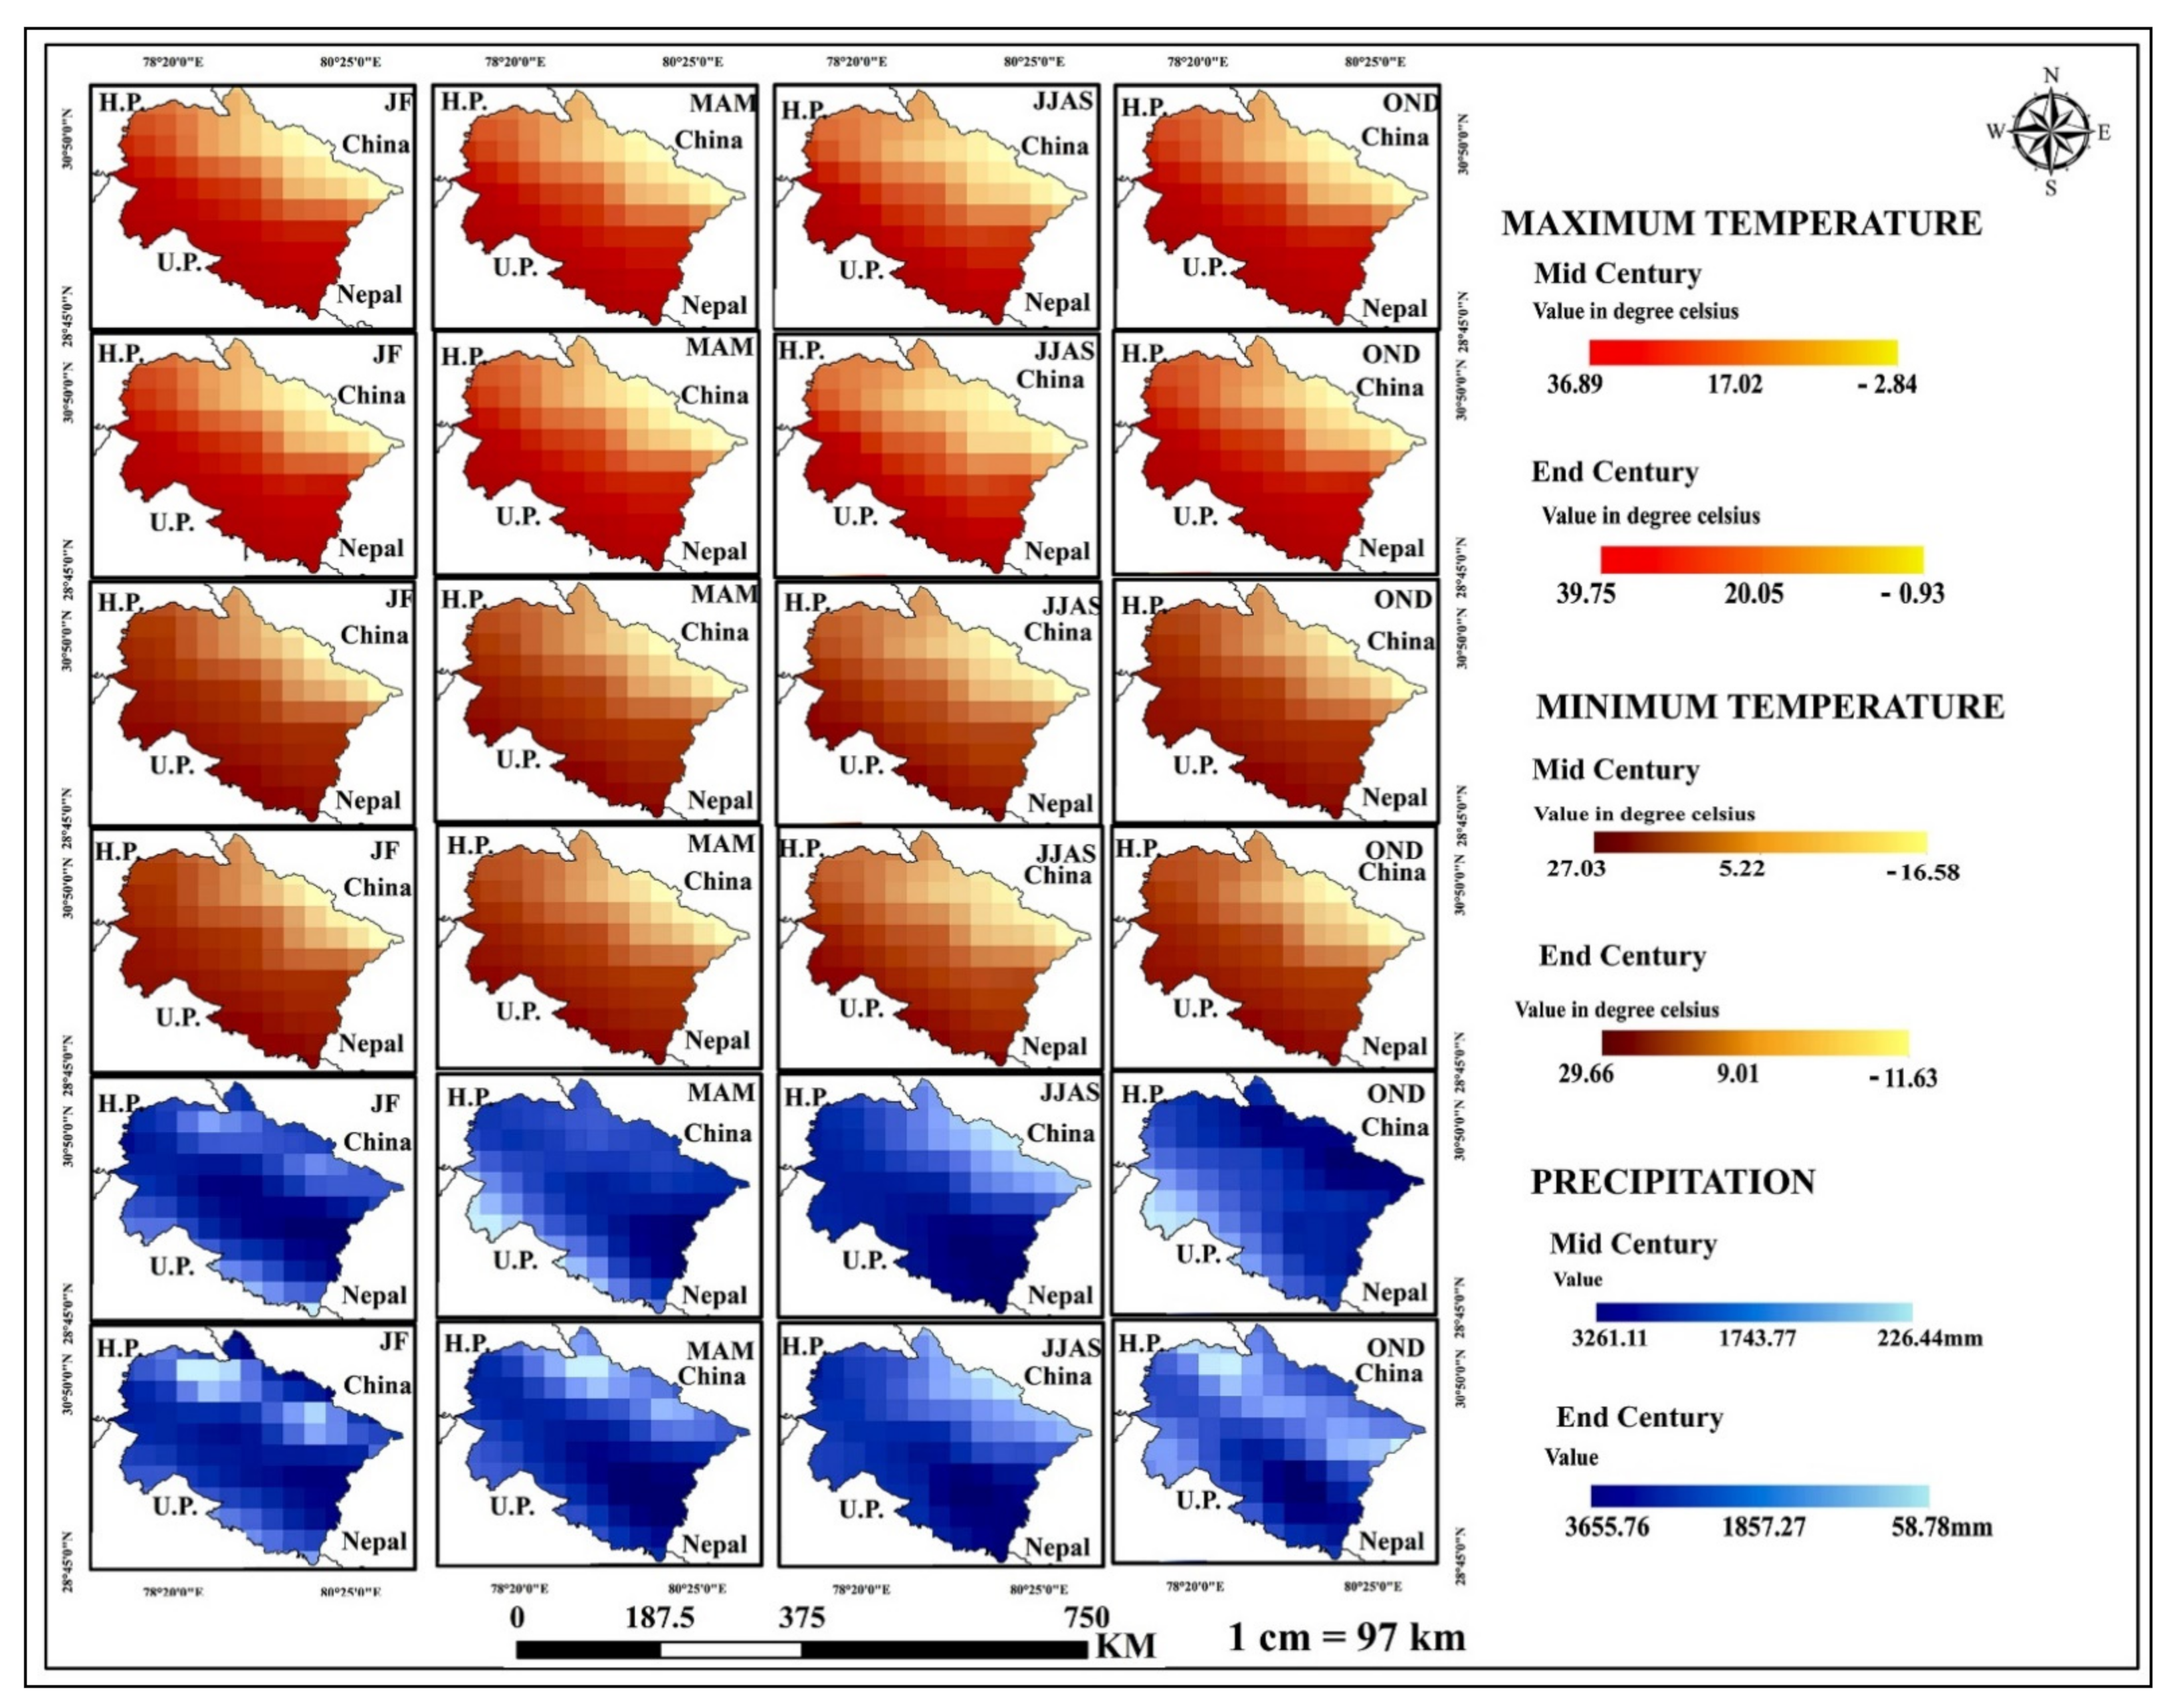
3.2.2. Seasonal Projections
3.3. Variability of Projected Annual Precipitation and Temperature
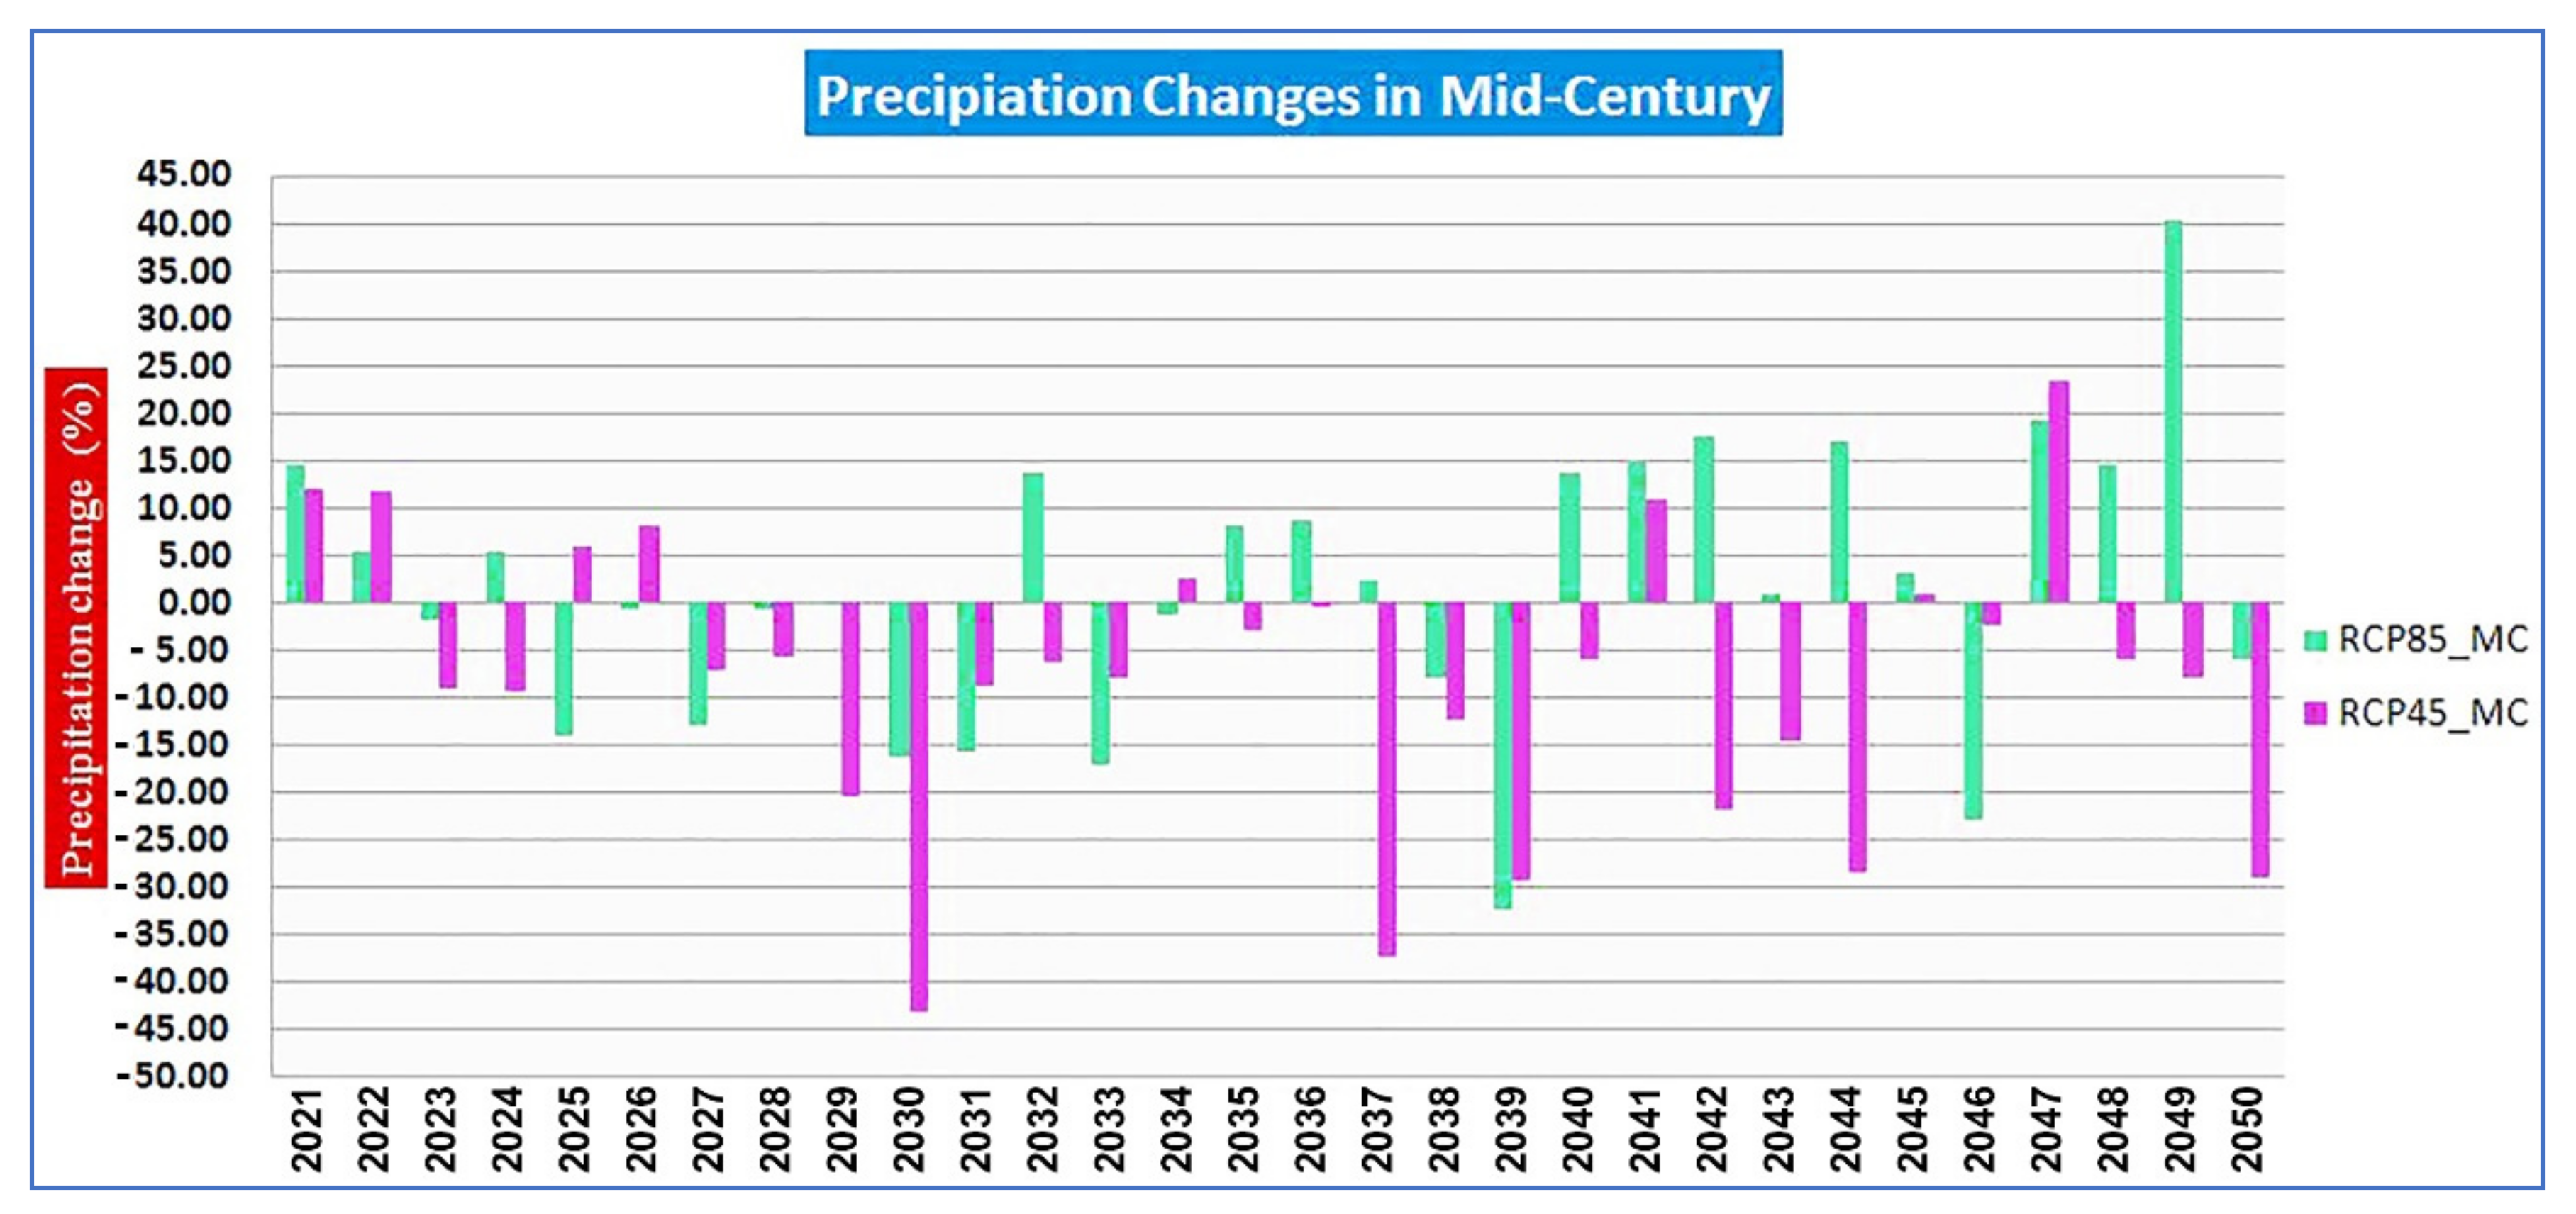
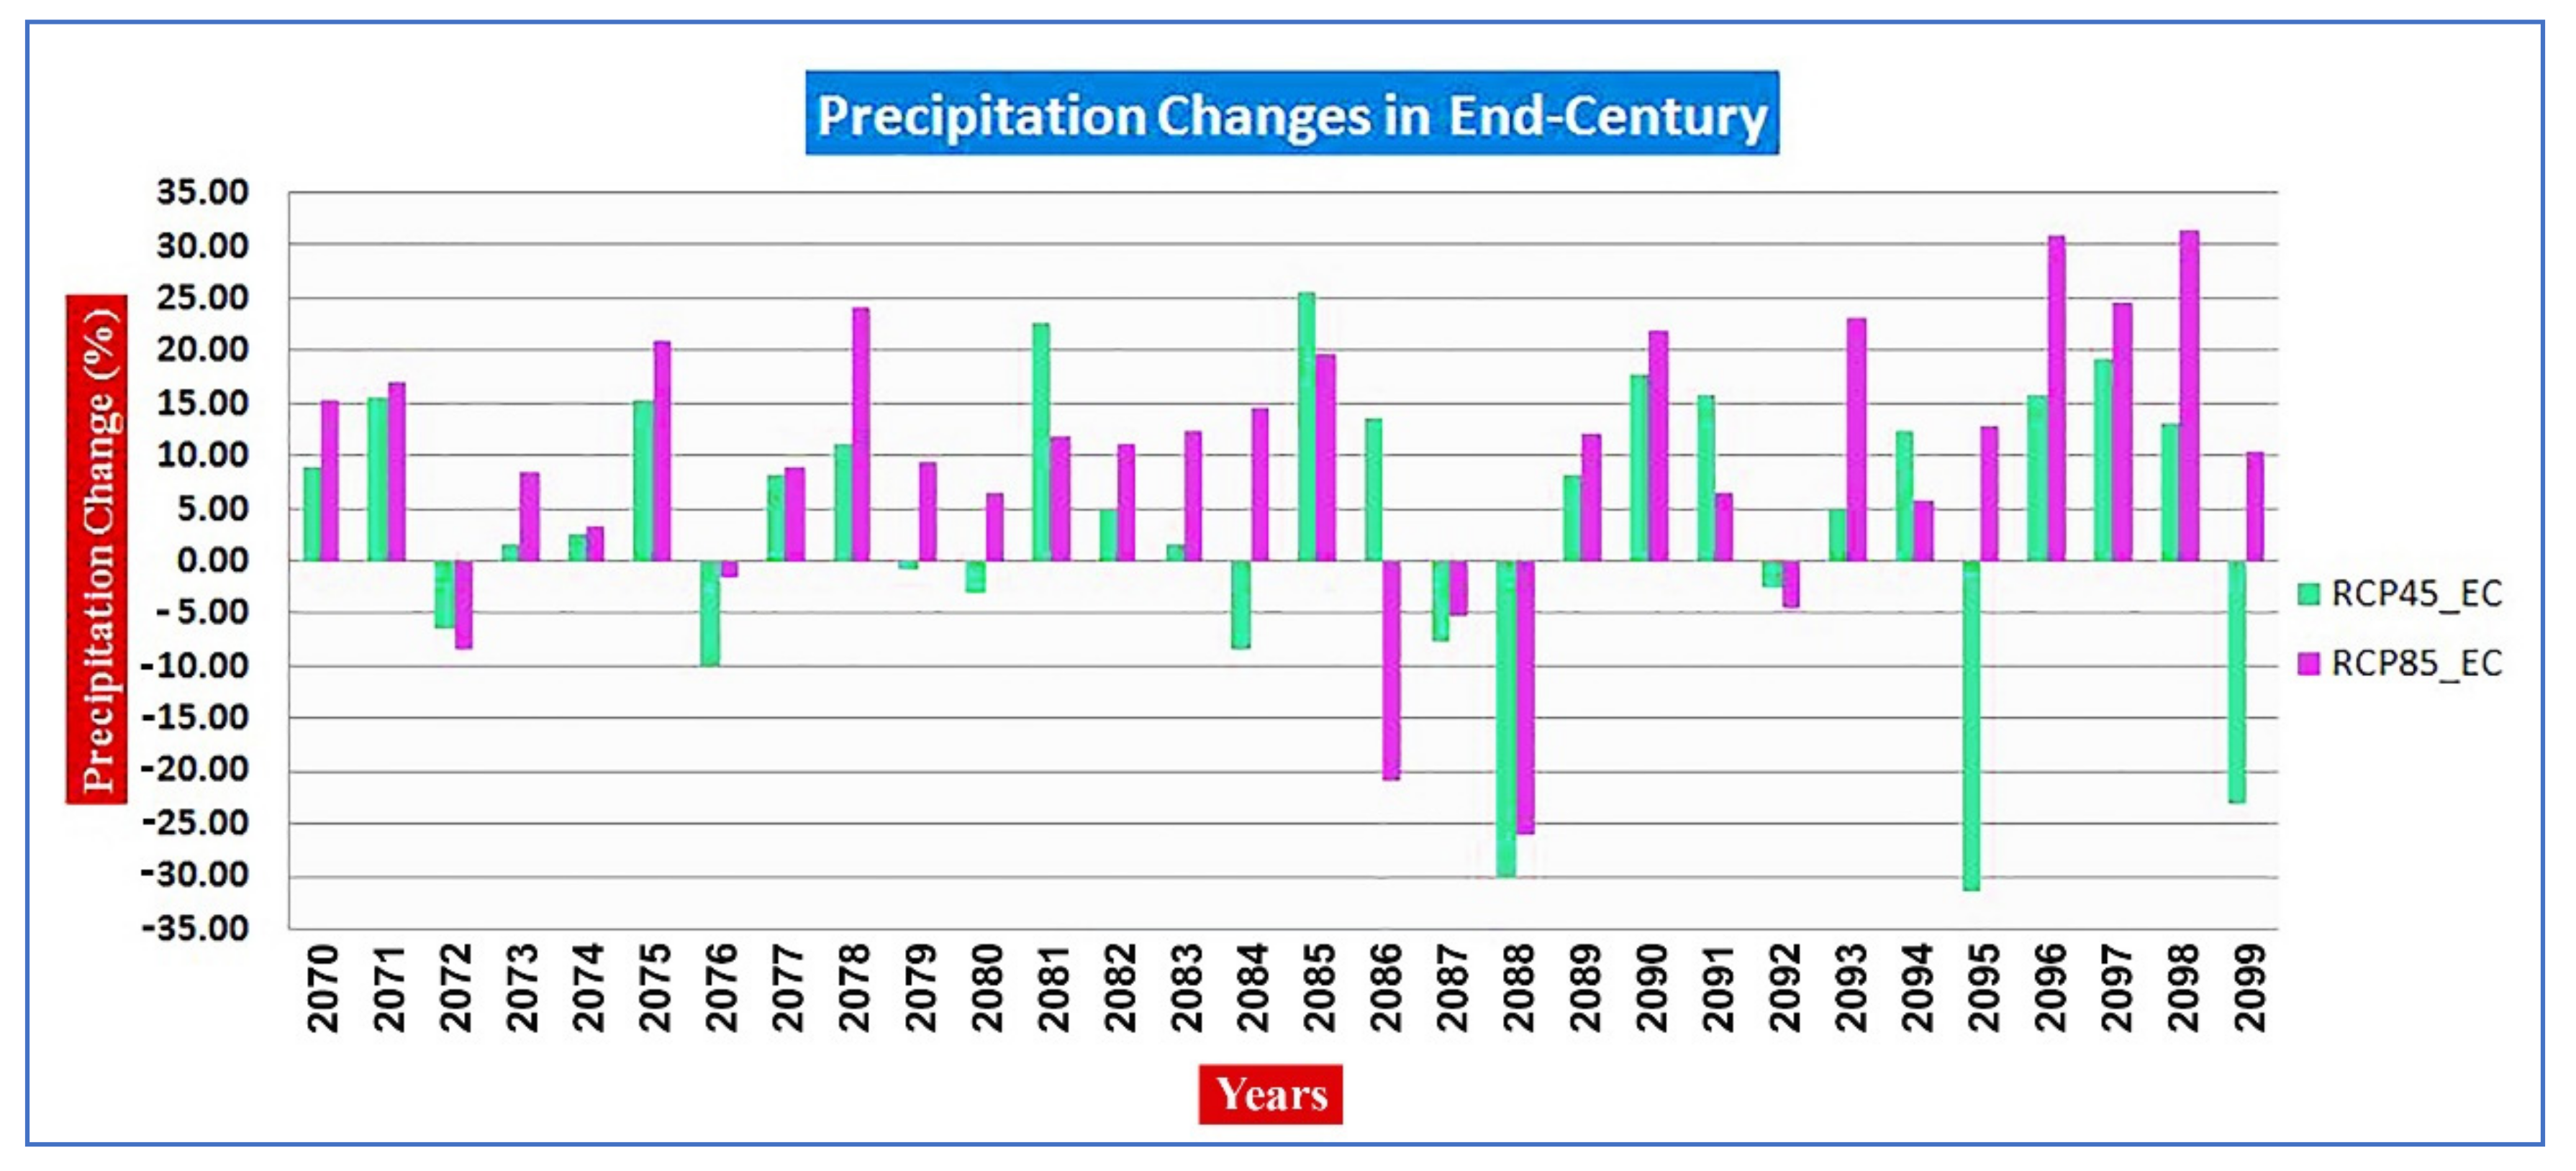
3.3.1. Precipitation Changes
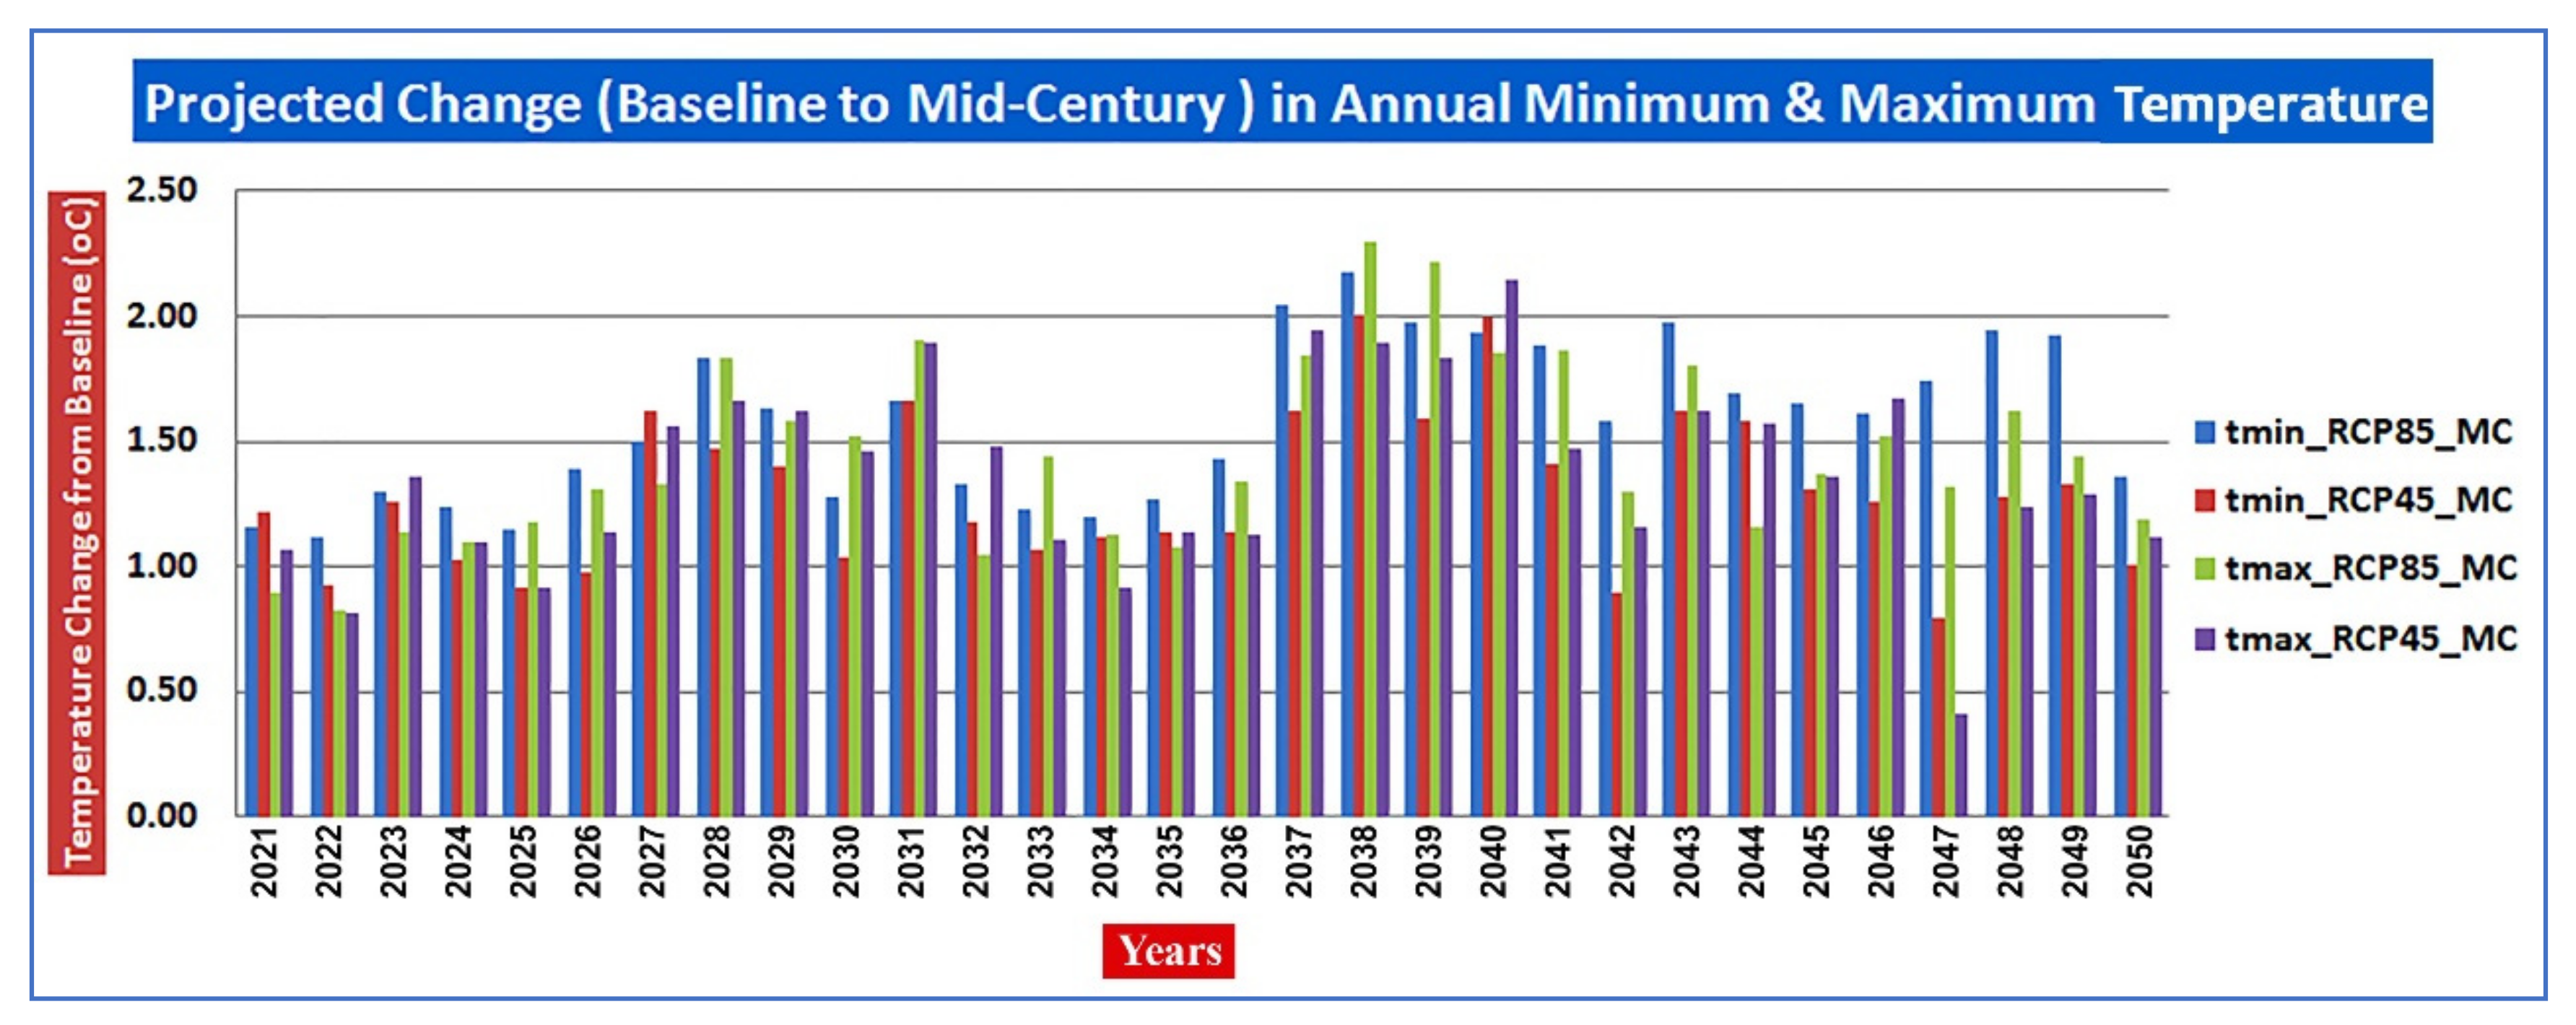
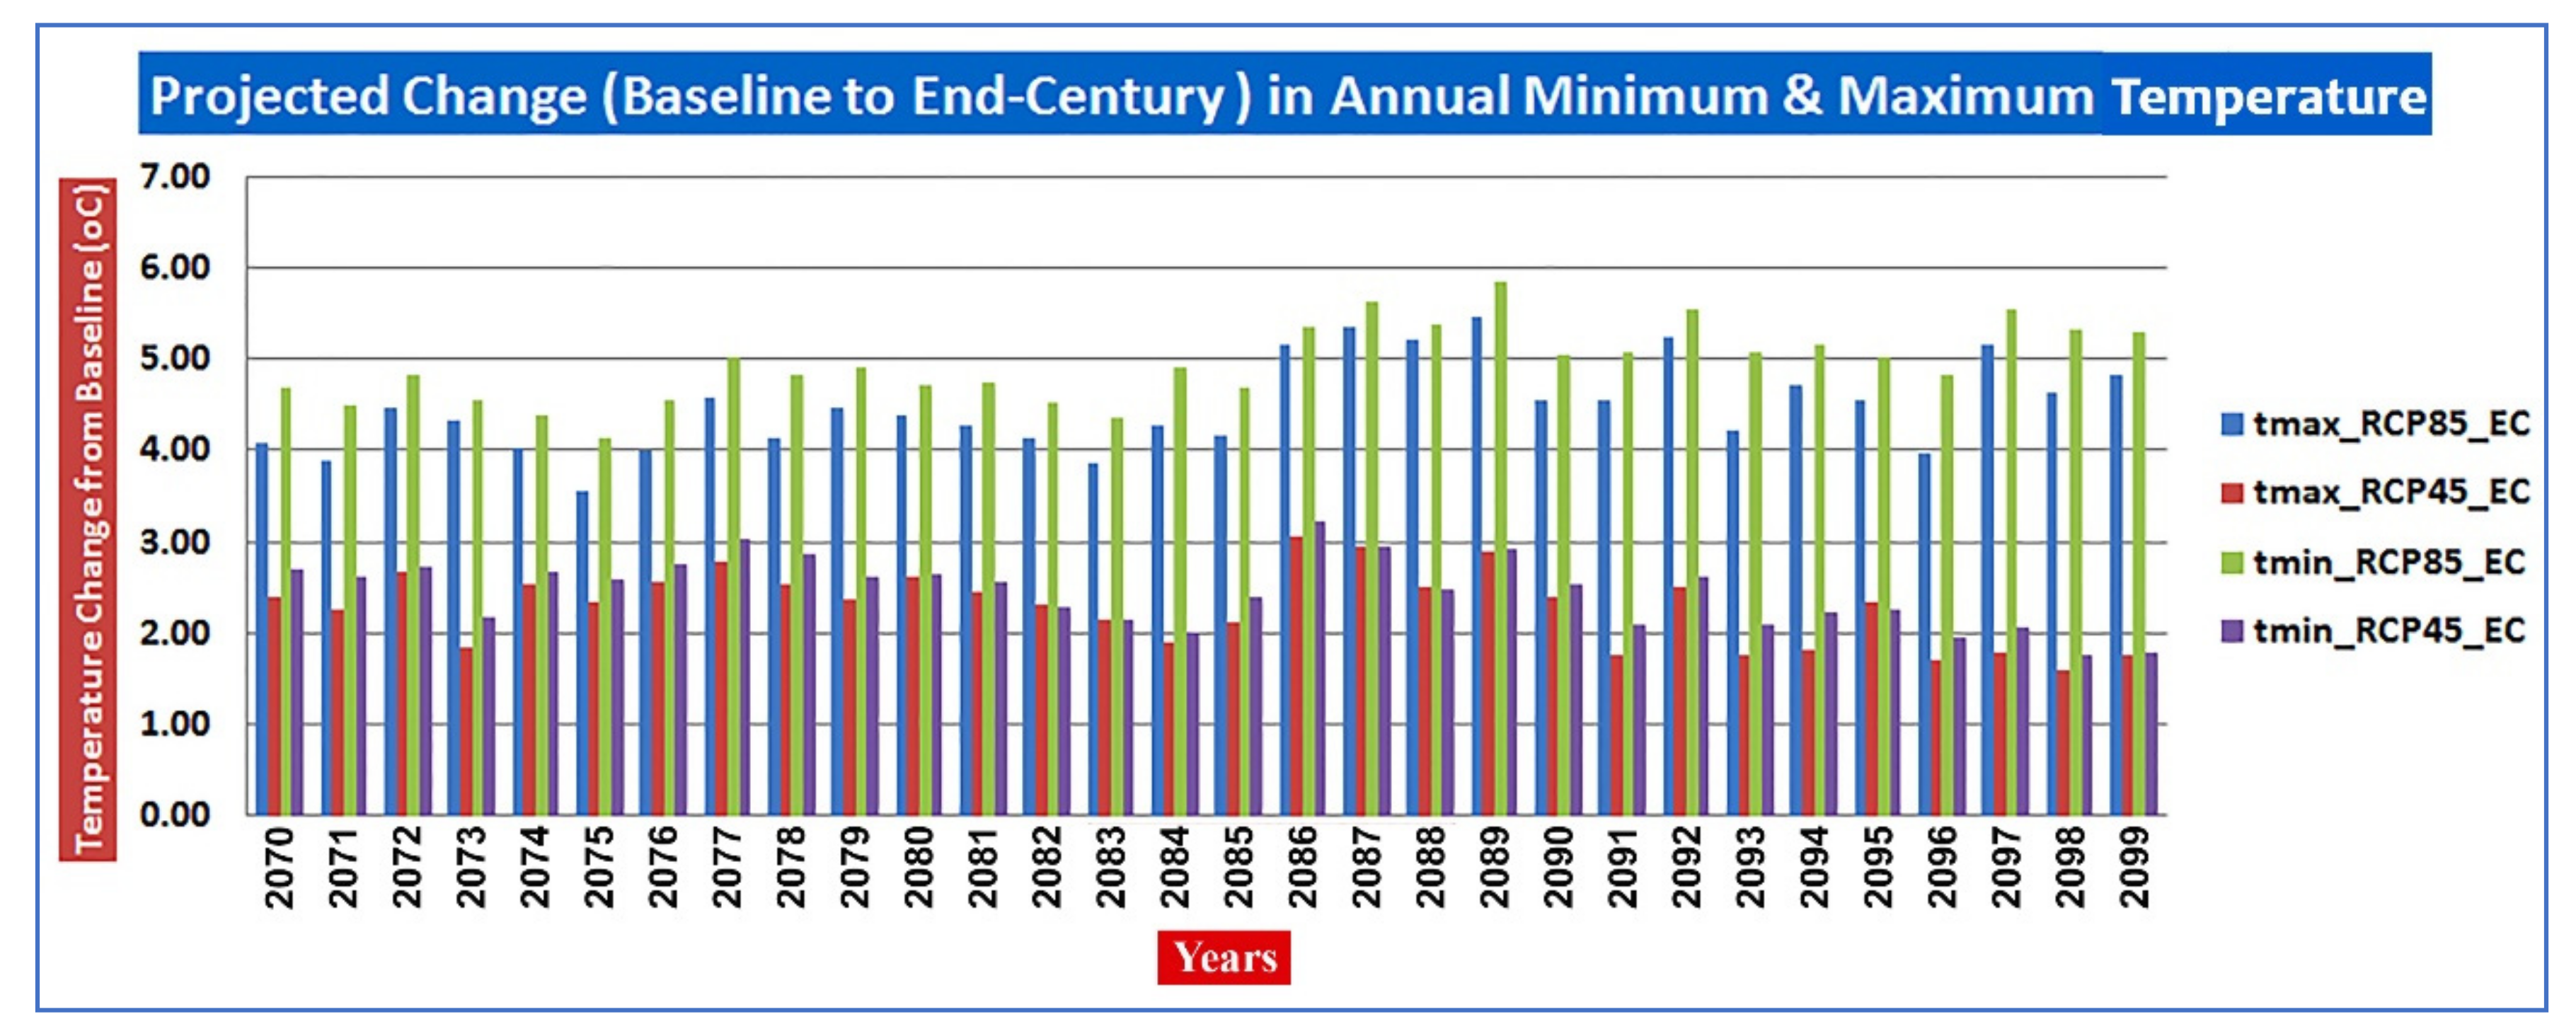
3.3.2. Temperature (Maximum & Minimum) Changes
4. Discussion
5. Conclusions
Author Contributions
Funding
Institutional Review Board Statement
Data Availability Statement
Acknowledgments
Conflicts of Interest
References
- Prentice, I.C.; Farquhar, G.D.; Fasham, M.J.R.; Goulden, M.L.; Heimann, M.; Jaramillo, V.J.; Kheshgi, H.S.; Le Quéré, C.; Scholes, R.J.; Wallace, D.W.R.; et al. The Carbon Cycle and Atmospheric CO2. In Climate Change 2000: The Science of Climate Change. Contributions of Working Group I to the Third Assessment Report of the Intergovernmental Panel on Climate Change; Houghton, J.T., Ding, Y., Griggs, D.J., Eds.; Cambridge University Press: Cambridge, UK, 2001; pp. 183–237. [Google Scholar]
- Sahu, N.; Sayama, T.; Saini, A.; Panda, A.; Takara, K. Understanding the Hydropower and Potential Climate Change Impact on the Himalayan River Regimes—A Study of Local Perceptions and Responses from Himachal Pradesh, India. Water 2020, 12, 2739. [Google Scholar] [CrossRef]
- Alam, G.; Peppelenbos, L. Cultivation of Medicinal Plants in Uttarakhand. Econ. Polit. Wkly. 2009, 44, 99–104. [Google Scholar]
- Rajeev, K.; Joshi, V.K.; Vinod, S.; Chandra, T.R.; Deep, K.G. Development of Herb Based Pharmaceutical Industry in Uttarakhand State. Int. J. Ayurveda Pharma Res. 2015, 3, 1–7. [Google Scholar]
- Saini, S.K.; Pandey, S.T. Organic Farming: Development and Strategies in Indian Perspective. Indian J. Agron. 2009, 54, 193–199. [Google Scholar]
- Mishra, A.; Appadurai, A.N.; Choudhury, D.; Regmi, B.R.; Kelkar, U.; Alam, M.; Chaudhary, P.; Mu, S.S.; Ahmed, A.U.; Lotia, H.; et al. Adaptation to Climate Change in the Hindu Kush Himalaya: Stronger Action Urgently Needed. In The Hindu Kush Himalaya Assessment; Springer International Publishing: Cham, Switzerland, 2019; pp. 457–490. [Google Scholar]
- Navarro-Racines, C.; Tarapues, J.; Thornton, P.; Jarvis, A.; Ramirez-Villegas, J. High-Resolution and Bias-Corrected CMIP5 Projections for Climate Change Impact Assessments. Sci. Data 2020, 7, 7. [Google Scholar] [CrossRef] [PubMed]
- Kharin, V.V.; Zwiers, F.W.; Zhang, X.; Hegerl, G.C. Changes in Temperature and Precipitation Extremes in the IPCC Ensemble of Global Coupled Model Simulations. J. Clim. 2007, 20, 1419–1444. [Google Scholar] [CrossRef]
- Tabari, H. Climate Change Impact on Flood and Extreme Precipitation Increases with Water Availability. Sci. Rep. 2020, 10, 13768. [Google Scholar] [CrossRef]
- Westra, S.; Fowler, H.J.; Evans, J.P.; Alexander, L.V.; Berg, P.; Johnson, F.; Kendon, E.J.; Lenderink, G.; Roberts, N.M. Future Changes to the Intensity and Frequency of Short-Duration Extreme Rainfall. Rev. Geophys. 2014, 52, 522–555. [Google Scholar] [CrossRef]
- Saini, A.; Sahu, N. Decoding Trend of Indian Summer Monsoon Rainfall Using Multimethod Approach: (Century Long Indian Monsoon Rainfall Trend). Stoch. Environ. Res. Risk Assess. 2021, 35, 2313–2333. [Google Scholar] [CrossRef]
- Ross, R.S.; Krishnamurti, T.N.; Pattnaik, S.; Pai, D.S. Decadal Surface Temperature Trends in India Based on a New High-Resolution Data Set. Sci. Rep. 2018, 8, 7452. [Google Scholar] [CrossRef]
- Sahu, N.; Saini, A.; Behera, S.K.; Sayama, T.; Sahu, L.; Nguyen, V.-T.-V.; Takara, K. Why Apple Orchards Are Shifting to the Higher Altitudes of the Himalayas? PLoS ONE 2020, 15, e0235041. [Google Scholar] [CrossRef] [PubMed]
- Saini, A.; Sahu, N.; Kumar, P.; Nayak, S.; Duan, W.; Avtar, R.; Behera, S. Advanced Rainfall Trend Analysis of 117 Years over West Coast Plain and Hill Agro-Climatic Region of India. Atmosphere 2020, 11, 1225. [Google Scholar] [CrossRef]
- Roxy, M.K.; Gnanaseelan, C.; Parekh, A.; Chowdary, J.S.; Singh, S.; Modi, A.; Kakatkar, R.; Mohapatra, S.; Dhara, C.; Shenoi, S.C.; et al. Indian Ocean Warming. In Assessment of Climate Change Over the Indian Region; Springer: Singapore, 2020; pp. 191–206. ISBN 9789811543272. [Google Scholar]
- Sahu, N.; Saini, A.; Behera, S.; Sayama, T.; Nayak, S.; Sahu, L.; Duan, W.; Avtar, R.; Yamada, M.; Singh, R.B.; et al. Impact of Indo-Pacific Climate Variability on Rice Productivity in Bihar, India. Sustainability 2020, 12, 7023. [Google Scholar] [CrossRef]
- Sahu, N.; Panda, A.; Nayak, S.; Saini, A.; Mishra, M.; Sayama, T.; Sahu, L.; Duan, W.; Avtar, R.; Behera, S. Impact of Indo-Pacific Climate Variability on High Streamflow Events in Mahanadi River Basin, India. Water 2020, 12, 1952. [Google Scholar] [CrossRef]
- Barnett, T.; Zwiers, F.; Hengerl, G.; Allen, M.; Crowly, T.; Gillett, N.; Hasselmann, K.; Jones, P.; Santer, B.; Schnur, R.; et al. Detecting and Attributing External Influences on the Climate System: A Review of Recent Advances. J. Clim. 2005, 18, 1291–1314. [Google Scholar] [CrossRef]
- Shrestha, U.B.; Gautam, S.; Bawa, K.S. Widespread Climate Change in the Himalayas and Associated Changes in Local Ecosystems. PLoS ONE 2012, 7, e36741. [Google Scholar] [CrossRef] [PubMed]
- Kumar, P.; Wiltshire, A.; Mathison, C.; Asharaf, S.; Ahrens, B.; Lucas-Picher, P.; Christensen, J.H.; Gobiet, A.; Saeed, F.; Hagemann, S.; et al. Downscaled Climate Change Projections with Uncertainty Assessment over India Using a High Resolution Multi-Model Approach. Sci. Total Environ. 2013, 468–469, S18–S30. [Google Scholar] [CrossRef] [PubMed]
- Chokkavarapu, N.; Mandla, V.R. Comparative Study of GCMs, RCMs, Downscaling and Hydrological Models: A Review toward Future Climate Change Impact Estimation. SN Appl. Sci. 2019, 1, 1698. [Google Scholar] [CrossRef]
- Midhuna, T.M.; Dimri, A.P. Future Projection of Winter Precipitation over Northwest India and Associated Regions Using CORDEX-SA Experiments. Theor. Appl. Climatol. 2020, 139, 1317–1331. [Google Scholar] [CrossRef]
- Nayak, S.; Mandal, M.; Maity, S. Performance Evaluation of RegCM4 in Simulating Temperature and Precipitation Climatology over India. Theor. Appl. Climatol. 2019, 137, 1059–1075. [Google Scholar] [CrossRef]
- Giorgi, F. Regional Climate Modeling: Status and Perspectives. J. Phys. IV 2006, 139, 101–118. [Google Scholar] [CrossRef]
- Laprise, R.; de Elía, R.; Caya, D.; Biner, S.; Lucas-Picher, P.; Diaconescu, E.; Leduc, M.; Alexandru, A.; Separovic, L. Challenging Some Tenets of Regional Climate Modelling. Meteorol. Atmos. Phys. 2008, 100, 3–22. [Google Scholar] [CrossRef]
- Antic, S.; Laprise, R.; Denis, B.; de Elía, R. Testing the Downscaling Ability of a One-Way Nested Regional Climate Model in Regions of Complex Topography. Clim. Dyn. 2006, 26, 305–325. [Google Scholar] [CrossRef]
- Kulkarni, A.; Patwardhan, S.; Kumar, K.K.; Ashok, K.; Krishnan, R. Projected Climate Change in the Hindu Kush-Himalayan Region by Using the High-Resolution Regional Climate Model PRECIS. Mt. Res. Dev. 2013, 33, 142–151. [Google Scholar] [CrossRef]
- Panday, P.K.; Thibeault, J.; Frey, K.E. Changing Temperature and Precipitation Extremes in the Hindu Kush-Himalayan Region: An Analysis of CMIP3 and CMIP5 Simulations and Projections. Int. J. Climatol. 2015, 35, 3058–3077. [Google Scholar] [CrossRef]
- Bhutiyani, M.R.; Kale, V.S.; Pawar, N.J. Long-Term Trends in Maximum, Minimum and Mean Annual Air Temperatures across the Northwestern Himalaya during the Twentieth Century. Clim. Chang. 2007, 85, 159–177. [Google Scholar] [CrossRef]
- Sanjay, J.; Krishnan, R.; Shrestha, A.B.; Rajbhandari, R.; Ren, G.Y. Downscaled Climate Change Projections for the Hindu Kush Himalayan Region Using CORDEX South Asia Regional Climate Models. Adv. Clim. Chang. Res. 2017, 8, 185–198. [Google Scholar] [CrossRef]
- Ghimire, S.; Choudhary, A.; Dimri, A.P. Assessment of the Performance of CORDEX-South Asia Experiments for Monsoonal Precipitation over the Himalayan Region during Present Climate: Part I. Clim. Dyn. 2018, 50, 2311–2334. [Google Scholar] [CrossRef]
- Choudhary, A.; Dimri, A.P. Assessment of CORDEX-South Asia Experiments for Monsoonal Precipitation over Himalayan Region for Future Climate. Clim. Dyn. 2018, 50, 3009–3030. [Google Scholar] [CrossRef]
- Gutowski, W.J., Jr.; Giorgi, F.; Timbal, B.; Frigon, A.; Jacob, D.; Kang, H.-S.; Raghavan, K.; Lee, B.; Lennard, C.; Nikulin, G.; et al. WCRP Coordinated Regional Downscaling EXperiment (CORDEX): A Diagnostic MIP for CMIP6. Geosci. Model Dev. 2016, 9, 4087–4095. [Google Scholar] [CrossRef]
- Nikulin, G.; Jones, C.; Giorgi, F.; Asrar, G.; Büchner, M.; Cerezo-Mota, R.; Christensen, O.B.; Déqué, M.; Fernandez, J.; Hänsler, A.; et al. Precipitation Climatology in an Ensemble of CORDEX-Africa Regional Climate Simulations. J. Clim. 2012, 25, 6057–6078. [Google Scholar] [CrossRef]
- Endris, H.S.; Omondi, P.; Jain, S.; Lennard, C.; Hewitson, B.; Chang’a, L.; Awange, J.L.; Dosio, A.; Ketiem, P.; Nikulin, G.; et al. Assessment of the Performance of CORDEX Regional Climate Models in Simulating East African Rainfall. J. Clim. 2013, 26, 8453–8475. [Google Scholar] [CrossRef]
- Krishnan, R.; Sanjay, J.; Gnanaseelan, C.; Mujumdar, M.; Kulkarni, A.; Chakraborty, S. Assessment of Climate Change Over the Indian Region: A Report of the Ministry of Earth Sciences (MOES), Government of India; Springer Nature: Singapore, 2020; ISBN 9789811543272. [Google Scholar]
- van Vuuren, D.P.; Edmonds, J.; Kainuma, M.; Riahi, K.; Thomson, A.; Hibbard, K.; Hurtt, G.C.; Kram, T.; Krey, V.; Lamarque, J.-F.; et al. The Representative Concentration Pathways: An Overview. Clim. Chang. 2011, 109, 5–31. [Google Scholar] [CrossRef]
- Thomson, E.C.; Smith, J.A.; Klenerman, P. The Natural History of Early Hepatitis C Virus Evolution; Lessons from a Global Outbreak in Human Immunodeficiency Virus-1-Infected Individuals. J. Gen. Virol. 2011, 92, 2227–2236. [Google Scholar] [CrossRef]
- van Vuuren, D.P.; Edmonds, J.A.; Kainuma, M.; Riahi, K.; Weyant, J. A Special Issue on the RCPs. Clim. Chang. 2011, 109, 1. [Google Scholar] [CrossRef]
- Riahi, K.; Rao, S.; Krey, V.; Cho, C.; Chirkov, V.; Fischer, G.; Kindermann, G.; Nakicenovic, N.; Rafaj, P. RCP 8.5—A Scenario of Comparatively High Greenhouse Gas Emissions. Clim. Chang. 2011, 109, 33–57. [Google Scholar] [CrossRef]
- Mausam, E. Winter Season (January-February) 2020. Mausam 2021, 72, 265–280. [Google Scholar] [CrossRef]
- Pai, D.; Rajeevan, M.; Sreejith, O.; Mukhopadhyay, B.; Satbha, N. Development of a New High Spatial Resolution (0.25° × 0.25°) Long Period (1901–2010) Daily Gridded Rainfall Data Set over India and Its Comparison with Existing Data Sets over the Region. Mausam 2014, 65, 1–18. [Google Scholar] [CrossRef]
- Mausam, E. Post Monsoon Season (October–December 2014). Mausam 2015, 66, 857–872. [Google Scholar] [CrossRef]
- Mausam, E. Post Monsoon Season (October to December 2005). Mausam 2006, 57, 701–718. [Google Scholar] [CrossRef]
- Tiwari, G.; Rameshan, A.; Kumar, P.; Javed, A.; Mishra, A.K. Understanding the Post-Monsoon Tropical Cyclone Variability and Trend over the Bay of Bengal during the Satellite Era. Q. J. R. Meteorol. Soc. 2021, 148, 1–14. [Google Scholar] [CrossRef]
- Shafiq, M.U.; Rasool, R.; Ahmed, P.; Dimri, A.P. Temperature and Precipitation Trends in Kashmir Valley, North Western Himalayas. Theor. Appl. Climatol. 2019, 135, 293–304. [Google Scholar] [CrossRef]
- Ritu. Ritu Living with and Responding to Risk in the Uttarakhand Himalayas: A Call for Prioritizing Lived Experiences in Research Policy Praxis. Int. J. Disaster Risk Reduct. 2020, 48, 101499. [Google Scholar] [CrossRef]
- Farooquee, N.A.; Maikhuri, R.K. Role of the State on Forests: Case of Uttarakhand. Econ. Polit. Wkly. 2007, 42, 3537–3540. [Google Scholar]
- Bargali, H.; Kumar, A.; Singh, P. Plant Studies in Uttarakhand, Western Himalaya—A Comprehensive Review. Trees For. People 2022, 8, 100203. [Google Scholar] [CrossRef]
- Kumar, A.; Kumar, R.; Sharma, M.; Kumar, U.; Prasad Gajula, M.N.V.; Singh, K.P. Uttarakhand Medicinal Plants Database (UMPDB): A Platform for Exploring Genomic, Chemical, and Traditional Knowledge. Data 2018, 3, 7. [Google Scholar] [CrossRef]
- Mishra, A. Changing Temperature and Rainfall Patterns of Uttarakhand. Int. J. Environ. Sci. Nat. Resour. 2017, 7, 90–95. [Google Scholar] [CrossRef]
- Riahi, K.; Grübler, A.; Nakicenovic, N. Scenarios of Long-Term Socio-Economic and Environmental Development under Climate Stabilization. Technol. Forecast. Soc. Chang. 2007, 74, 887–935. [Google Scholar] [CrossRef]
- Harris, I.; Jones, P.D.; Osborn, T.J.; Lister, D.H. Updated High-Resolution Grids of Monthly Climatic Observations—The CRU TS3.10 Dataset. Int. J. Climatol. 2014, 34, 623–642. [Google Scholar] [CrossRef]
- Remedio, A.R.; Teichmann, C.; Buntemeyer, L.; Sieck, K.; Weber, T.; Rechid, D.; Hoffmann, P.; Nam, C.; Kotova, L.; Jacob, D. Evaluation of New CORDEX Simulations Using an Updated Köppen–Trewartha Climate Classification. Atmosphere 2019, 10, 726. [Google Scholar] [CrossRef]
- Chaturvedi, R.K.; Joshi, J.; Jayaraman, M.; Bala, G.; Ravindranath, N.H. Multi-Model Climate Change Projections for India under Representative Concentration Pathways. Curr. Sci. 2012, 103, 791–802. [Google Scholar]
- Moss, R.H.; Edmonds, J.A.; Hibbard, K.A.; Manning, M.R.; Rose, S.K.; van Vuuren, D.P.; Carter, T.R.; Emori, S.; Kainuma, M.; Kram, T.; et al. The next Generation of Scenarios for Climate Change Research and Assessment. Nature 2010, 463, 747–756. [Google Scholar] [CrossRef] [PubMed]
- Ho, C.K.; Stephenson, D.B.; Collins, M.; Ferro, C.A.T.; Brown, S.J. Calibration Strategies: A Source of Additional Uncertainty in Climate Change Projections. Bull. Am. Meteorol. Soc. 2012, 93, 21–26. [Google Scholar] [CrossRef]
- Hawkins, E.; Osborne, T.M.; Ho, C.K.; Challinor, A.J. Calibration and Bias Correction of Climate Projections for Crop Modelling: An Idealised Case Study over Europe. Agric. For. Meteorol. 2013, 170, 19–31. [Google Scholar] [CrossRef]
- Taylor, K.E. Summarizing Multiple Aspects of Model Performance in a Single Diagram. J. Geophys. Res. Atmos. 2001, 106, 7183–7192. [Google Scholar] [CrossRef]
- Giorgi, F.; Gutowski, W.J. Regional Dynamical Downscaling and the CORDEX Initiative. Annu. Rev. Environ. Resour. 2015, 40, 467–490. [Google Scholar] [CrossRef]
- Katragkou, E.; García-Díez, M.; Vautard, R.; Sobolowski, S.; Zanis, P.; Alexandri, G.; Cardoso, R.M.; Colette, A.; Fernandez, J.; Gobiet, A.; et al. Regional Climate Hindcast Simulations within EURO-CORDEX: Evaluation of a WRF Multi-Physics Ensemble. Geosci. Model Dev. 2015, 8, 603–618. [Google Scholar] [CrossRef]
- Xu, Z.; Hou, Z.; Han, Y.; Guo, W. A Diagram for Evaluating Multiple Aspects of Model Performance in Simulating Vector Fields. Geosci. Model Dev. 2016, 9, 4365–4380. [Google Scholar] [CrossRef]
- Dimri, A.P.; Kumar, D.; Choudhary, A.; Maharana, P. Future Changes over the Himalayas: Maximum and Minimum Temperature. Glob. Planet. Chang. 2018, 162, 212–234. [Google Scholar] [CrossRef]
- Kundu, S.K.; Singh, C. A Comparative Study of Regional Climate Models and Global Coupled Models over Uttarakhand. Int. J. Mar. Environ. Sci. 2019, 13, 185–188. [Google Scholar]
- Banerjee, A.; Dimri, A.P.; Kumar, K. Temperature over the Himalayan Foothill State of Uttarakhand: Present and Future. J. Earth Syst. Sci. 2021, 130. [Google Scholar] [CrossRef]
- Kumar Kundu, S.; Singh, C. Rainfall Pattern Inferred from CORDEX-SA Domain Models for Future Warming Scenarios over Northwest Himalayan Region. VayuMandal 2019, 45, 2019. [Google Scholar]
- Dash, S.K.; Mishra, S.K.; Sahany, S.; Venugopal, V.; Ashok, K.; Gupta, A. Climate Modeling in India: Present Status and the Way Forward. Bull. Am. Meteorol. Soc. 2017, 98, ES183–ES188. [Google Scholar] [CrossRef]
- Shrestha, A.B.; Wake, C.P.; Mayewski, P.A.; Dibb, J.E. Maximum Temperature Trends in the Himalaya and Its Vicinity: An Analysis Based on Temperature Records from Nepal for the Period 1971–94. J. Clim. 1999, 12, 2775–2786. [Google Scholar] [CrossRef]
- Rao, V.B.; Franchito, S.H.; Gerólamo, R.O.P.; Giarolla, E.; Ramakrishna, S.S.V.S.; Rao, B.R.S.; Naidu, C.V. Himalayan Warming and Climate Change in India. Am. J. Clim. Chang. 2016, 05, 558–574. [Google Scholar] [CrossRef]
- Nayak, S.; Takemi, T. Dependence of Extreme Precipitable Water Events on Temperature. Atmósfera 2019, 32, 159–165. [Google Scholar] [CrossRef]
- Lee, E.; Carrivick, J.L.; Quincey, D.J.; Cook, S.J.; James, W.H.M.; Brown, L.E. Accelerated Mass Loss of Himalayan Glaciers since the Little Ice Age. Sci. Rep. 2021, 11, 24284. [Google Scholar] [CrossRef] [PubMed]
- Devi, N.; Singh, H. Socio-Environmental and Industrial Vulnerability Analysis of the Communities in the Shiwalik Region of Indian Himalayas Foothills. Trees For. People 2021, 6, 100155. [Google Scholar] [CrossRef]
- Nayak, S.; Maity, S.; Singh, K.S.; Nayak, H.P.; Dutta, S. Influence of the Changes in Land-Use and Land Cover on Temperature over Northern and North-Eastern India. Land 2021, 10, 52. [Google Scholar] [CrossRef]
- Banerjee, A.; Dimri, A.P.; Kumar, K. Rainfall over the Himalayan Foot-Hill Region: Present and Future. J. Earth Syst. Sci. 2020, 129, 11. [Google Scholar] [CrossRef]
- Rana, S.; Deoli, V.; Chavan, S.R. Detection of Abrupt Change in Trends of Rainfall and Rainy Day’s Pattern of Uttarakhand. Arab. J. Geosci. 2022, 15, 618. [Google Scholar] [CrossRef]
- Sahoo, S.K.; Ajilesh, P.P.; Gouda, K.C. Himesh S Impact of Land-Use Changes on the Genesis and Evolution of Extreme Rainfall Event: A Case Study over Uttarakhand, India. Theor. Appl. Climatol. 2020, 140, 915–926. [Google Scholar] [CrossRef]


| Contributing CORDEX Modelling Centre or Group | Asia CORDEX RCM Model | Period (Historical & Future) | Grid Resolution (Lat × Lon) |
|---|---|---|---|
| Centre for Climate Change Research (CCCR), Indian Institute of Tropical Meteorology (IITM), Pune (3 Ensemble Members) | CSIRO-QCCCE-CSIRO | 1951–2005 | 1.9° × 1.9° |
| 2006–2099 | |||
| IPSL-CM5A-LR | 1951–2005 2006–2099 | 3.7° × 1.9° | |
| NOAA-GFDL-GFDL-ESM2M | 1951–2005 2006–2099 | 2.5° × 2.0° | |
| Rossy Centre Swedish Meteorological & Hydrological Institute (SMHI), Sweden (6 Ensemble members) | ICHEC | 1951–2005 2006–2100 | 2.5° × 1.9° |
| CNRM-CM5 | 1951–2005 2006–2100 | 1.4° × 1.4° | |
| IPSL-CM5A-MR | 1951–2005 2006–2100 | 2.5° × 1.3° | |
| NOAA-GFDL-GFDL-ESM2M | 1951–2005 2006–2100 | 2.5° × 2.0° | |
| MPI-ESM-LR | 1951–2005 2006–2100 | 1.9° × 1.9° | |
| MIROC-MIROC5 | 1951–2005 2006–2099 | 1.4° × 1.4° | |
| Climate Source Centre (CSC), Germany (1 Ensemble member) | MPI-ESM-LR | 1961–2005 2006–2100 | 1.9° × 1.9° |
| Period | Precipitation (mm) | Minimum Temperature (°C) | Maximum Temperature (°C) | |||
|---|---|---|---|---|---|---|
| RCP (4.5) | RCP (8.5) | RCP (4.5) | RCP (8.5) | RCP (4.5) | RCP (8.5) | |
| January–February (Winter Season) | ||||||
| Mid-Century (2021–2050) | 345.48 | 364.12 | −3.06 | −2.83 | 10.15 | 10.81 |
| End-Century (2070–2099) | 349.45 | 556.37 | −1.805 | 1.18 | 10.64 | 13.15 |
| March–April–May (Pre-monsoon) | ||||||
| Mid-Century (2021–2050) | 381.09 | 458.68 | 6.40 | 6.68 | 20.58 | 20.55 |
| End-Century (2070–2099) | 891 | 350.90 | 7.5 | 10.47 | 23.70 | 23.70 |
| June–July–August–September (Monsoon) | ||||||
| Mid-Century (2021–2050) | 2030.11 | 2091.79 | 14 | 14.25 | 23.95 | 24.10 |
| End-Century (2070–2099) | 2196.05 | 2465.47 | 12.59 | 17.31 | 24.77 | 26.90 |
| October–November–December (Post-monsoon) | ||||||
| Mid-Century (2021–2050) | 366.81 | 346.03 | 2.07 | 2.4 | 15.49 | 15.34 |
| End-Century (2070–2099) | 609.91 | 432.52 | 3.68 | 6.98 | 16.41 | 18.70 |
| Period | Scenario | Change |
|---|---|---|
| Mid Century | RCP 4.5 | −43.13% to +23.46% |
| RCP 8.5 | −32.30% to +40.18% | |
| End of Century | RCP 4.5 | −31.57% to +25.56% |
| RCP 8.5 | −26.23% to +31.64% |
| Period | Scenario | Change (in °C) | |
|---|---|---|---|
| Temperature (Max.) | Temperature (Min.) | ||
| Mid Century | RCP 4.5 | 0.42 to 2.16 | 0.80 to 2.02 |
| RCP 8.5 | 0.83 to 2.30 | 0.13 to 2.19 | |
| End of Century | RCP 4.5 | 1.60 to 3.07 | 1.76 to 3.25 |
| RCP 8.5 | 3.57 to 5.49 | 4.15 to 5.86 | |
Publisher’s Note: MDPI stays neutral with regard to jurisdictional claims in published maps and institutional affiliations. |
© 2022 by the authors. Licensee MDPI, Basel, Switzerland. This article is an open access article distributed under the terms and conditions of the Creative Commons Attribution (CC BY) license (https://creativecommons.org/licenses/by/4.0/).
Share and Cite
Tyagi, N.; Jayal, T.; Singh, M.; Mandwal, V.; Saini, A.; Nirbhav; Sahu, N.; Nayak, S. Evaluation of Observed and Future Climate Change Projection for Uttarakhand, India, Using CORDEX-SA. Atmosphere 2022, 13, 947. https://doi.org/10.3390/atmos13060947
Tyagi N, Jayal T, Singh M, Mandwal V, Saini A, Nirbhav, Sahu N, Nayak S. Evaluation of Observed and Future Climate Change Projection for Uttarakhand, India, Using CORDEX-SA. Atmosphere. 2022; 13(6):947. https://doi.org/10.3390/atmos13060947
Chicago/Turabian StyleTyagi, Neetu, Tripti Jayal, Mukesh Singh, Vipan Mandwal, Atul Saini, Nirbhav, Netrananda Sahu, and Sridhara Nayak. 2022. "Evaluation of Observed and Future Climate Change Projection for Uttarakhand, India, Using CORDEX-SA" Atmosphere 13, no. 6: 947. https://doi.org/10.3390/atmos13060947
APA StyleTyagi, N., Jayal, T., Singh, M., Mandwal, V., Saini, A., Nirbhav, Sahu, N., & Nayak, S. (2022). Evaluation of Observed and Future Climate Change Projection for Uttarakhand, India, Using CORDEX-SA. Atmosphere, 13(6), 947. https://doi.org/10.3390/atmos13060947