1. Introduction
The olive tree (
Olea europaea L.) is a defining species of the Mediterranean basin, historically revered for its nutritional and medicinal offerings. Its fruits and oil are central to the Mediterranean diet, a dietary pattern associated with a reduced incidence of chronic diseases [
1,
2]. This protective effect is primarily attributed to a suite of bioactive phenolic compounds intrinsic to the olive matrix. Among these, the secoiridoid glycoside oleuropein is the most abundant and characteristic constituent, found in high concentrations in olive leaves and fruit [
3]. In addition, these phytochemicals are popular as ingredients in dietary supplements and nutraceuticals. The traditional use of olive leaf extracts in folk medicine for ailments ranging from fever to microbial infections presaged modern scientific interest, which now identifies oleuropein as a principal mediator of these broad therapeutic properties [
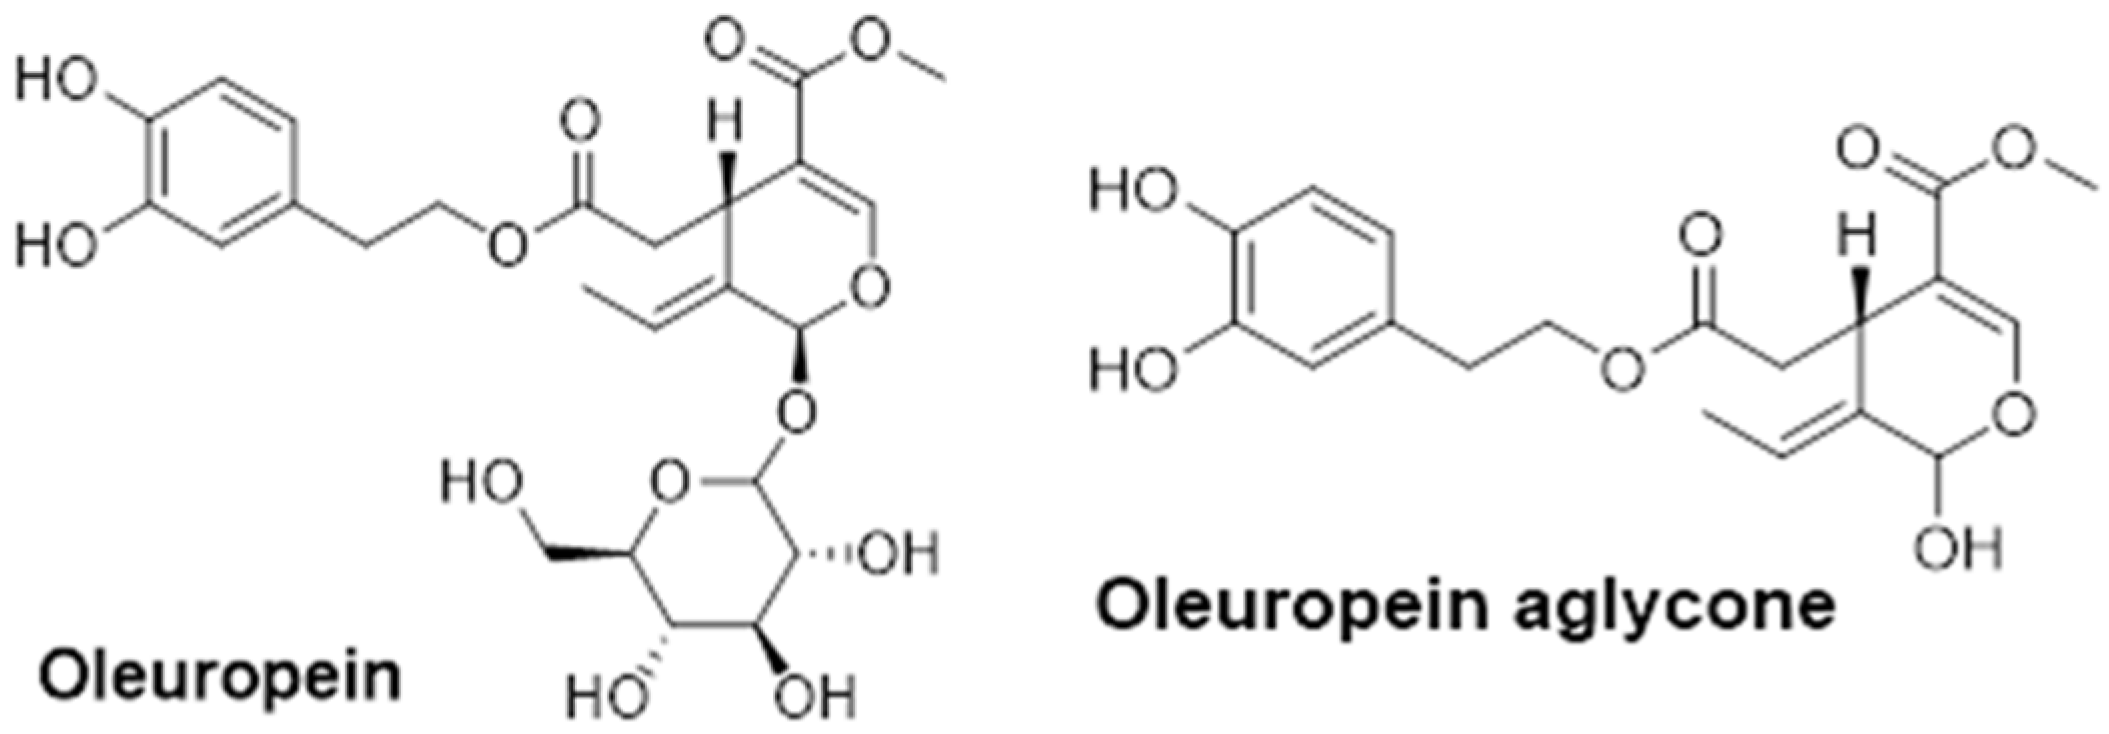
4]. Its chemical structure, featuring a hydroxytyrosol moiety linked to elenolic acid via a glucose molecule, renders it a pivotal precursor to a range of bioactive metabolites (
Figure 1). This prodrug nature fundamentally dictates its biological activity in vivo, setting the stage for a complex pharmacological profile that integrates potent antioxidant, anti-inflammatory, and modulatory effects on key cellular pathways [
5]. Thus, oleuropein stands as a critical phytochemical linking traditional wisdom to contemporary nutraceutical and pharmacological research.
Oleuropein and its metabolites exert pleiotropic effects through integrated antioxidant and anti-inflammatory pathways. They function as free radical scavengers and metal ion chelators, diminishing lipid peroxidation and reactive oxygen species (ROS) while enhancing endogenous defenses such as superoxide dismutase (SOD) and catalase [
6,
7,
8]. This effectively inhibits LDL oxidation, a crucial factor in atherogenesis [
4,
9]. They also control chronic inflammation by blocking the NF-κB pathway, which lowers adhesion molecules like VCAM-1 and pro-inflammatory cytokines like TNF-α and IL-6 [
10,
11,
12]. Oleuropein systematically addresses metabolic syndrome through hypolipidemic and anti-obesity effects. By activating AMPK and downregulating PPARγ and C/EBPα, it prevents adipogenesis [
13,
14]. Its hypoglycemic efficacy arises from AMPK-mediated GLUT4 translocation and α-glucosidase inhibition [
14,
15,
16]. Additionally, by inhibiting amyloid-β aggregation and triggering autophagy through the AMPK/mTOR axis, it provides neuroprotection [
4,
17]. Oleuropein aglycone has enhanced bioactivity, disrupting protein clumps and causing death in malignant cells [
18]. Ultimately, its antimicrobial and antiviral activity entails the disruption of microbial lipid bilayers [
19].
The pharmacokinetic profile of oleuropein is determined by rapid metabolic changes that necessitate accurate in vitro evaluation. Phase I microsomal esterases are involved in the hydrolysis of oleuropein to its aglycone form, whereas the biosynthetic and degradative routes encompass intricate transitions mediated by β-glucosidase [
20]. The incorporation of Phase II enzymatic pathways, namely glucuronidation and sulfation, is essential, as these high-capacity systems efficiently sequester metabolites immediately upon their synthesis [
21,
22]. Prior studies have often concentrated on intestinal absorption but generally omit the precise Phase II activity data usually obtained from hepatic S9 fractions [
23]. Assessing metabolic stability by microsomal and S9 assays enables the identification of the principal enzymatic barriers that restrict the bioavailability of the parent molecule [
24]. A primary obstacle in secoiridoid research remains the disconnect between in vitro potency and in vivo detectable efficacy. Although oleuropein aglycone is often recognized as a powerful, lipophilic contributor to health benefits, its real presence in systemic circulation is inadequately understood owing to its conversion to hydroxytyrosol during numerous metabolic processes [
25,
26]. This inconsistency primarily arises from the chemical instability of oleuropein aglycone and the absence of high-sensitivity, proven analytical techniques capable of differentiating between the parent secoiridoid and its ephemeral intermediates in intricate biological matrices [
27,
28]. Therefore, there is an immediate need to evaluate the pharmacokinetics of the aglycone using established LC–MS/MS methods to determine the extent of its systemic exposure [
29,
30].
Despite the recognized therapeutic potential of oleuropein and its bioactive aglycone, a critical knowledge gap persists regarding their pharmacokinetic profiles in mice. This is especially important as mouse models are routinely used to evaluate the biological activities of phytochemicals, including oleuropein and oleuropein-containing plant extracts. The present research fills existing gaps by studying oleuropein pharmacokinetics with a newly validated LC-MS/MS approach that simultaneously quantifies oleuropein and oleuropein aglycone in vivo. Significantly, we expanded this investigation to plasma samples to examine the systemic metabolite profile of oleuropein. Supported by in vitro stability assays in liver microsomes and S9 fractions, this integrated approach establishes a grounded pharmacological framework for oleuropein in preclinical research.
2. Materials and Methods
2.1. Chemicals and Reagents
Oleuropein and oleuropein aglycone were obtained from Medchem Express (Monmouth Junction, NJ, USA). Water (Optima LC-MS grade; w6-4), acetonitrile (Optima LC-MS grade; A955-212), methanol (Optima LC-MS grade; A456-4), and formic acid (Optima LC-MS grade; A117) were purchased from Fisher Scientific (Fair Lawn, NJ, USA). The LC analytical column and guard column were obtained from Phenomenex (Torrance, CA, USA).
2.2. Instrumentation and LC-MS/MS Conditions
The liquid chromatography system consisted of a Thermo Fisher Scientific Vanquish Binary pump, a Base Vanquish Horizon system, and a Split Sampler FT (West Palm Beach, FL, USA). The chromatographic system was coupled to a triple-stage quadrupole mass spectrometer (Quantis) from Thermo Fisher Scientific, equipped with a heated electrospray ionization (H-ESI) probe. The separation of the analytes was conducted using a Kinetex C18 3 mm × 50 mm, 2.6 μM analytical column (Phenomenex, USA), with an attached guard column (SecurityGuard EVO-C18 2 mm × 3 mm, part no. AJ0-9297; Phenomenex, USA). The mobile phase used for chromatography is composed of solvent A (0.1% formic acid in HPLC-grade water) and solvent B (0.1% formic acid in acetonitrile). The percentage of solvent B used was as follows: 10% (0 to 0.2 min), 95% (0.2 to 3.3 min), 95% (3.3 to 3.7 min), 10% (3.7 to 4.0 min), and 10% (4.0 to 5.0 min), with a flow rate of 0.35 mL/min. The column was maintained at a constant temperature of 40 °C, and the autosampler was set to 4 °C. The mass spectrometry conditions were as follows: H-ESI in negative mode, with a spray voltage of 4236.36 V; sheath gas at 20.9 arbitrary units (Arb); and auxiliary gas at 22.8 Arb. Further details regarding the MS conditions are provided in
Table 1.
2.3. Analytical Standards and Sample Preparation
The stock solutions of oleuropein and oleuropein aglycone, hereafter both referred to as the analyte, and the internal standard (methyl paraben) were prepared in methanol to a final concentration of 1 mg/mL. Methylparaben (MP) was selected as the internal standard due to its structural and ionization compatibility with secoiridoid analytes, sharing both phenolic and ester functional groups. MP ensures stable recovery and elution in regions free from ion suppression. In preference to isotope-labeled oleuropein, which is commercially limited and undergoes complex metabolic cleavage at multiple sites, accurate tracking is challenging.
The desired serial concentrations of working solutions were achieved by diluting a stock solution of the analyte with methanol. Blank plasma was spiked with an appropriate volume of internal standard to generate the blank plasma samples. Then, 5 µL of working solution was added to 25 μL of blank plasma samples to prepare calibration plasma samples at concentrations ranging from 1 to 1000 ng/mL (1, 2.5, 5, 10, 25, 50, 100, 250, 500, and 1000 ng/mL). Three quality control (QC) samples consisting of blank plasma samples spiked with known concentrations of the analyte (25 ng/mL, 100 ng/mL, and 500 ng/mL) were prepared independently from those used for the calibration curve. These QC samples were prepared on the day of analysis in the same way as the calibration standards. All the stock and working solutions were stored at −80 °C before and after use.
2.4. Blood Sample Collection
Thirty-six C57BL/6 male mice were acquired from Jackson Laboratories (Bar Harbor, ME, USA). At 6 weeks of age, mice were housed in plastic cages and received standard chow (AIN-76) and water ad libitum prior to the experiment. Mice were housed and maintained on a 12 h/12 h light/dark cycle. All the mice were weighed and dosed accordingly with freshly prepared oleuropein at 100 mg/kg body weight. Animal experiments were performed according to the policies and guidelines of the Institutional Animal Care and Use Committee (IACUC) of the University of Illinois Chicago. Mice were euthanized in accordance with Institutional Animal Care and Use Committee approval (protocol 22-165; approved on 12 May 2022) and current American Veterinary Medical Association (AVMA) guidelines (2020) using CO2 introduced by gradual fill (30–70% chamber volume/min); animals were observed until respiratory arrest, CO2 flow was continued for ≥1–2 min, and death was confirmed by an AVMA-approved secondary physical method.
Whole blood samples from four mice at each time point were collected via submandibular puncture at 0, 0.25, 0.5, 1, 2, 4, 6, 12, and 24 h following the administration of oleuropein. These blood samples were collected in lithium heparin-coated tubes, centrifuged at 3000 rpm for 15 min at 4 °C, and the resulting plasma was transferred to microcentrifuge tubes and stored at −80 °C for subsequent analysis.
2.5. Plasma Processing
Blank plasma samples (45 µL) were transferred into appropriately labeled 1.5 mL microcentrifuge tubes. Calibration and QC plasma samples were prepared by adding 5 µL of calibration standard or QC working solution to the blank plasma samples. Blank plasma samples contained the internal standard solution, whereas double-blank samples contained neither the analyte nor the internal standard; instead, 5 µL of methanol was added to compensate for them. For study samples, 50 µL of plasma was aliquoted into microcentrifuge tubes. Protein precipitation was performed by adding 150 µL of acetonitrile, followed by vortex mixing. All samples were centrifuged at 16,000× g for 30 min, and the supernatant was transferred to labeled tubes. The supernatant was evaporated to dryness under a gentle stream of nitrogen at room temperature, protected from direct light. The residue was reconstituted with 100 µL of acetonitrile–water (80:20, v/v), and 50 µL was transferred to autosampler vials. A 5 µL aliquot was injected into the LC–MS system for analysis.
2.6. LC-MS/MS Data Analysis
Data were analyzed with Tracefinder 5.1 SP3 software (Thermo Fisher Scientific, Waltham, MA, USA). Calibration curves were established with the calibration standards prepared in blank plasma. The calibration curve of oleuropein and oleuropein aglycone was best described by a 1/X2 weighted linear regression of the peak area ratio in each standard sample.
2.7. LC-MS Method Validation
Validation was conducted to assess the performance of the method in accordance with the recommendations published by the U.S. Food and Drug Administration (FDA). The selectivity of the process was investigated to identify any interference at the retention time of the analyte and internal standard originating from plasma or other sources. This was determined by comparing blank plasma with the blank plasma spiked with the analyte and internal standard.
Carryover was estimated by injecting a blank plasma sample immediately after the highest concentration (1000 ng/mL) of the calibration standard was injected. Carryover was considered acceptable when the analyte concentration was below 20% of the lower limit of quantification (LLOQ). Extraction recovery and matrix effect were evaluated at QC levels. Extraction recovery was calculated by comparing the peak area ratio (analyte/internal standard) of samples spiked before extraction with those spiked after extraction. The matrix effect was determined by comparing the peak area ratio of post-extraction spiked samples with neat standard solutions prepared in the solvent at equivalent concentrations. Intra-day precision and accuracy were evaluated using three replicates of quality control samples at concentrations of 500 ng/mL, 100 ng/mL, and 25 ng/mL. Inter-day precision and accuracy were assessed on three different days. Precision was calculated as the coefficient of variation (CV, %) within a single run (intra-run) and between different extractions and runs (inter-run).
The stability of oleuropein and oleuropein aglycone was investigated at room temperature (RT), 4 °C, −80 °C, and under multiple freeze–thaw cycles. Blank plasma samples spiked with oleuropein and oleuropein aglycone were stored at RT and 4 °C for 24 h prior to analysis. Long-term storage at −80 °C was also assessed over a six-month period. Multiple freeze–thaw cycles were conducted by thawing the sample on ice for 1 h, followed by storage at −80 °C for 23 h each day, for up to ten cycles.
2.8. Pharmacokinetic Analysis
Plasma samples for pharmacokinetic analysis were collected at 0, 0.25, 0.5, 1, 2, 4, 6, 8, and 24 h. From plasma time-concentration data, maximum observed plasma concentration (Cmax), time at observed maximum concentration (Tmax), area under plasma concentration (AUC), and terminal elimination half-life (t1/2) of oleuropein and oleuropein aglycone were calculated. Mean plasma concentration versus time at various sampling times was analyzed using standard non-compartmental methods with Phoenix WinNonlin (version 6.3; Certara, Princeton, NJ, USA). The linear-up–log-down rule estimated the AUC from time zero to the last measured concentration.
2.9. Stability in Mouse Plasma
Frozen plasma was thawed in a room-temperature water bath. It was then centrifuged at 3200× g for 10 min to remove clots. The supernatant was collected into a fresh tube. Only plasma thawed no more than twice since arrival was used.
Working solutions of oleuropein and oleuropein aglycone were prepared at a concentration of 1 mM. First, 4 μL of the working solution was added to 796 μL of pre-incubated plasma to achieve a final concentration of 5 μM. The solvent concentration in the final mixture was 0.5%. For each time point (5, 15, 30, 60, and 120 min), 50 μL aliquots of the spiked plasma were transferred into new tubes and incubated in a 37 °C water bath. Then, 400 μL of chilled quench solution (methanol with internal standards) was added to the spiked plasma at the designated time points to stop the reaction. For time 0 samples, 50 μL of the spiked plasma was added to tubes containing 400 μL of the quench solution. The samples were vortexed for 5 min and centrifuged at 10,000× g for 30 min at 4 °C to precipitate the proteins. The supernatant was collected for analysis via LC-MS/MS. The assay was performed in duplicate.
2.10. Metabolic Stability in Pooled Male Mouse Liver Microsomes/S9 Fraction
Frozen microsomes and the S9 fraction were thawed in an ice bath. Only those microsomes and S9 fractions that had been thawed no more than five times since arrival were used. Two separate experiments were conducted with and without cofactors to determine metabolic stability. For the assay with the cofactors, the incubation system included 0.5 mg/mL of microsomal or S9 fraction, 2 mM uridine 5′-diphosphate-glucuronic acid (UDPGA), 2.5 mM glutathione, an NADPH regeneration system (comprising 0.5 mM NADP+, 2 mM glucose 6-phosphate, 5 mM MgCl2, and 0.2 units/mL Glucose-6-phosphate dehydrogenase (G6PDH)), and 20 µg/mg of alamethicin in a total volume of 50 μL of 100 mM phosphate buffer at pH 7.4. A separate experiment was conducted, without any cofactors, using only the microsomal or S9 fraction and the test compound in a total volume of 50 μL of 100 mM phosphate buffer at pH 7.4. The reaction was initiated by adding the test compound to reach a final concentration of 1.0 μM, followed by incubation at 37 °C. At each point (5, 15, 30, 60, and 120 min), the reaction solutions were stopped by adding cold acetonitrile containing internal standards (IS). For time 0 samples, the reaction mixture was added to tubes containing the quench solution. The samples were vortexed for 5 min and then centrifuged at 10,000× g for 30 min at 4 °C to precipitate the proteins. The supernatant was collected for analysis via LC-MS/MS. The assay was performed in duplicate.
Intrinsic clearance (CLint) was determined from the depletion of the parent compound during incubation. The natural logarithm of the percentage of parent compound remaining was plotted against incubation time, and the elimination rate constant (k) was obtained from the slope of the linear regression (k = −slope). The in vitro half-life (t1/2) was calculated using t1/2 = 0.693/k, and intrinsic clearance (CLint, μL/min/mg protein) was calculated by multiplying k by the incubation volume (μL) and dividing by the amount of protein (mg), using the mean of duplicate measurements.
2.11. Statistical Analysis
Pharmacokinetic parameters were calculated using non-compartmental analysis (NCA). Statistical analyses were performed using GraphPad Prism 10 software (GraphPad Software, San Diego, CA, USA). Data from nine independent groups were subjected to one-way ANOVA followed by a post hoc analysis with Tukey’s test to determine significant differences among groups. Differences at p < 0.05 were considered statistically significant. Results are presented as mean values ± SD.
3. Results
3.1. LC-MS/MS Optimization
Tuning and optimization of the analytes were achieved by direct injection of individual solutions at a concentration of 1000 ng/mL into the MS/MS detector, with mobile phases A and B run at a flow rate of 0.5 mL/min in a 50:50 (
v/
v) mixture. SRM transitions and collision energy of the analyte and internal standard are reported in
Table 2. Two transitions, one for quantification and the other for confirmation, were selected for the analytes and internal standard to improve the assay’s specificity.
3.2. Calibration Curve and Quantification
Quantification of oleuropein and oleuropein aglycone was performed using the internal standard method. The calibration curve was best described by a 1/X2 weighted linear regression of the peak area ratio in each standard sample. The assay proved linear and acceptable, as the regression coefficients were greater than 0.99.
3.3. Method Validation
The developed LC-MS/MS procedure for oleuropein and oleuropein aglycone quantifications was validated in accordance with the instructions and recommendations described in
Section 2. QC samples at low (LQ), medium (MQ), and high (HQ) concentration levels were used to verify the linearity, accuracy, precision, and extraction efficiency of the procedure. The detailed results are shown in
Table 3.
The linearity of the method was evaluated through internal standard calibrations. The calibration curves for each were established using a 1/X2 weighted least squares fit, achieving correlation coefficients (R2) of 0.99 or higher. The measured concentrations for all calibration levels closely aligned with nominal values, and the accuracy was maintained within 15% for all analytes. The method exhibited high reliability and reproducibility for both analytes. All measured values for intra-day and inter-day accuracy and precision adhered to the established acceptance criteria of ±15% deviation from the nominal concentration and ±15% RSD. The results of selectivity and specificity testing indicated no interference with the analyte or internal standard from endogenous impurities or other agents. All analyte and internal standard peaks exhibited identical transitions and retention characteristics. No analytes were detected in the reagents or water tested. The blank samples showed no endogenous interference at the retention times corresponding to each analyte.
The matrix effect was quantitatively assessed by comparing the peak areas of analytes spiked into post-extracted plasma to those in pure solvent. For oleuropein and oleuropein aglycone, the mean matrix factors were 91.4% and 93.7%, respectively, with a coefficient of variation (CV) of <5.1% across three different plasma lots (
Supplementary Material Table S1). The IS-normalized matrix factors remained between 0.95 and 0.98, demonstrating that methylparaben effectively accounts for ion suppression in the plasma matrix, ensuring high analytical consistency.
Oleuropein and oleuropein aglycone demonstrated high accuracy and precision, with mean values across QC levels and days ranging from 94.83% to 98.03% and 6.73% to 13.62%, respectively. The sample preparation procedure demonstrated robustness and consistency, with mean extraction recoveries of 94.79% for oleuropein and 95.85% for oleuropein aglycone, respectively.
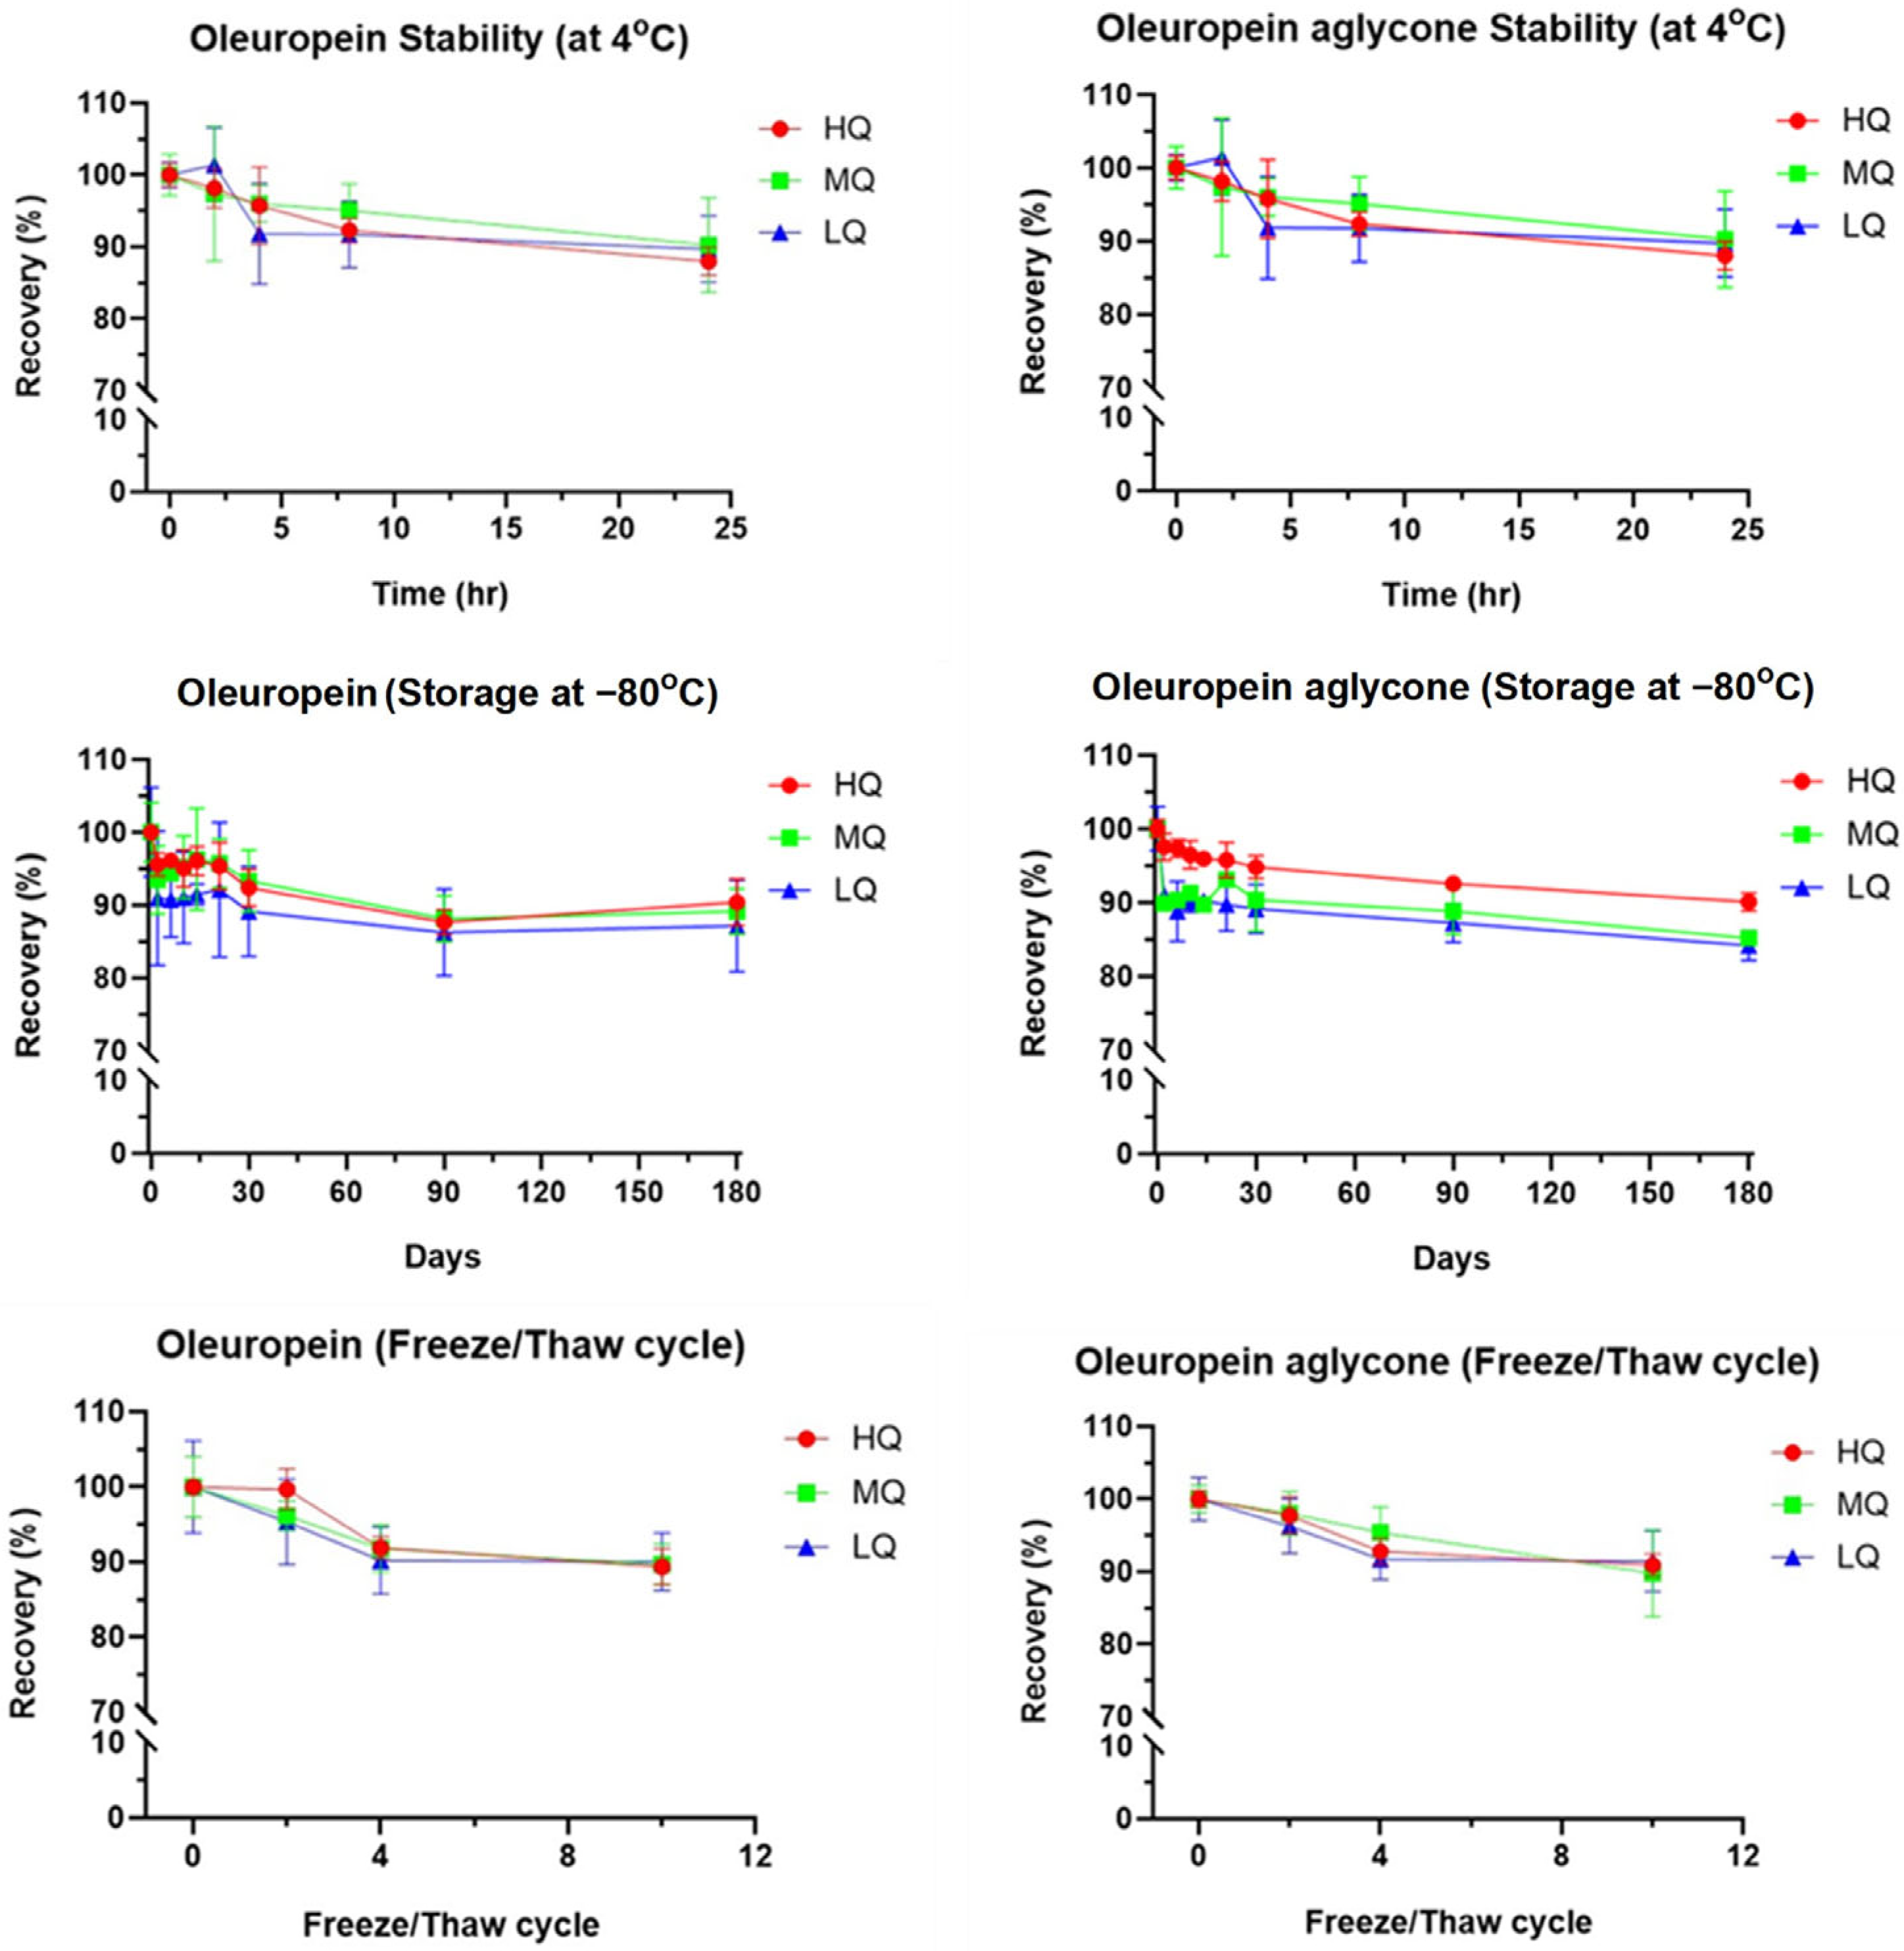
The stability of oleuropein and oleuropein aglycone was thoroughly evaluated under different storage and handling conditions (
Figure 2). The findings, presented as the mean percentage change relative to the standard concentration, are displayed in
Table 4 (
Supplementary Tables S2–S4). The criterion for acceptance regarding stability was established as a mean percentage change of ±15%. The method exhibited satisfactory stability of the autosampler in both cases. All re-injected QC samples after 6 h exhibited minimal deviation, with variations remaining within the acceptable range, thereby confirming stability throughout the analytical batch duration. The results of the short-term bench-top stability test (24 h at room temperature) indicated that both remained stable at room temperature. Refrigeration at 4 °C for 24 h significantly enhanced the stability of both compounds. After 24 h, only 10% and 13% degradation was observed for oleuropein and oleuropein aglycone, respectively. Storage at −80 °C for six months resulted in only a 12% and 14% degradation of oleuropein and oleuropein aglycone, respectively, demonstrating the efficacy of this storage condition. The stability of the samples under repeated freeze–thaw stress was assessed by quantifying the residual percentage of oleuropein and oleuropein aglycone across multiple cycles. The rate of decline exhibited a gradual initial loss, which then increased steadily from the fourth cycle (8%) to the tenth cycle (11%). During the testing period, the stability profiles of oleuropein and oleuropein aglycone exhibited similar patterns of decline.
3.4. Metabolic Stability of Oleuropein and Oleuropein Aglycone in Mouse Liver Microsomes and S9 Fractions
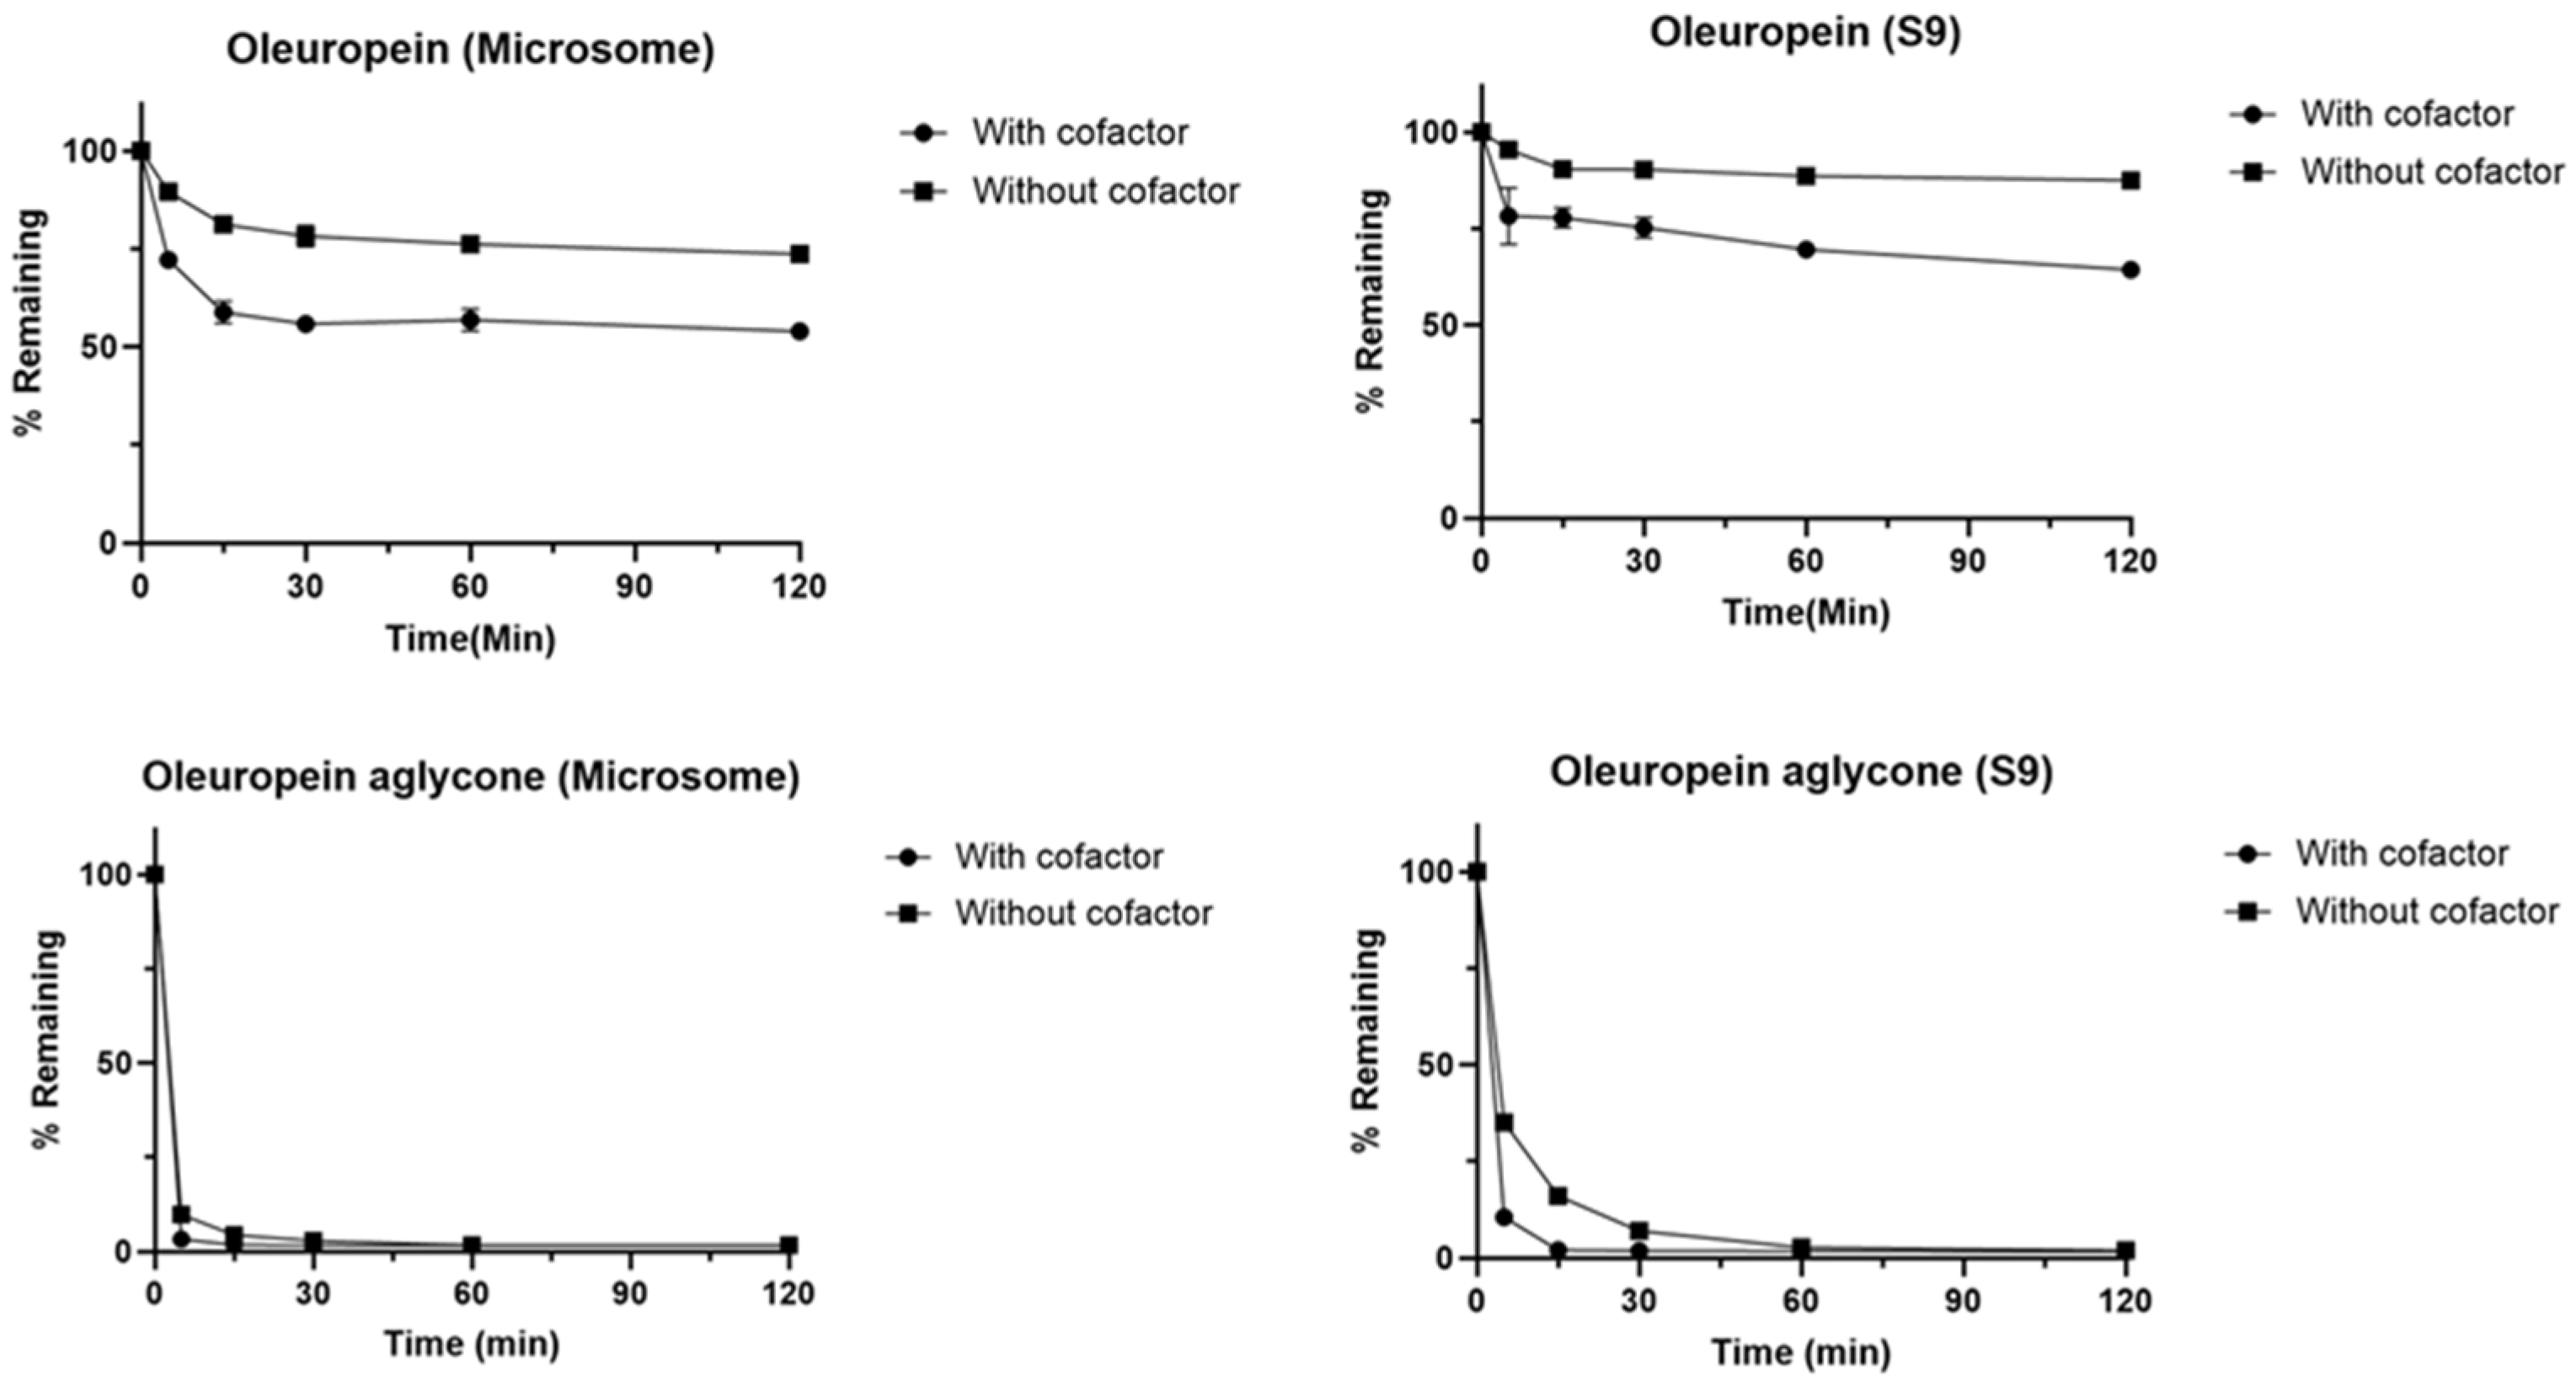
The metabolic stability of oleuropein and oleuropein aglycone was assessed in mouse liver microsomes and S9 fractions, both in the presence and absence of an NADPH-regenerating system (
Figure 3,
Supplementary Tables S5 and S6). Metabolism was predominantly NADPH-dependent, indicating that Phase I cytochrome P450-mediated enzymatic pathways were primarily responsible for most of the observed turnover.
In mouse liver microsomes with cofactors, oleuropein aglycone was extremely unstable, showing a rapid decline to 3% remaining at 5 min. Oleuropein exhibited slower turnover, retaining 54% of its initial amount at 120 min. In the absence of cofactors, oleuropein was found to be more stable. After 120 min, 74% of oleuropein remained, whereas oleuropein aglycone continued to display notable non-NADPH-dependent degradation, falling to 1%. In S9 fractions, metabolic turnover proceeded more slowly than in microsomes but showed a similar pattern. With cofactors, 64% of oleuropein and only 1% of oleuropein aglycone remained at 120 min. Without cofactors, oleuropein remained highly stable (87% at 120 min), while oleuropein aglycone again showed extensive metabolism, with only 1% of the parent compound detectable. Overall, the data demonstrate that the metabolic clearance of both compounds is strongly cofactor-dependent, with microsomes exhibiting more rapid catalytic activity than S9 fractions.
The metabolic stability revealed a striking difference in the turnover rates of the two analytes across hepatic fractions. The calculated
CLint for the oleuropein aglycone was approximately 14-fold higher than that of the parent oleuropein in mouse liver microsomes. A similar trend was observed in the S9 fractions (
Supplementary Table S7). The marked reduction in
CLint observed in the ‘No cofactor’ groups across both microsomal and S9 fractions highlights the predominant role of enzyme-mediated pathways in the rapid turnover of these phenolics.
3.5. Pharmacokinetics of Oleuropein
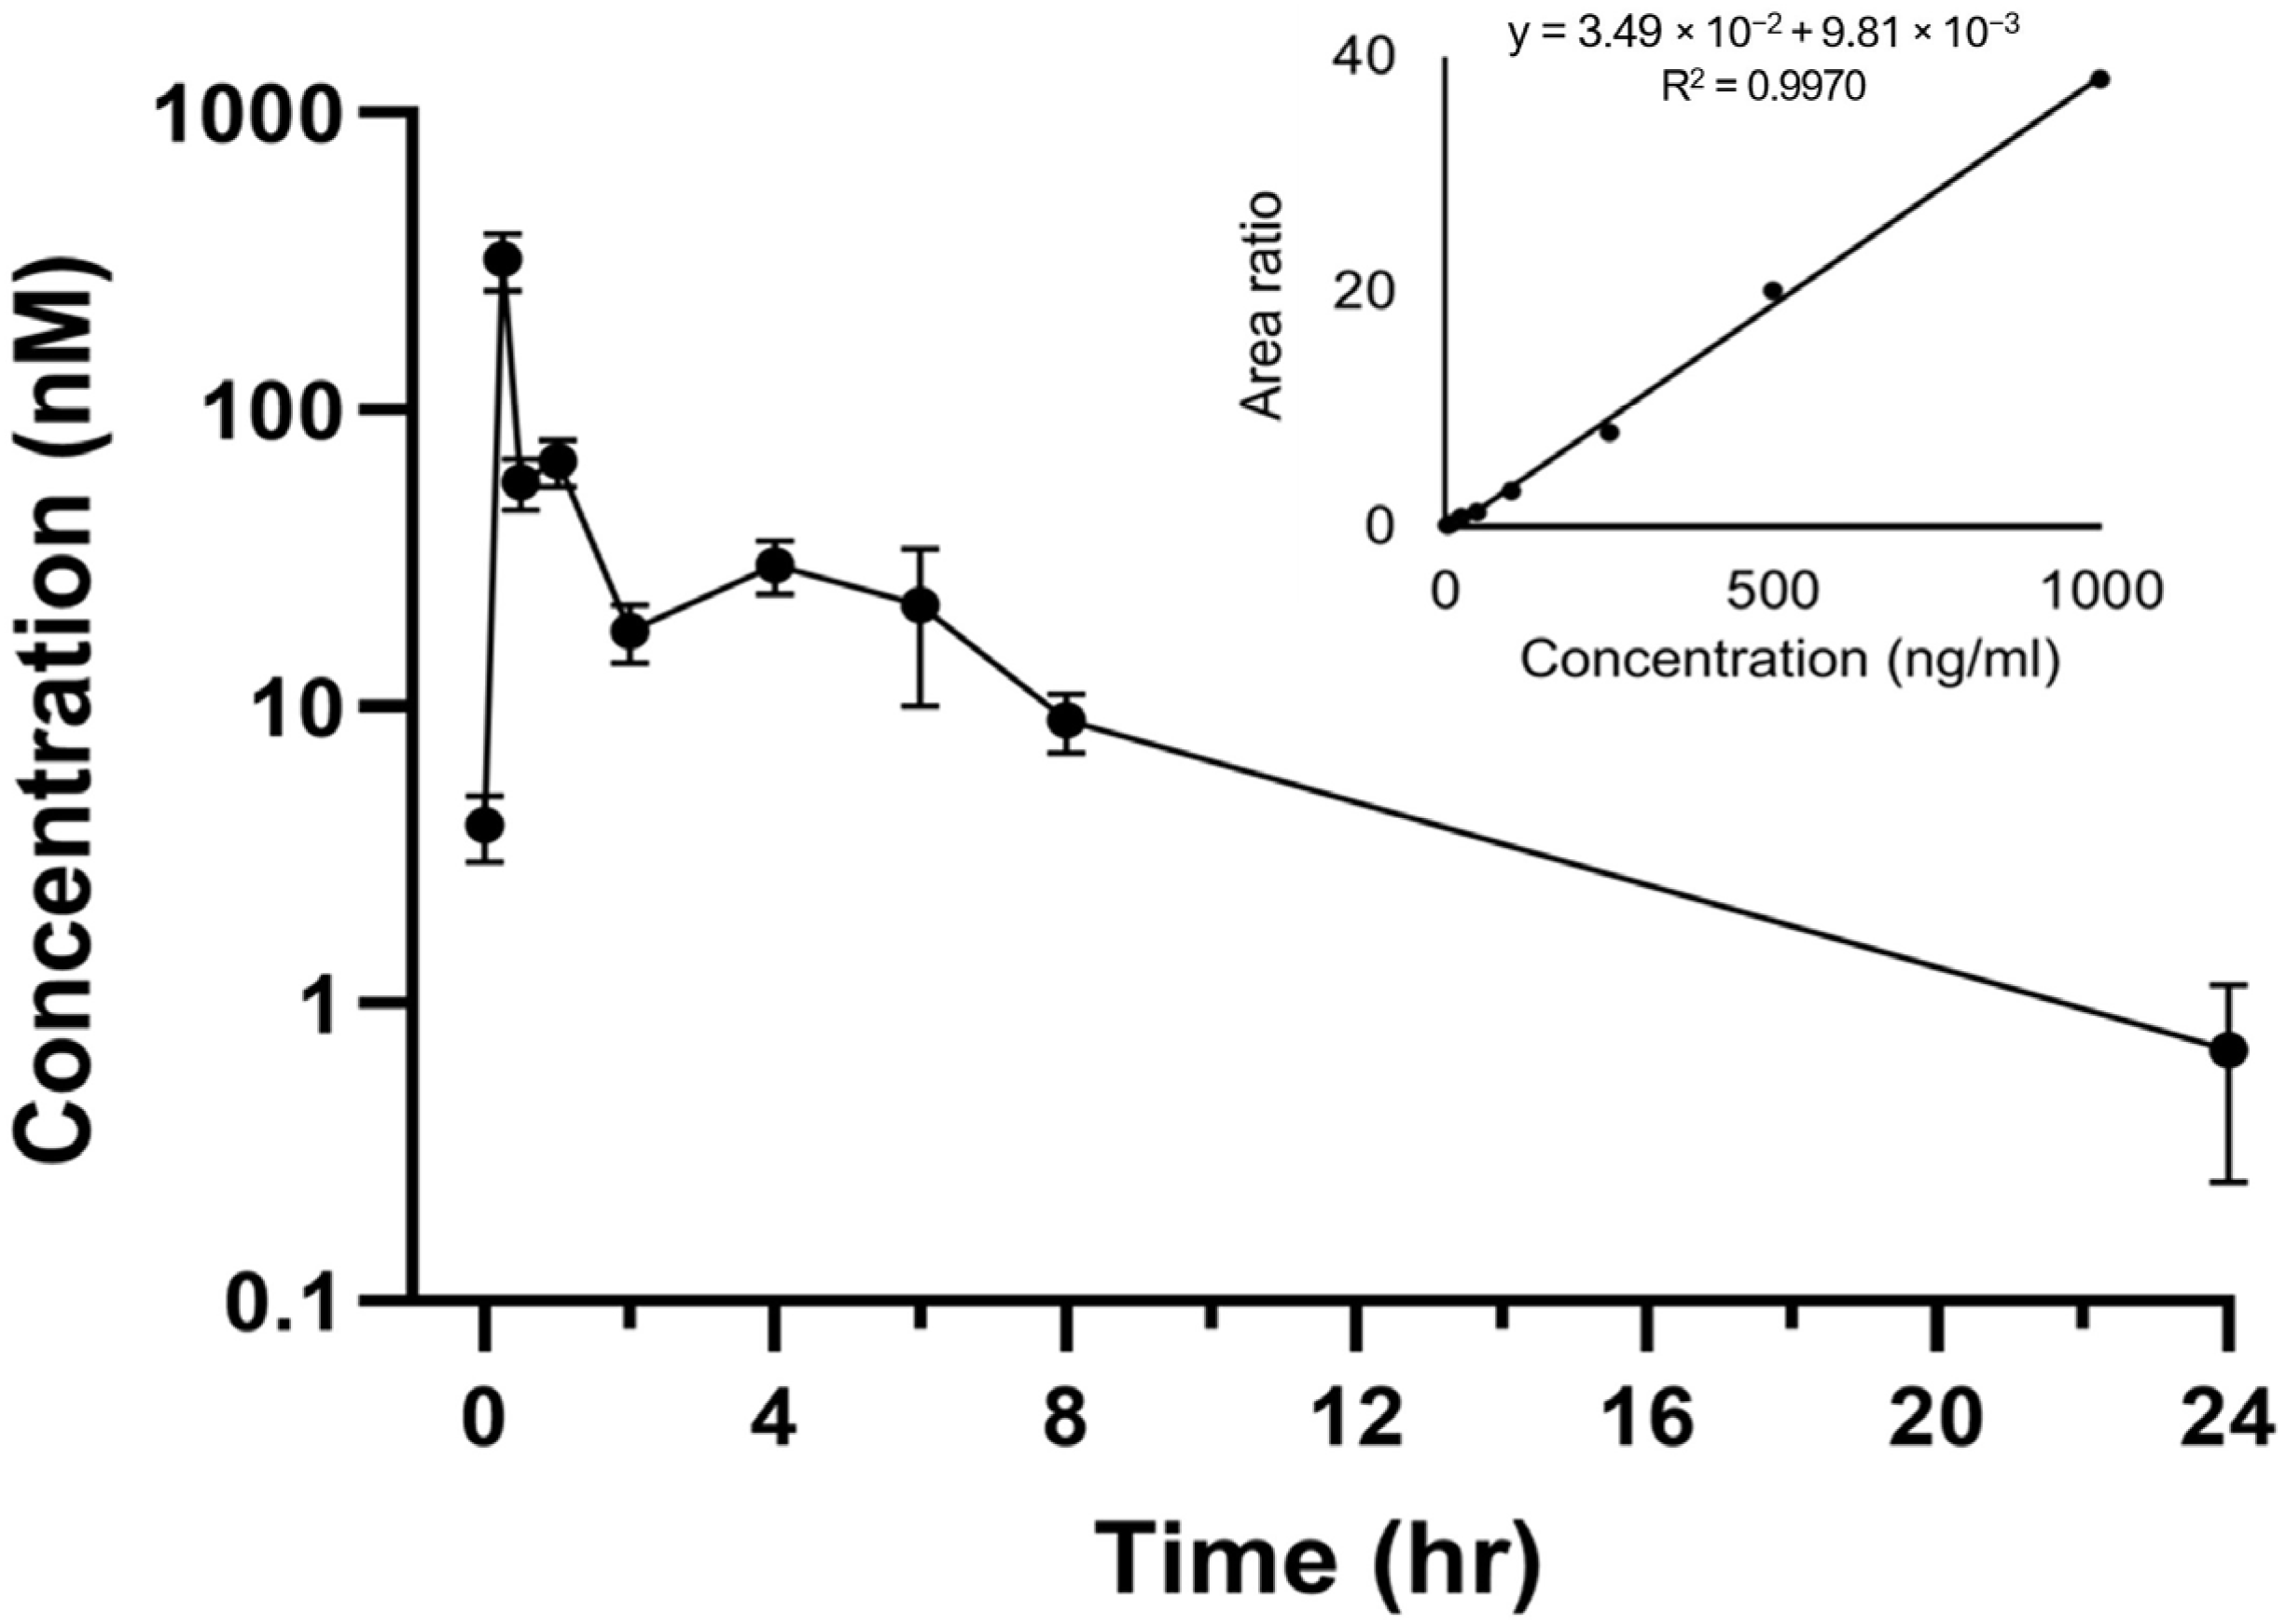
The mean pharmacokinetic parameters for oleuropein are summarized in
Table 5 and
Figure 4. Oleuropein exhibited rapid absorption, reaching its peak concentration within 30 min after a dose of 100 mg/kg was administered via oral gavage to mice. A C
max of 0.00835 µmol/mL confirmed efficient uptake, while the AUC values (0.0141 for AUC
0–24 and 0.0143 for AUC
0–inf) indicated that most exposure occurred within the sampling period. With an elimination half-life of 0.780 h, the data suggest a swift rise in concentration followed by a steady, predictable decline.
3.6. Plasma Metabolite Profiling of Oleuropein
To elucidate the mechanistic basis underlying the metabolic instability of oleuropein, plasma samples were analyzed by LC–MS/MS (
Table 6). Oleuropein and oleuropein aglycone were identified as deprotonated ions at
m/
z 539.06 and 377.12, respectively. Phase I metabolism was evidenced by the presence of elenolic acid (
m/
z 242.09), while extensive Phase II conjugation was indicated by the detection of elenolic acid glucuronide (
m/
z 407.20), hydroxytyrosol sulfate (
m/
z 279.07, formate adduct), hydroxytyrosol glucuronide (
m/
z 329.15), and hydroxytyrosol sulfo-glucuronide (
m/
z 409.24). Collectively, these findings indicate that rapid conjugation represents a dominant clearance pathway for oleuropein in plasma following oral administration.
4. Discussion
The present study provides a report on the pharmacokinetic properties of oleuropein in C57BL/6 mice. In this study, we established an LC-MS/MS technique for measuring oleuropein and oleuropein aglycone, with both the analyte and internal standard measured in negative ion mode. Before sample analysis, the approach underwent a thorough validation process. The validation indicated that the established technique is accurate, precise, and reliable for the concurrent measurement of oleuropein and oleuropein aglycone. The performance parameters observed meet or exceed the acceptance requirements established by international guidelines for bioanalytical method validation, confirming the technique’s suitability for its intended use. The analyte’s elevated recovery rate and low variability (%RSD) indicate negligible matrix suppression or enhancement effects, as well as a very steady analytical response. This consistency is essential for producing dependable data, particularly at the lower limit of quantification, where elevated accuracy fosters significant confidence in assessing baseline concentrations.
The observed accuracy (mean values of 94.83–98.03%) and precision (RSDs of 6.73–13.62%) throughout the validation adhere to established bioanalytical standards, indicating no systematic bias and strong repeatability. This performance is underpinned by exceptional, consistent mean extraction recoveries of 94.79% and 95.85%, respectively. Moreover, the evaluation of matrix effects demonstrated that ion suppression or enhancement from mouse plasma components was minimal, as indicated by IS-normalized matrix factors remaining close to one. The significant analytical consistency across various plasma lots indicates that the intricate biological matrix did not impede analyte detection. These findings confirm the method’s reliability and guarantee the quantitative precision of the given pharmacokinetic profiles.
The stability profile of a compound is essential for establishing standard operating procedures for sample handling and analysis. The excellent stability of oleuropein and oleuropein aglycone in the autosampler ensures that the processed samples may be reliably analyzed over a standard sequence run time without deterioration. The stability of both compounds at 4 °C, during long-term storage at −80 °C, and throughout multiple freeze–thaw cycles provides a strong basis for adaptable and efficient sample handling throughout the analytical process. This also underscores the need to avoid prolonged storage at elevated temperatures and that sample analysis must occur within a period that has demonstrated stability.
The metabolic stability of the analytes was significantly influenced by their chemical structure and the presence of enzymatic cofactors. In mouse liver microsomes, the determined
CLint for oleuropein aglycone was almost 14 times greater than that of its parent molecule, oleuropein, a pattern that persisted across the S9 fractions. The significant rise in clearance for the aglycone corroborates the anticipated high-velocity metabolic transitions identified during early characterization. The presence of the glycosidic moiety in oleuropein acts as a glucose shield, preventing the secoiridoid ring from opening into its highly reactive dialdehyde form, which is otherwise immediately susceptible to hepatic biotransformation [
21,
31]. Moreover, the activation of hepatic P450 systems through routes like peroxisome proliferator-activated receptor alpha (PPAR-α) activation may expedite the metabolism of these drugs in rodent models [
32].
The in vivo pharmacokinetic profile in mice directly reflects the in vitro metabolic liability. After administering a 100 mg/kg oral dosage, oleuropein attained maximal plasma concentrations (C
max) in 30 min. The swift T
max suggests advantageous gastrointestinal permeability and closely corresponds with rodent studies demonstrating peak absorption of olive phenolics within 30 to 45 min [
29,
33]. Notwithstanding this effective absorption, the comparatively low systemic exposure and a brief metabolic half-life of roughly 0.78 h suggest that oleuropein experiences significant intrinsic clearance. This swift systemic elimination is frequently opposed by extensive tissue distribution to the liver and heart, where it may provide localized protective effects [
34,
35].
The most striking finding was the total absence of quantifiable oleuropein aglycone in the plasma throughout the 24 h sampling period. Our data indicate that the conversion from oleuropein to its aglycone functions as a metabolic bottleneck. The aglycone’s enhanced lipophilicity renders it an optimal substrate for nearly full presystemic metabolism, establishing a metabolic trap where it is biotransformed as rapidly as it is produced [
23,
34]. As a result, the aglycone experiences rapid first-pass metabolism through high-capacity UDP-glucuronosyltransferases (UGTs) and sulfotransferases (SULTs), preventing it from attaining prolonged systemic circulation. This elucidates why the glycosylated parent is transiently observable, whereas its more reactive aglycone remains below the quantification threshold [
12,
15,
34].
The plasma metabolite profile provided definitive evidence that conjugative metabolism predominates in the disposition of oleuropein after absorption. The identification of Phase I metabolites such as elenolic acid, in conjunction with a comprehensive profile of Phase II conjugates including elenolic acid glucuronide, hydroxytyrosol glucuronide, and hydroxytyrosol sulfate, confirms substantial oxidative and hydrolytic processing. These findings reinforce the agreement that circulatory exposure predominantly consists of conjugated phenolic metabolites rather than solely the parent molecule [
34,
36]. From a translational standpoint, these findings underscore a critical disparity between the supplied dose of oleuropein and the molecular entities that ultimately engage with target tissues. The bioavailable portion predominantly comprises a complex mixture of glucuronides and sulfates; thus, any apparent biological activity should be interpreted as the cumulative effect of these metabolites. This metabolic intricacy indicates that further pharmacological models must consider metabolite exposure. Furthermore, it provides a strong rationale for developing delivery strategies or formulations designed to bypass pre-systemic metabolism, thereby enhancing the exposure of specific active forms like the aglycone.
Overall, these data demonstrate a definitive structure–metabolism relationship in which the glycosidic component of oleuropein is a crucial factor in metabolic stability, enabling quantifiable systemic exposure that is otherwise diminished following conversion to the aglycone. Integrating in vitro turnover rates with in vivo profiles reveals that although the oleuropein aglycone may exhibit greater theoretical potency, its swift Phase II biotransformation designates it as a temporary intermediate rather than a circulating bioactive compound. Consequently, oleuropein is identified as the principal entity relevant for oral administration. To comprehensively elucidate the kinetic profile of these phenolics, future intravenous studies are important; such data will facilitate the determination of absolute bioavailability and the differentiation of hepatic first-pass effects from systemic elimination. This differentiation is essential for creating precise exposure–response models and determining the exact dose-to-effect connections necessary for effective clinical translation.