Article

Design Hyetograph for Short-Duration Rainstorm in Jiangsu

1
Jiangsu Climate Center, Jiangsu Meteorology Bureau, Nanjing 210000, China
2
Institute of Physics Science and Technology, Yangzhou University, Yangzhou 225000, China
*
Author to whom correspondence should be addressed.
Atmosphere 2022, 13(6), 899; https://doi.org/10.3390/atmos13060899
Submission received: 28 April 2022 / Revised: 27 May 2022 / Accepted: 30 May 2022 / Published: 1 June 2022
(This article belongs to the Special Issue The Water Cycle and Climate Change)

Abstract

:
The rainstorm intensity formula and the design of rainstorm hyetographs are important aspects in drainage design standards. Against the backdrop of climate change, in most cities in Jiangsu Province of China, significant trends of increasing intensities of heavy rainfall are apparent. The parameters of the rainstorm intensity formula are no longer applicable in the current context of significantly stronger rainstorms. To adapt to this change, we first contrasted the fitting accuracy of the Gumbel distribution, the exponential distribution, and the Pearson III distribution for the rainstorm intensity formula in Jiangsu. It was found that the Gumbel distribution has the smallest relative mean square error in most cities, proving that it provides the best estimation of rainstorm intensity formula parameters. Therefore, the rainstorm intensity formula parameters for 13 cities was revised using the Gumbel distribution based on the rainfall data from 1991 to 2020. Then, the precipitation with a 100-year return period was calculated using the revised formula. Moreover, to compensate for the lack of storm hyetographs that have been designed for Jiangsu, we designed short-duration rainstorm hyetographs for 13 cities using the Chicago hyetograph method and the Pilgrim and Cordery (PC) method. The results show that most of the short-duration rainstorms lasted between 45 and 120 min and were dominated by single-peaked patterns, with the peak position typically occurring in the first half of the rainfall cycle. The peak coefficient distribution of short-duration rainstorms shows that short-duration rainstorms in the south reached their peak rainfall intensity earlier than those in the north. On this basis, using the Chicago method and PC method, short-duration storm hyetographs were designed, which could be used in the design of drainage systems to provide support in effectively reducing urban flood threats. By comparing the hyetographs with real short-duration rainstorm patterns, it was found that the precipitation process designed using the PC method was most similar to the actual precipitation process. However, the PC method was found to be highly dependent on local precipitation data, whereas only the rain peak coefficient is required to design the Chicago rainstorm hyetograph. Therefore, we primarily recommend hyetographs designed using the PC method for Jiangsu Province’s 13 major cities, while we recommend the Chicago hyetograph for the surrounding areas of the 13 cities that have no meteorological stations or lack data.

1. Introduction

There are numerous causes of urban waterlogging. Among them, one of the main causes of urban rainfall waterlogging disasters is a low design standard for rainwater drainage [1,2]. The measurement of urban rainstorm intensity and the design of rainstorm hyetographs are important aspects in drainage design standards. They serve as the foundation for the scientific and rational planning and design of urban drainage systems, providing scientifically precise design parameters and a theoretical foundation for municipal construction, water affairs, and planning departments [3]. Against the backdrop of climate change, regional severe rainfall events are becoming more frequent, more intense, and longer lasting, increasing the risk of urban rainstorm waterlogging [4,5,6]. The parameters of the storm intensity formula are no longer appropriate for use with these much stronger rainstorms. Previous urban drainage design requirements do not keep up with modern growth [7]. To enhance a city’s flood management capacity, it is necessary to rebuild urban drainage systems to accommodate for changes in rainfall frequency and distribution [8,9]. Rainstorm hyetographs mainly formulate a rainstorm’s intensity and design the pattern of a rainstorm. The rainstorm intensity formula is an expression of the law that governs the amount of rain during the heaviest period, but it cannot reflect changes in rainstorm intensity over time. Thus, in addition to determining the rainfall intensity formula, features that cause variation in a rainstorm’s intensity need to be investigated. Numerous studies have been conducted regarding the rainstorm intensity formula in the past, but relatively few have studied rainstorm hyetographs [10,11,12,13]. A rainstorm pattern is a time-dependent distribution of rainfall intensity that may provide a more precise description of the creation and flow of surface runoff. Additionally, it is also essential in the design of drainage systems for both rainfall flow rate estimation and road waterlogging calculations [14,15,16]. A uniform hyetograph is often used in prior inference methods to calculate minor watershed floods. However, uniform hyetographs are simplifications that do not suit contemporary urban drainage planning requirements. Different rainstorm patterns result in obvious differences in the rainfall runoff calculation results. If the rain pattern is not suitable, it will result in significant errors [17].
As early as in the 1940s, the statistical study of rainfall data in Ukraine revealed seven distinct types of rainfall and the existence of a small number of rainfall types with essentially uniform intensity [18]. In 1957, Keifer and Chu developed the Chicago hyetograph method, an uneven-design rainfall hyetograph based on the rainfall intensity–duration–frequency relationship [19,20]. Following that, Huff, Pilgrim and Cordery, and Yen each presented their respective methodologies for the design of rainfall hyetographs [20,21,22,23]. Deng used the rainfall hyetograph designed by Keifer and Chu to determine the volume of a storage tank [24]. On the basis of Beijing’s rainfall statistics, Wang et al. developed a rainfall hyetograph for use in Beijing [25]. After significant modeling and statistical research, Cen discovered that the Chicago hyetograph method was the simplest and most efficient [26]. According to recent research, the majority of them use the Chicago hyetograph method or the Pilgrim and Cordery (PC) method to conduct research on urban rainstorm pattern design [24]. Currently, the Chicago hyetograph method is widely used and recommended by the China Meteorological Administration and the Ministry of Housing and Construction [27].
In recent years, cities in China have undergone dramatic changes as a result of rapid urbanization. With the increasing urbanization of the population, new standards for disaster prevention and mitigation have emerged [28,29,30]. The short-duration rainstorm hyetograph serves as the foundation for drainage design and is instrumental in conducting related research. There have been some relevant studies on the design of short-duration storm patterns in Chinese cities [31,32,33]. The design of short-duration rainstorm patterns requires a large amount of minute precipitation data. The majority of previous studies on short-duration rainstorm design have only dealt with a single city using one or two methods, but rarely for multiple cities or regions. It is necessary to carry out the design of rainstorm patterns for multiple cities in a region. For example, by calculating the rainfall peak coefficients for multiple cities in a region, one can determine the distribution of rainfall peak coefficients across the region. Areas or cities that do not have enough precipitation data can estimate rainfall peak coefficients by referring to the distribution of rainfall peak coefficients within the region. Based on this, the design of short-duration rainstorms can be conducted in cities without precipitation data.
In this study, an analysis of short-duration rainstorms was carried out for 13 cities in Jiangsu. First, we analyzed the trend of the short-duration rainstorms in recent decades and revised the rainstorm intensity formulas using the Gumbel, exponential and Pearson III distribution. On the basis of the revised rainstorm intensity formulas, the distribution of short-duration rainstorm intensity with a 100-year return period was calculated. Then, we explored the temporal distribution and estimated the rainstorm peak coefficient for each city. The PC method and the Chicago hyetograph method were used to design short-duration rainstorm hyetographs for each city. The distribution of rainfall peak coefficients of short-duration rainstorms in Jiangsu Province was given. Finally, the analyses were conducted on the applicability of the two methods. Based on this, the design of short-duration rainstorms can be conducted not only in the 13 major cities, but also in areas where no precipitation data are available in Jiangsu.

2. Materials and Methods

2.1. Data

The minute precipitation data were gathered from climatic data sets from 13 weather observation stations in Jiangsu Province from 1961 to 2020. To revise the storm intensity formula, the maximum precipitation for 11 durations (5 min, 10 min, 15 min, 20 min, 30 min, 45 min, 60 min, 90 min, 120 min, 150 min, and 180 min) from 1991 to 2020 were extracted from the minute precipitation data.
To design the rainstorm hyetograph, independent rainfall events were extracted from the minute rainfall data, with the interval between events defined by a 120 min period without precipitation. According to the China Meteorological Administration, a rainfall event with more than 16 mm of precipitation in one hour or 50 mm of precipitation in one day is considered a rainstorm. Therefore, we further screened out rainfall events with a total accumulation exceeding 16 mm, a rainfall intensity greater than 16 mm/h, and a duration of no more than 3 h from the extracted independent precipitation events, defining them as short-duration rainstorm events. The statistical samples that were set up met all of the requirements in terms of reliability, consistency, representativeness, and independence.

2.2. Rainstorm Intensity–Duration–Frequency Formula

In China, research concerning simple urban rainstorm intensity calculations began in the 1970s. Theoretically, the mathematical equation is:
q = 167 A 1 ( 1 + C lg P ) ( t + b ) n
where t is the rainstorm duration (min); P represents the design return period (year); A 1 and C are the rainfall intensity parameter and intensity changing parameter, respectively, and these two parameters reflect changes in intensity for different return periods of rainstorms, which are positively related to rainstorm intensity; b and n are the rainfall duration correction parameter and rainstorm decay parameter, respectively, which reflect the changes in decreasing intensity with duration and are inversely related to rainstorm intensity. To design a rainstorm intensity formula, four parameters must be estimated, which can be solved through analysis, the creation of diagrams, and calculation.

2.3. Chicago Hyetograph Method

As illustrated in Figure 1, rainstorm processes can be categorized into seven distinct kinds. Figure 1a–c depict three distinct types of unimodal rainstorm distributions: frontal unimodal, rear unimodal, and symmetrical, with corresponding rainfall peaks occurring in the frontal, rear, and middle phases of the precipitation process. Figure 1d is an example of a uniform type. Figure 1e–g illustrate bimodal rainfall patterns, which include a peak and a previous primary peak. The properties of the rainfall have a strong correlation with the rainfall duration analyzed. Currently, most previous studies focus on short-duration rainstorms. Numerous studies have revealed that short-duration rainstorm hyetographs are mostly unimodal. As a result, short-duration rainstorm hyetograph analysis techniques are largely based on unimodal distribution.
In this study, the Chicago hyetograph method was used to create short-duration rainstorm hyetographs for 13 cities throughout Jiangsu Province (Figure 2). The technical procedure of the Chicago hyetograph method is depicted in Figure 2. The Chicago hyetograph method consists of calculating various maximum rain intensities over a specified return period, as well as calculating the comprehensive rainfall peak coefficient. The key link in the technical process, according to the technical flow chart, is the calculation of the rainstorm peak coefficient, which is then combined with the rainstorm intensity formula for the short-duration rainstorm precipitation process.
The rainfall precipitation value is collected every 5 min to calculate the peak coefficient of the whole process:
r i = t i T i
where r i is the rainfall peak coefficient, t i is the rainfall peak moment, and T i is rainfall duration. The value of r i is determined by weighted average according to the ratio of the peak time of each rainfall with different durations to the whole duration and ranges from 0 to 1.
The Chicago method is based on the rainstorm intensity formula, and the rainfall peak moment of the rainstorm process is represented by the comprehensive precipitation peak location coefficient r, which divides the rainstorm process into two parts: the pre-peak period and post-peak period. The formula of rainstorm intensity is i = A ( t + b ) n ; then, the expression of rainstorm intensity before and after the peak is:
i ( t b ) = A [ ( 1 n ) t b r + b ] [ ( t b r ) + b ] n + 1
i ( t a ) = A [ ( 1 n ) t a 1 r + b ] [ ( t a 1 r ) + b ] n + 1
where i ( t b ) and i ( t a ) represent the instantaneous intensity before and after the peak, respectively; t b and t a represent the rainfall duration before and after the peak, respectively. A, b, and n are the parameters in the rainstorm intensity formula, and r is the comprehensive rainfall peak coefficient. By substituting the peak coefficient r into Equations (3) and (4), the rainstorm intensity and cumulative rainfall are obtained. Finally, the rainfall time distribution hyetograph for different return periods can be derived.

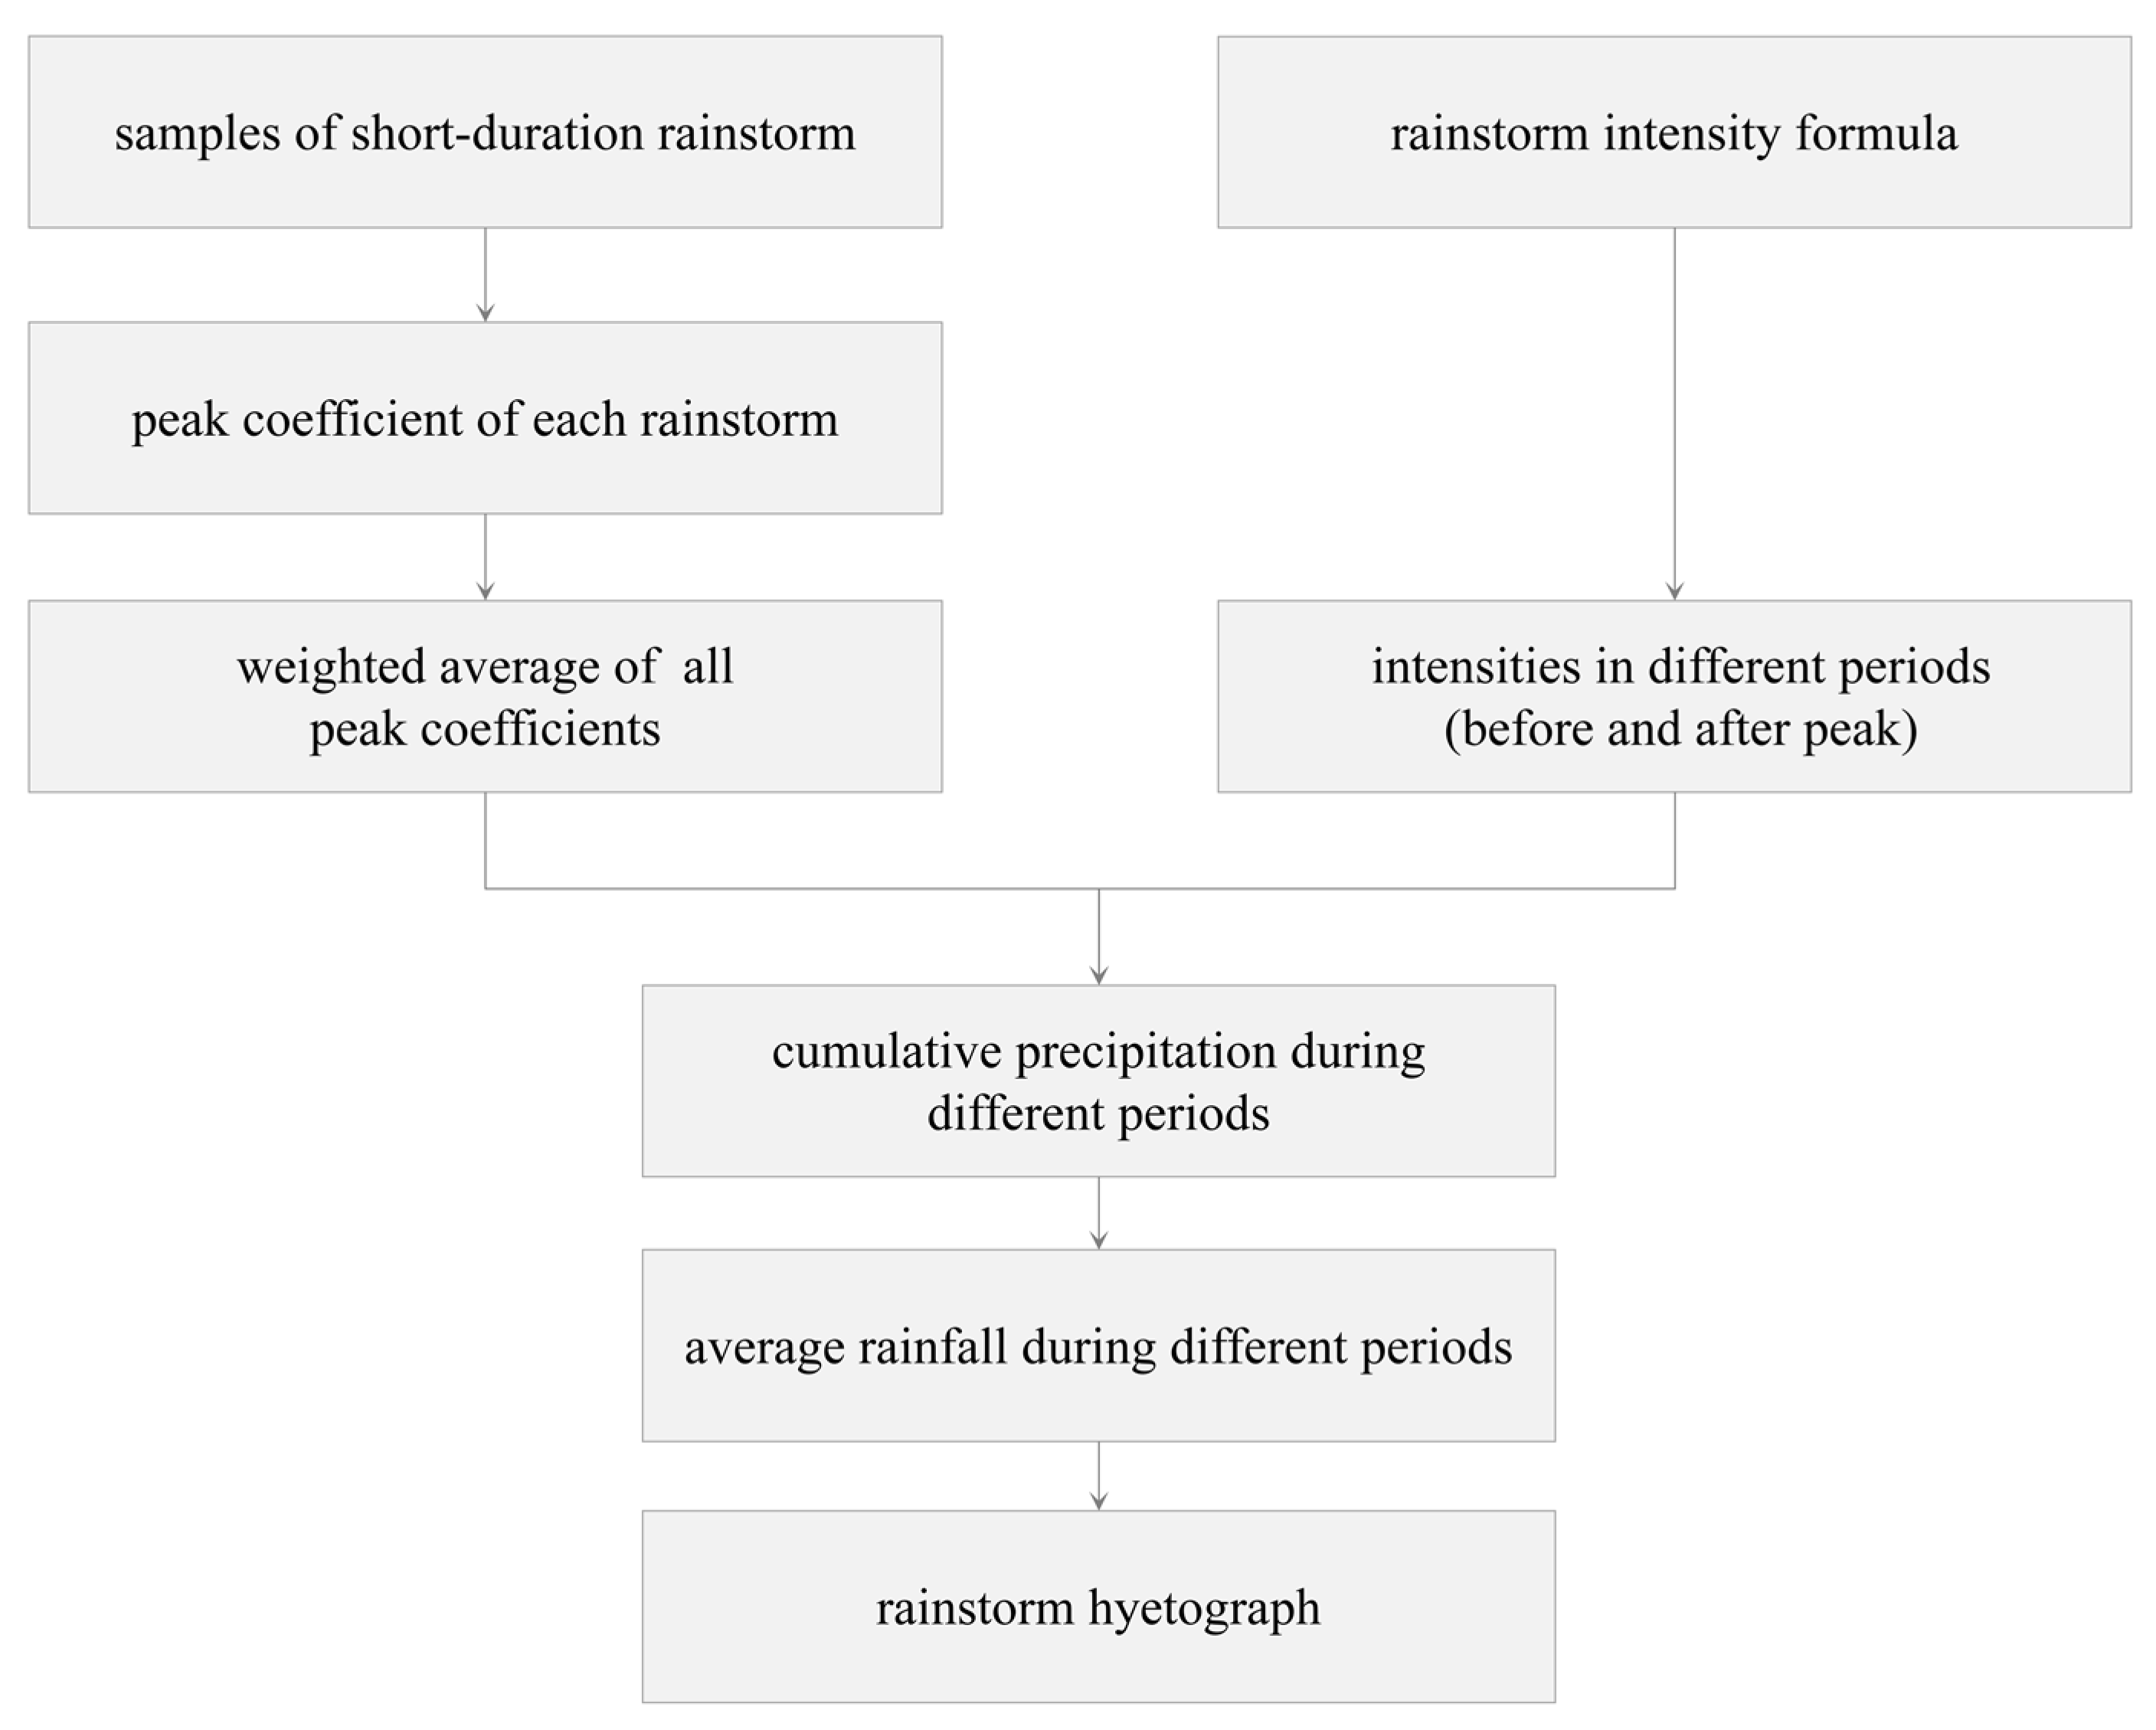
2.4. Pilgrim and Cordery Method

The PC method locates the rainfall peak period at the position with the highest probability of occurrence, and the proportion of the rain peak period in total rainfall is calculated as the average of the proportions of the rain peaks in each field. The positions and proportions of the subsequent periods are determined in a similar manner. The specific procedure is as follows:
  • A sample with a prolonged rainstorm is selected. Multiple rainfall events with the greatest amount of rainfall are selected; the more statistics, the clearer the statistical significance;
  • The rain duration is divided into multiple time periods, the length of which are determined by the distribution time step required, which is often as minimal as possible. For instance, 120 min rainfall data were split every 5 min to infer a rainstorm pattern. The rainfall chosen in step 1 is split into 24 segments;
  • The serial number of each time period is determined based on the rainfall from each time interval for each selected rainfall. High rainfall values correlate to low numbers, and the serial number of each time period is averaged. The values are ordered from low to high in accordance with the sequence of rainfall intensity;
  • After sorting, the percentage of rainfall and total rainfall for each time period is computed, and the percentages for each time period are averaged;
  • The time periods are ordered in accordance with the maximum possible order determined in the third stage and the distribution ratio determined in the fourth step to create a rainfall process line.

3. Results

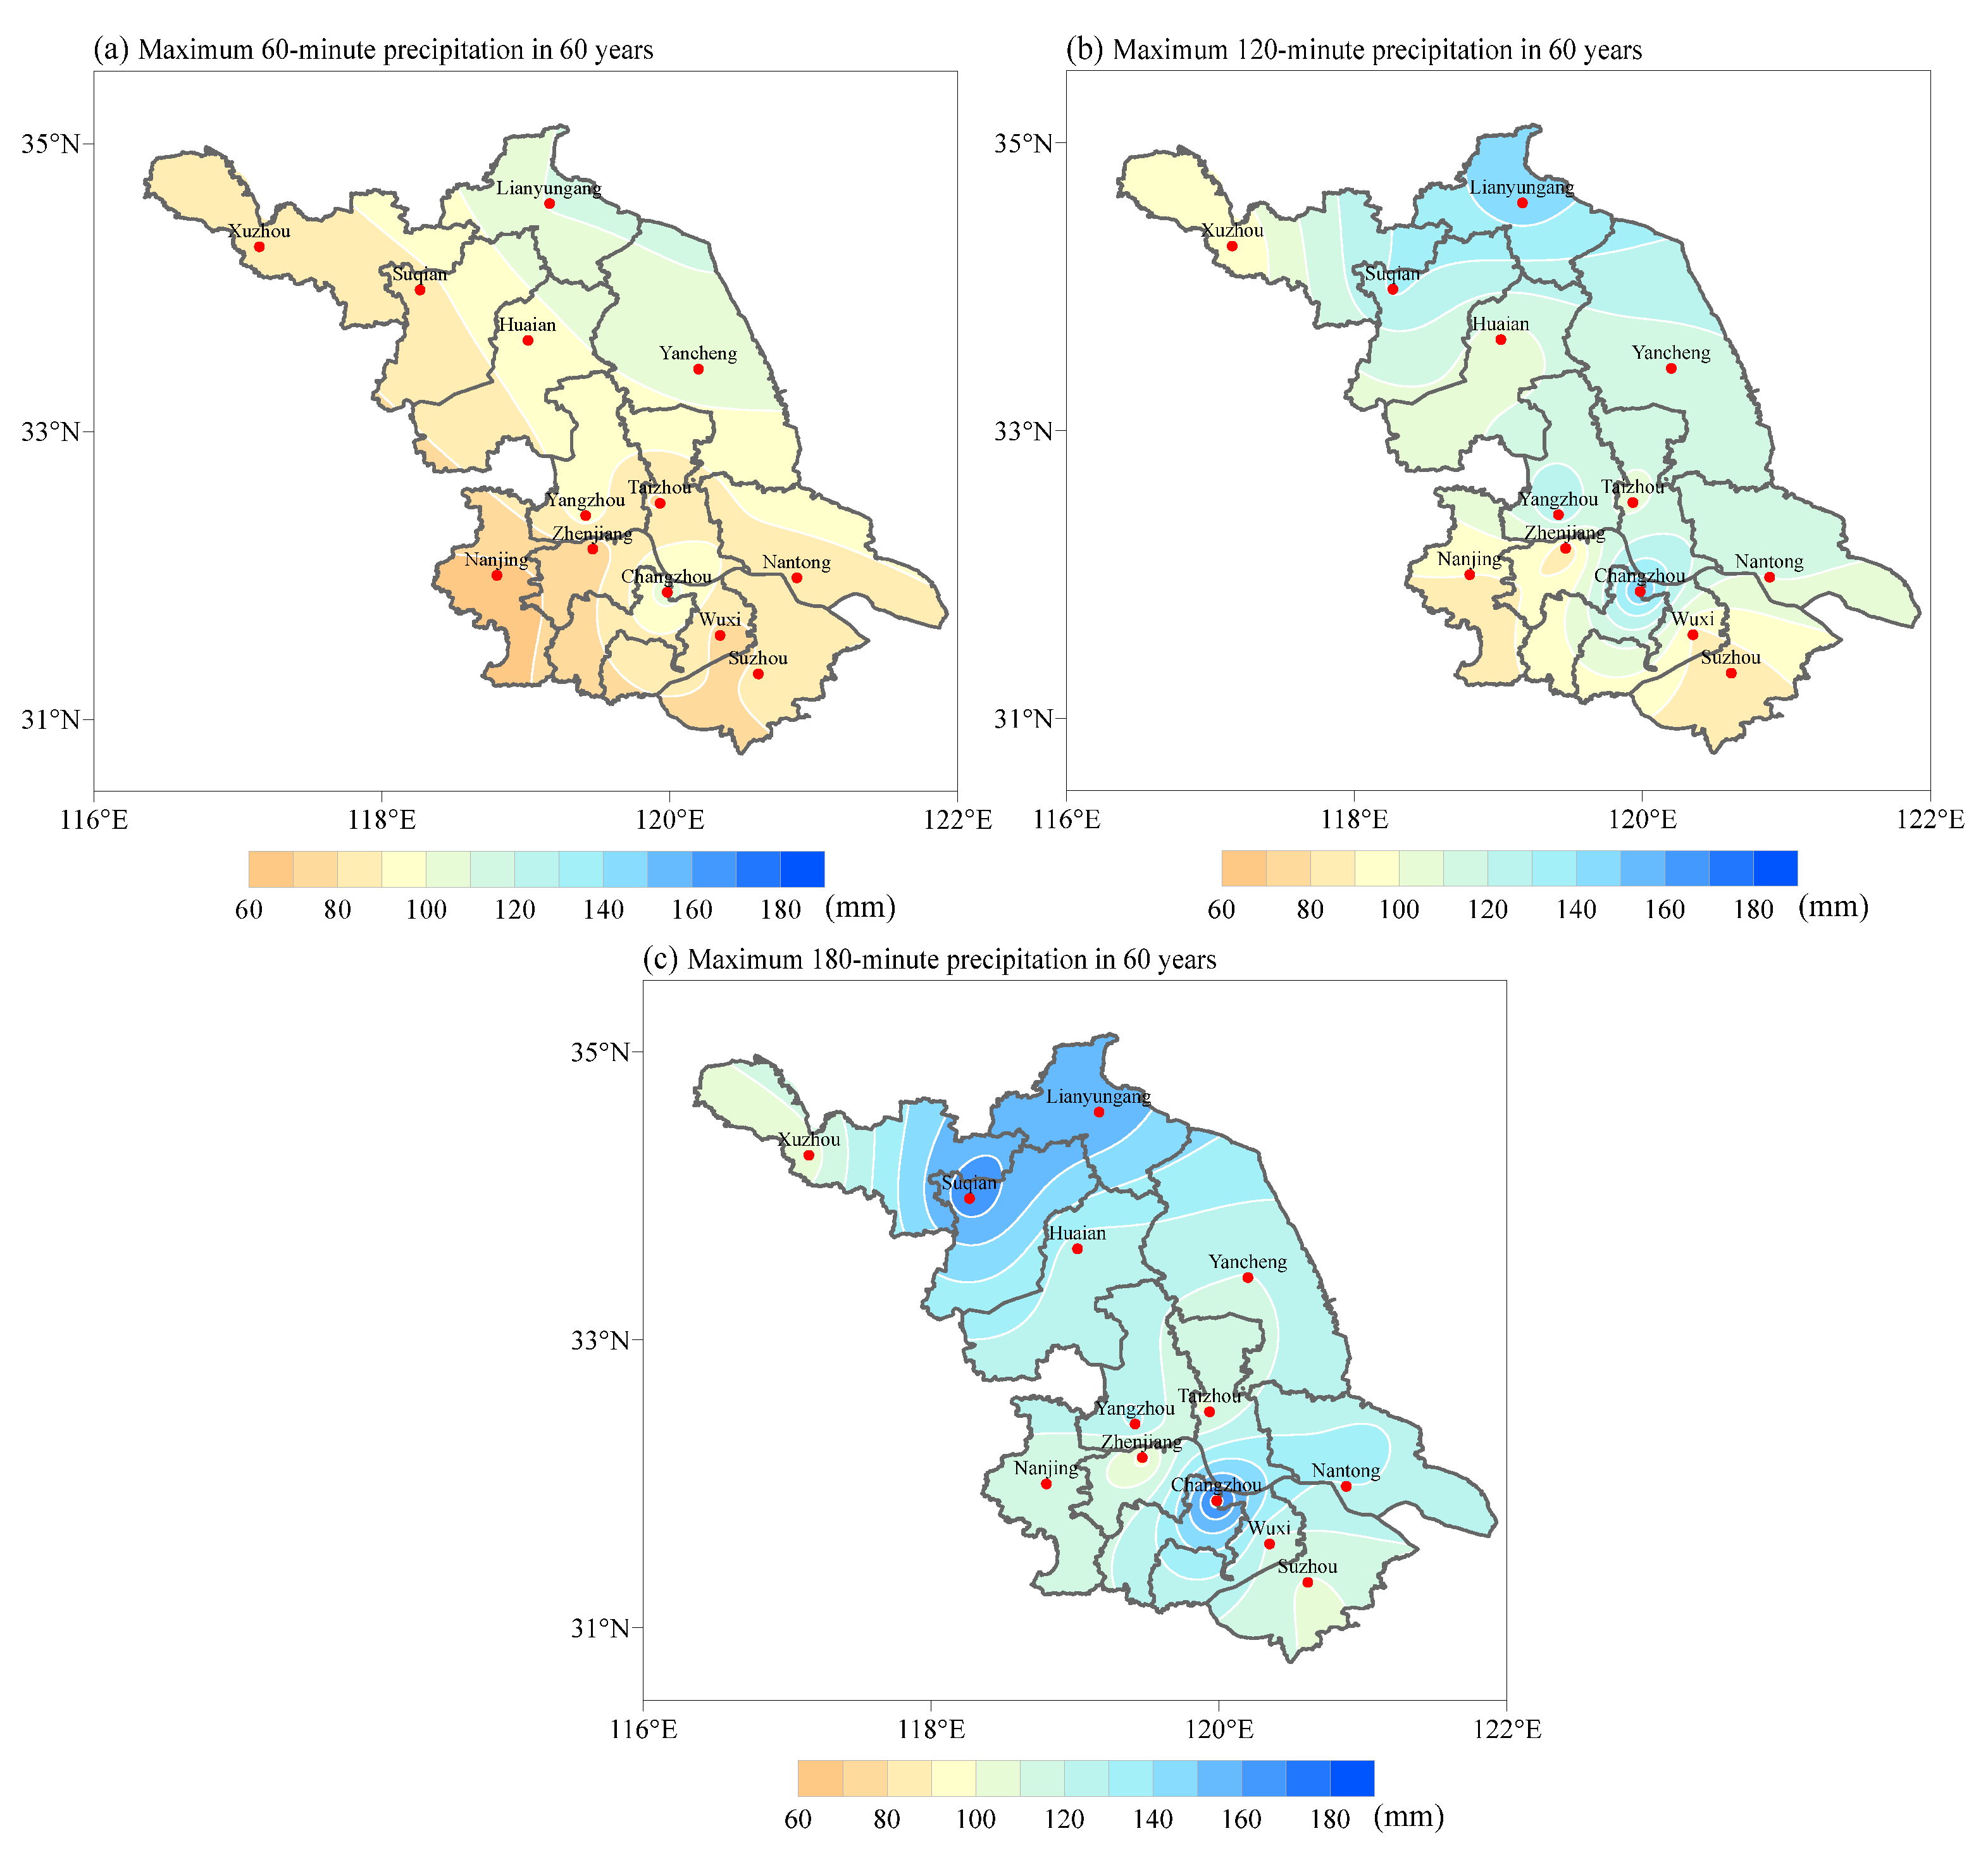
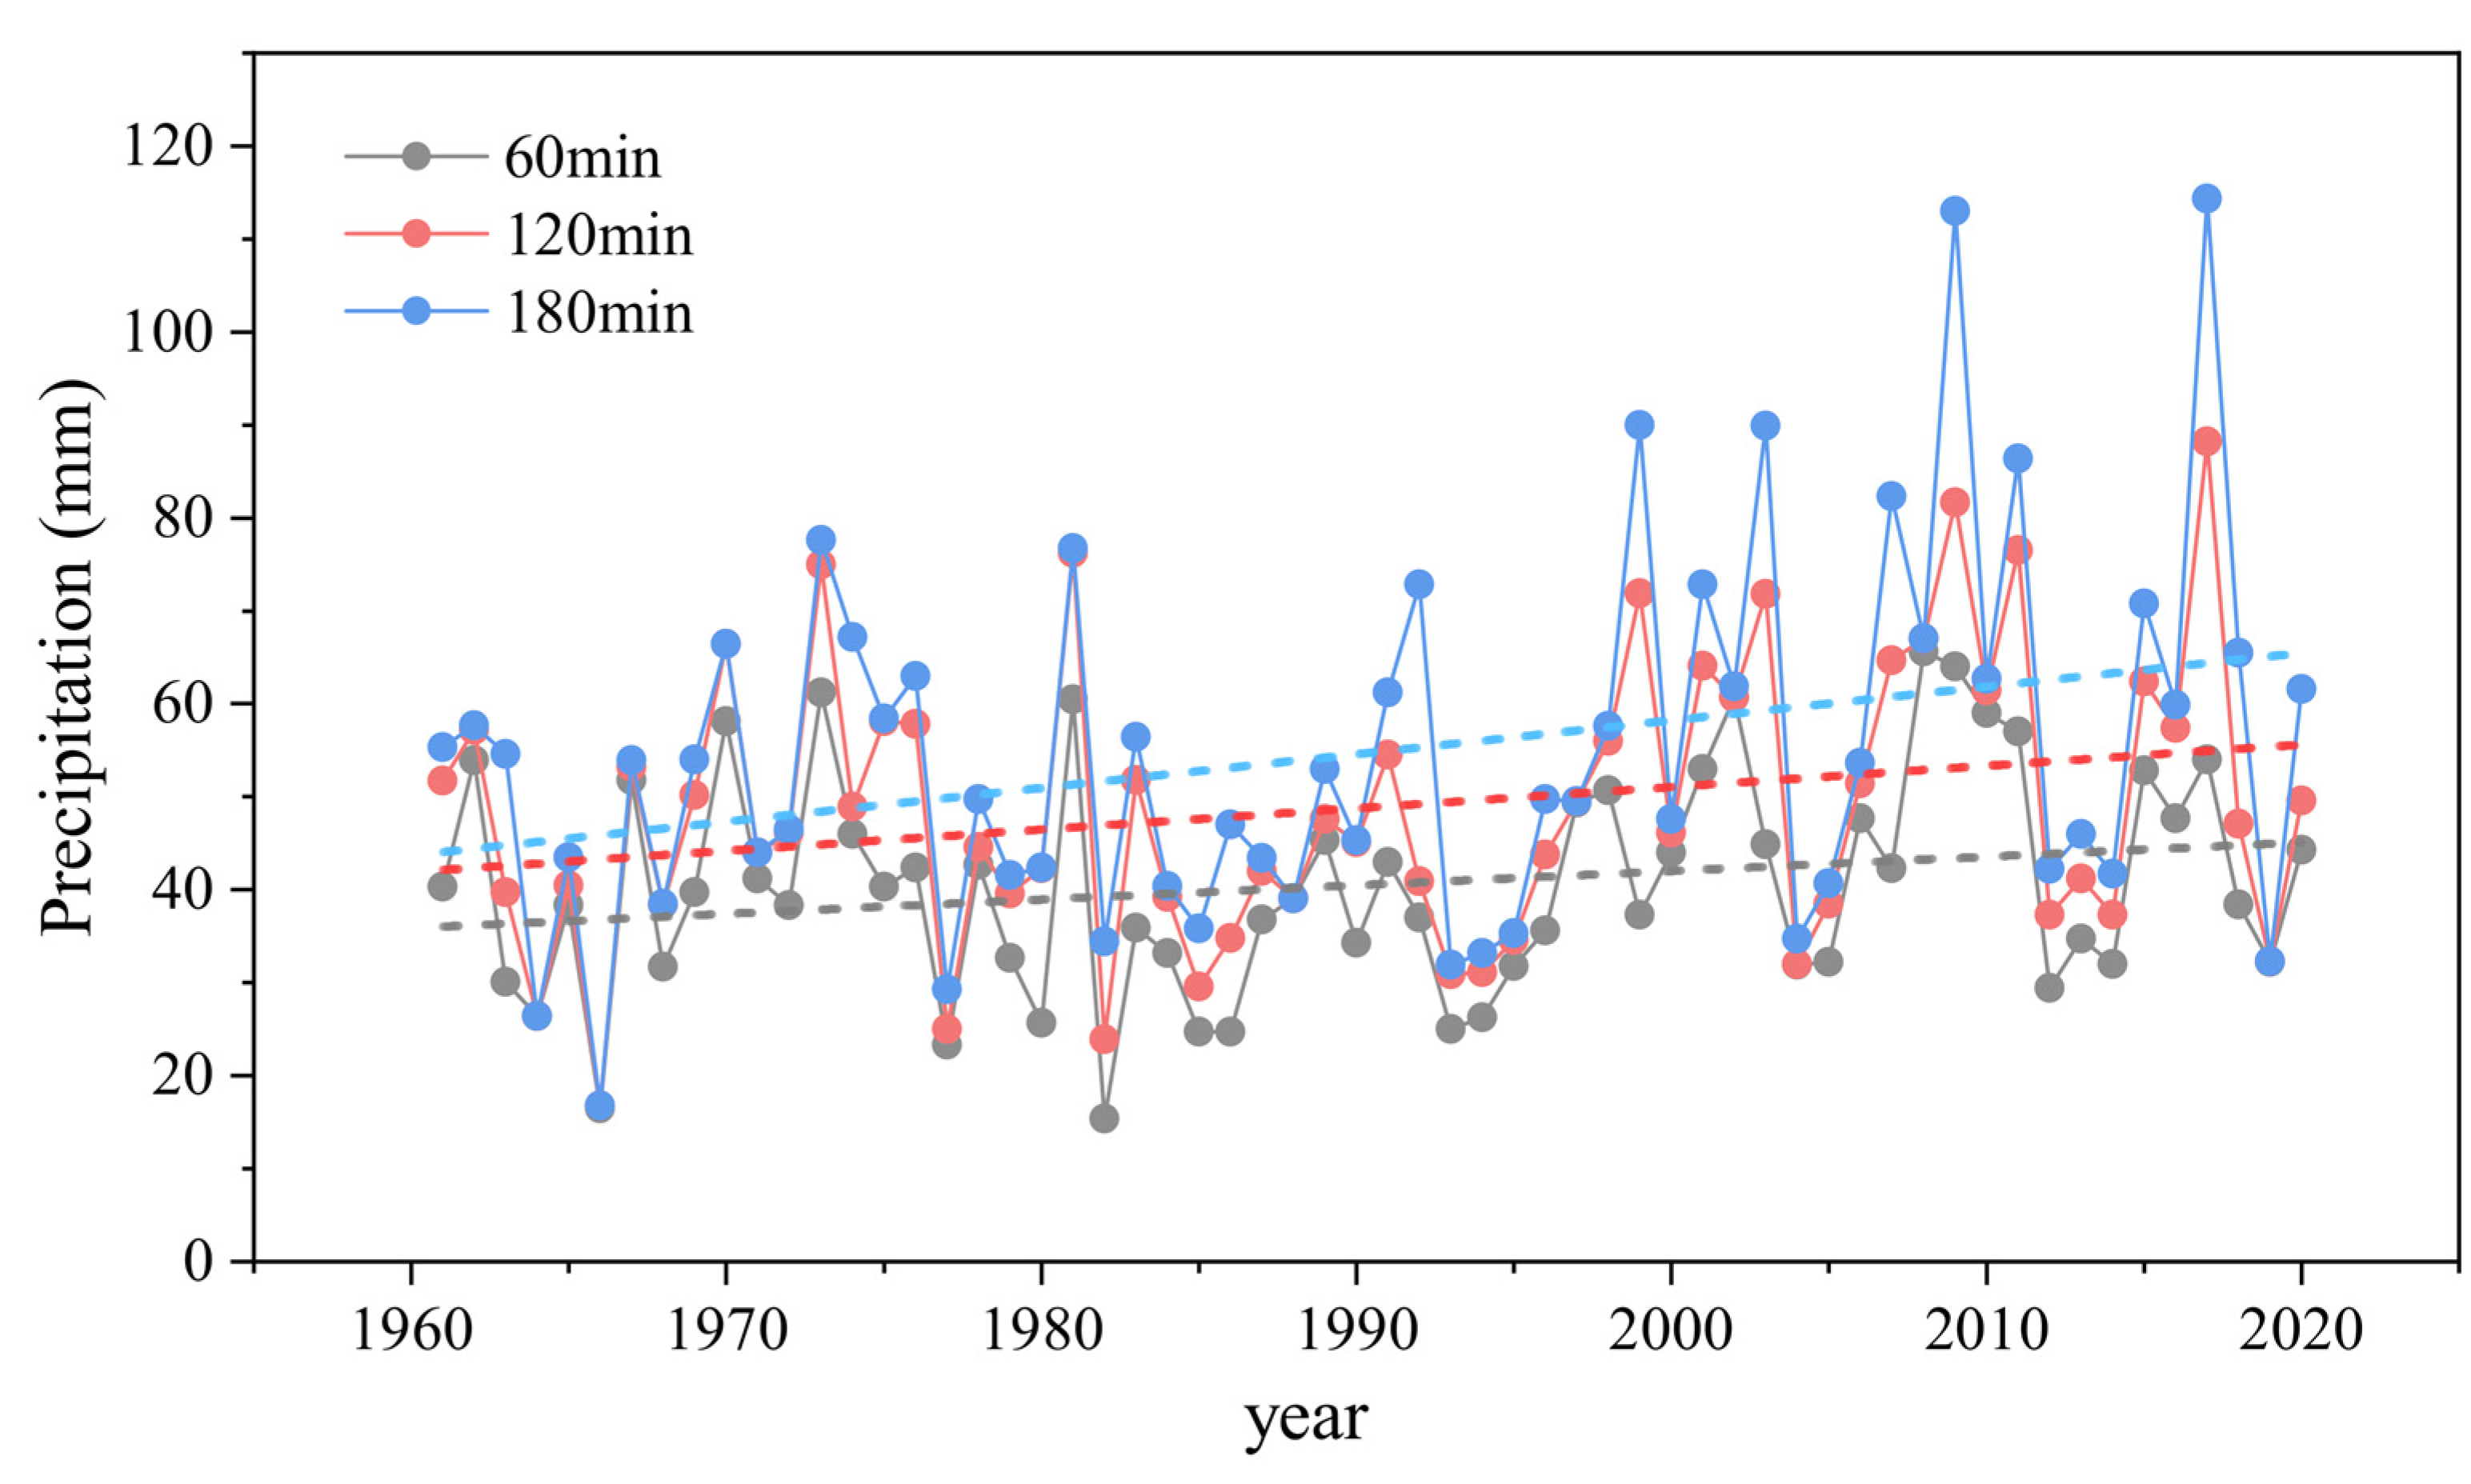
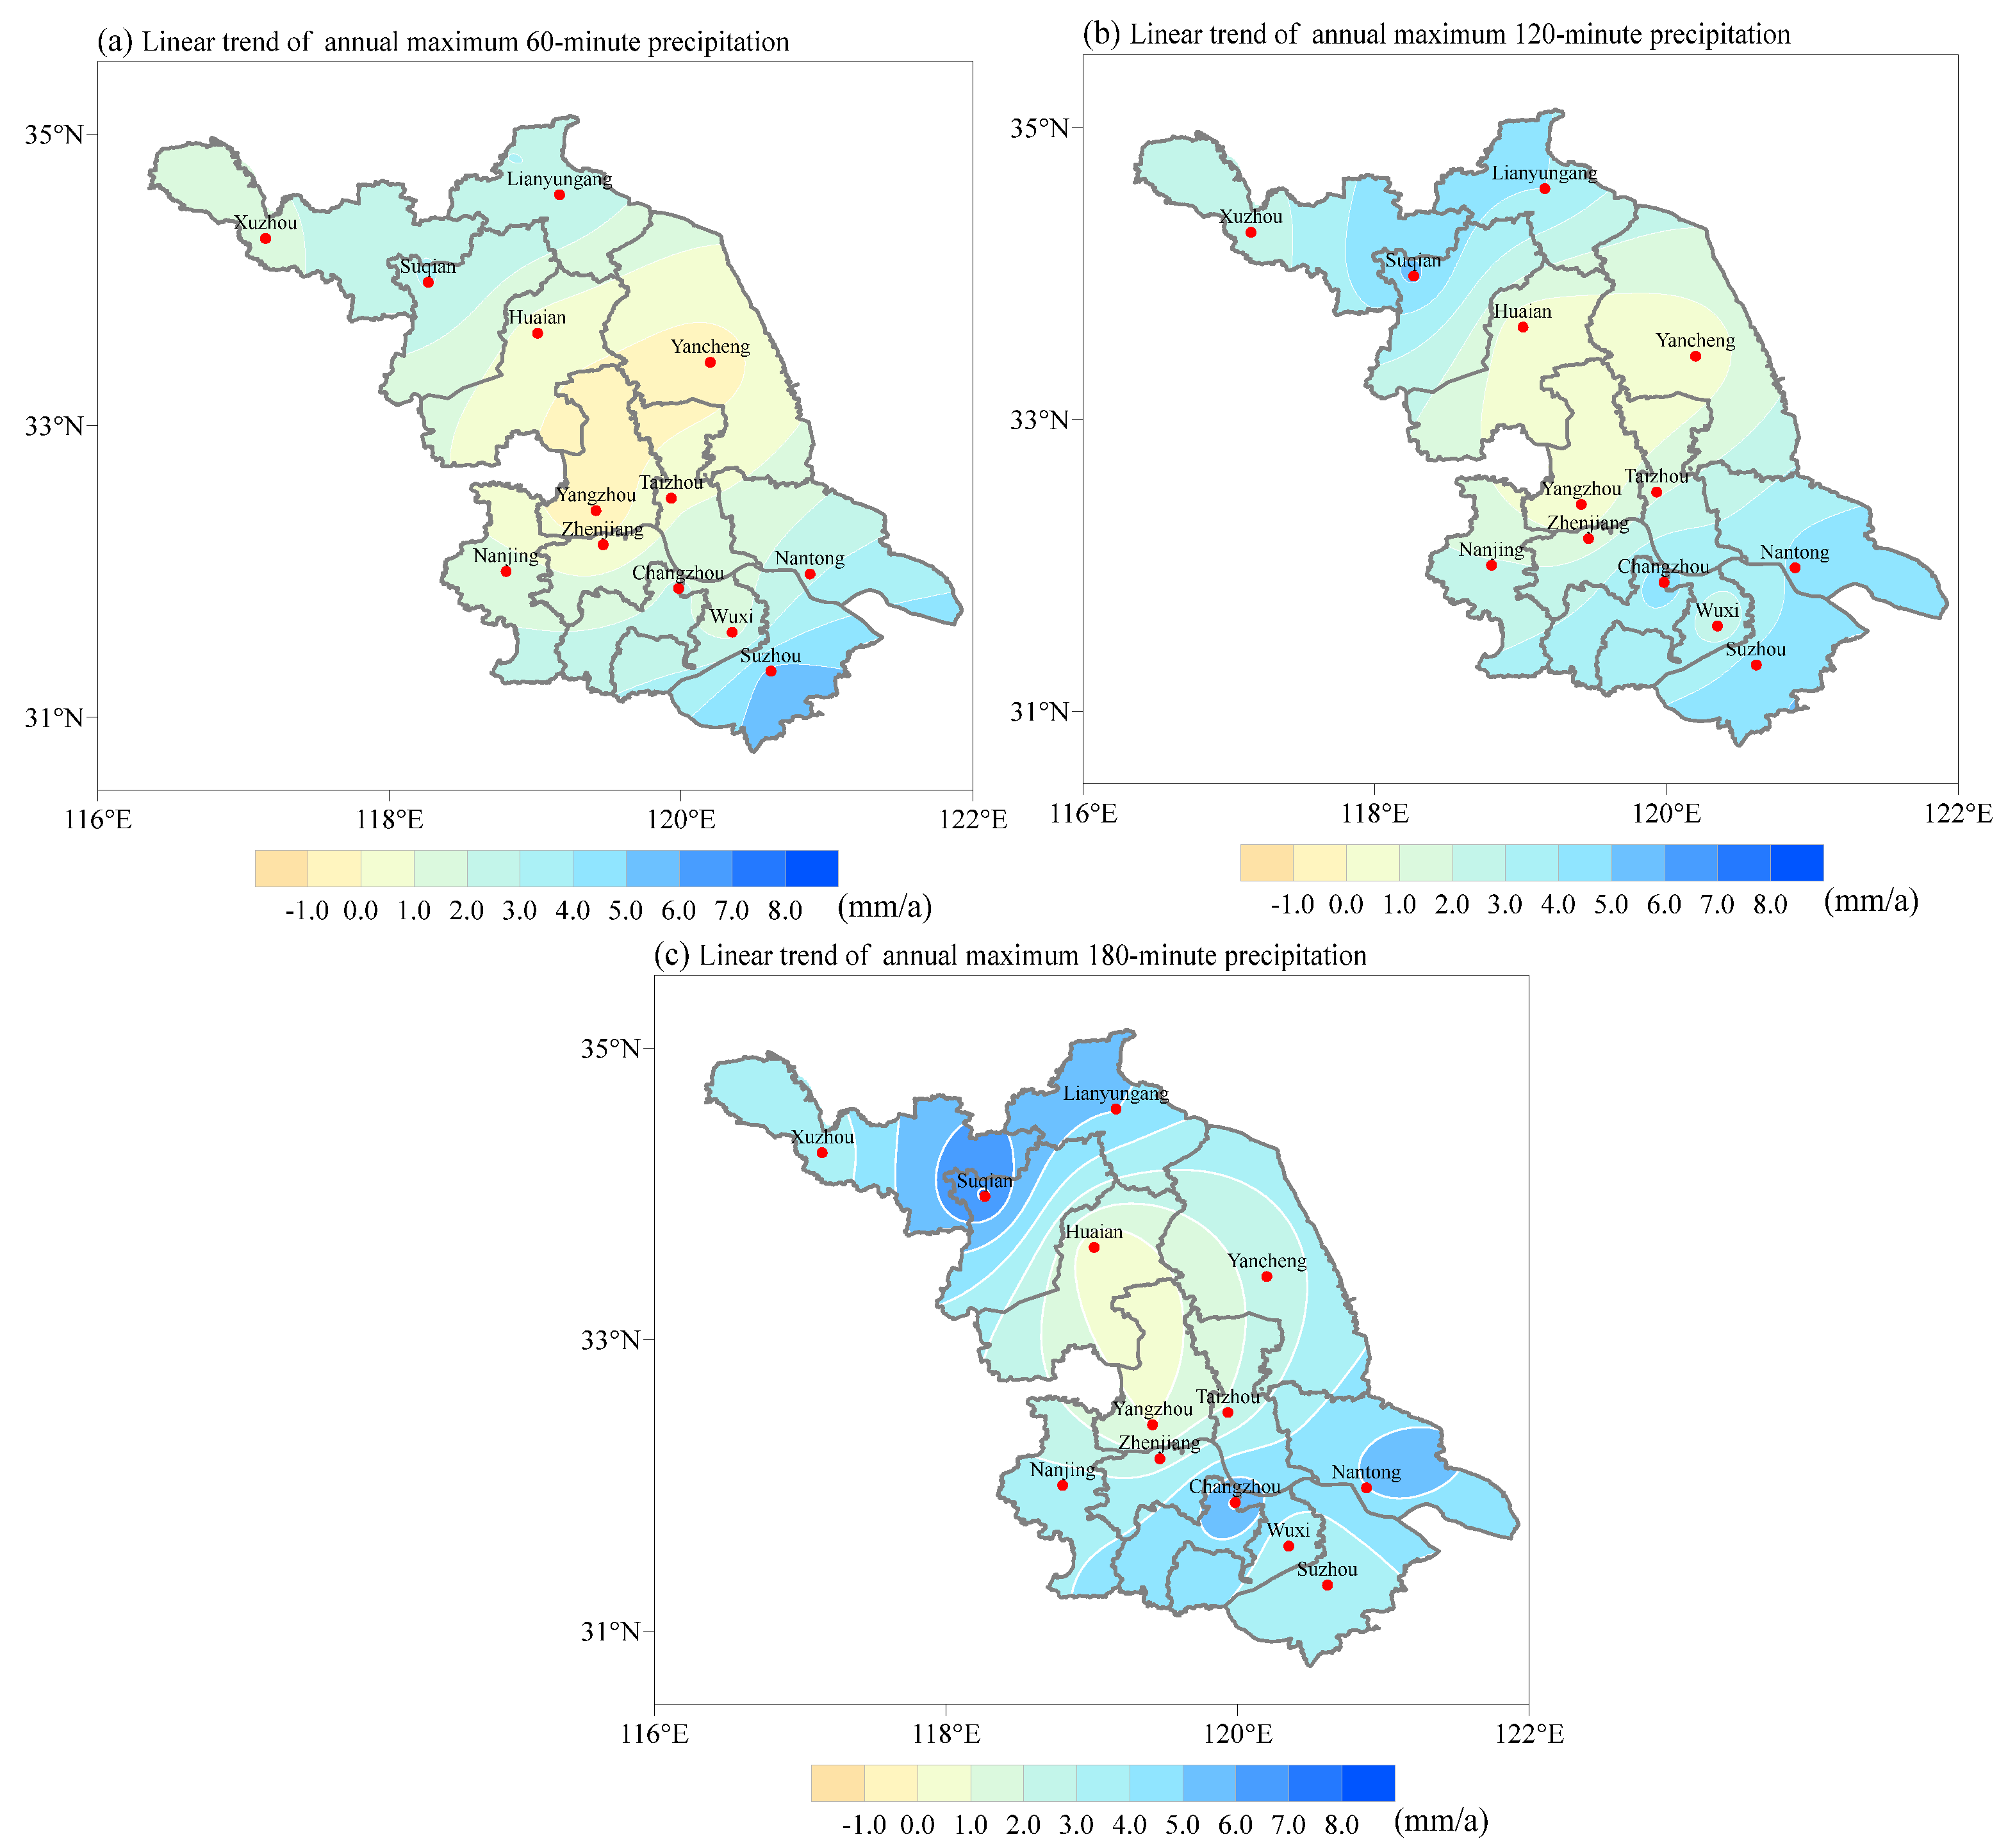
3.1. Interdecadal Variation in Rainfall Intensity

Figure 3 shows the maximum precipitation distribution of 60 min, 120 min, and 180 min from 1961 to 2020. As illustrated in Figure 3a, the 60 min maximum precipitation is highest in the northeast and lowest in the southwest. The maximum value center is located in Lianyungang, where the maximum precipitation in 60 min can reach 120 mm. The minimum value center is located in Nanjing, with a maximum precipitation of 65.6 mm in 60 min. The eastern coastal cities receive more precipitation than the western cities, averaging 90–120 mm. In other cities, the 60 min maximum precipitation basically changes from 60 to 90 mm. The distribution of the 120 min maximum precipitation is similar to that of the 60 min maximum precipitation (Figure 3b). Lianyungang and Changzhou receive the most precipitation in 120 min, with an accumulation of up to 160 mm. Nanjing continues to be the smallest center, with a maximum of just 82.2 mm. Figure 3c shows that the centers of highest precipitation for 180 min rainstorms are located in Suqian and Changzhou, with maximum values exceeding 180 mm. Additionally, the center of the minimum value is located in Zhenjiang, which is less than 100 mm.
To gain a better understanding of the interdecadal variation in storm intensity in Jiangsu Province, we analyzed the trends regarding the maximum precipitation in different durations in each city over the last 60 years. Nanjing is used as an example, and Figure 4 illustrates the annual maximum precipitation in 60 min, 120 min, and 180 min rainstorms from 1961 to 2020. As shown in the figure, the interannual variation in annual maximum precipitation was relatively consistent for the three short-duration rainstorms, and all three exhibited a distinct upward trend. From the 1960s to the early 1970s, maximum annual precipitation showed a slow increasing trend; from the mid-1970s to the mid-1990s, maximum annual precipitation showed a slight decreasing trend and was relatively low during this period. The annual maximum precipitation increased significantly between the mid-1990s and early 2000s, and then fluctuated upward until 2018, when it reached a record-breaking 117 mm in 180 min.
The linear trend distribution of maximum precipitation for 60 min, 120 min, and 180 min rainstorms in each city in Jiangsu Province over the last 60 years is depicted in Figure 5. In comparison to Figure 5a–c, as shown in the figure, the linear trend of maximum precipitation over the three rainstorm durations was positive in the vast majority of cities, indicating that the intensity of rainstorms increased over the time period across the province. This enhanced trend shows an overall distribution of strong rainfall on both sides of the province and weak rainfall in the middle, and the enhanced intensity of heavy rainfall is most obvious in Suqian in the north and Changzhou and Nantong in the south. Additionally, rainstorm intensity was shown to increase slightly in Huai’an, Yancheng, Yangzhou, and other central cities. As the duration of the rainfall grew, the tendency toward increased rainfall intensity became more apparent. As a result, we can see that the parameters of the storm intensity formula must be revised.

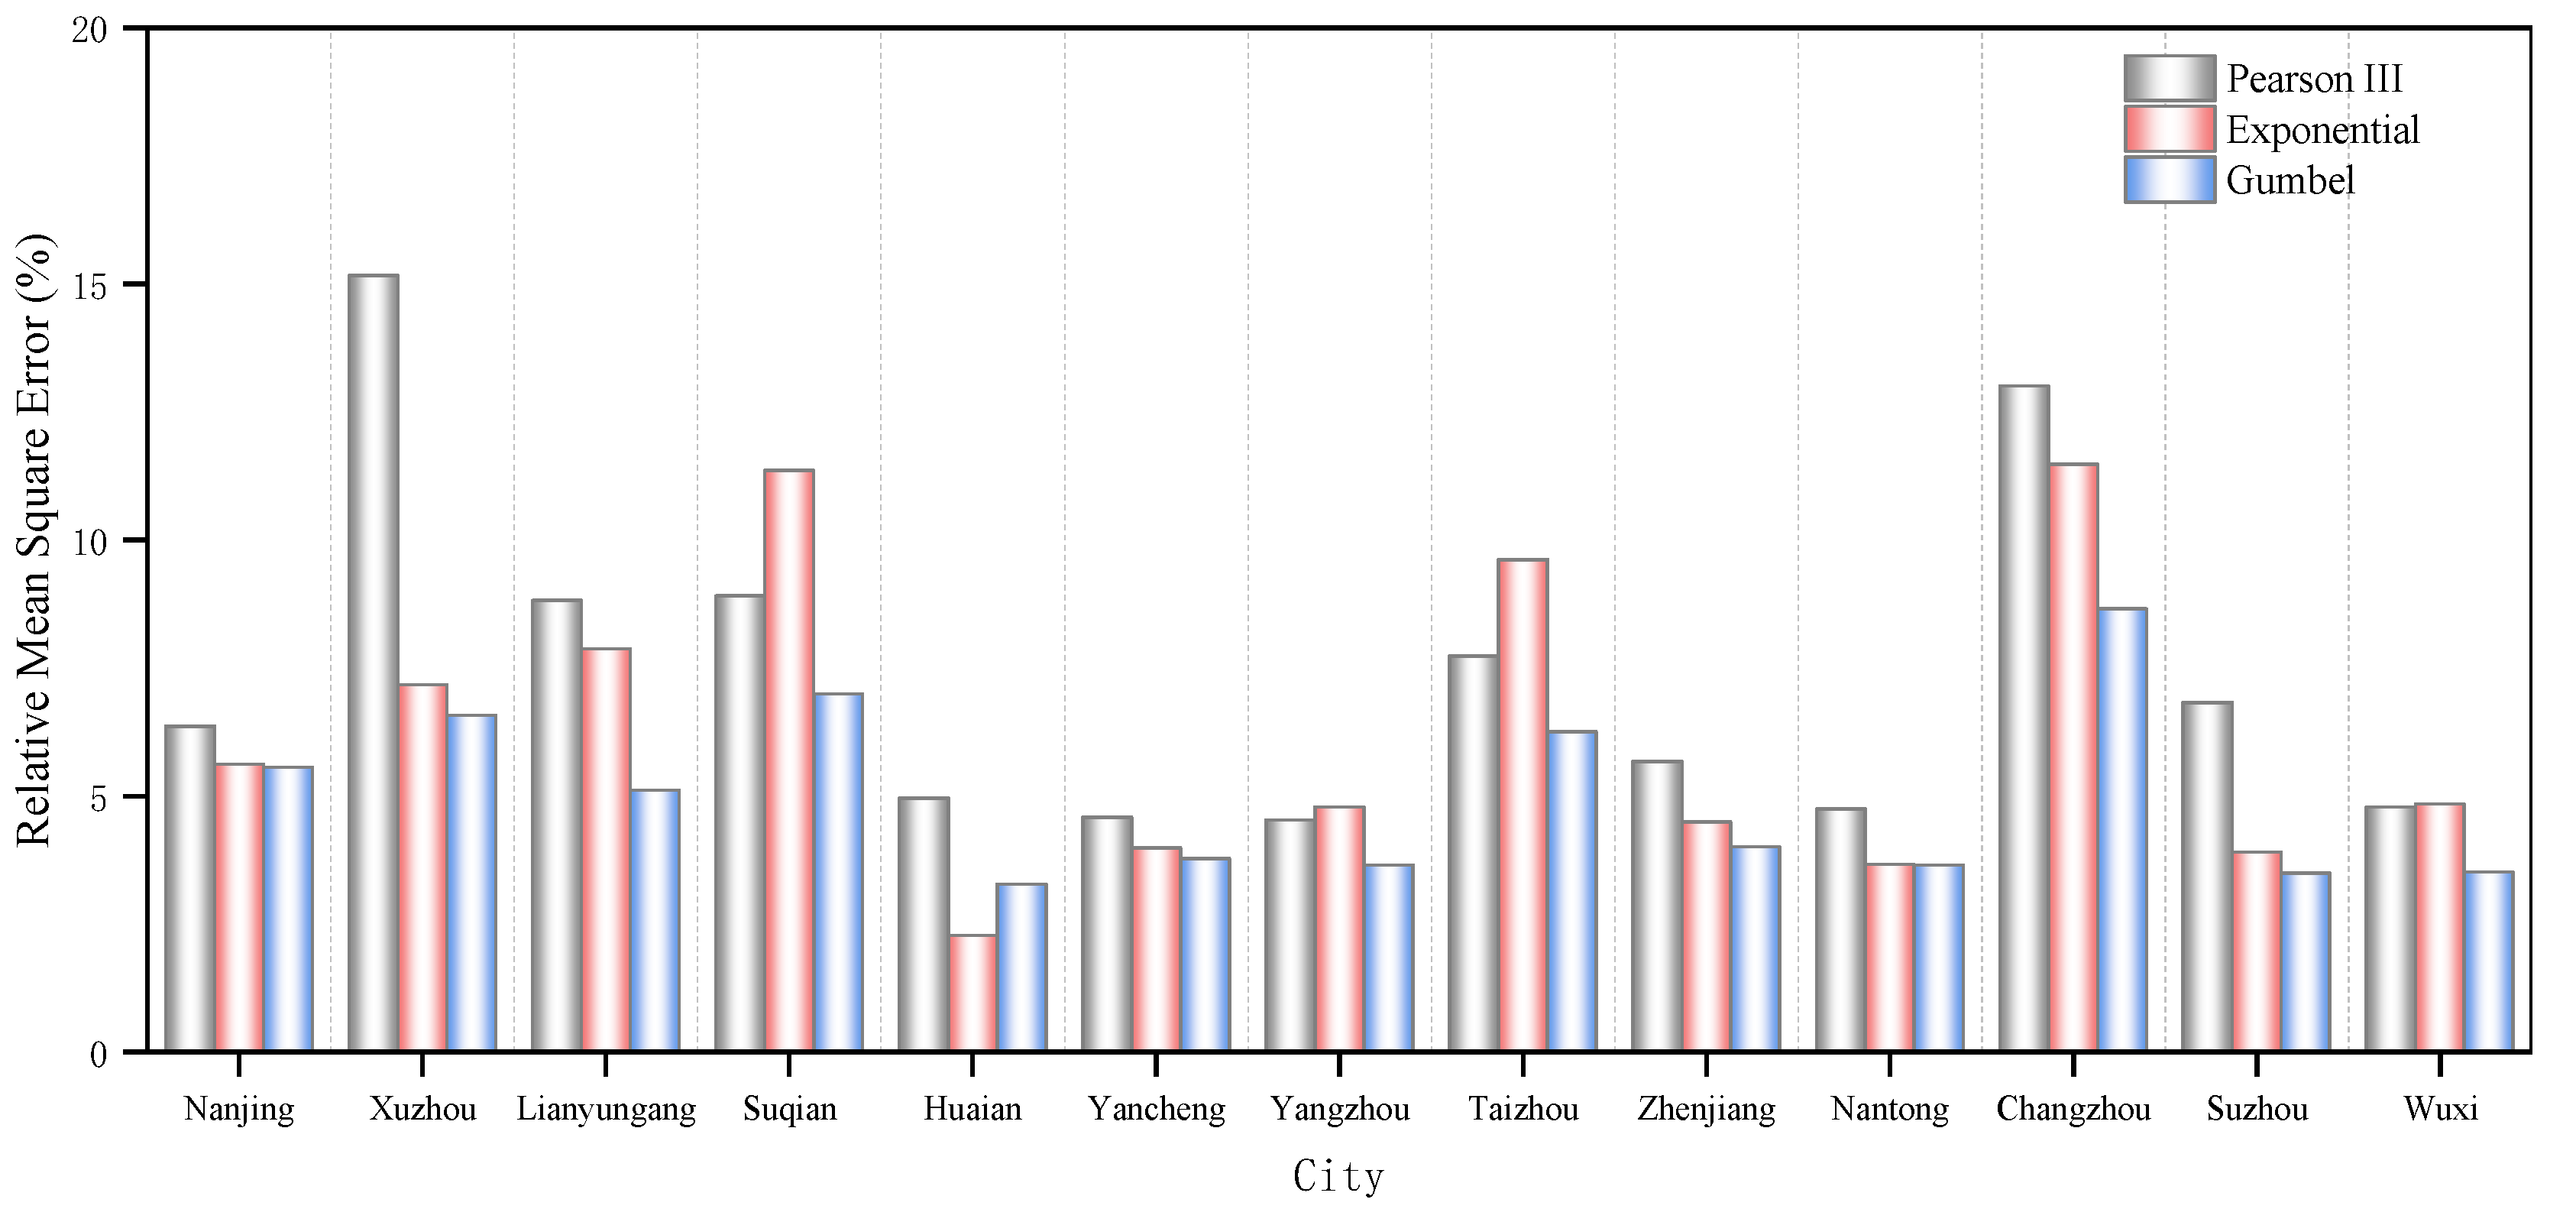
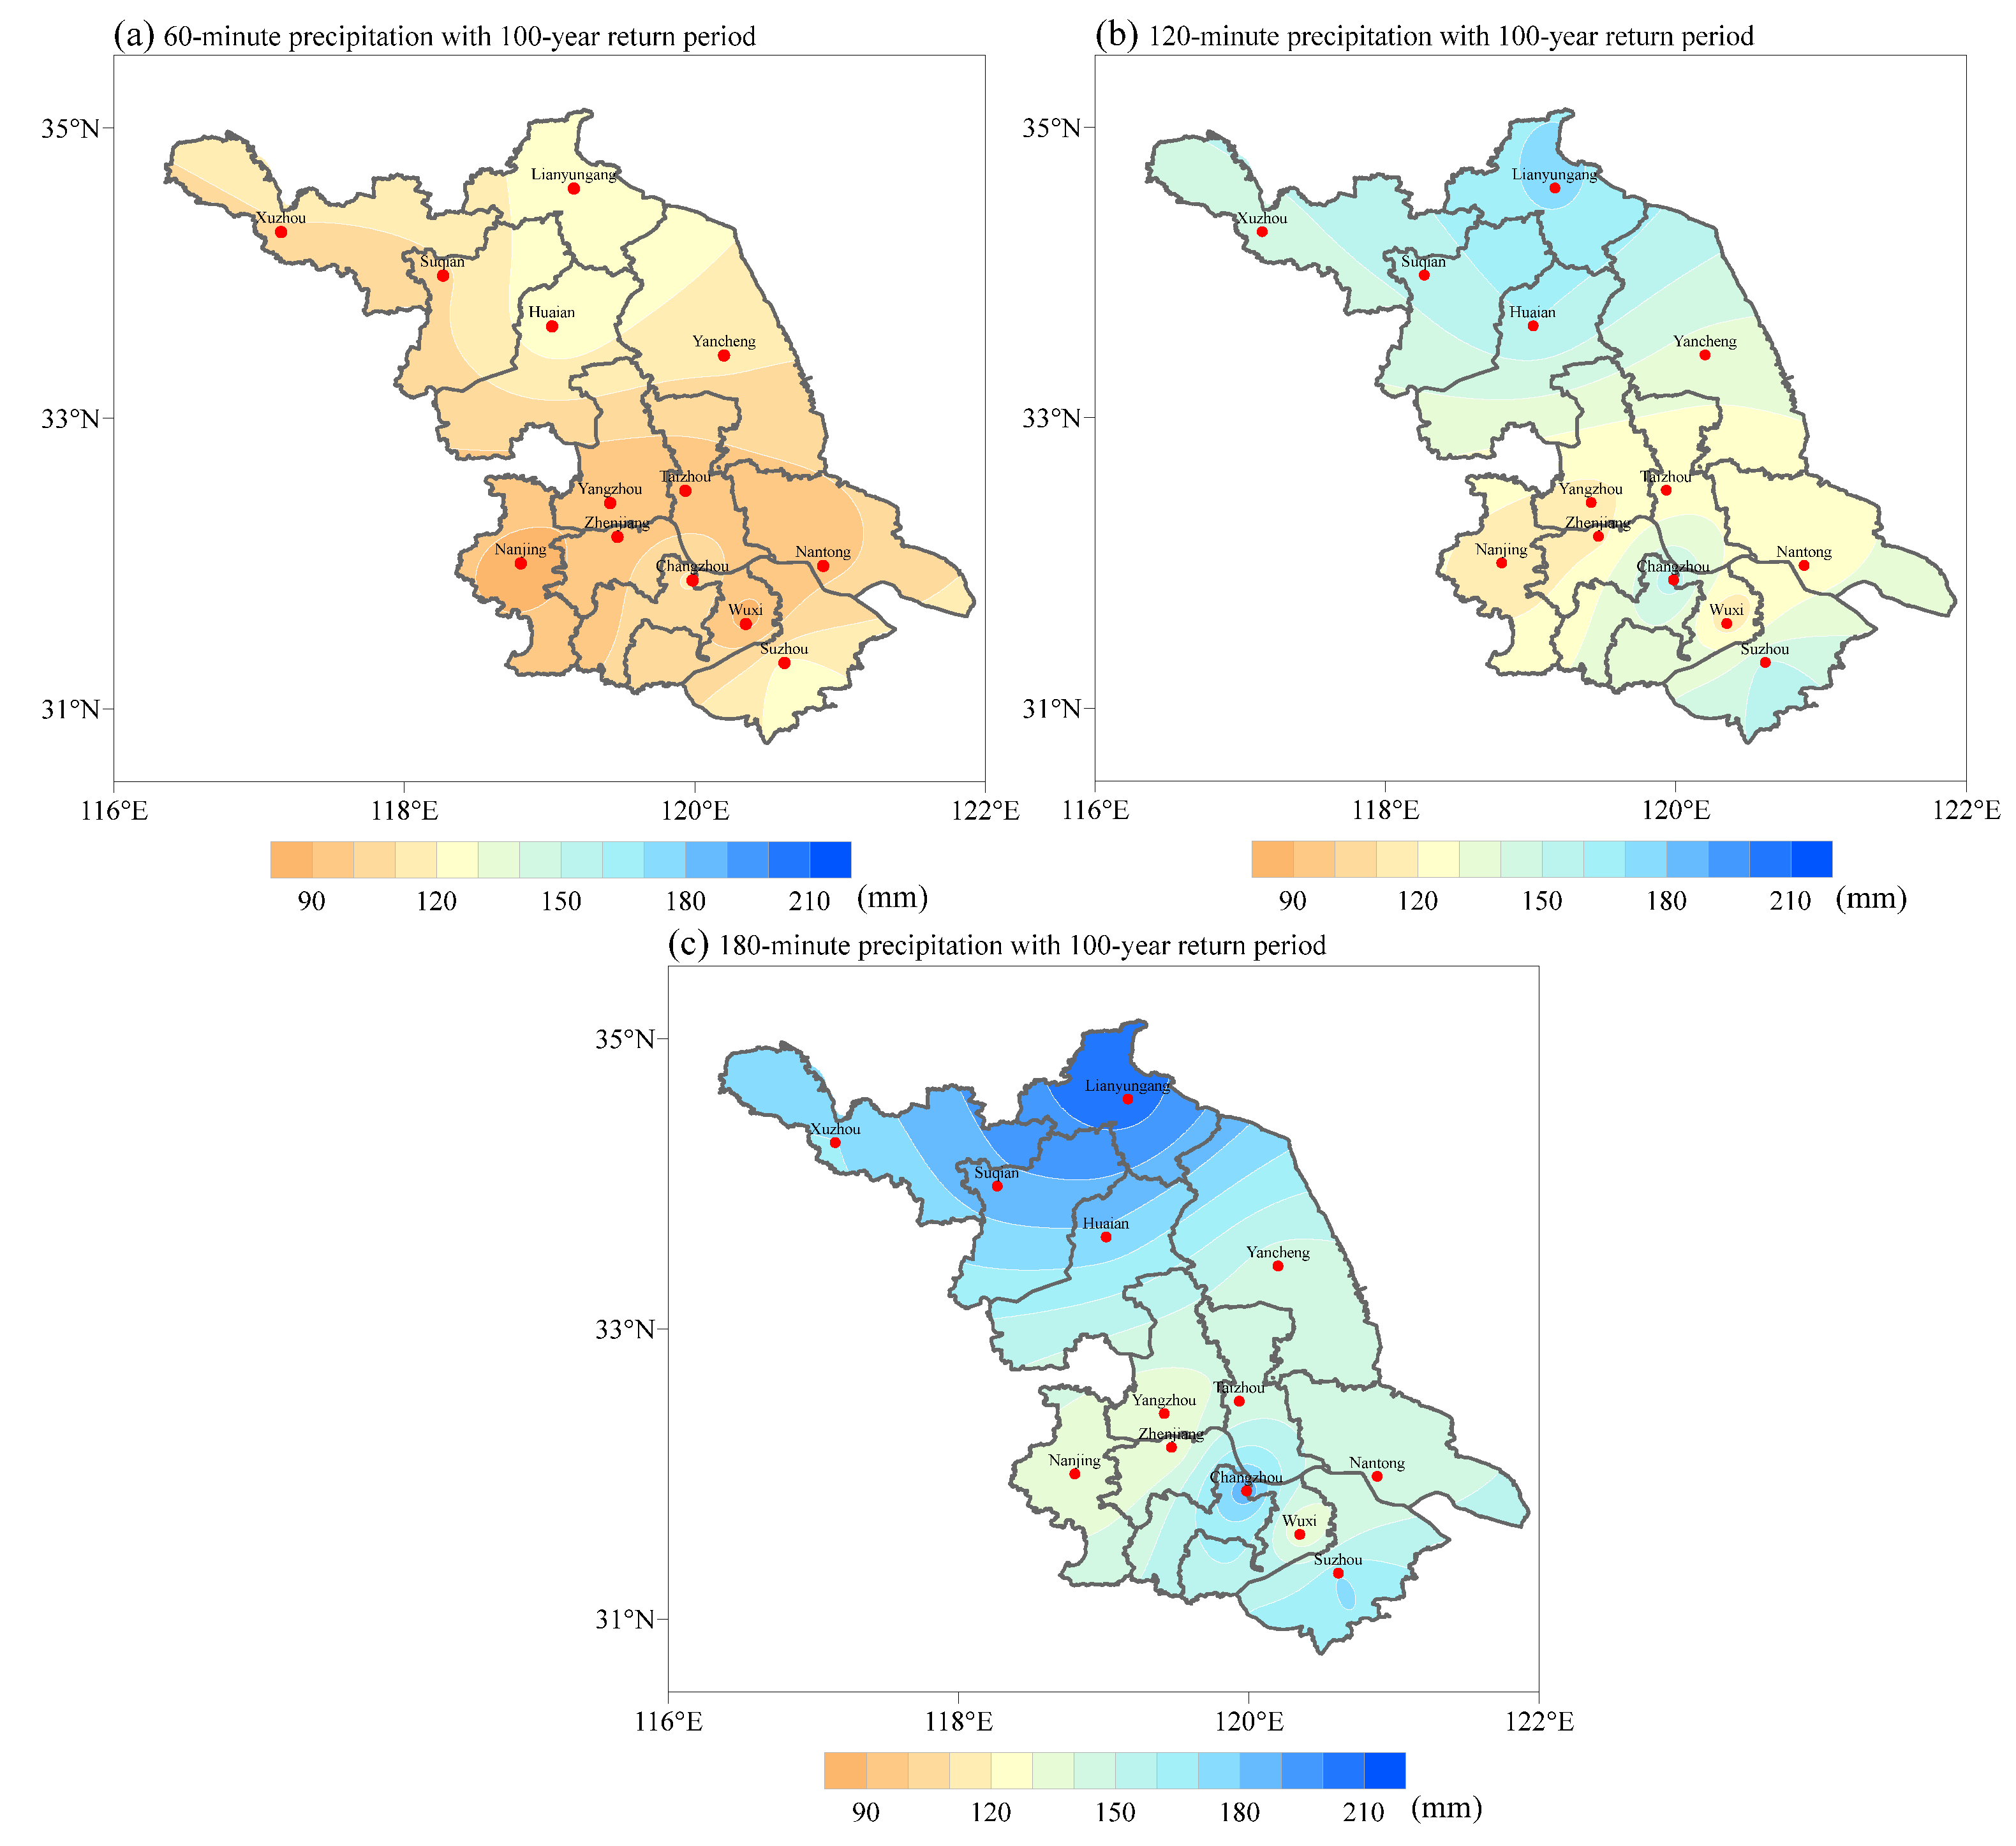
3.2. Revision of the Rainstorm Intensity Formula

From the previous analysis, rainstorms in various cities in Jiangsu Province have shown certain changing trends in recent decades. Most of them present a relatively obvious trend of enhancement. Therefore, it is necessary for the rainstorm intensity formula to be revised for each city based on the rainstorm data from recent decades. In this study, we revised the formula of rainstorm intensity based on the precipitation data from 1991 to 2020, adopted the Pearson III distribution, exponential distribution, and Gumbel distribution to fit the rainstorm distribution, and calculated the relative mean variance of the three methods. The relative mean variance in rainstorm intensity fitted using these three methods is shown in Figure 6. As can be seen from the table, the Gumbel distribution method produces the minimum relative mean square errors for most cities.
To summarize, this demonstrates that the Gumbel distribution is the best fit for use in the intensity of rainstorms in Jiangsu Province. As a result, we used the Gumbel distribution method to calculate the rainstorm intensity formula parameters for various cities throughout Jiangsu Province, as shown in Table 1.
Based on the revised rainstorm intensity formula for various cities, the short-duration rainstorm intensity for different return periods of the whole province was obtained. Figure 7 depicts the intensity distribution of rainstorms every 100 years across the province.
The precipitation distributions for 60 min, 120 min, and 180 min rainstorms with a 100-year return period are depicted in Figure 7a–c, respectively. As illustrated in Figure 7a, the 60 min precipitation distribution shows a pattern of highs in the north and lows in the south. The rainstorm intensity is greater in northern Jiangsu, and the 60 min precipitation with a 100-year return period can exceed 110 mm, with a maximum value of 120 mm in Lianyungang. Except for Changzhou and Suzhou, southern Jiangsu only receives about 90 mm of precipitation. The 120 min and 180 min rainfall precipitation distributions are essentially identical to the 60 min rainstorm precipitation distributions, but with a larger magnitude increase. The 120 min precipitation in the south with a 100-year return period can reach more than 140 mm, while the 120 min rainstorm in Nanjing and Wuxi has relatively low levels of precipitation, with an accumulated precipitation of just 100-120 mm. Lianyungang receives the maximum amount of precipitation in 180 min, reaching over 200 mm. In conclusion, for Jiangsu, the design intensity of short-duration rainstorms shows an obvious distribution trend of strong rainfall in the north and weak rainfall in the south, and this distribution trend becomes more obvious as the duration of the rainstorm increases.

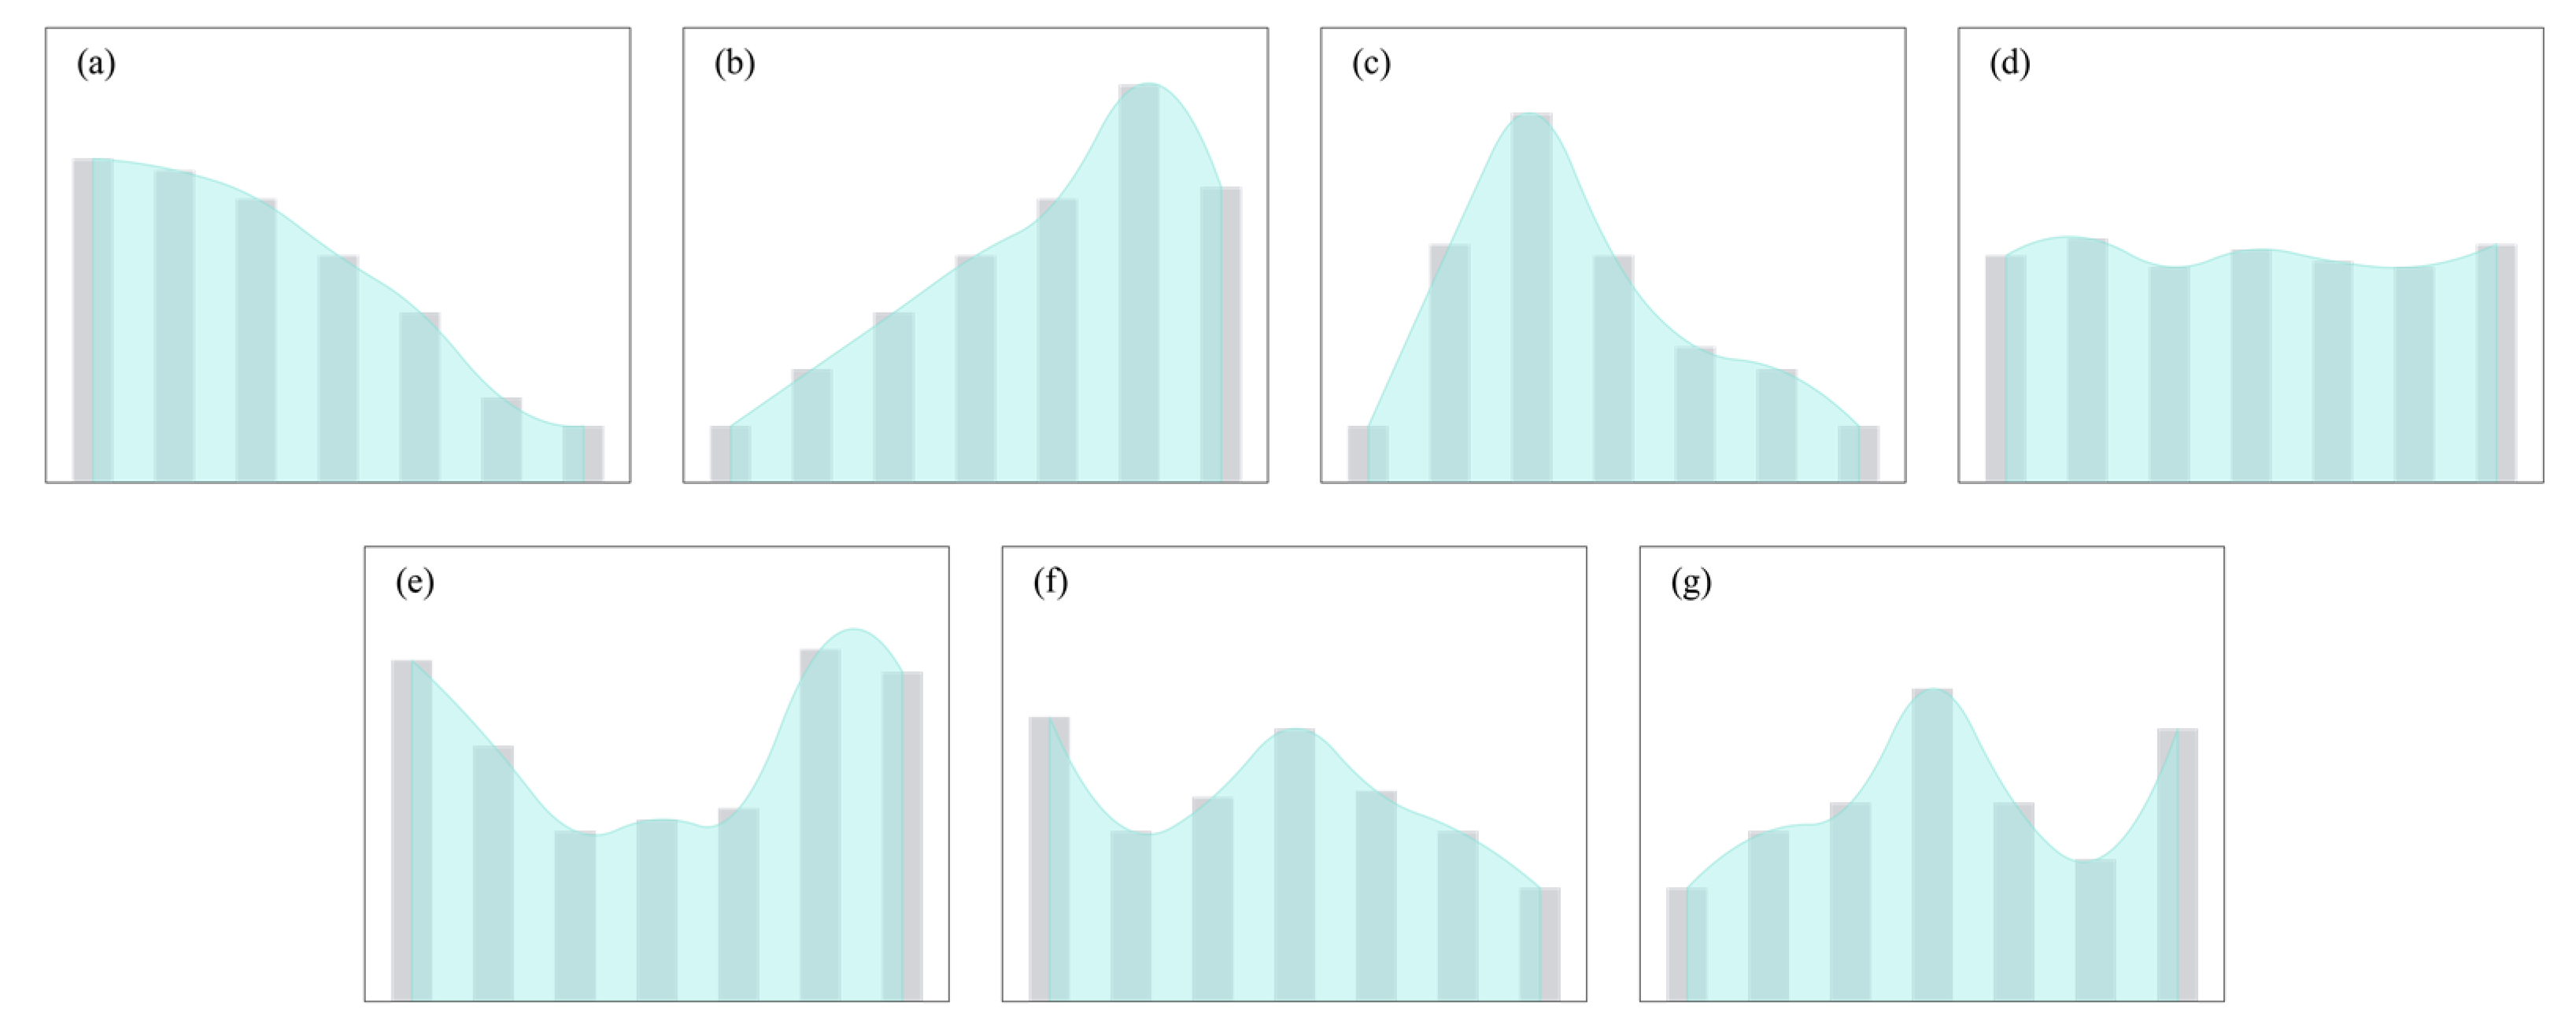
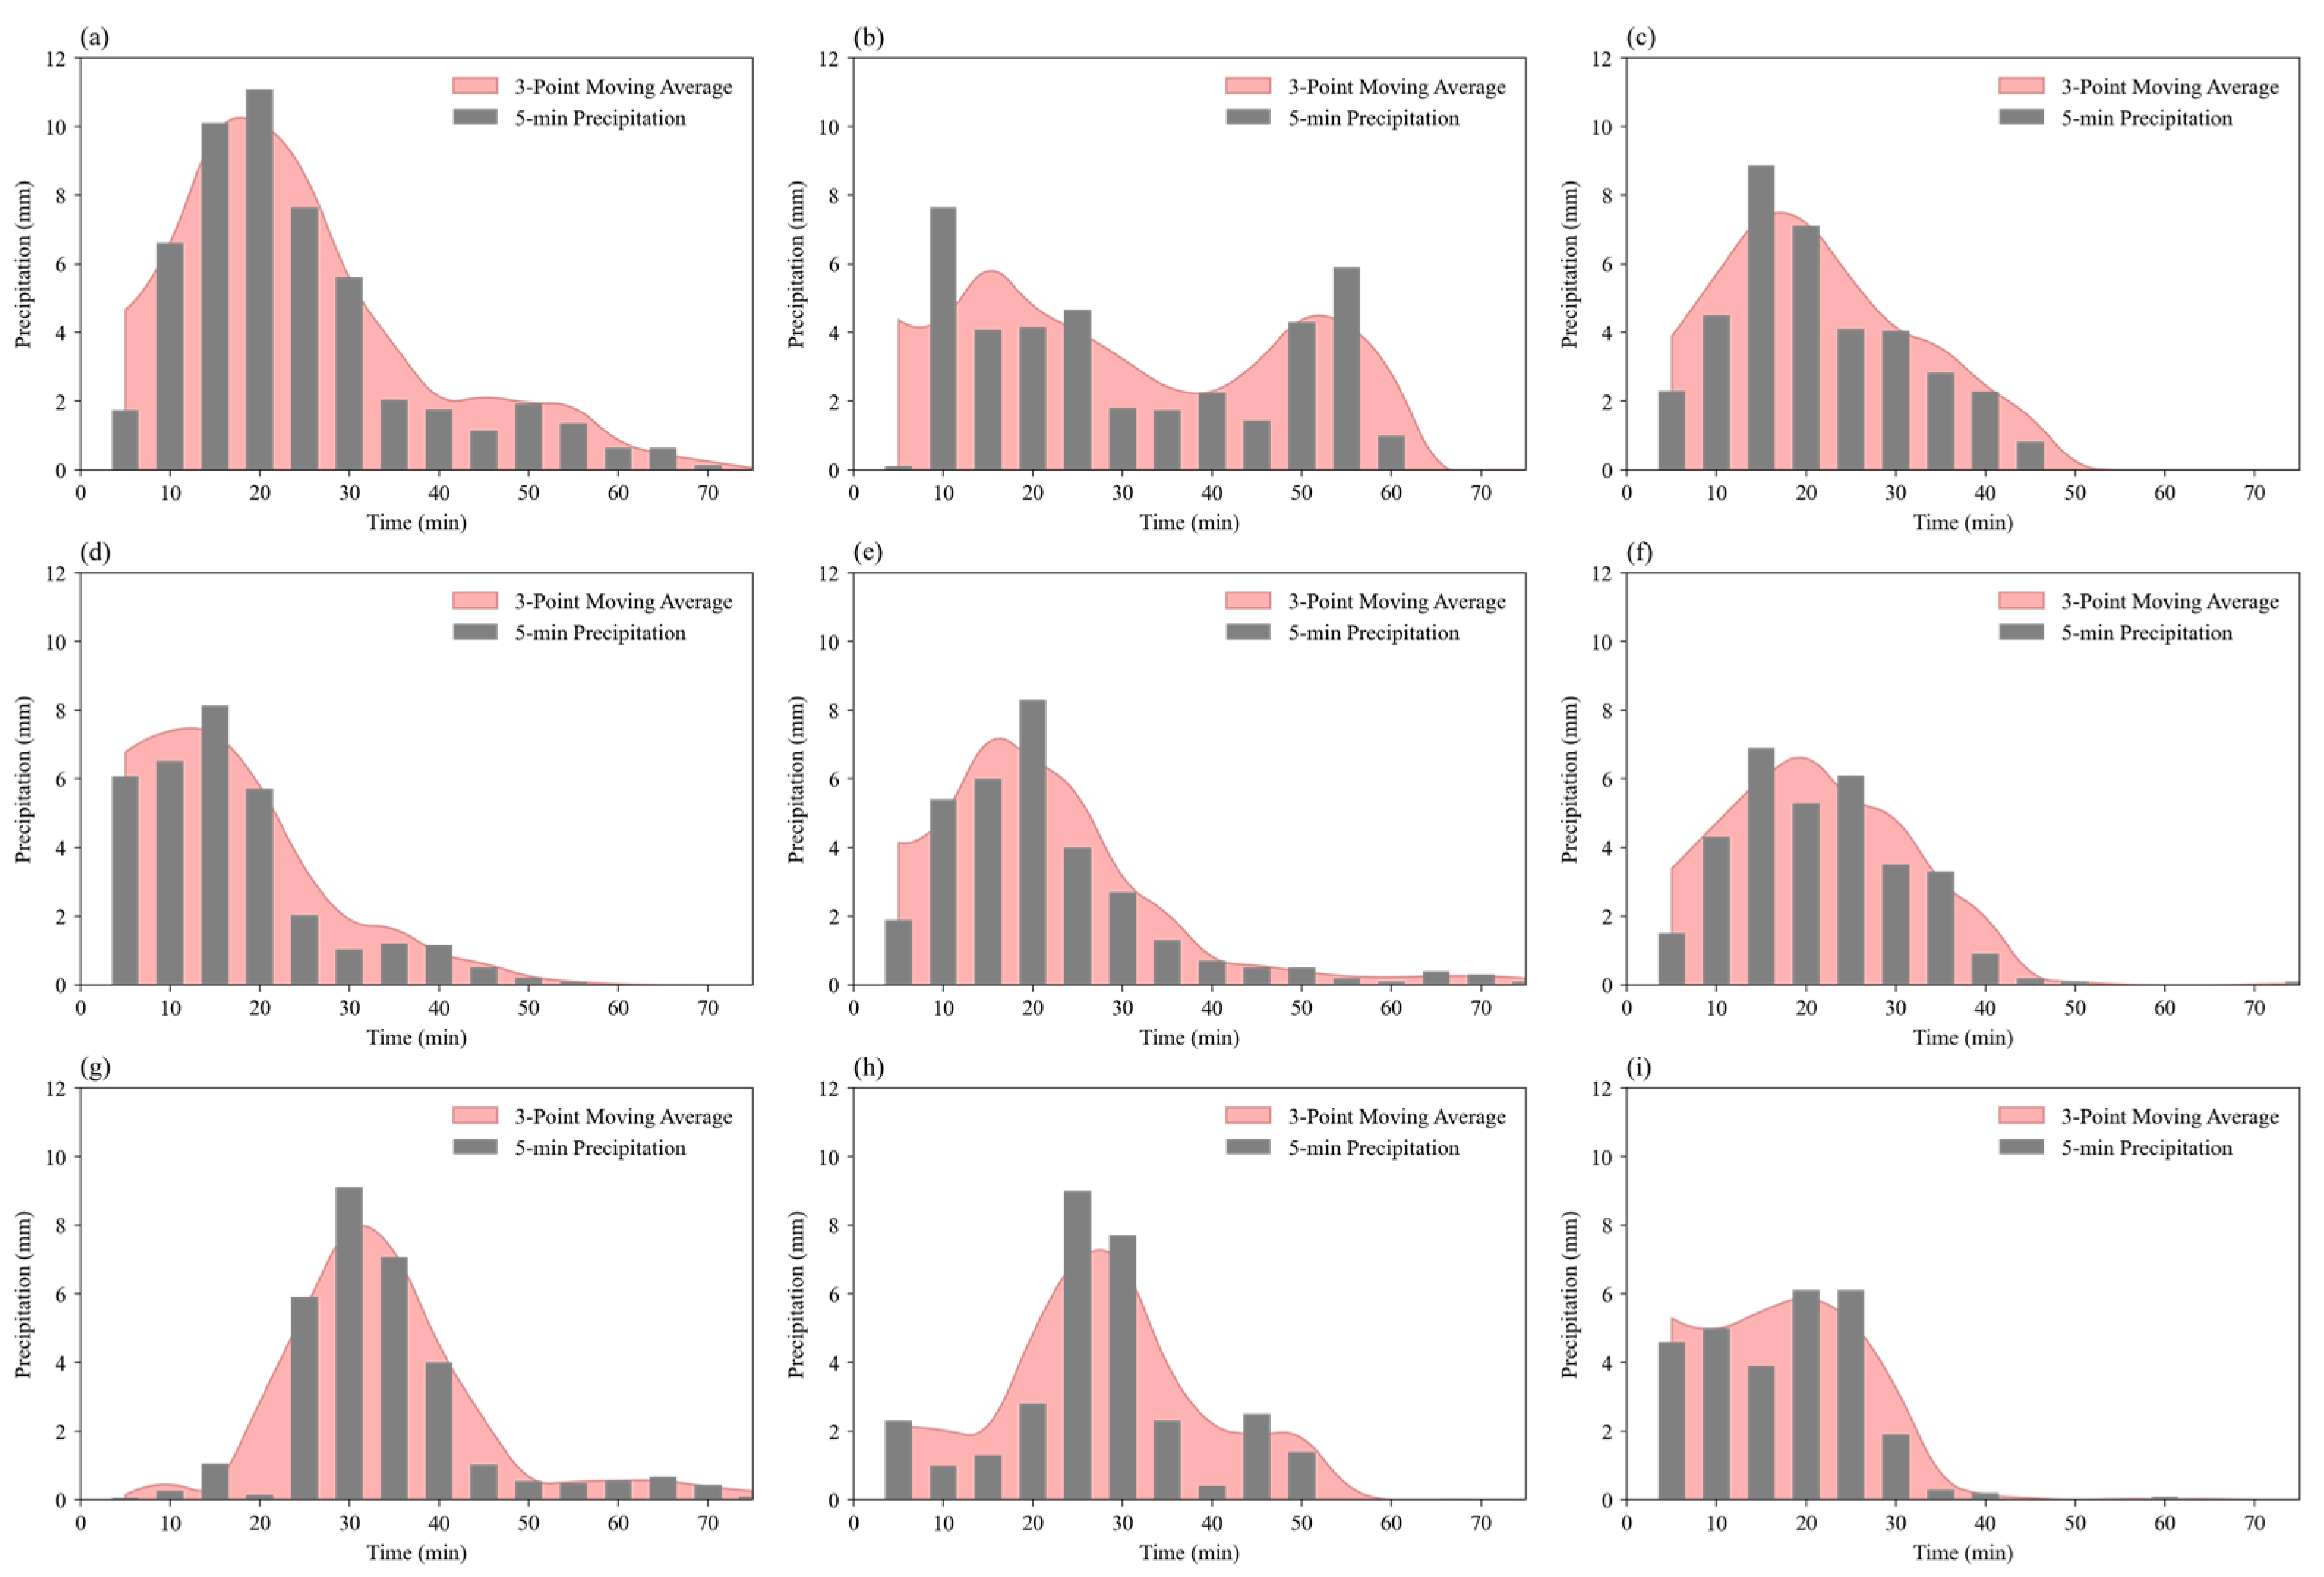
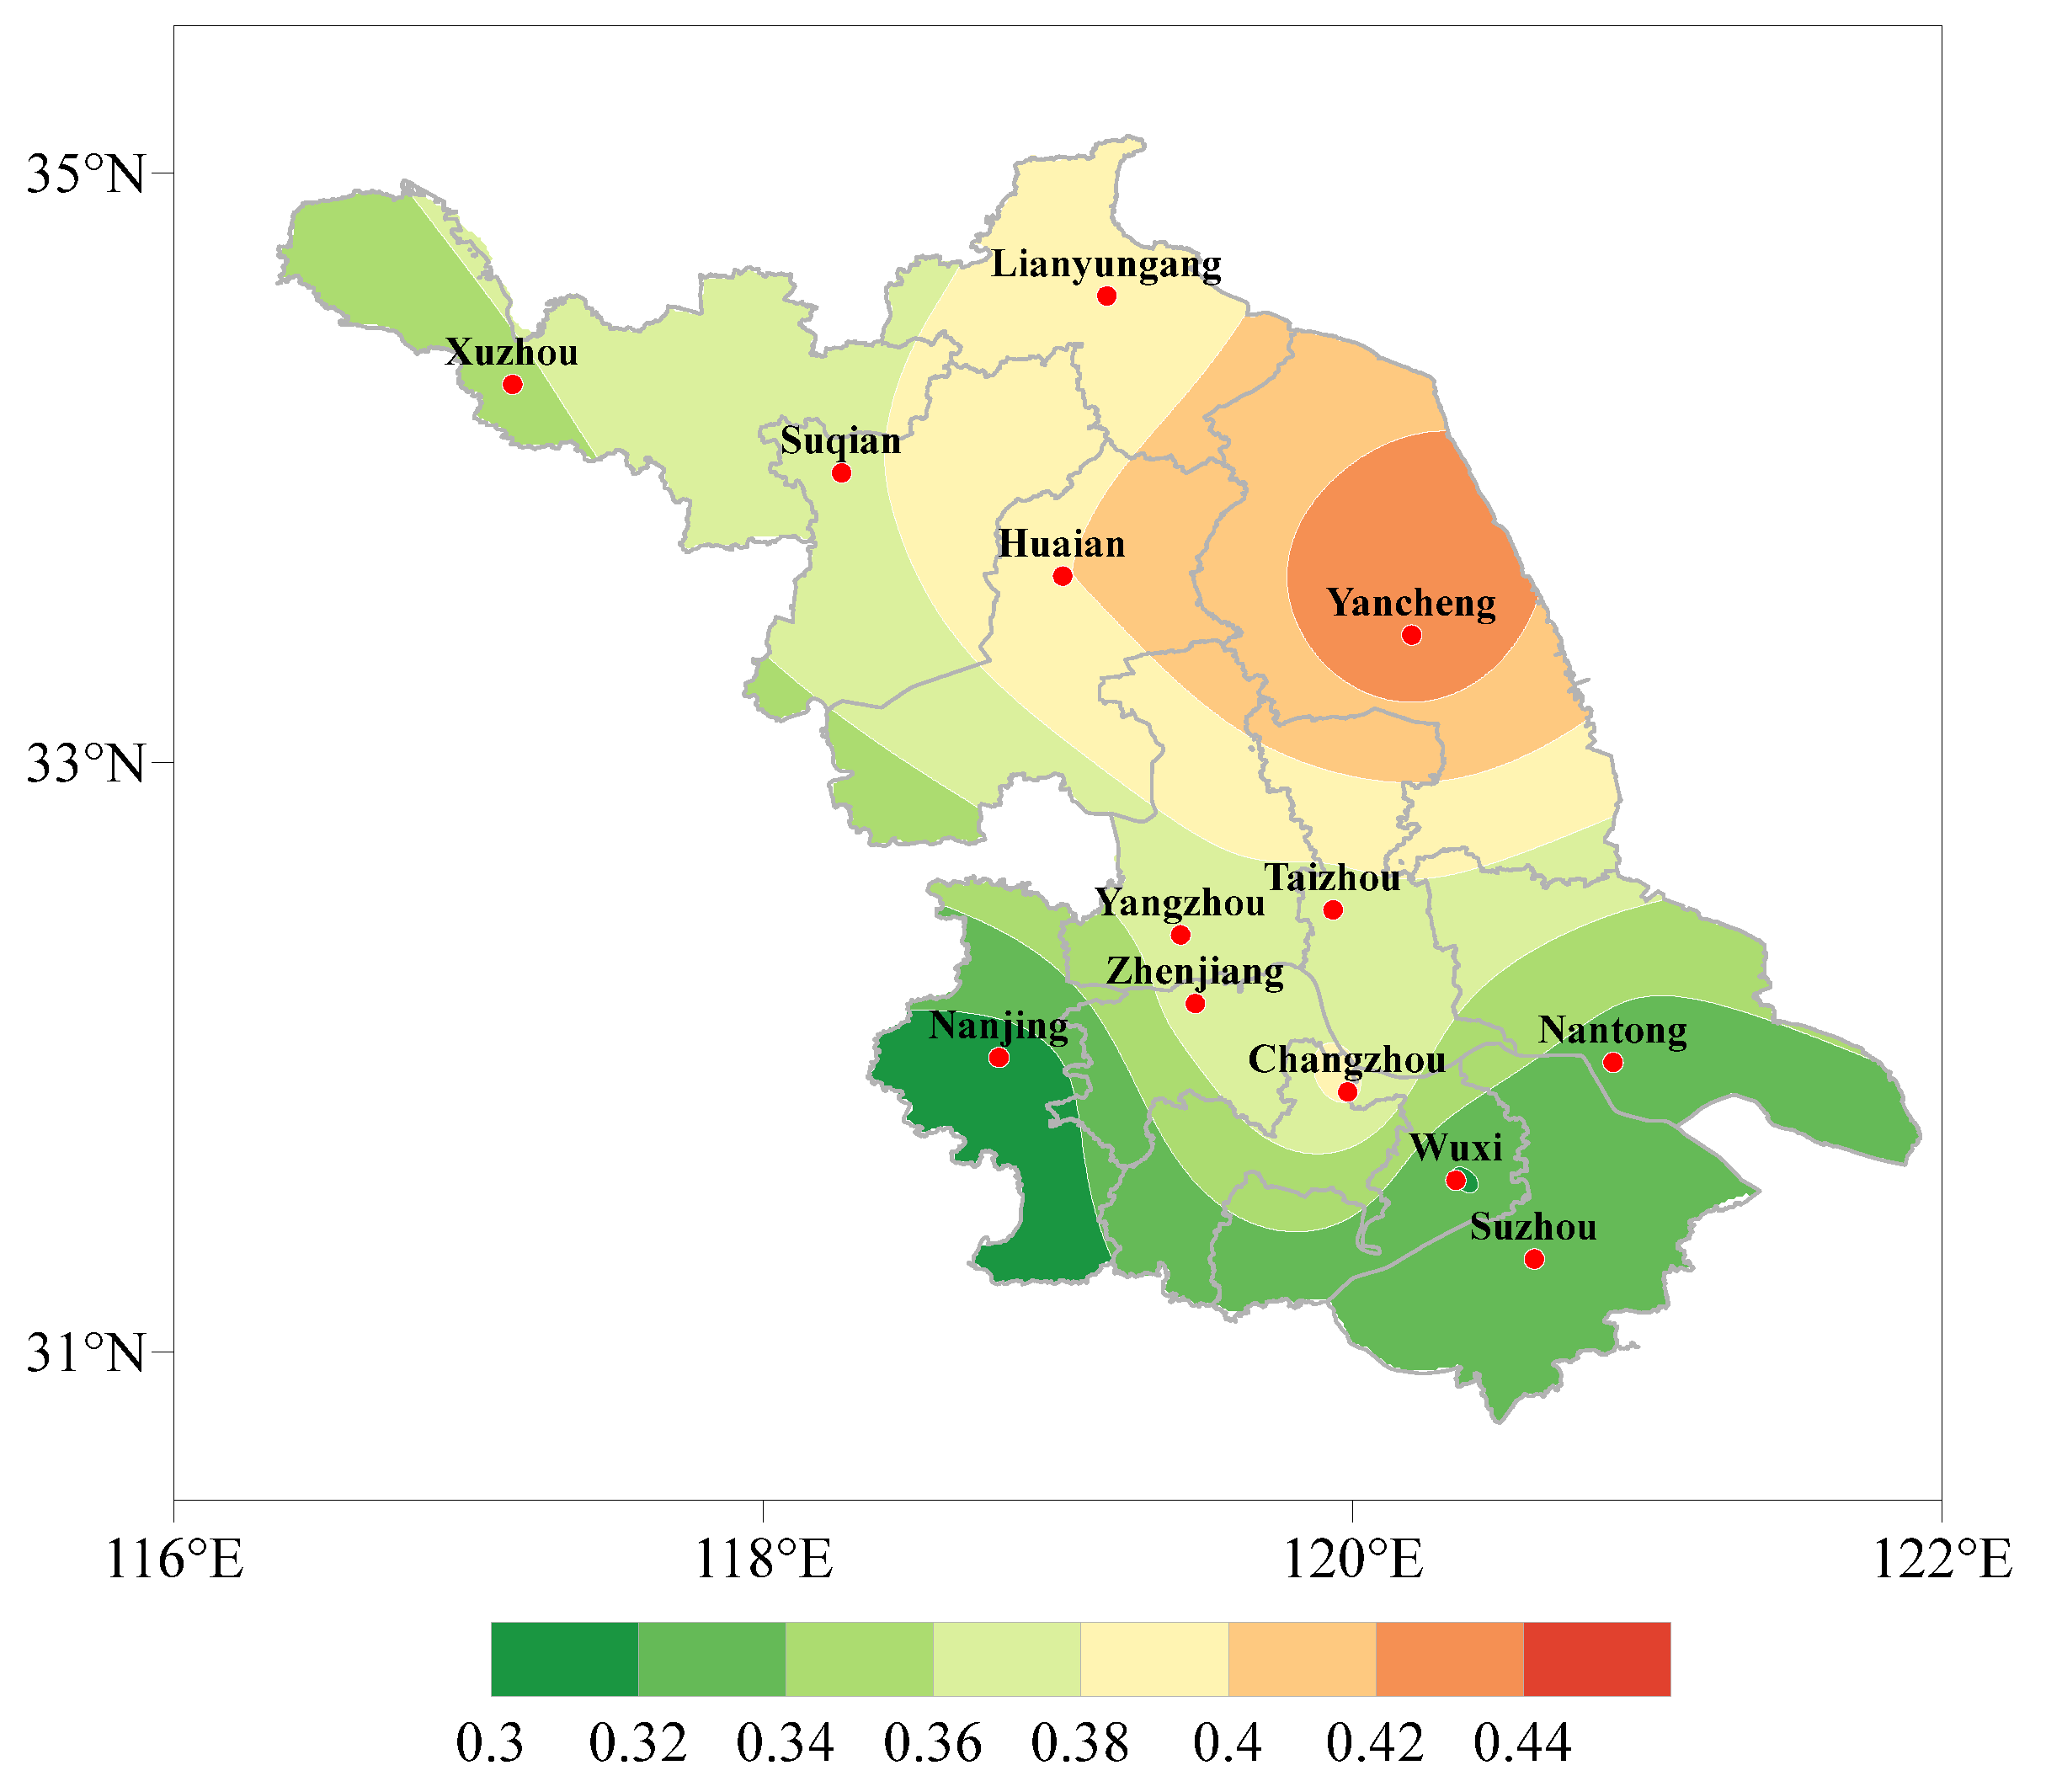
3.3. Rainfall Peak Coefficient of Short-Duration Rainstorm

According to the technical flow chart in Figure 2, a hyetograph can be designed using the rainstorm intensity formula and the peak coefficient of rainfall. We have already revised the parameters of the storm intensity formula; the next step is to calculate the rainfall peak coefficients for short-duration rainstorms. To calculate the comprehensive peak coefficient, we need to calculate the peak coefficient for each storm first and then weight the average according to the duration of each rainstorm. Taking Nanjing as an example, Figure 8 shows the frequency and duration of short-duration rainstorms over the last 60 years.
Each color bar in Figure 8 represents a short-duration rainstorm event, and the length of the color bar represents the short-duration rainstorm’s duration, with the green portion representing the pre-peak period and the pink portion representing the post-peak period. In Nanjing, the duration of short-duration rainstorms ranged from 35 to 180 min, with the majority lasting between 45 and 120 min. Additionally, a comparison of the pre-peak and post-peak periods revealed that the post-peak period is significantly longer than the pre-peak period for the majority of short-duration rainstorms, indicating that the majority of short-duration rainstorms reach their peak rainfall intensity shortly after the start of precipitation.
The confluence time for the drainage system in urbanized areas is usually no more than two hours. As a result, the research objects for rainstorm hyetographs are primarily 60 min and 120 min rainstorms. According to the duration of each rainfall event, we selected all of the rainfall samples with a rainfall duration of 60 ± 15 min and 120 ± 15 min, respectively. For example, when analyzing the 60 min rainstorm pattern, we considered a rainfall event that lasted 45 to 75 min to be a 60 min rainstorm.
We selected a total of 28 rainstorms that lasted about 60 min. As illustrated in Figure 9, the nine processes with the highest precipitation were extracted for analysis. It can be seen from the figure that only one of the nine 60 min rainstorms with the highest precipitation has a double-peaked pattern, while the remaining eight have a single-peaked pattern. The rain peak occurs approximately 1/3–1/4 of the way through the rainfall process. In terms of precipitation intensity, the maximum amount of precipitation that can fall in five minutes is 11 mm.
For the 120 min rainstorm, a total of 20 rainstorms from history was chosen. Similarly, as illustrated in Figure 10, we extracted the nine rainstorms with the highest precipitation for analysis. As illustrated in the figure, three of the nine 120 min rainstorms that produced the most precipitation are bimodal, while six are unimodal. The unimodal rain pattern continues to be the most prevalent. According to the location of the rain peaks, the entire rainstorm process begins in the first half, and the maximum rain intensity occurs within the first 30 min after the rainstorm begins. When all rainstorm processes are compared, the maximum rain intensity can reach 16 mm every 5 min. The comprehensive peak coefficient of 0.31 for Nanjing is obtained by taking the weighted average of these 69 rainstorm peak coefficients.
As seen in Figure 11, the rainfall peak coefficients for different cities could be determined by performing statistical analyses of rainstorm processes. As illustrated in the figure, Jiangsu province’s short-duration rainstorm peak coefficient exhibits a north–south distribution with a maximum in the north and a minimum in the south. The rainfall peak coefficients of most southern cities are relatively small, with values always below 0.36. In the majority of northern cities, the rainfall peak coefficients are relatively high, exceeding 0.38. Considering the cumulative rainfall and peak coefficient of a short-duration rainstorm, even though the total precipitation in southern cities is less than in northern cities, the rainstorm intensity increases rapidly and can reach a peak shortly after the rainstorm starts. While short-duration rainstorm intensity changes relatively slowly in northern cities, the peak time occurs later than that in southern cities. However, the total amount of rain that falls in the process is higher.

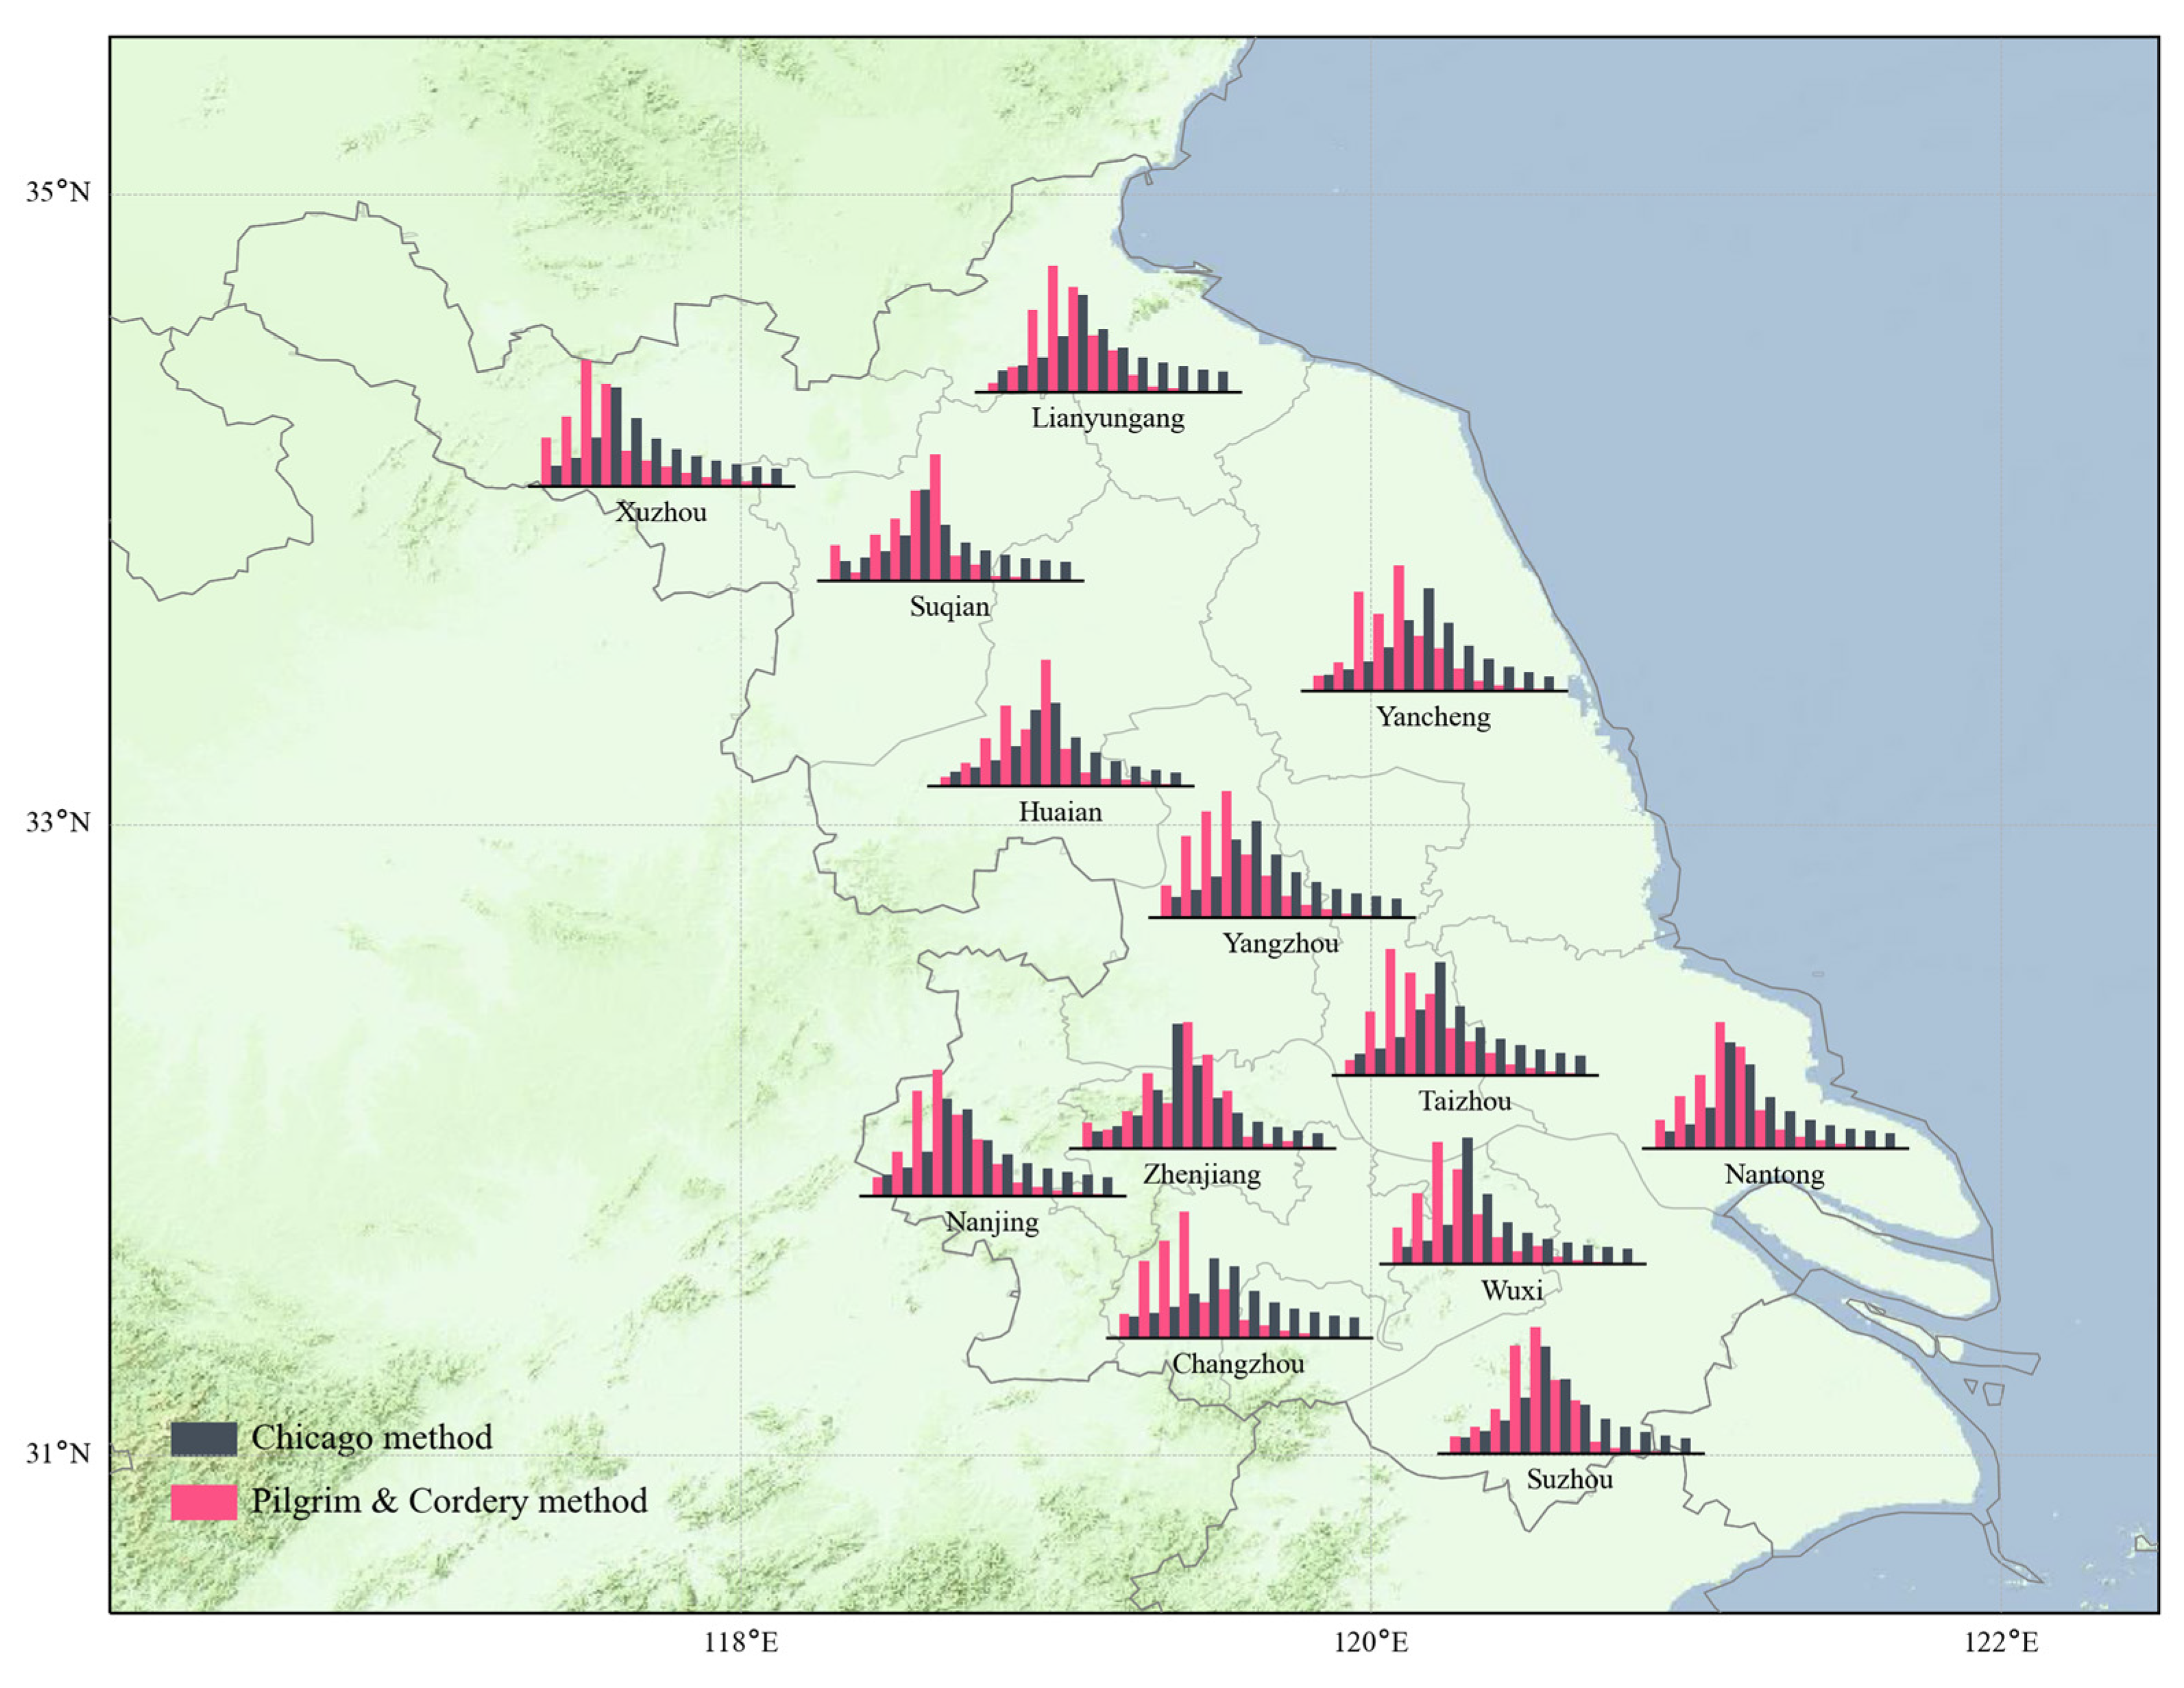
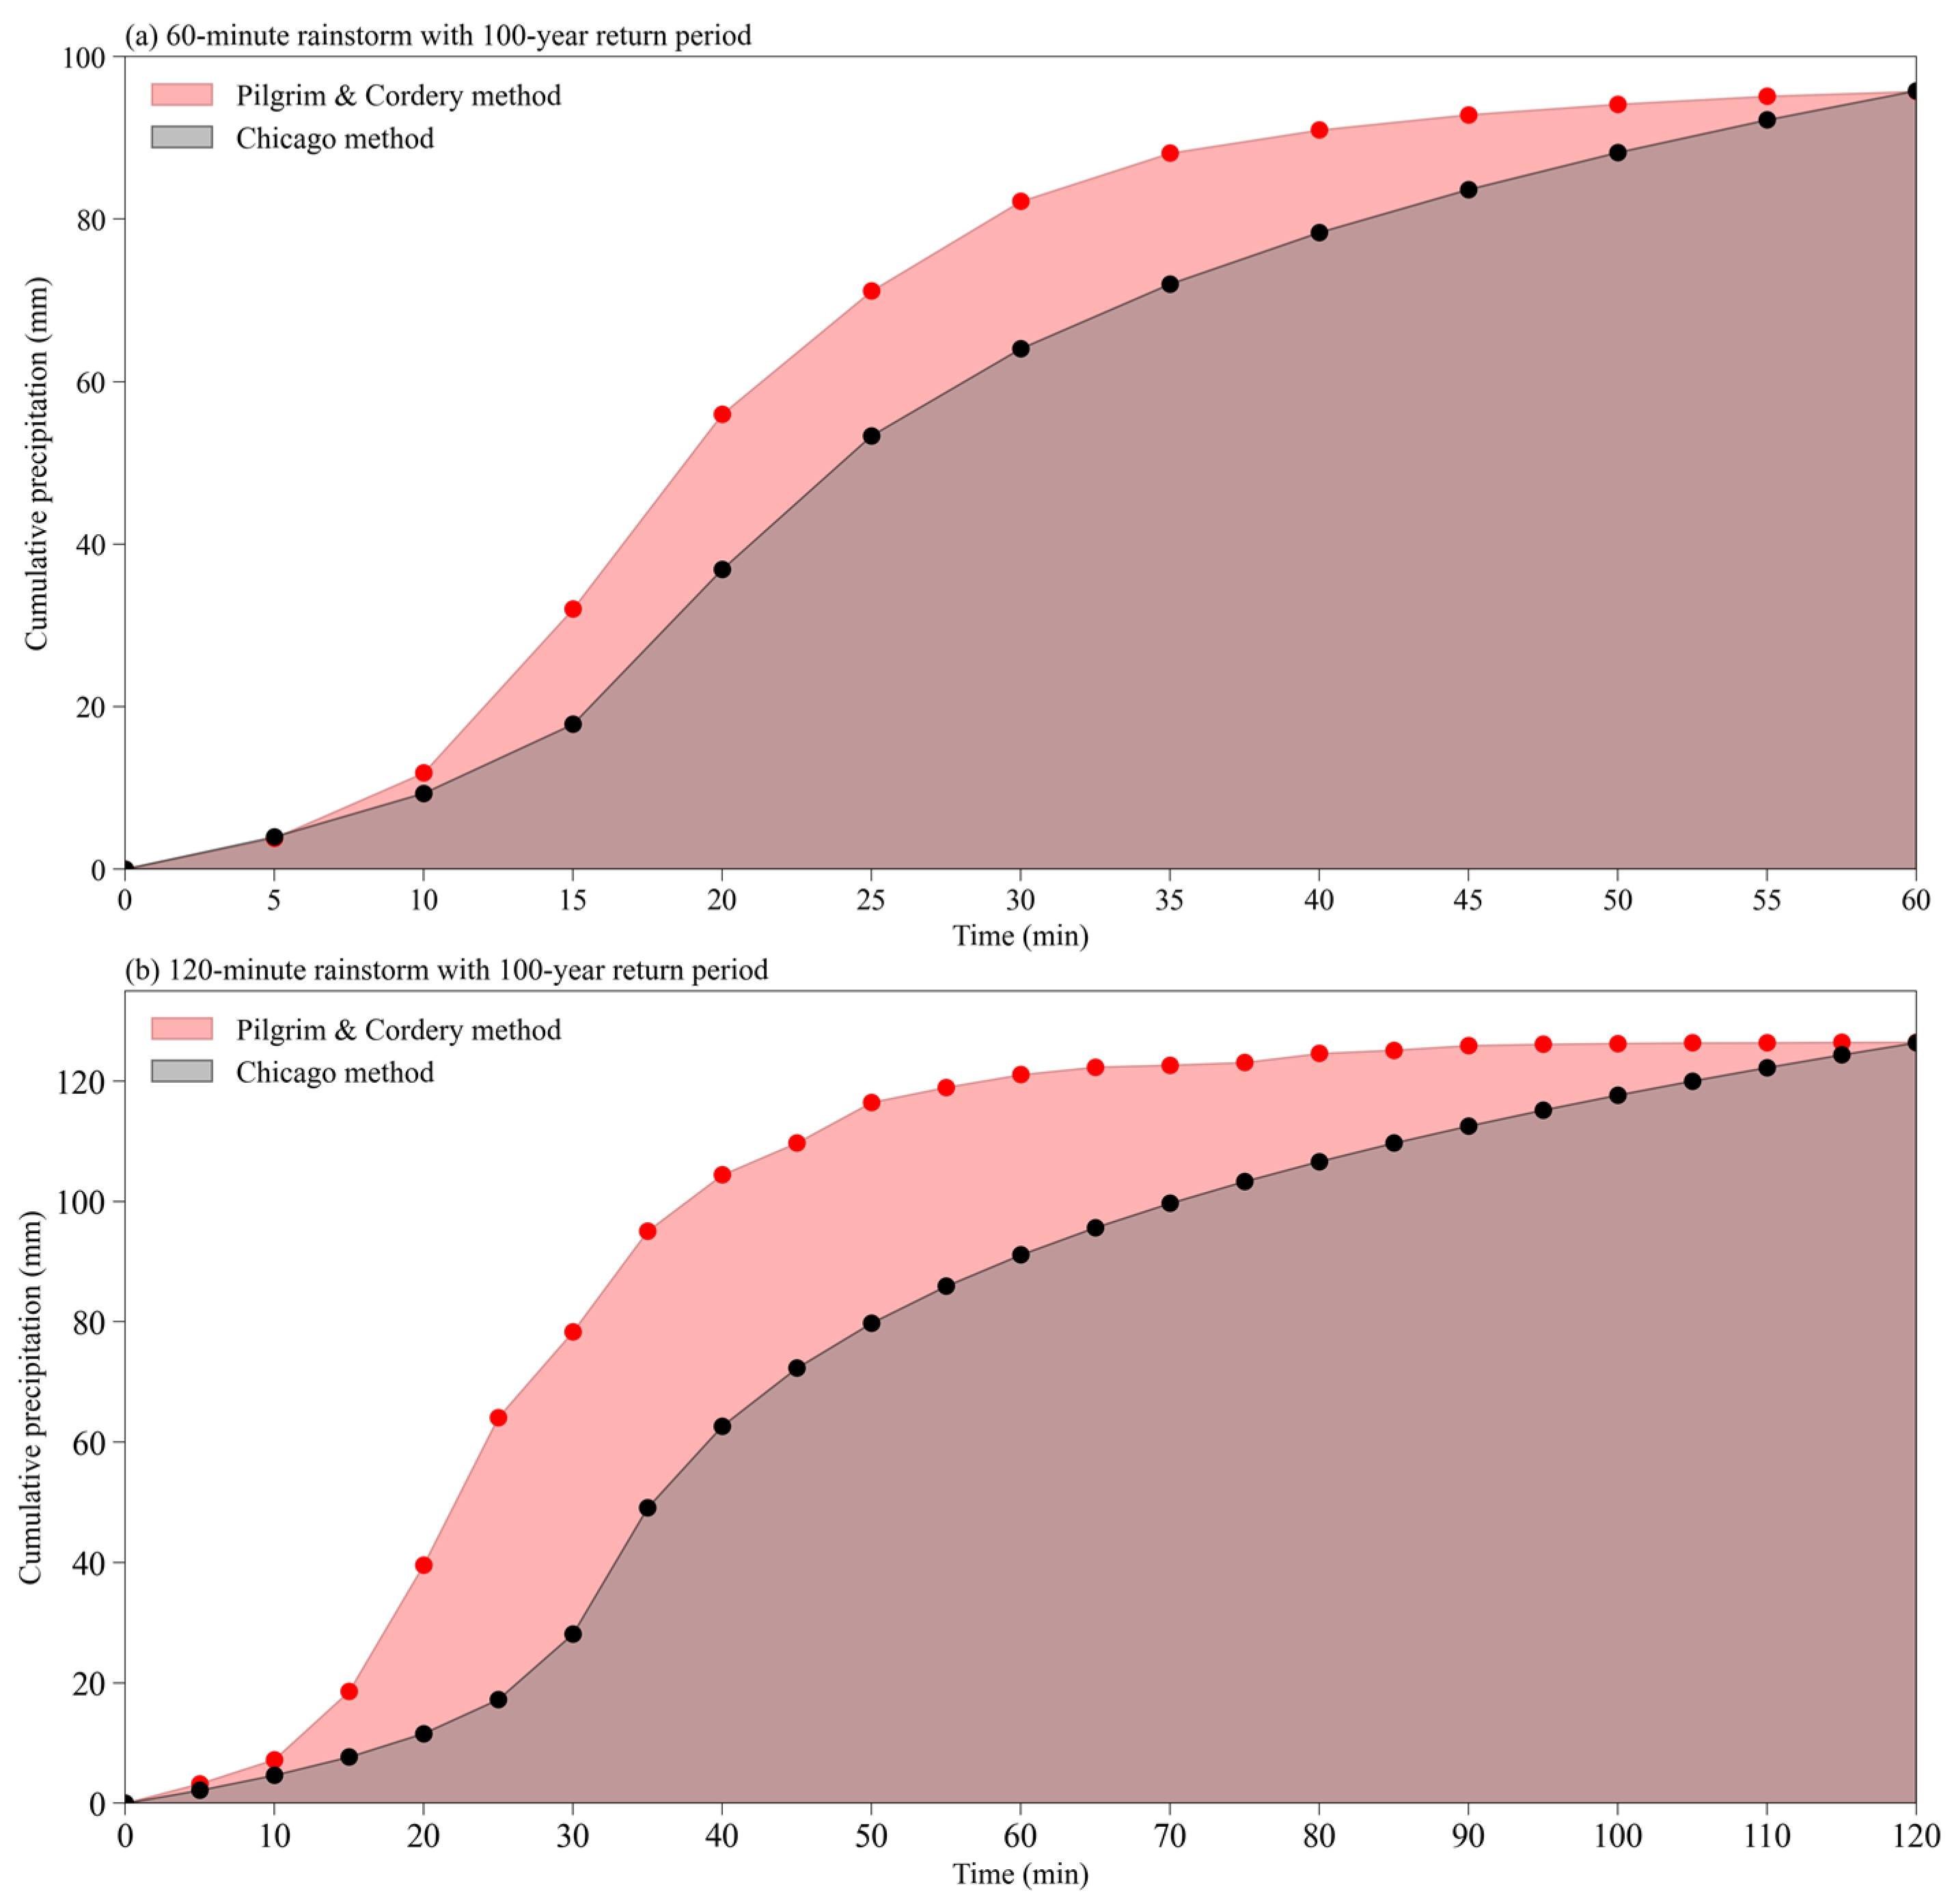
3.4. Designing Hyetographs of Short-Duration Rainstorms

The hyetographs designed for 60 min rainstorms and 120 min rainstorms using the Chicago and PC method, respectively, are shown in Figure 12. As illustrated in Figure 12a, the locations of the 60 min rainstorm peaks derived using the two methods are consistent, i.e., the rain intensity peaks around 20 min after the rainstorm begins. Precipitation during the rainfall peak period calculated using the PC method can account for close to 25% of the total precipitation, whereas precipitation during the rain peak period calculated using the Chicago method accounts for 20% of the total precipitation. Further comparison of the two methods used to design hyetographs reveals that rainfall shown in the PC pattern is primarily concentrated in the pre-peak period, and the rainfall intensity increases rapidly during the period. The rainfall intensity rapidly decreases after reaching the peak. The pre-peak precipitation accounts for the majority of the rainfall. It accounts for more than 50% of the total precipitation process, whereas in the Chicago hyetograph, a relatively small increase in rainstorm intensity is shown during the pre-peak period. Around 40% of the total precipitation occurs during the pre-peak period, and the rainstorm intensity declines relatively slowly during the post-peak period. There is a slight difference in the position of the rain peak between the two 120 min rainstorm hyetographs in Figure 12b. The PC hyetograph indicates that the rainstorm intensity reaches its maximum value approximately 25 min after the precipitation begins, whereas the Chicago hyetograph indicates that the rainfall intensity reaches its maximum value approximately 25 min after the precipitation begins. The rain intensity reaches its peak in approximately 35 min, and the difference in time between the two methods is ten minutes. By comparing the precipitation during the pre- and post-peak periods, it is clear that the 120 min rainstorm PC method produces precipitation that is primarily concentrated during the pre-peak period, whereas the Chicago method produces precipitation that is primarily concentrated during the post-peak period. In short, there are some distinctions between the PC and Chicago methods in the design of hyetographs. The PC hyetograph’s rainstorm intensity varies significantly, whereas the Chicago hyetograph displays a relatively small change in rainstorm intensity.
According to the revised rainfall intensity formula, the 60 min and 120 min rainstorm precipitation in Nanjing is calculated to be 95 mm and 126 mm with a 100-year return period. As seen in Figure 13, the cumulative rainfall pattern for these two rainstorms was designed using the PC method and the Chicago method. The cumulative precipitation at different time points throughout the 60 min rainstorm is depicted in Figure 13a. The difference in precipitation between the two methods is minimal in the first 10 min, but increases significantly between the 10th and 20th minute, with the cumulative precipitation in the PC hyetograph reaching 55 mm in the first 20 min, compared to 38 mm in the Chicago hyetograph. Then, as time passes, the cumulative precipitation increase for the two rain types begins to decrease, the PC hyetograph decreases greatly, and the difference between the two hyetographs gradually narrows until the entire precipitation process is complete. Finally, both forms of rainstorm receive the same amount of precipitation. The cumulative precipitation changes at various time points during the 120 min rainstorm are depicted in Figure 13b. As with the 60 min rain process, the difference between the two rainstorm hyetographs is minimal within the first 10 min. Between the 10th and 45th minute, the cumulative precipitation given using the PC method is significantly greater than that given using the Chicago method. The cumulative precipitation in the PC hyetograph can exceed 100 mm within 40 min, while the cumulative precipitation in the Chicago hyetograph can reach just 60 mm. However, after the 40th minute, the PC hyetograph’s increase in cumulative precipitation decreases significantly, while the Chicago hyetograph’s increase in cumulative precipitation remains relatively large, and the gap between the two accumulated precipitations grows smaller and smaller until the process ends. In general, the cumulative precipitation associated with the PC hyetograph increases rapidly in the pre-peak period and rapidly declines in the post-peak period, whereas the cumulative precipitation associated with the Chicago hyetograph increases slowly during the pre-peak period and declines rapidly during the post-peak period.
Figure 14 illustrates a comparison of 60 min rainstorm hyetographs obtained using the PC method and the Chicago method for 13 cities in Jiangsu. As can be seen from the figure, for the majority of cities, the rainfall peak period of rainstorms obtained by the PC method is approximately five minutes earlier than the rainfall peak period of the Chicago method. There is a significant difference between the intensity of rainfall during the pre-peak period of the PC method and that of the Chicago method. The PC method’s pre-peak rainfall intensity is much greater than that of the Chicago method. The precipitation designed by the PC method is mainly concentrated during the pre-peak period, and the difference between the pre-peak and post-peak rainfall is considerable, while the difference between the pre-peak and post-peak rainfall from the Chicago rainfall pattern is not considerable. In terms of maximum rainfall intensity, the maximum rainfall intensity of the PC method is greater than the maximum rainfall intensity of the Chicago method, in all cities except for Wuxi.
Additionally, when comparing the two designed rain patterns to the actual precipitation process depicted in Figure 9 and Figure 10, the rain pattern obtained using the PC method is more accurate. However, the PC method is highly dependent on local precipitation data. Without or with insufficient surrounding data, the PC method cannot be used to design rain patterns, whereas the Chicago method only requires the rain peak coefficient to deduce rain patterns. As a result, the PC method can be used to design rain types in 13 cities in Jiangsu, while the Chicago method can be used to design rain types in the city’s surrounding areas.

4. Conclusions

This study established reliable statistical samples of short-duration rainstorms for 13 cities in Jiangsu Province over a 60-year period through data preprocessing. On this basis, we conducted a statistical analysis of rainstorm intensity characteristics. Upon analyzing the changes in rainstorm intensity and their trend over the last 60 years, it was discovered that most cities exhibit an increase in rainstorm intensity over time, with the increase being more pronounced in the north and south and relatively weak in the central part.
We contrasted the fitting accuracy of the Gumbel distribution, the exponential distribution, and the Pearson III distribution for the rainstorm intensity formula. By comparison, the relative mean squared deviation of the Gumbel distribution fitting the rainstorm intensity formula was found to be the smallest for most cities. The Gumbel distribution was used to revise the storm intensity formula parameters for each city. Based on this, the distribution of short-duration rainstorm intensity with a 100-year return period was given. The result shows that short-duration rainstorm intensity is greater in northern Jiangsu, and the 60 min precipitation with a 100-year return period can exceed 110 mm, with a maximum value of 120 mm in Lianyungang.
Statistics on the duration of short-duration rainstorms found that most of the short-duration rainstorms lasted between 45 and 120 min and were dominated by single-peak rainfall patterns. The rainfall peak coefficient was found to be in a range of 0.30 to 0.44 and had a north–south distribution with a maximum in the north and a minimum in the south. Then, short-duration rainstorm hyetographs for 13 cities were designed using the Chicago hyetograph method and the PC method. For the majority of cities, the rainfall peak period of rainstorms obtained by the PC method is approximately five minutes earlier than the rainfall peak period obtained by the Chicago method. The PC hyetograph has a stronger pre-peak rainfall intensity than the Chicago hyetograph, but a lower post-peak rainfall intensity. In all cities except Wuxi, the PC hyetograph’s maximum rainfall intensity is greater than the Chicago hyetograph’s. The PC hyetograph’s cumulative precipitation was shown to increase rapidly in the pre-peak period and rapidly drop in the post-peak period, whereas the Chicago hyetograph’s cumulative precipitation was shown to increase slowly in the pre-peak period and rapidly decline in the post-peak period.
By comparing the precipitation values obtained using these methods with real precipitation values, we found that the PC hyetograph provided values closer to the values shown in the real precipitation process. This method, however, is highly dependent on local precipitation data. The PC method cannot be used to design rain patterns in areas that do not have meteorological stations or lack data. To design the Chicago rain pattern, only the rain peak coefficient is required. The rain peak coefficient can be compared to the rainfall peak coefficient distribution shown in Figure 11. The distribution of rainstorm intensity can be estimated in Figure 7. Based on this, the design of short-duration rainstorms can be conducted not only in the 13 major cities, but also in areas where no precipitation data are available in Jiangsu. The PC method rain pattern is primarily recommended for Jiangsu Province’s 13 major cities, while the Chicago rain pattern is recommended for the 13 cities’ surrounding areas.

Author Contributions

Conceptualization, Y.X.; methodology, J.Y.; supervision, X.X.; data curation, J.S.; writing—original draft preparation, review and editing, J.Y. and Y.X. All authors have read and agreed to the published version of the manuscript.

Funding

This research was funded by the National Natural Science Foundation of China, grant numbers 42130610 and 41975098, and the Key Fund of Jiangsu Meteorological Bureau, grant numbers KZ202102.

Data Availability Statement

The data presented in this study are available on request from the corresponding author. The data are not publicly available due to the secrecy restrictions of the China Meteorological Administration on minute precipitation data.

Conflicts of Interest

The authors declare no conflict of interest.

References

  1. Guo, X.M.; Ren, G.Y.; Guo, Y.X.; Zhao, C.P. Influential Factors of City Water Logging and Meteorological Service. J. Catastrophology 2003, 23, 46–49. [Google Scholar]
  2. Li, W.T.; Sui, J.; Liu, C.L.; Niu, Y.; Zhou, J.H.; Tan, J.X. Analysis of Influence of Design Rainfall Peak Cofficient on Design Flow of Drainage Pipeline Network. Water Purif. Technol. 2015, 34, 100–103. [Google Scholar]
  3. Ma, J.J.; Song, L.L.; Zhang, X.J. The comparison of two different sampling schemes on design storm pattern by the Pilgrim & Cordery. Torrential Rain Disasters 2016, 35, 220–226. [Google Scholar]
  4. Ding, Y.H.; Ren, G.Y.; Shi, G.Y.; Gong, P. National Assessment Report of Climate Change (I): Climate change in China and its future trend. Adv. Clim. Chang. Res. 2006, 2, 3–8. [Google Scholar]
  5. Arnbjerg-Nielsen, K.; Willems, P.; Olsson, J.; Beecham, S.; Pathirana, A.; Bülow Gregersen, I.; Madsen, H.; Nguyen, V.T.V. Impacts of climate change on rainfall extremes and urban drainage systems: A review. Water Sci. Technol. 2013, 68, 16–28. [Google Scholar] [CrossRef]
  6. Zhai, P.M.; Li, L. Observed Atmosphere and Surface Climate Changes in the IPCC Fifth Assessment Report. Adv. Clim. Chang. Res. 2014, 10, 20–24. [Google Scholar]
  7. Qiu, Z.F.; Zhou, Q.; Zhang, Z.; Hao, Y.Q. Study on the derivation method of storm intensity formula. Urban Roads Bridges Flood Control 2004, 1, 47–49. [Google Scholar]
  8. Ren, M.; Hao, Y.; Chen, Y. Statistic and Analysis of Rainstorm Areas. J. Meteorol. Sci. 2007, 2, 214–219. [Google Scholar]
  9. Zhi, S.Q.; Song, L.L.; Luo, J.L.; Wu, K.J. Calculating System of Heavy Rain Intensity and Its Application. Meteorol. Mon. 2000, 26, 30–32. [Google Scholar]
  10. Xu, L.J.; Li, J.Q.; Li, T.; Liu, X.H. Research of the short duration storm intensity formula of Shanghai. China Munic. Eng. 2007, 4, 46–48. [Google Scholar]
  11. Wang, Z.H.; Hu, L.W.; Zhu, L.Y. Research and Application of the Derivation of Urban Storm Intensity Formula. Sci. Technol. Eng. 2012, 12, 4987–4991. [Google Scholar]
  12. Jin, J.M. Urban rainstorm intensity formula formulation and application methods. China Munic. Eng. 2010, 1, 38–41. [Google Scholar]
  13. Shao, Y.M.; He, M.J. Discussion on Some Problems about Urban Rainstorm Intensity Formula in Current Code. China Water Wastewater 2008, 24, 99–102. [Google Scholar]
  14. Gu, J.Q.; Chen, H.Y.; Xu, J.Y. Research on parameter estimate of probability distribution formula of storm intensity in Rui’an. J. Appl. Meteorol. Sci. 2000, 11, 355–363. [Google Scholar]
  15. Gu, J.Q.; Xu, J.Y.; Chen, H.Y.; Huang, J.P. Parameter estimation in torrential rain intensity formula with its application. J. Nanjing Inst. Meteorol. 2000, 23, 63–67. [Google Scholar]
  16. Chen, Z.; Wang, H.; Zhang, X. An Optimized Method for Estimating Parameters of the Rainstorm Intensity Formula. J. Appl. Meteorol. Sci. 2007, 18, 237–241. [Google Scholar]
  17. Cen, G.P.; Shen, J.; Fan, R.S. Research on Rainfall Pattern of Urban Design Storm. Adv. Water Sci. 1998, 9, 41–46. [Google Scholar]
  18. Mo, L.K. Stormwater Channels and Combined Waterways; Architectural Engineering Press: Beijing, China, 1956; pp. 17–19. [Google Scholar]
  19. Keifer, C.J.; Chu, H.H. Synthetic storm pattern for drainage design. J. Hydraul. Div. 1957, 83, 1–25. [Google Scholar] [CrossRef]
  20. Kibler, D.F. Urban Storm Water Hydrology; American Geophysical Union: Washington, DC, USA, 1982; Volume 7, pp. 48–60. [Google Scholar]
  21. Huff, F.A. Time distribution of rainfall in heavy storms. Water Resour. Res. 1967, 3, 1007–1019. [Google Scholar] [CrossRef]
  22. Pilgrim, D.H.; Cordery, I. Rainfall temporal patterns for design floods. J. Hydraul. Div. 1975, 101, 81–95. [Google Scholar] [CrossRef]
  23. Arnell, V.; Harremoës, P.; Jensen, M.; Johansen, N.B.; Niemczynowicz, J.   Review of rainfall data application for design and analysis. Water Sci. Technol. 1984, 16, 1–45. [Google Scholar] [CrossRef]
  24. Deng, P.D. Establishment and Application of Mathematical Model for Storm Sampling And Frequency Distribution. Water Wastewater Eng. 1996, 22, 2–9. [Google Scholar]
  25. Wang, M.; Tan, X.C. A Study on Storm and Rainfall Pattern in Beijing City. J. China Hydrol. 1994, 3, 1–6. [Google Scholar]
  26. Cen, G.P. A Comparison of Design Storm Patterns for Calculating the Volume of Detention Ponding. Water Resour. Water Eng. 1993, 2, 30–35. [Google Scholar]
  27. Su, X.L.; Dong, X.; Lei, L.; Liang, C.R.; Liu, Z.R.; Li, Y.; Lan, Q.; Ren, L. Study on Design Rainstorm Profile in Liuzhou City Based on Pilgrim & Cordery Method. J. Geosci. Environ. Prot. 2019, 7, 136–144. [Google Scholar]
  28. Zhang, C.; Zhi, X.H.; Shi, H.; Zhu, G.H.; Chen, Y.; Chen, Y.; Chen, Y.L.; Xiao, J.; Shao, R.M.; Zhou, Y.W. Outdoors Drainage Criterion (GB50014-2006, 2011); China Planning Press: Beijing, China, 2011. [Google Scholar]
  29. Wu, X.J.; Fei, J.F.; Cheng, X.P.; Huang, X.G.; Lang, F.W. Diagnostic analysis on precipitation intensity of the rainstorm with “double peak”. J. Meteorol. Sci. 2014, 34, 252–260. [Google Scholar]
  30. Zhuang, Z.F.; Wang, K.Q.; Yang, J.; Chen, B.; Zhu, H.T. Research on new generation rainstorm intensity formula and design of rainfall hyetograph in Zhenjiang. J. Meteorol. Sci. 2015, 35, 506–513. [Google Scholar]
  31. Zhang, L.; Li, J.; Pei, H.Y.; He, G.X. Rainfall Pattern Analysis of Short Duration Rainstorm in Nanjing. Adv. Meteorol. Sci. Technol. 2019, 3, 15–20. [Google Scholar]
  32. Xie, D.; Su, X.L.; Liu, L.; Liang, C.R.; Liu, Z.R.; Li, Y.; Lan, Q.; Ren, L. Study on rainstorm type design of Liuzhou based on Chicago Method. J. Meteorol. Res. Appl. 2018, 39, 72–75. [Google Scholar]
  33. Yan, Z.X.; Xia, J.; Song, J.X.; Zhao, L.L.; Pang, G.W. Research progress on design hyetographs in small and medium-scale basins. Prog. Geogr. 2020, 39, 1224–1235. [Google Scholar] [CrossRef]
  34. Zhang, X.J. The Features of Summer Precipitation and the Influence of Design storm in Beijing Area; Nanjing University of Information Science & Technology: Nanjing, China, 2015. [Google Scholar]
Figure 1. The seven types of rainfall patterns are (a) the first kind pattern, (b) the second kind pattern, (c) the third kind pattern, (d) the fourth kind pattern, (e) the fifth kind pattern, (f) the sixth kind pattern, and (g) the seventh kind pattern defined by Molokov [34].
Atmosphere 13 00899 g001
Figure 2. Flow chart of Chicago hyetograph method.
Atmosphere 13 00899 g002
Figure 3. Maximum precipitation distributions of (a) 60 min, (b) 120 min, and (c) 180 min rainstorms from 1961 to 2020 in Jiangsu Province.
Atmosphere 13 00899 g003
Figure 4. The linear trend of 60 min, 120 min, and 180 min maximum precipitation in Nanjing.
Atmosphere 13 00899 g004
Figure 5. The linear trend distribution of maximum precipitation in (a) 60 min, (b) 120 min, and (c) 180 min.
Atmosphere 13 00899 g005
Figure 6. Relative mean square error of three fitting methods for rainstorm intensity.
Atmosphere 13 00899 g006
Figure 7. Precipitation distributions in Jiangsu Province for (a) 60 min, (b) 120 min, and (c) 180 min rainstorms in 100-year return period.
Atmosphere 13 00899 g007
Figure 8. Frequency and duration of short-duration rainstorms over the last 60 years in Nanjing.
Atmosphere 13 00899 g008
Figure 9. Storm patterns of the 9 maximum rainfall events lasting about 60 min in Nanjing (ai).
Atmosphere 13 00899 g009
Figure 10. Storm patterns of the 9 maximum rainfall events lasting about 120 min in Nanjing (ai).
Atmosphere 13 00899 g010
Figure 11. Peak coefficient distribution of short-duration rainstorm in Jiangsu Province.
Atmosphere 13 00899 g011
Figure 12. The storm patterns of rainstorms designed using PC method and Chicago method; (a) 60 min rainstorm and (b) 120 min rainstorm.
Atmosphere 13 00899 g012
Figure 13. The storm patterns of rainstorms designed using PC method and Chicago method.
Atmosphere 13 00899 g013
Figure 14. The patterns of 60 min rainstorms in 13 cities designed using PC method and Chicago method.
Atmosphere 13 00899 g014
Table 1. Revised parameters of rainstorm intensity formula in 13 cities.
CityA1Cbn
Xuzhou12.370.88913.2410.683
Lianyungang5.931.68710.2050.594
Suqian5.281.0575.6810.529
Huai’an14.782.28318.6620.836
Yancheng57.091.27632.7621.033
Nanjing10.310.85412.9890.691
Yangzhou15.870.84718.9790.767
Taizhou11.380.78412.8050.686
Zhenjiang18.690.91314.2570.815
Nantong14.130.811110.735
Changzhou8.360.87511.6550.586
Suzhou20.571.65219.3840.856
Wuxi8.870.6754.6490.648
Publisher’s Note: MDPI stays neutral with regard to jurisdictional claims in published maps and institutional affiliations.

