


Unearthing Inequities in the Relationship between Multiple Sociodemographic Factors and Diverse Elements of Park Availability and Quality in a Major Southern Metropolitan Region
 ,
, 
Abstract
1. Introduction
2. Methods
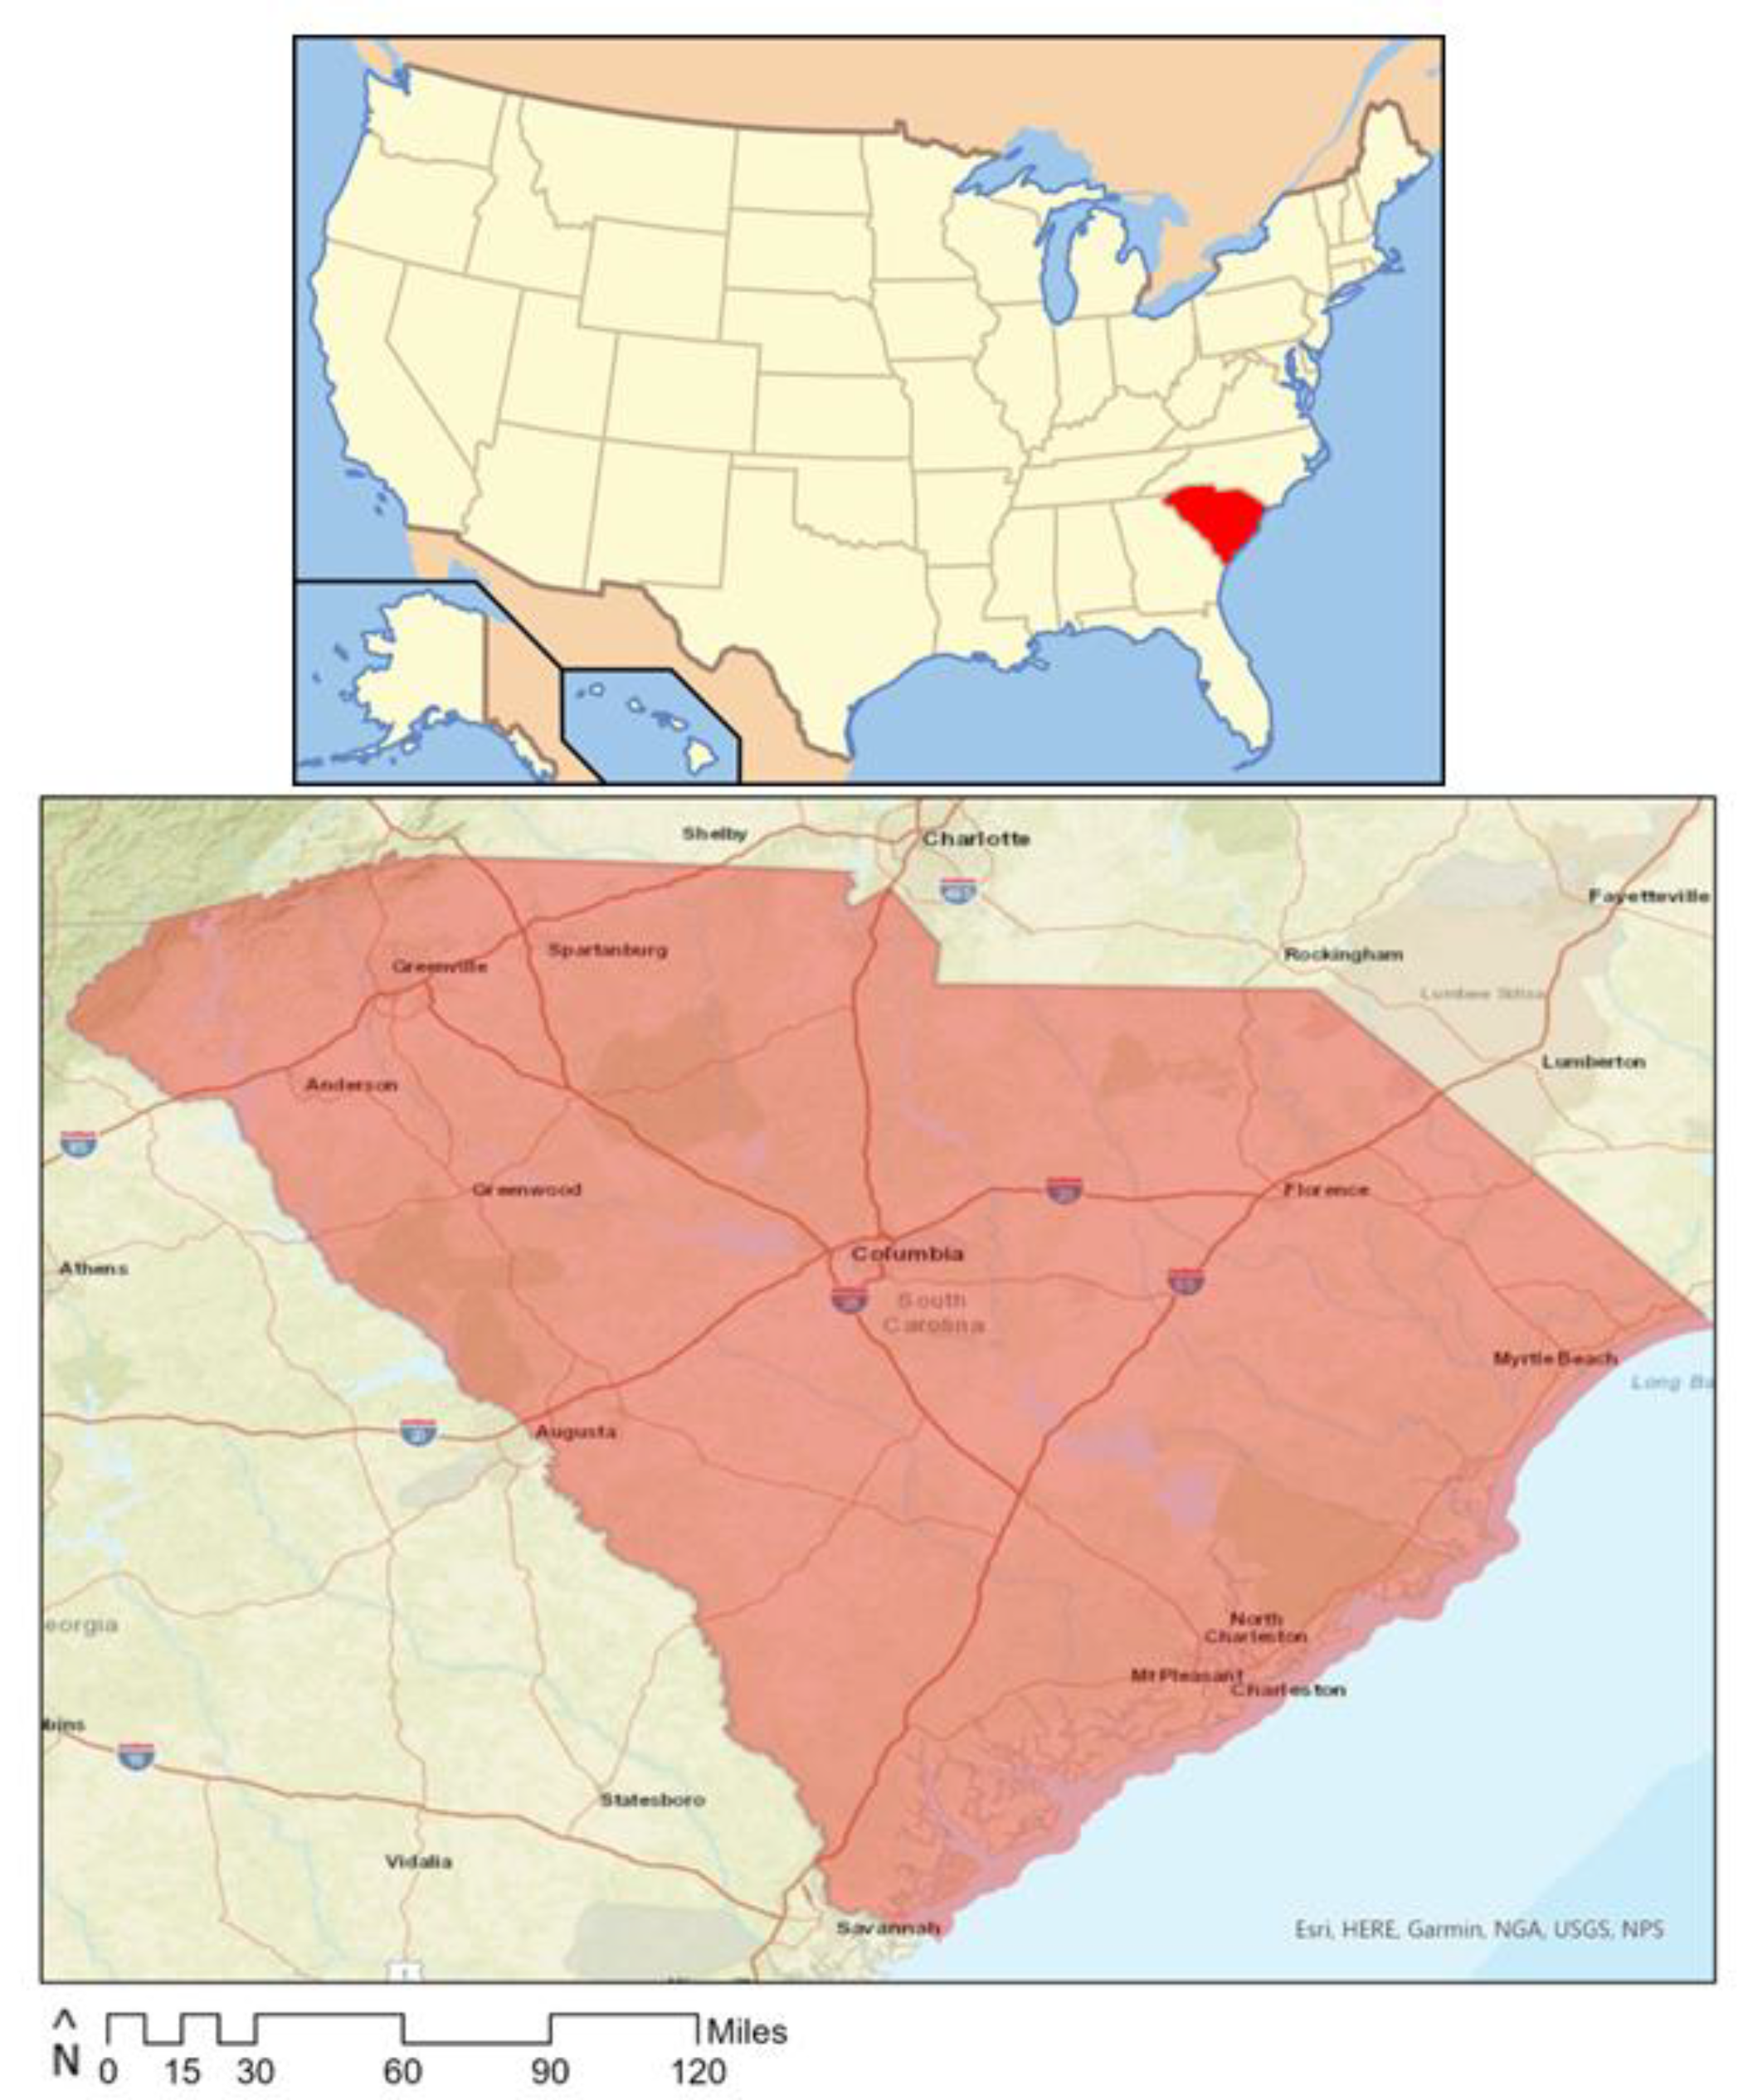
2.1. Study Setting
2.2. Measures
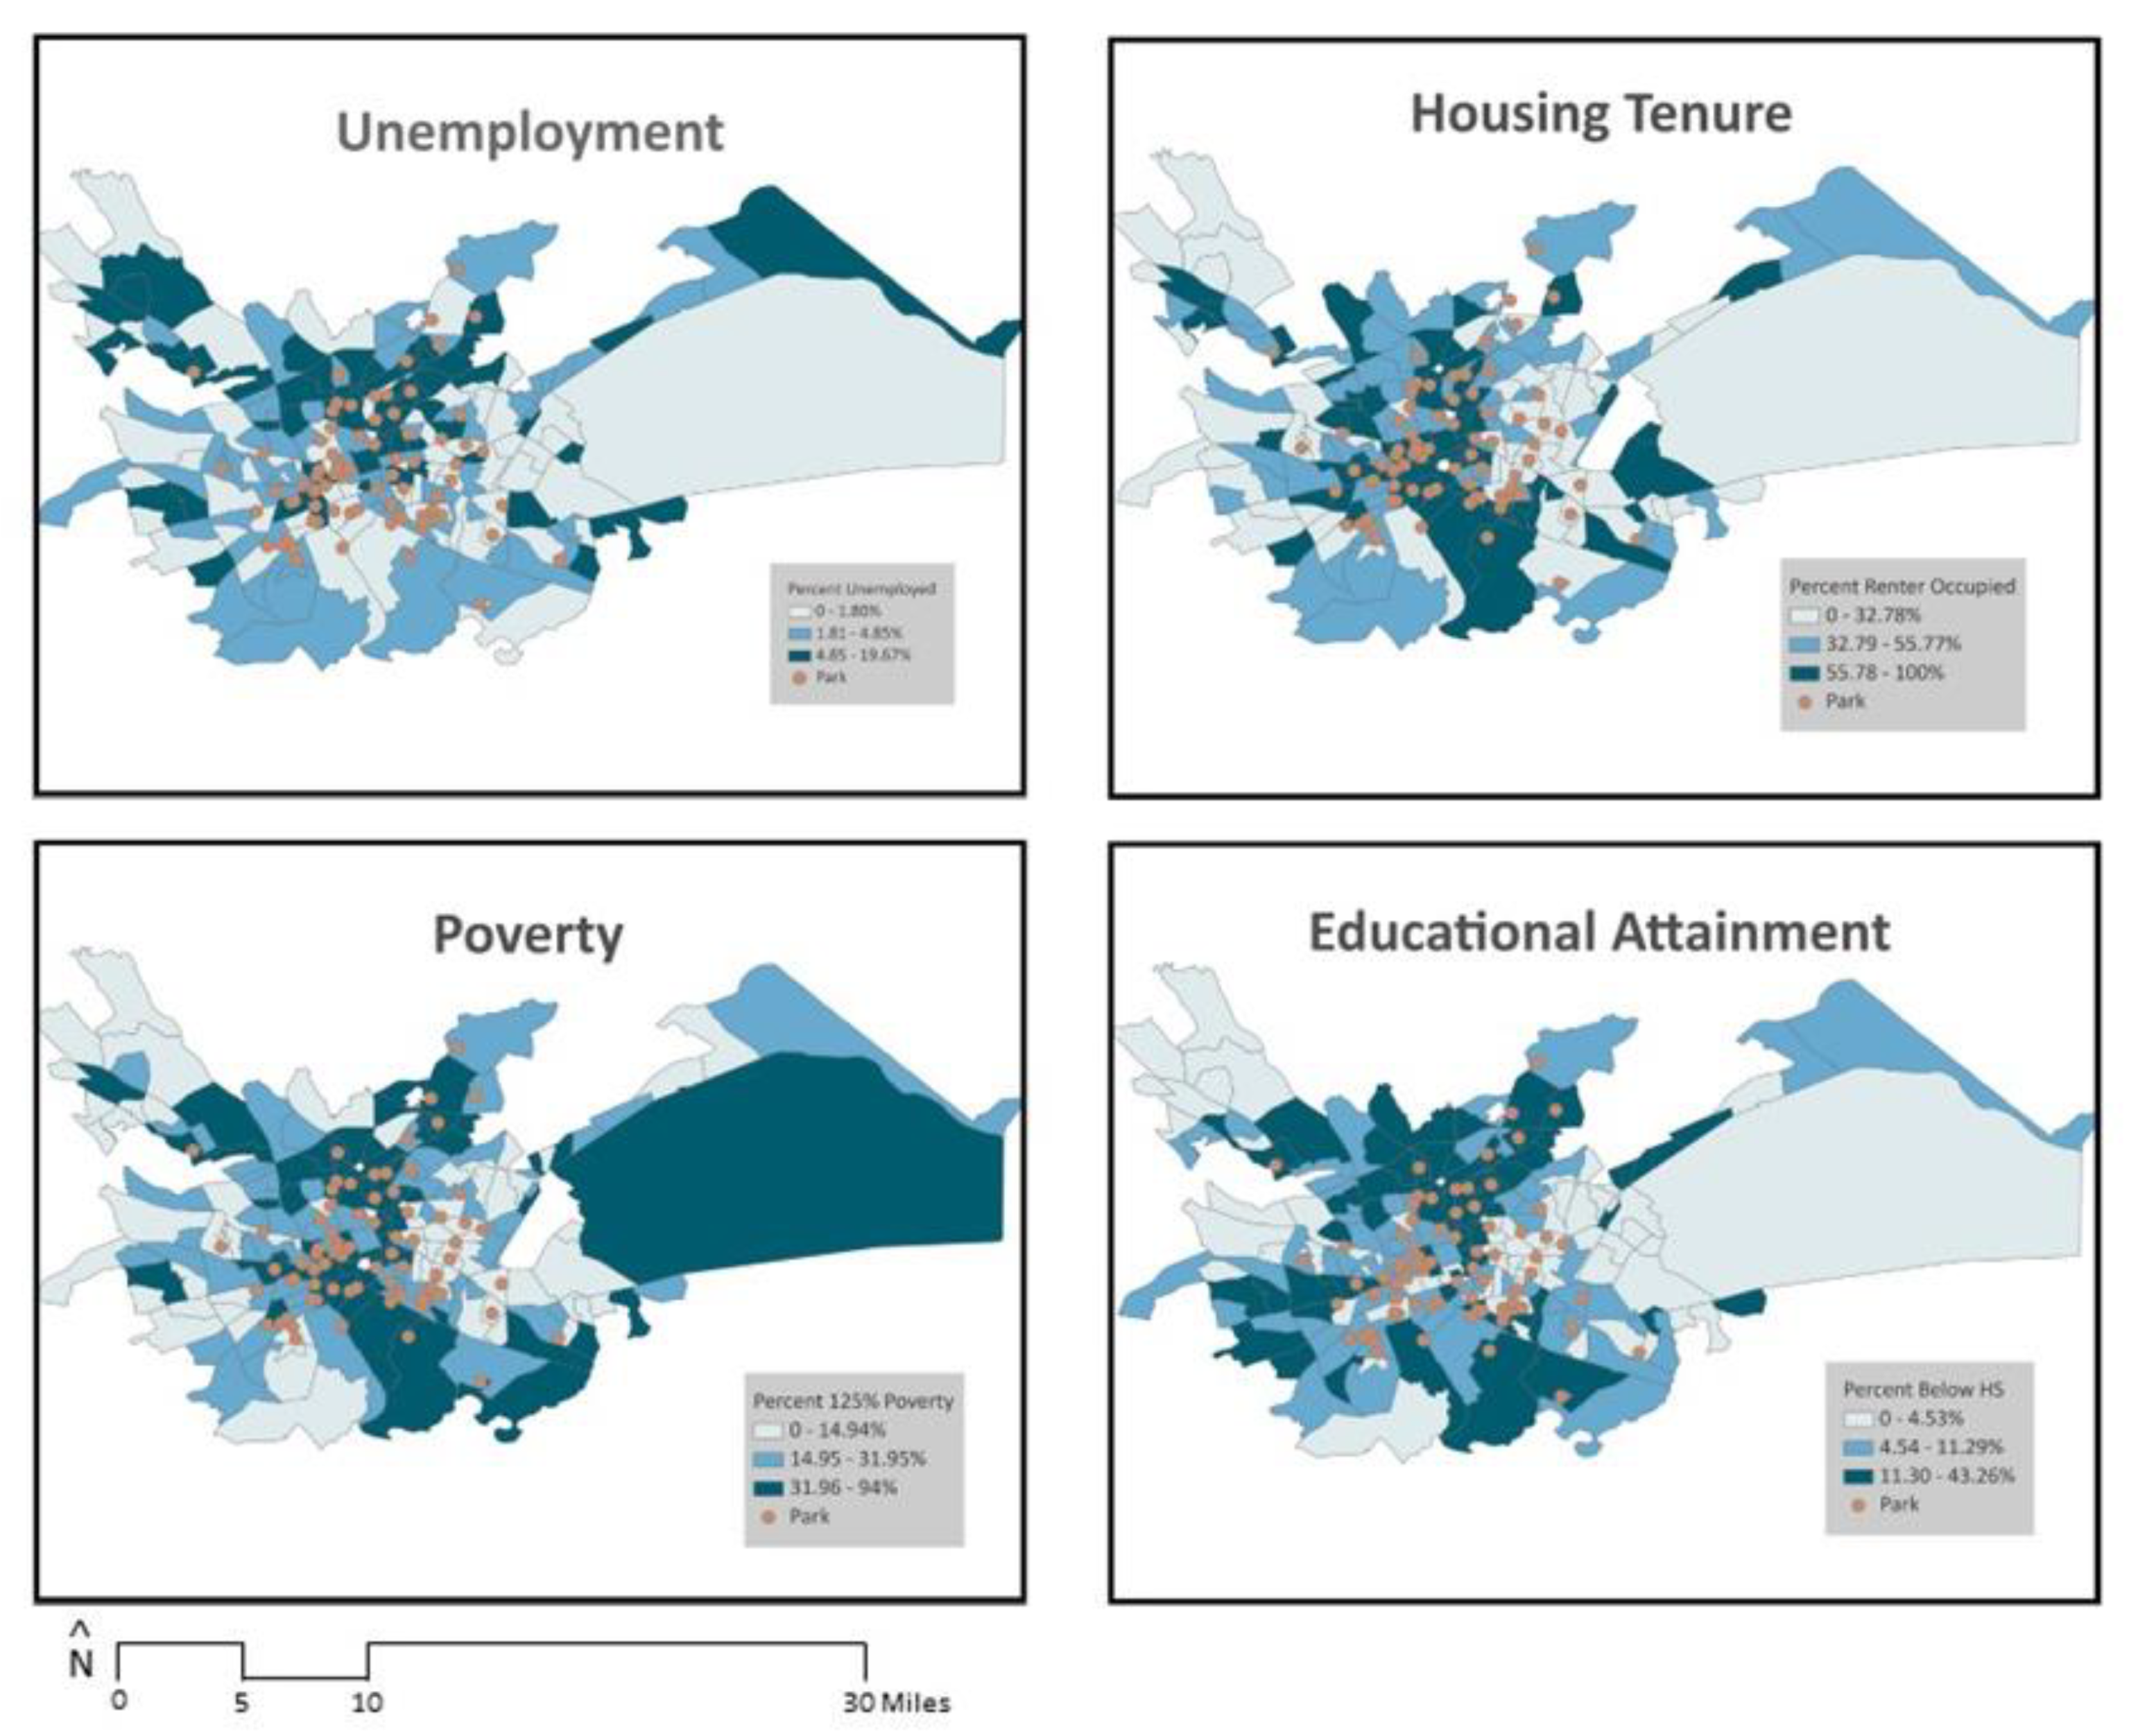
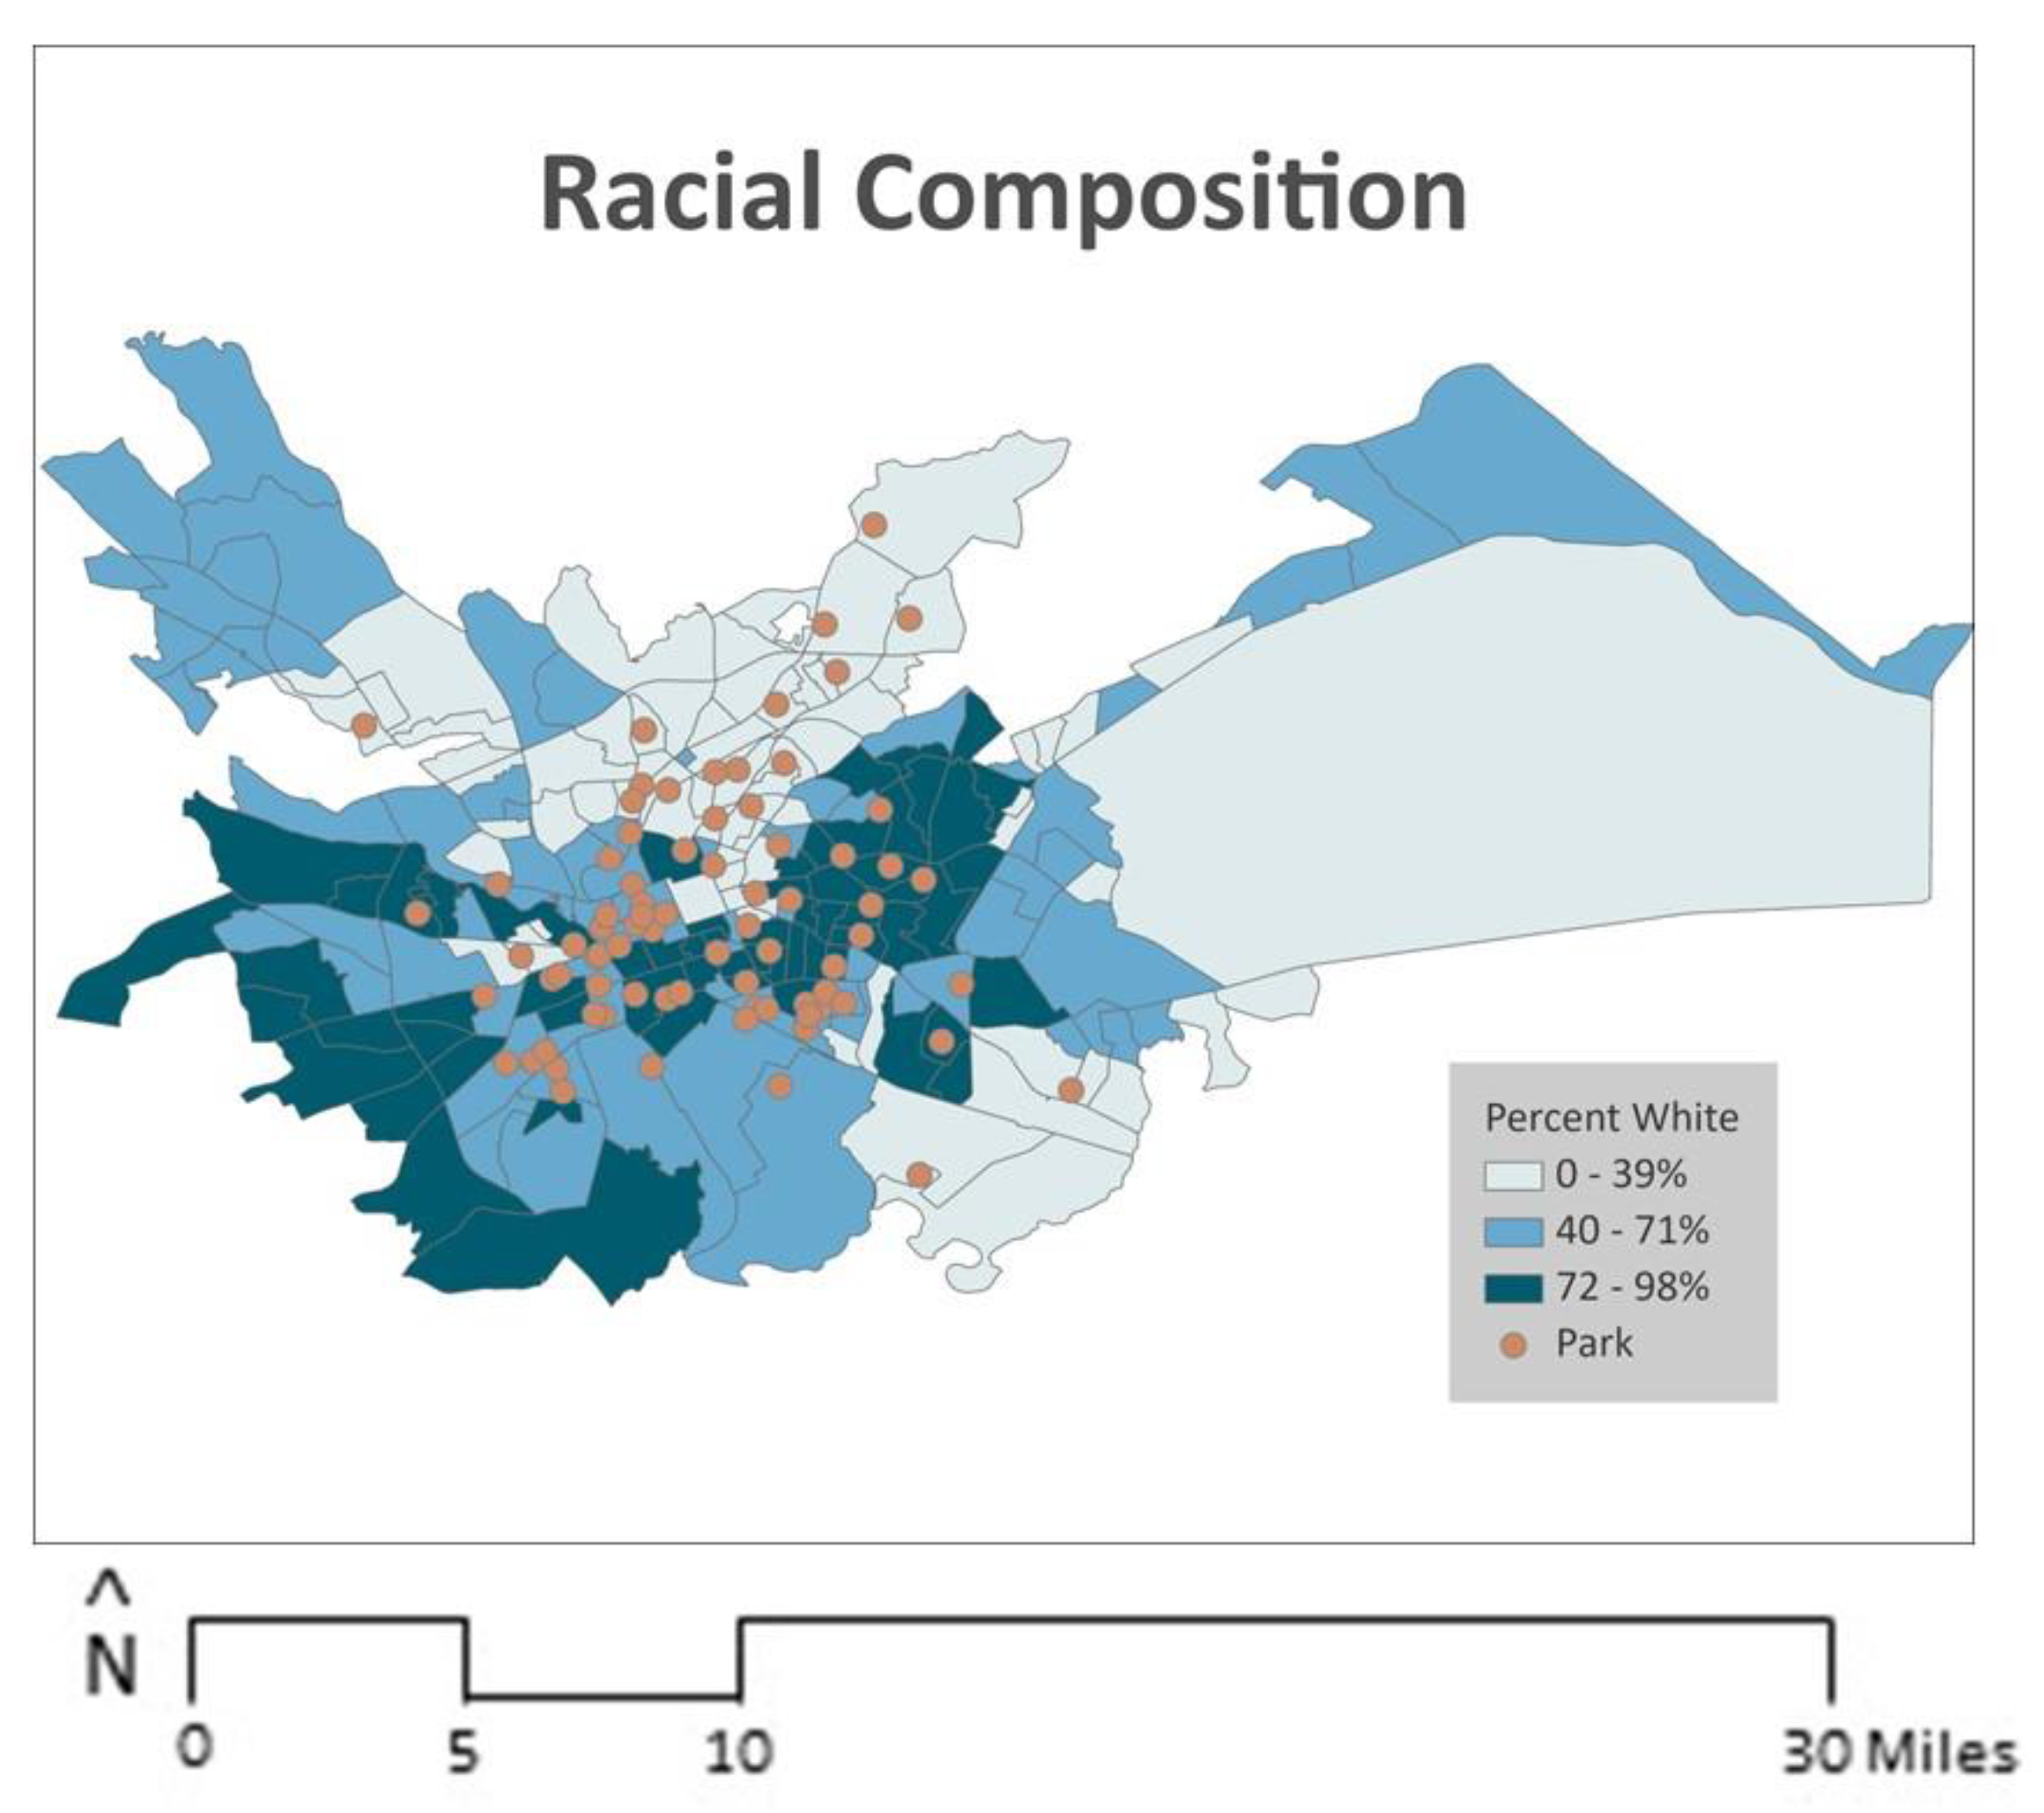
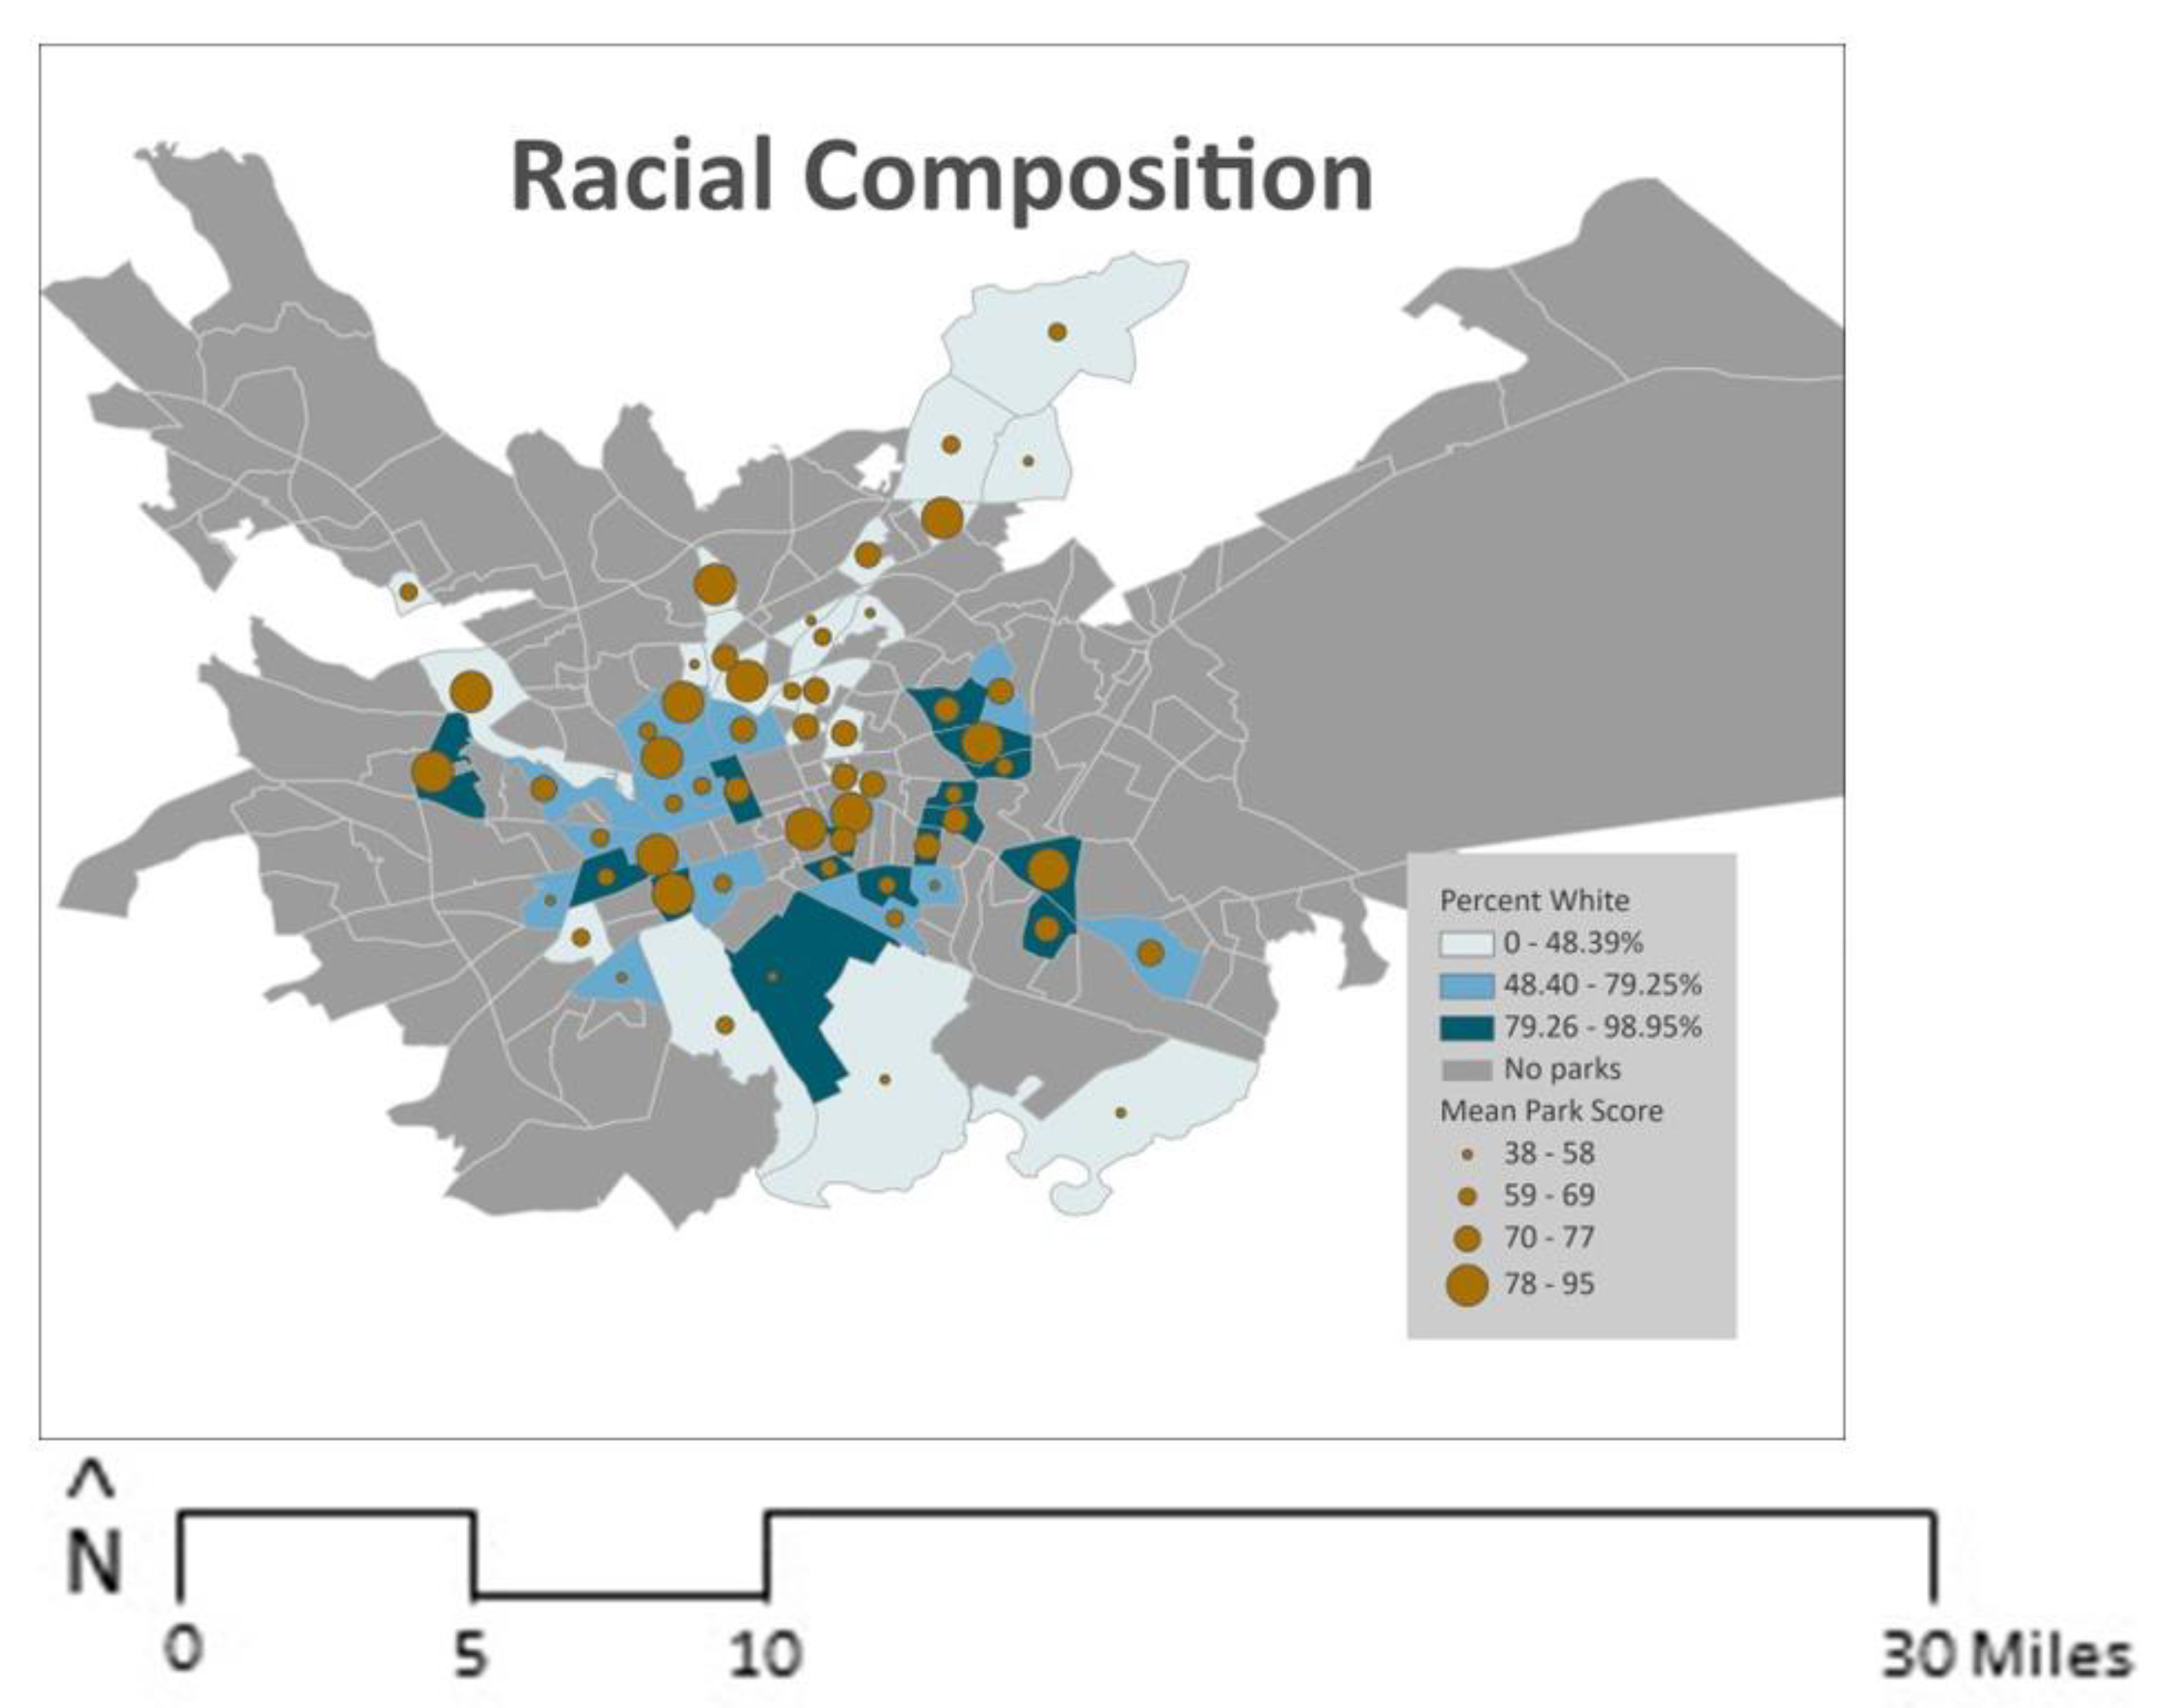
2.2.1. Neighborhood Sociodemographic Characteristics
2.2.2. Park Data Collection
2.2.3. Park Availability
2.2.4. Park Quality
3. Analysis
4. Results
4.1. Park Availability
4.2. Park Quality Indicators
4.2.1. Park Transportation Access
4.2.2. Facility Availability
4.2.3. Facility Quality
4.2.4. Park Amenity Availability
4.2.5. Park Aesthetics
4.2.6. Park Quality Concerns
4.2.7. Neighborhood Quality Concerns
4.2.8. Overall Park Quality
5. Discussion
6. Implications for Research and Practice
7. Strengths and Limitations
8. Conclusions
Author Contributions
Funding
Institutional Review Board Statement
Informed Consent Statement
Data Availability Statement
Conflicts of Interest
References
- Hazlehurst, M.F.; Muqueeth, S.; Wolf, K.L.; Simmons, C.; Kroshus, E.; Tandon, P.S. Park access and mental health among parents and children during the COVID-19 pandemic. BMC Public Health 2022, 22, 800. [Google Scholar] [CrossRef] [PubMed]
- Lee, A.C.K.; Maheswaran, R. The health benefits of urban green spaces: A review of the evidence. J. Public Health 2011, 33, 212–222. [Google Scholar] [CrossRef] [PubMed]
- Maas, J. Vitamin G (Green Spaces and Health): Potential Mechanisms, Policy Implications and Ideas for Further Research. In Neighbourhood Structure and Health Promotion; Stock, C., Ellaway, A., Eds.; Springer: New York, NY, USA, 2013; pp. 203–221. [Google Scholar] [CrossRef]
- Reuben, A.; Rutherford, G.W.; James, J.; Razani, N. Association of neighborhood parks with child health in the United States. Prev. Med. 2020, 141, 106265. [Google Scholar] [CrossRef] [PubMed]
- Sato, M.; Inoue, Y.; Du, J.; Funk, D.C. Access to parks and recreational facilities, physical activity, and health care costs for older adults: Evidence from U.S. counties. J. Leis. Res. 2019, 50, 220–238. [Google Scholar] [CrossRef]
- Besenyi, G.M.; Kaczynski, A.T.; Stanis, S.A.W.; Bergstrom, R.D.; Lightner, J.S.; Hipp, J.A. Planning for health: A community-based spatial analysis of park availability and chronic disease across the lifespan. Health Place 2014, 27, 102–105. [Google Scholar] [CrossRef] [PubMed]
- Jimenez, M.P.; DeVille, N.V.; Elliott, E.G.; Schiff, J.E.; Wilt, G.E.; Hart, J.E.; James, P. Associations between Nature Exposure and Health: A Review of the Evidence. Int. J. Environ. Res. Public Health 2021, 18, 4790. [Google Scholar] [CrossRef] [PubMed]
- Sugiyama, T.; Carver, A.; Koohsari, M.J.; Veitch, J. Advantages of public green spaces in enhancing population health. Landsc. Urban Plan. 2018, 178, 12–17. [Google Scholar] [CrossRef]
- Cohen, D.A.; Han, B.; Derose, K.P.; Williamson, S.; Marsh, T.; McKenzie, T.L. Physical Activity in Parks: A Randomized Controlled Trial Using Community Engagement. Am. J. Prev. Med. 2013, 45, 590–597. [Google Scholar] [CrossRef]
- Sugiyama, T.; Giles-Corti, B.; Summers, J.; Toit, L.; Leslie, E.; Owen, N. Initiating and maintaining recreational walking: A longitudinal study on the influence of neighborhood green space. Prev. Med. 2013, 57, 3. [Google Scholar] [CrossRef]
- Besenyi, G.M.; Kaczynski, A.T.; Wilhelm Stanis, S.A.; Vaughan, K.B. Demographic variations in observed energy expenditure across park activity areas. Prev. Med. 2013, 56, 79–81. [Google Scholar] [CrossRef]
- Kaczynski, A.T.; Besenyi, G.M.; Stanis, S.A.W.; Koohsari, M.J.; Oestman, K.B.; Bergstrom, R.; Potwarka, L.R.; Reis, R.S. Are park proximity and park features related to park use and park-based physical activity among adults? Variations by multiple socio-demographic characteristics. Int. J. Behav. Nutr. Phys. Act. 2014, 11, 146. [Google Scholar] [CrossRef] [PubMed]
- Godbey, G.C.; Caldwell, L.L.; Floyd, M.; Payne, L.L. Contributions of leisure studies and recreation and park management research to the active living agenda. Am. J. Prev. Med. 2005, 28 (Suppl. S2), 150–158. [Google Scholar] [CrossRef] [PubMed]
- Barton, J.; Pretty, J. What is the best dose of nature and green exercise for improving mental health? A multi-study analysis. Environ. Sci. Technol. 2010, 44, 3947–3955. [Google Scholar] [CrossRef] [PubMed]
- Klaperski, S.; Koch, E.; Hewel, D.; Schempp, A.; Müller, J. Optimizing mental health benefits of exercise: The influence of the exercise environment on acute stress levels and wellbeing. Ment. Health Prev. 2019, 15, 200173. [Google Scholar] [CrossRef]
- Broyles, S.T.; Mowen, A.J.; Theall, K.P.; Gustat, J.; Rung, A.L. Integrating Social Capital Into a Park-Use and Active-Living Framework. Am. J. Prev. Med. 2011, 40, 522–529. [Google Scholar] [CrossRef]
- Decloe, M.D.; Kaczynski, A.T.; Havitz, M.E. Social participation, flow and situational involvement in recreational physical activity. J. Leis. Res. 2009, 41, 73–91. [Google Scholar] [CrossRef]
- Jennings, V.; Bamkole, O. The Relationship between Social Cohesion and Urban Green Space: An Avenue for Health Promotion. Int. J. Environ. Res. Public Health 2019, 16, 452. [Google Scholar] [CrossRef] [PubMed]
- Bedimo-Rung, A.L.; Mowen, A.J.; Cohen, D.A. The significance of parks to physical activity and public health. Am. J. Prev. Med. 2005, 28, 2. [Google Scholar] [CrossRef]
- Kaczynski, A.T.; Potwarka, L.R.; Saelens, B.E. Association of Park Size, Distance, and Features with Physical Activity in Neighborhood Parks. Am. J. Public Health 2008, 98, 1451–1456. [Google Scholar] [CrossRef]
- Besenyi, G.M.; Diehl, P.; Schooley, B.; Turner-McGrievy, B.M.; Wilcox, S.; Stanis, S.A.W.; Kaczynski, A.T. Development and testing of mobile technology for community park improvements: Validity and reliability of the eCPAT application with youth. Transl. Behav. Med. 2016, 6, 519–532. [Google Scholar] [CrossRef]
- Chen, S.; Sleipness, O.; Xu, Y.; Park, K.; Christensen, K. A systematic review of alternative protocols for evaluating non-spatial dimensions of urban parks. Urban For. Urban Green. 2020, 53, 126718. [Google Scholar] [CrossRef]
- Kaczynski, A.T.; Stanis, S.A.W.; Besenyi, G.M. Development and testing of a community stakeholder park audit tool. Am. J. Prev. Med. 2012, 42, 242–249. [Google Scholar] [CrossRef] [PubMed]
- Bai, H.; Wilhelm Stanis, S.A.; Kaczynski, A.T.; Besenyi, G.M. Perceptions of Neighborhood Park Quality: Associations with Physical Activity and Body Mass Index. Ann. Behav. Med. 2013, 45, 39–48. [Google Scholar] [CrossRef] [PubMed]
- Besenyi, G.M.; Kaczynski, A.T.; Stanis, S.A.W.; Bergstrom, R.; Oestman, K.B.; Colabianchi, N. Sex differences in the relationship between park proximity and features and child and youth physical activity. Child. Youth Environ. 2016, 26, 56–84. [Google Scholar] [CrossRef]
- Giles-Corti, B.; Broomhall, M.H.; Knuiman, M.; Collins, C.; Douglas, K.; Ng, K.; Lange, A.; Donovan, R.J. Increasing walking: How important is distance to, attractiveness, and size of public open space? Am. J. Prev. Med. 2005, 28, 169–176. [Google Scholar] [CrossRef] [PubMed]
- Park, K. Park and Neighborhood Attributes Associated with Park Use: An Observational Study Using Unmanned Aerial Vehicles. Environ. Behav. 2020, 52, 518–543. [Google Scholar] [CrossRef]
- Schipperijn, J.; Bentsen, P.; Troelsen, J.; Toftager, M.; Stigsdotter, U.K. Associations between physical activity and characteristics of urban green space. Urban For. Urban Green. 2013, 12, 109–116. [Google Scholar] [CrossRef]
- Schipperijn, J.; Cerin, E.; Adams, M.A.; Reis, R.; Smith, G.; Cain, K.; Christiansen, L.B.; Dyck, D.; van Gidlow, C.; Frank, L.D.; et al. Access to parks and physical activity: An eight country comparison. Urban For. Urban Green. 2017, 27, 253–263. [Google Scholar] [CrossRef]
- Sugiyama, T.; Francis, J.; Middleton, N.J.; Owen, N.; Giles-Corti, B. Associations Between Recreational Walking and Attractiveness, Size, and Proximity of Neighborhood Open Spaces. Am. J. Public Health 2010, 100, 1752–1757. [Google Scholar] [CrossRef]
- Grilli, G.; Mohan, G.; Curtis, J. Public park attributes, park visits, and associated health status. Landsc. Urban Plan. 2020, 199, 103814. [Google Scholar] [CrossRef]
- McCormack, G.R.; Rock, M.; Toohey, A.M.; Hignell, D. Characteristics of urban parks associated with park use and physical activity: A review of qualitative research. Health Place 2010, 16, 712–726. [Google Scholar] [CrossRef]
- Richardson, A.S.; Ghosh-Dastidar, M.; Collins, R.L.; Hunter, G.P.; Troxel, W.M.; Colabianchi, N.; Cohen, D.A.; Dubowitz, T. Improved street walkability, incivilities, and esthetics are associated with greater park use in two low-income neighborhoods. J. Urban Health 2020, 97, 204–212. [Google Scholar] [CrossRef] [PubMed]
- Hughey, S.M.; Walsemann, K.M.; Child, S.; Powers, A.; Reed, J.A.; Kaczynski, A.T. Using an environmental justice approach to examine the relationships between park availability and quality indicators, neighborhood disadvantage, and racial/ethnic composition. Landsc. Urban Plan. 2016, 148, 159–169. [Google Scholar] [CrossRef]
- Kamel, A.A.; Ford, P.B.; Kaczynski, A.T. Disparities in park availability, features, and characteristics by social determinants of health within a U.S.–Mexico border urban area. Prev. Med. 2014, 69, S111–S113. [Google Scholar] [CrossRef] [PubMed]
- Marquet, O.; Aaron Hipp, J.; Alberico, C.; Huang, J.-H.; Fry, D.; Mazak, E.; Lovasi, G.S.; Floyd, M.F. Park use preferences and physical activity among ethnic minority children in low-income neighborhoods in New York City. Urban For. Urban Green. 2019, 38, 346–353. [Google Scholar] [CrossRef]
- McCarthy, S.M.; Hughey, S.M.; Kaczynski, A.T. Examining sociodemographic differences in playground availability and quality and associations with childhood obesity. Child. Obes. 2017, 13, 324–331. [Google Scholar] [CrossRef] [PubMed]
- Roberts, H.; Kellar, I.; Conner, M.; Gidlow, C.; Kelly, B.; Nieuwenhuijsen, M.; McEachan, R. Associations between park features, park satisfaction and park use in a multi-ethnic deprived urban area. Urban For. Urban Green. 2019, 46, 126485. [Google Scholar] [CrossRef]
- Vaughan, K.B.; Kaczynski, A.T.; Wilhelm Stanis, S.A.; Besenyi, G.M.; Bergstrom, R.; Heinrich, K.M. Exploring the Distribution of Park Availability, Features, and Quality Across Kansas City, Missouri by Income and Race/Ethnicity: An Environmental Justice Investigation. Ann. Behav. Med. 2013, 45 (Suppl. S1), S28–S38. [Google Scholar] [CrossRef]
- Zenk, S.N.; Pugach, O.; Ragonese-Barnes, M.; Odoms-Young, A.; Powell, L.M.; Slater, S.J. Did playground renovations equitably benefit neighborhoods in Chicago? J. Urban Health 2021, 98, 248–258. [Google Scholar] [CrossRef]
- Dai, D. Racial/ethnic and socioeconomic disparities in urban green space accessibility: Where to intervene? Landsc. Urban Plan. 2011, 102, 234–244. [Google Scholar] [CrossRef]
- Duncan, D.T.; Kawachi, I.; White, K.; Williams, D.R. The geography of recreational open space: Influence of neighborhood racial composition and neighborhood poverty. J. Urban Health 2013, 90, 618–631. [Google Scholar] [CrossRef] [PubMed]
- Estabrooks, P.A.; Lee, R.E.; Gyurcsik, N.C. Resources for physical activity participation: Does availability and accessibility differ by neighborhood socioeconomic status? Ann. Behav. Med. A Publ. Soc. Behav. Med. 2003, 25, 100–104. [Google Scholar] [CrossRef] [PubMed]
- Jones, S.A.; Moore, L.V.; Moore, K.; Zagorski, M.; Brines, S.J.; Diez Roux, A.V.; Evenson, K.R. Disparities in physical activity resource availability in six US regions. Prev. Med. 2015, 78, 17–22. [Google Scholar] [CrossRef] [PubMed]
- Rigolon, A. A complex landscape of inequity in access to urban parks: A literature review. Landsc. Urban Plan. 2016, 153, 160–169. [Google Scholar] [CrossRef]
- Wen, M.; Zhang, X.; Harris, C.D.; Holt, J.B.; Croft, J.B. Spatial Disparities in the Distribution of Parks and Green Spaces in the USA. Ann. Behav. Med. 2013, 45, S1. [Google Scholar] [CrossRef] [PubMed]
- Wolch, J.R.; Byrne, J.; Newell, J.P. Urban green space, public health, and environmental justice: The challenge of making cities ‘just green enough. ’ Landsc. Urban Plan. 2014, 125, 234–244. [Google Scholar] [CrossRef]
- Xiao, Y.; Wang, D.; Fang, J. Exploring the disparities in park access through mobile phone data: Evidence from Shanghai, China. Landsc. Urban Plan. 2019, 181, 80–91. [Google Scholar] [CrossRef]
- Powell, L.M.; Slater, S.; Chaloupka, F.J. The relationship between community physical activity settings and race, ethnicity and socioeconomic status. Evid.-Based Prev. Med. 2004, 1, 135–144. [Google Scholar]
- Rigolon, A.; Browning, M.H.; Lee, K.; Shin, S. Access to urban green space in cities of the Global South: A systematic literature review. Urban Sci. 2018, 2, 67. [Google Scholar] [CrossRef]
- Gilliland, J.; Holmes, M.; Irwin, J.D.; Tucker, P. Environmental equity is child’s play: Mapping public provision of recreation opportunities in urban neighbourhoods. Vulnerable Child. Youth Stud. 2006, 1, 256–268. [Google Scholar] [CrossRef]
- Harris, C.D.; Paul, P.; Zhang, X.; Fulton, J.E. Park access among school-age youth in the United States. J. Phys. Act. Health 2015, 12, S94–S101. [Google Scholar] [CrossRef]
- Bruton, C.M.; Floyd, M.F. Disparities in Built and Natural Features of Urban Parks: Comparisons by Neighborhood Level Race/Ethnicity and Income. J. Urban Health 2014, 91, 894–907. [Google Scholar] [CrossRef] [PubMed]
- Hoffimann, E.; Barros, H.; Ribeiro, A.I. Socioeconomic Inequalities in Green Space Quality and Accessibility—Evidence from a Southern European City. Int. J. Environ. Res. Public Health 2017, 14, 916. [Google Scholar] [CrossRef]
- Moore, L.V.; Diez Roux, A.V.; Evenson, K.R.; McGinn, A.P.; Brines, S.J. Availability of recreational resources in minority and low socioeconomic status areas. Am. J. Prev. Med. 2008, 34, 16–22. [Google Scholar] [CrossRef] [PubMed]
- Cohen, D.A.; Lapham, S.; Evenson, K.R.; Williamson, S.; Golinelli, D.; Ward, P.; Hillier, A.; McKenzie, T.L. Use of neighbourhood parks: Does socio-economic status matter? A four-city study. Public Health 2013, 127, 325–332. [Google Scholar] [CrossRef] [PubMed]
- Chen, S.; Christensen, K.M.; Li, S. A comparison of park access with park need for children: A case study in Cache County, Utah. Landsc. Urban Plan. 2019, 187, 119–128. [Google Scholar] [CrossRef]
- Engelberg, J.K.; Conway, T.L.; Geremia, C.; Cain, K.L.; Saelens, B.E.; Glanz, K.; Frank, L.D.; Sallis, J.F. Socioeconomic and race/ethnic disparities in observed park quality. BMC Public Health 2016, 16, 395. [Google Scholar] [CrossRef] [PubMed]
- Jenkins, G.R.; Yuen, H.K.; Rose, E.J.; Maher, A.I.; Gregory, K.C.; Cotton, M.E. Disparities in quality of park play spaces between two cities with diverse income and race/ethnicity composition: A pilot study. Int. J. Environ. Res. Public Health 2015, 12, 8009–8022. [Google Scholar] [CrossRef]
- Suminski, R.R.; Connolly, E.K.; May, L.E.; Wasserman, J.; Olvera, N.; Lee, R.E. Park Quality in Racial/Ethnic Minority Neighborhoods. Environ. Justice 2012, 5, 271–278. [Google Scholar] [CrossRef]
- Rossen, L.M. Neighbourhood economic deprivation explains racial/ethnic disparities in overweight and obesity among children and adolescents in the USA. J. Epidemiol. Community Health 2014, 68, 123–129. [Google Scholar] [CrossRef]
- Taylor, W.C.; Poston, W.S.C.; Jones, L.; Kraft, M.K. Environmental justice: Obesity, physical activity, and healthy eating. J. Phys. Act. Health 2006, 3, S30–S54. [Google Scholar] [CrossRef] [PubMed]
- Uzochukwu, K. The associations between neighborhood constructs, physical activity, and childhood obesity: Understanding race and income disparities. J. Urban Aff. 2017, 39, 421–435. [Google Scholar] [CrossRef]
- Derose, K.P.; Han, B.; Williamson, S.; Cohen, D.A.; RAND Corporation. Racial-Ethnic Variation in Park Use and Physical Activity in the City of Los Angeles. J. Urban Health 2015, 92, 1011–1023. [Google Scholar] [CrossRef] [PubMed]
- Haughton, C.F.; Wang, M.L.; Lemon, S.C. Racial/Ethnic Disparities in Meeting 5-2-1-0 Recommendations among Children and Adolescents in the United States. J. Pediatr. 2016, 175, 188–194.e1. [Google Scholar] [CrossRef] [PubMed]
- Saffer, H.; Dave, D.; Grossman, M.; Ann Leung, L. Racial, ethnic, and gender differences in physical activity. J. Hum. Cap. 2013, 7, 378–410. [Google Scholar] [CrossRef] [PubMed]
- Joassart-Marcelli, P.M.; Musso, J.A.; Wolch, J.R. Fiscal consequences of concentrated poverty in a metropolitan region. Ann. Assoc. Am. Geogr. 2005, 95, 336–356. [Google Scholar] [CrossRef]
- Sister, C.; Wolch, J.; Wilson, J. Got green? Addressing environmental justice in park provision. GeoJournal 2010, 75, 229–248. [Google Scholar] [CrossRef]
- Abercrombie, L.C.; Sallis, J.F.; Conway, T.L.; Frank, L.D.; Saelens, B.E.; Chapman, J.E. Income and Racial Disparities in Access to Public Parks and Private Recreation Facilities. Am. J. Prev. Med. 2008, 34, 9–15. [Google Scholar] [CrossRef]
- Crawford, D.; Timperio, A.; Giles-Corti, B.; Ball, K.; Hume, C.; Roberts, R.; Andrianopoulos, N.; Salmon, J. Do features of public open spaces vary according to neighbourhood socio-economic status? Health Place 2008, 14, 889–893. [Google Scholar] [CrossRef]
- Floyd, M.F.; Taylor, W.C.; Whitt-Glover, M. Measurement of Park and Recreation Environments That Support Physical Activity in Low-Income Communities of Color: Highlights of Challenges and Recommendations. Am. J. Prev. Med. 2009, 36 (Suppl. S4), S156–S160. [Google Scholar] [CrossRef]
- SCDHEC. Available online: https://scdhec.gov/health/eliminating-health-disparities/disparities-health-outcomes-data (accessed on 4 October 2023).
- Centers for Disease Control and Prevention (CDC). Adult Physical Inactivity. Available online: https://www.cdc.gov/physicalactivity/data/inactivity-prevalence-maps/index.html (accessed on 23 March 2023).
- America’s Health Rankings (AHR). Explore Physical Inactivity in South Carolina. Available online: https://www.americashealthrankings.org/explore/measures/Sedentary/SC (accessed on 22 August 2023).
- SCDHEC. Eliminating Health Disparities. Available online: https://scdhec.gov/health/eliminating-health-disparities (accessed on 4 October 2023).
- South Carolina, County Health Rankings. County Health Rankings & Roadmaps. Available online: https://www.countyhealthrankings.org/explore-health-rankings/south-carolina (accessed on 31 August 2023).
- RUCA. Available online: https://depts.washington.edu/uwruca/ (accessed on 13 January 2024).
- USDA ERS. Available online: https://www.ers.usda.gov/data-products/rural-urban-commuting-area-codes/ (accessed on 13 January 2024).
- Census Block Groups in 2020. Available online: https://opendata.dc.gov/datasets/DCGIS::census-block-groups-in-2020/about (accessed on 22 August 2023).
- U.S. Census Bureau. QuickFacts: South Carolina. Available online: https://www.cennhbdsus.gov/quickfacts/SC (accessed on 19 May 2022).
- Hallum, S.H.; Hughey, S.M.; Wende, M.E.; Stowe, E.W.; Kaczynski, A.T. Healthy and unhealthy food environments are linked with neighbourhood socio-economic disadvantage: An innovative geospatial approach to understanding food access inequities. Public Health Nutr. 2020, 23, 3190–3196. [Google Scholar] [CrossRef] [PubMed]
- Kaczynski, A.T.; Hughey, S.M.; Stowe, E.W.; Wende, M.E.; Hipp, J.A.; Oliphant, E.L.; Schipperijn, J. ParkIndex: Validation and application of a pragmatic measure of park access and use. Prev. Med. Rep. 2020, 20, 101218. [Google Scholar] [CrossRef] [PubMed]
- Cohen, D.A.; McKenzie, T.L.; Sehgal, A.; Williamson, S.; Golinelli, D.; Lurie, N. Contribution of Public Parks to Physical Activity. Am. J. Public Health 2007, 97, 3. [Google Scholar] [CrossRef] [PubMed]
- Evenson, K.R.; Jones, S.A.; Holliday, K.M.; Cohen, D.A.; McKenzie, T.L. Park characteristics, use, and physical activity: A review of studies using SOPARC (System for Observing Play and Recreation in Communities). Prev. Med. 2016, 86, 153–166. [Google Scholar] [CrossRef] [PubMed]
- Thornton, R.L.J.; Glover, C.M.; Cené, C.W.; Glik, D.C.; Henderson, J.A.; Williams, D.R. Evaluating Strategies for Reducing Health Disparities by Addressing the Social Determinants of Health. Health Affairs. 2016, 35, 1416–1423. [Google Scholar] [CrossRef] [PubMed]
- Botchwey, N.; Dannenberg, A.L.; Frumkin, H. Making Healthy Places: Designing and Building for Well-Being, Equity, and Sustainability; Island Press: Washington, DC, USA, 2022. [Google Scholar]
- Rojas-Rueda, D.; Morales-Zamora, E. Equitable Urban Planning: Harnessing the Power of Comprehensive Plans. Curr. Environ. Health Rep. 2023, 10, 125–136. [Google Scholar] [CrossRef] [PubMed]
- Myers, C.A.; Slack, T.; Martin, C.K.; Broyles, S.T.; Heymsfield, S.B. Regional Disparities in Obesity Prevalence in the United States: A Spatial Regime Analysis. Obesity 2015, 23, 481–487. [Google Scholar] [CrossRef]
- Macintyre, S.; Macdonald, L.; Ellaway, A. Do poorer people have poorer access to local resources and facilities? The distribution of local resources by area deprivation in Glasgow, Scotland. Soc. Sci. Med. 2008, 67, 6. [Google Scholar] [CrossRef]
- Jacobs, J. Dark Age Ahead: Author of The Death and Life of Great American Cities; Random House of Canada: Toronto, ON, Canada, 1961; Republish by Vintage Books: New York, NY, USA, 2010. [Google Scholar]
- Southworth, M. Designing the walkable city. J. Urban Plan. Dev. 2005, 131, 246–257. [Google Scholar] [CrossRef]
- Kelly, C.M.; Schootman, M.; Baker, E.A.; Barnidge, E.K.; Lemes, A. The association of sidewalk walkability and physical disorder with area-level race and poverty. J. Epidemiol. Community Health 2007, 61, 11. [Google Scholar] [CrossRef]
- Rajaee, M.; Echeverri, B.; Zuchowicz, Z.; Wiltfang, K.; Lucarelli, J.F. Socioeconomic and racial disparities of sidewalk quality in a traditional rust belt city. SSM Popul. Health 2021, 16, 100975. [Google Scholar] [CrossRef]
- Zhang, R.; Zhang, C.-Q.; Cheng, W.; Lai, P.C.; Schüz, B. The neighborhood socioeconomic inequalities in urban parks in a High-density City: An environmental justice perspective. Landsc. Urban Plan. 2021, 211, 104099. [Google Scholar] [CrossRef]
- Casciano, R. Political and civic participation among disadvantaged urban mothers: The role of neighborhood poverty. Soc. Sci. Q. 2007, 88, 1124–1151. [Google Scholar] [CrossRef]
- Swart, L.-A.; Ismail, G.; Seedat, M. Community participation in a low-income neighborhood: The salience of sociodemographic characteristics, perceptions and experience of violence, and neighborhood attachment. J. Community Psychol. 2023, 51, 319–333. [Google Scholar] [CrossRef] [PubMed]
- Ziersch, A.; Osborne, K.; Baum, F. Local community group participation: Who participates and what aspects of neighbourhood matter? Urban Policy Res. 2011, 29, 381–399. [Google Scholar] [CrossRef]
- Rigolon, A.; Browning, M.; Jennings, V. Inequities in the quality of urban park systems: An environmental justice investigation of cities in the United States. Landsc. Urban Plan. 2018, 178, 156–169. [Google Scholar] [CrossRef]
- Knapp, M.; Gustat, J.; Darensbourg, R.; Myers, L.; Johnson, C. The Relationships between Park Quality, Park Usage, and Levels of Physical Activity in Low-Income, African American Neighborhoods. Int. J. Environ. Res. Public Health 2019, 16, 85. [Google Scholar] [CrossRef] [PubMed]
- Rung, A.L.; Mowen, A.J.; Broyles, S.T.; Gustat, J. The role of park conditions and features on park visitation and physical activity. J. Phys. Act. Health 2011, 8 (Suppl. S2), S178–S187. [Google Scholar] [CrossRef] [PubMed]
- Wilhelm Stanis, S.A.; Schneider, I.E.; Shinew, K.J.; Chavez, D.J.; Vogel, M.C. Physical Activity and the Recreation Opportunity Spectrum: Differences in Important Site Attributes and Perceived Constraints. J. Park Recreat. Adm. 2009, 27, 73–91. [Google Scholar]
- Holifield, R.; Williams, K.C. Urban parks, environmental justice, and voluntarism: The distribution of friends of the parks groups in Milwaukee county. Environ. Justice 2014, 7, 70–76. [Google Scholar] [CrossRef]
- Joassart-Marcelli, P.; Wolch, J.; Salim, Z. Building the healthy city: The role of nonprofits in creating active urban parks. Urban Geogr. 2011, 32, 682–711. [Google Scholar] [CrossRef]
- Scott, D. Economic Inequality, Poverty, and Park and Recreation Delivery. J. Park Recreat. Adm. 2013, 31, 1–11. [Google Scholar]
- Kaczynski, A.T.; Koohsari, M.J.; Stanis, S.A.W.; Bergstrom, R.; Sugiyama, T. Association of street connectivity and road traffic speed with park usage and park-based physical activity. Am. J. Health Promot. 2014, 28, 197–203. [Google Scholar] [CrossRef] [PubMed]
- National Recreation and Park Association. Available online: https://www.nrpa.org/our-work/partnerships/initiatives/safe-routes-to-parks/ (accessed on 13 August 2023).
- Kaczynski, A.T.; Schipperijn, J.; Hipp, J.A.; Besenyi, G.M.; Wilhelm Stanis, S.A.; Hughey, S.M.; Wilcox, S. ParkIndex: Development of a standardized metric of park access for research and planning. Prev. Med. 2016, 87, 110–114. [Google Scholar] [CrossRef] [PubMed]
- Shuib, K.B.; Hashim, H.; Nasir, N.A.M. Community Participation Strategies in Planning for Urban Parks. Procedia Soc. Behav. Sci. 2015, 168, 311–320. [Google Scholar] [CrossRef]
- Zhang, R.; Peng, S.; Sun, F.; Deng, L.; Che, Y. Assessing the social equity of urban parks: An improved index integrating multiple quality dimensions and service accessibility. Cities 2022, 129, 103839. [Google Scholar] [CrossRef]
- Larson, L.R.; Hipp, J.A. Nature-based Pathways to Health Promotion: The Value of Parks and Greenspace. N. Carol. Med. J. 2022, 83, 99–102. [Google Scholar] [CrossRef] [PubMed]
- Schultz, C.L.; Wilhelm Stanis, S.A.; Sayers, S.P.; Thombs, L.A.; Thomas, I.M. A longitudinal examination of improved access on park use and physical activity in a low-income and majority African American neighborhood park. Prev. Med. 2017, 95, S95–S100. [Google Scholar] [CrossRef]
- Siikamäki, J.; Wernstedt, K. Turning Brownfields into Greenspaces: Examining Incentives and Barriers to Revitalization. J. Health Politics Policy Law 2008, 33, 559–593. [Google Scholar] [CrossRef]
- Veitch, J.; Salmon, J.; Crawford, D.; Abbott, G.; Giles-Corti, B.; Carver, A.; Timperio, A. The REVAMP natural experiment study: The impact of a play-scape installation on park visitation and park-based physical activity. Int. J. Behav. Nutr. Phys. Act. 2018, 15, 10. [Google Scholar] [CrossRef]
- Cohen, D.A.; Han, B.; Williamson, S.; Nagel, C.; McKenzie, T.L.; Evenson, K.R.; Harnik, P. Playground features and physical activity in U.S. neighborhood parks. Prev. Med. 2020, 131, 105945. [Google Scholar] [CrossRef] [PubMed]
- Levinger, P.; Dunn, J.; Panisset, M.; Haines, T.; Dow, B.; Batchelor, F.; Biddle, S.J.; Duque, G.; Hill, K.D. The ENJOY project: Usage and factors to support adherence and physical activity participation. Transl. J. Am. Coll. Sports Med. 2021, 6, 1–6. [Google Scholar] [CrossRef]
- McGuire, L.; Morris, S.L.; Pollard, T.M. Community gardening and wellbeing: The understandings of organisers and their implications for gardening for health. Health Place 2022, 75, 102773. [Google Scholar] [CrossRef] [PubMed]
- Moula, Z.; Palmer, K.; Walshe, N. A systematic review of arts-based interventions delivered to children and young people in nature or outdoor spaces: Impact on nature connectedness, health and wellbeing. Front. Psychol. 2022, 13, 858781. [Google Scholar] [CrossRef] [PubMed]
- Cohen, D.A.; Han, B.; Nagel, C.J.; Harnik, P.; McKenzie, T.L.; Evenson, K.R.; Marsh, T.; Williamson, S.; Vaughan, C.A.; Katta, S. The First National Study of Neighborhood Parks: Implications for Physical Activity. Am. J. Prev. Medicine 2016, 51, 419–426. Available online: https://www.rand.org/pubs/external_publications/EP66493.html (accessed on 23 July 2023). [CrossRef] [PubMed]
- McCormack, G.R.; Rock, M.; Swanson, K.; Burton, L.; Massolo, A. Physical activity patterns in urban neighbourhood parks: Insights from a multiple case study. BMC Public Health 2014, 14, 962. [Google Scholar] [CrossRef] [PubMed]
- Cilliers, E.J.; Timmermans, W. The Importance of Creative Participatory Planning in the Public Place-Making Process. Environ. Plan. B Plan. Des. 2014, 41, 413–429. [Google Scholar] [CrossRef]

| Block Group Characteristics | Overall (n = 241) | ||
|---|---|---|---|
| Block Groups with No Parks | Block Groups with Any Parks | F (p) 1 | |
| Total N (%) | 168 (69.7) | 73 (30.3) | |
| Percent of Residents Unemployed Mean (SD) | 4.0 (3.9) | 4.1 (3.8) | 0.1 (0.79) |
| Percent of Residents Below 125% of the Poverty Level Mean (SD) | 25.1 (20.2) | 30.9 (19.8) | 4.2 (0.04) |
| Percent of Housing Units Rented Mean (SD) | 46.1 (26.4) | 51.3 (25.7) | 2.0 (0.16) |
| Percent of Residents with Less Than High School Education Mean (SD) | 9.7 (9.3) | 11.2 (10.4) | 1.3 (0.26) |
| Percent of Residents Identifying as Non-Hispanic White | 53.1 (31.4) | 53.9 (34.3) | 0.3 (0.86) |
| Block Group Characteristics | Overall (n = 241) | |||
|---|---|---|---|---|
| Low | Int. | High | F (p) 1 | |
| Total N (%) | 23 (31.5) | 25 (34.3) | 25 (34.3) | |
| Percent of Residents Unemployed Mean (SD) | 4.8 (5.2) | 3.6 (2.7) | 4.2 (3.3) | 0.6 (0.57) 2 |
| Percent of Residents Below 125% of the Poverty Level Mean (SD) | 27.5 (21.3) | 28.2 (17.1) | 36.8 (20.4) | 1.7 (0.19) |
| Percent of Housing Units Rented Mean (SD) | 47.8 (25.3) | 48.6 (23.1) | 57.3 (28.5) | 1.0 (0.37) |
| Percent of Residents with Less Than High School Education Mean (SD) | 10.3(9.8) | 11.7 (11.3) | 11.5 (10.3) | 0.1 (0.88) |
| Percent of Residents Identifying as Non-Hispanic White Mean (SD) | 51.4 (37.6) | 54.5 (34.8) | 55.6 (32.0) | 0.1 (0.91) |
| Overall (n = 241) | ||||||||
|---|---|---|---|---|---|---|---|---|
| Block Group Characteristics | Transportation Access B (p) | Facility Availability B (p) | Facility Quality B (p) | Amenity Availability B (p) | Aesthetics B (p) | Park Quality Concerns B (p) | Neighborhood Quality Concerns B (p) | Total Park Quality Score B (p) |
| Percent of Residents Unemployed | 0.13 (0.32) | −0.13 (0.31) | 0.11 (0.37) | −0.26 (0.03) | −0.08 (0.51) | 0.10 (0.42) | 0.25 (0.04) | −0.03 (0.80) |
| Percent of Residents Below 125% of the Poverty Level | −0.10 (0.60) | 0.02 (0.94) | 0.22 (0.27) | −0.22 (0.22) | 0.18 (0.31) | −0.09 (0.61) | −0.29 (0.12) | −0.03 (0.87) |
| Percent of Housing Units Rented | −0.06 (0.73) | −0.22 (0.24) | −0.22 (0.24) | −0.15 (0.37) | 0.09 (0.59) | −0.16 (0.345) | −0.12 (0.49) | −0.20 (0.28) |
| Percent of Residents with Less Than High School Education | 0.45 (0.02) | 0.35 (0.06) | −0.19 (0.30) | 0.19 (0.26) | −0.56 (<0.01) | −0.20 (0.24) | −0.18 (0.30) | −0.03 (0.87) |
| Percent of Residents Identifying as Non-Hispanic White | 0.34 (0.05) | −0.07 (0.70) | 0.12 (0.50) | 0.14 (0.40) | −0.02 (0.90) | 0.14 (0.39) | −0.10 (0.56) | 0.13 (0.44) |
Disclaimer/Publisher’s Note: The statements, opinions and data contained in all publications are solely those of the individual author(s) and contributor(s) and not of MDPI and/or the editor(s). MDPI and/or the editor(s) disclaim responsibility for any injury to people or property resulting from any ideas, methods, instructions or products referred to in the content. |
© 2024 by the authors. Licensee MDPI, Basel, Switzerland. This article is an open access article distributed under the terms and conditions of the Creative Commons Attribution (CC BY) license (https://creativecommons.org/licenses/by/4.0/).
Share and Cite
Hallum, S.H.; Wende, M.E.; Hesam Shariati, F.; Thomas, K.M.; Chupak, A.L.; Witherspoon, E.; Kaczynski, A.T. Unearthing Inequities in the Relationship between Multiple Sociodemographic Factors and Diverse Elements of Park Availability and Quality in a Major Southern Metropolitan Region. Int. J. Environ. Res. Public Health 2024, 21, 204. https://doi.org/10.3390/ijerph21020204
Hallum SH, Wende ME, Hesam Shariati F, Thomas KM, Chupak AL, Witherspoon E, Kaczynski AT. Unearthing Inequities in the Relationship between Multiple Sociodemographic Factors and Diverse Elements of Park Availability and Quality in a Major Southern Metropolitan Region. International Journal of Environmental Research and Public Health. 2024; 21(2):204. https://doi.org/10.3390/ijerph21020204
Chicago/Turabian StyleHallum, Shirelle H., Marilyn E. Wende, Farnaz Hesam Shariati, Kelsey M. Thomas, Anna L. Chupak, Eleanor Witherspoon, and Andrew T. Kaczynski. 2024. "Unearthing Inequities in the Relationship between Multiple Sociodemographic Factors and Diverse Elements of Park Availability and Quality in a Major Southern Metropolitan Region" International Journal of Environmental Research and Public Health 21, no. 2: 204. https://doi.org/10.3390/ijerph21020204
APA StyleHallum, S. H., Wende, M. E., Hesam Shariati, F., Thomas, K. M., Chupak, A. L., Witherspoon, E., & Kaczynski, A. T. (2024). Unearthing Inequities in the Relationship between Multiple Sociodemographic Factors and Diverse Elements of Park Availability and Quality in a Major Southern Metropolitan Region. International Journal of Environmental Research and Public Health, 21(2), 204. https://doi.org/10.3390/ijerph21020204