
Benzene Exposure and Lung Cancer Risk: A Systematic Review and Meta-Analysis of Human Studies

 ,
,  ,
, 
Abstract
1. Introduction
2. Materials and Methods
2.1. Search Strategy and Data Source
2.2. Selection Criteria
2.3. Data Extraction and Management
2.4. Assessment of the Level of Evidence
2.5. Statistical Analysis
3. Results
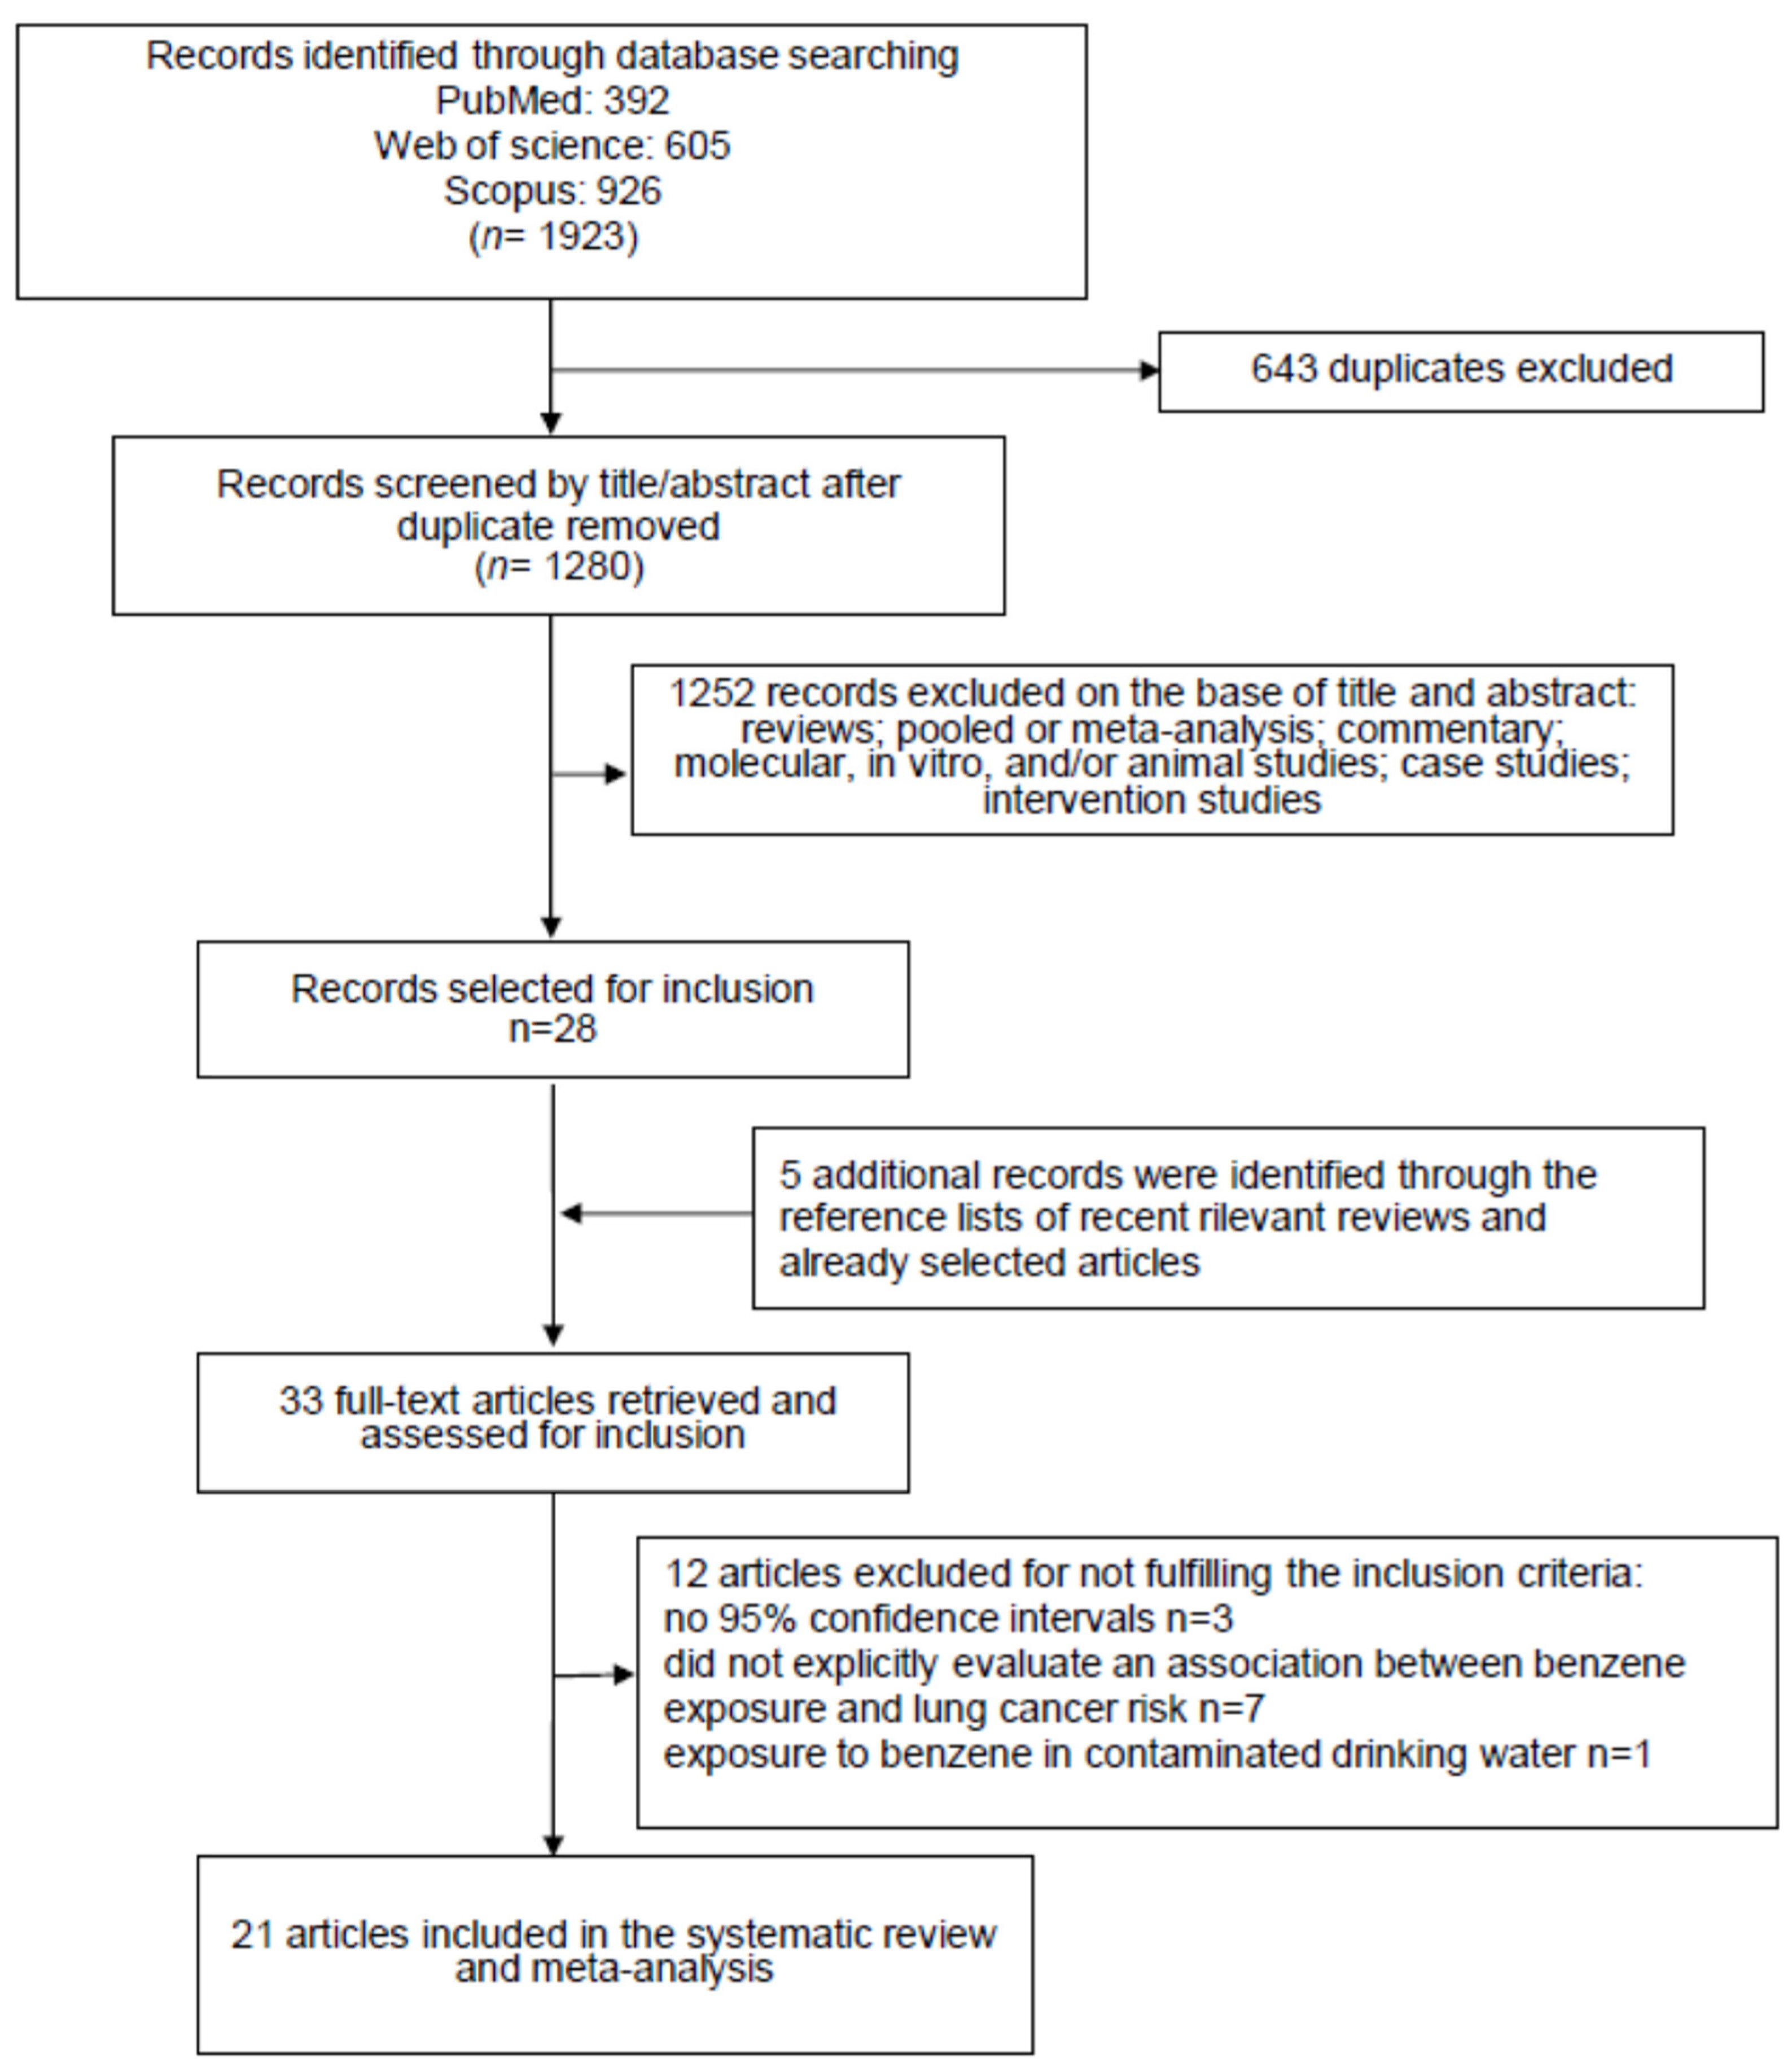
3.1. Study Selection
3.2. Study Characteristics
3.3. Risk of Bias
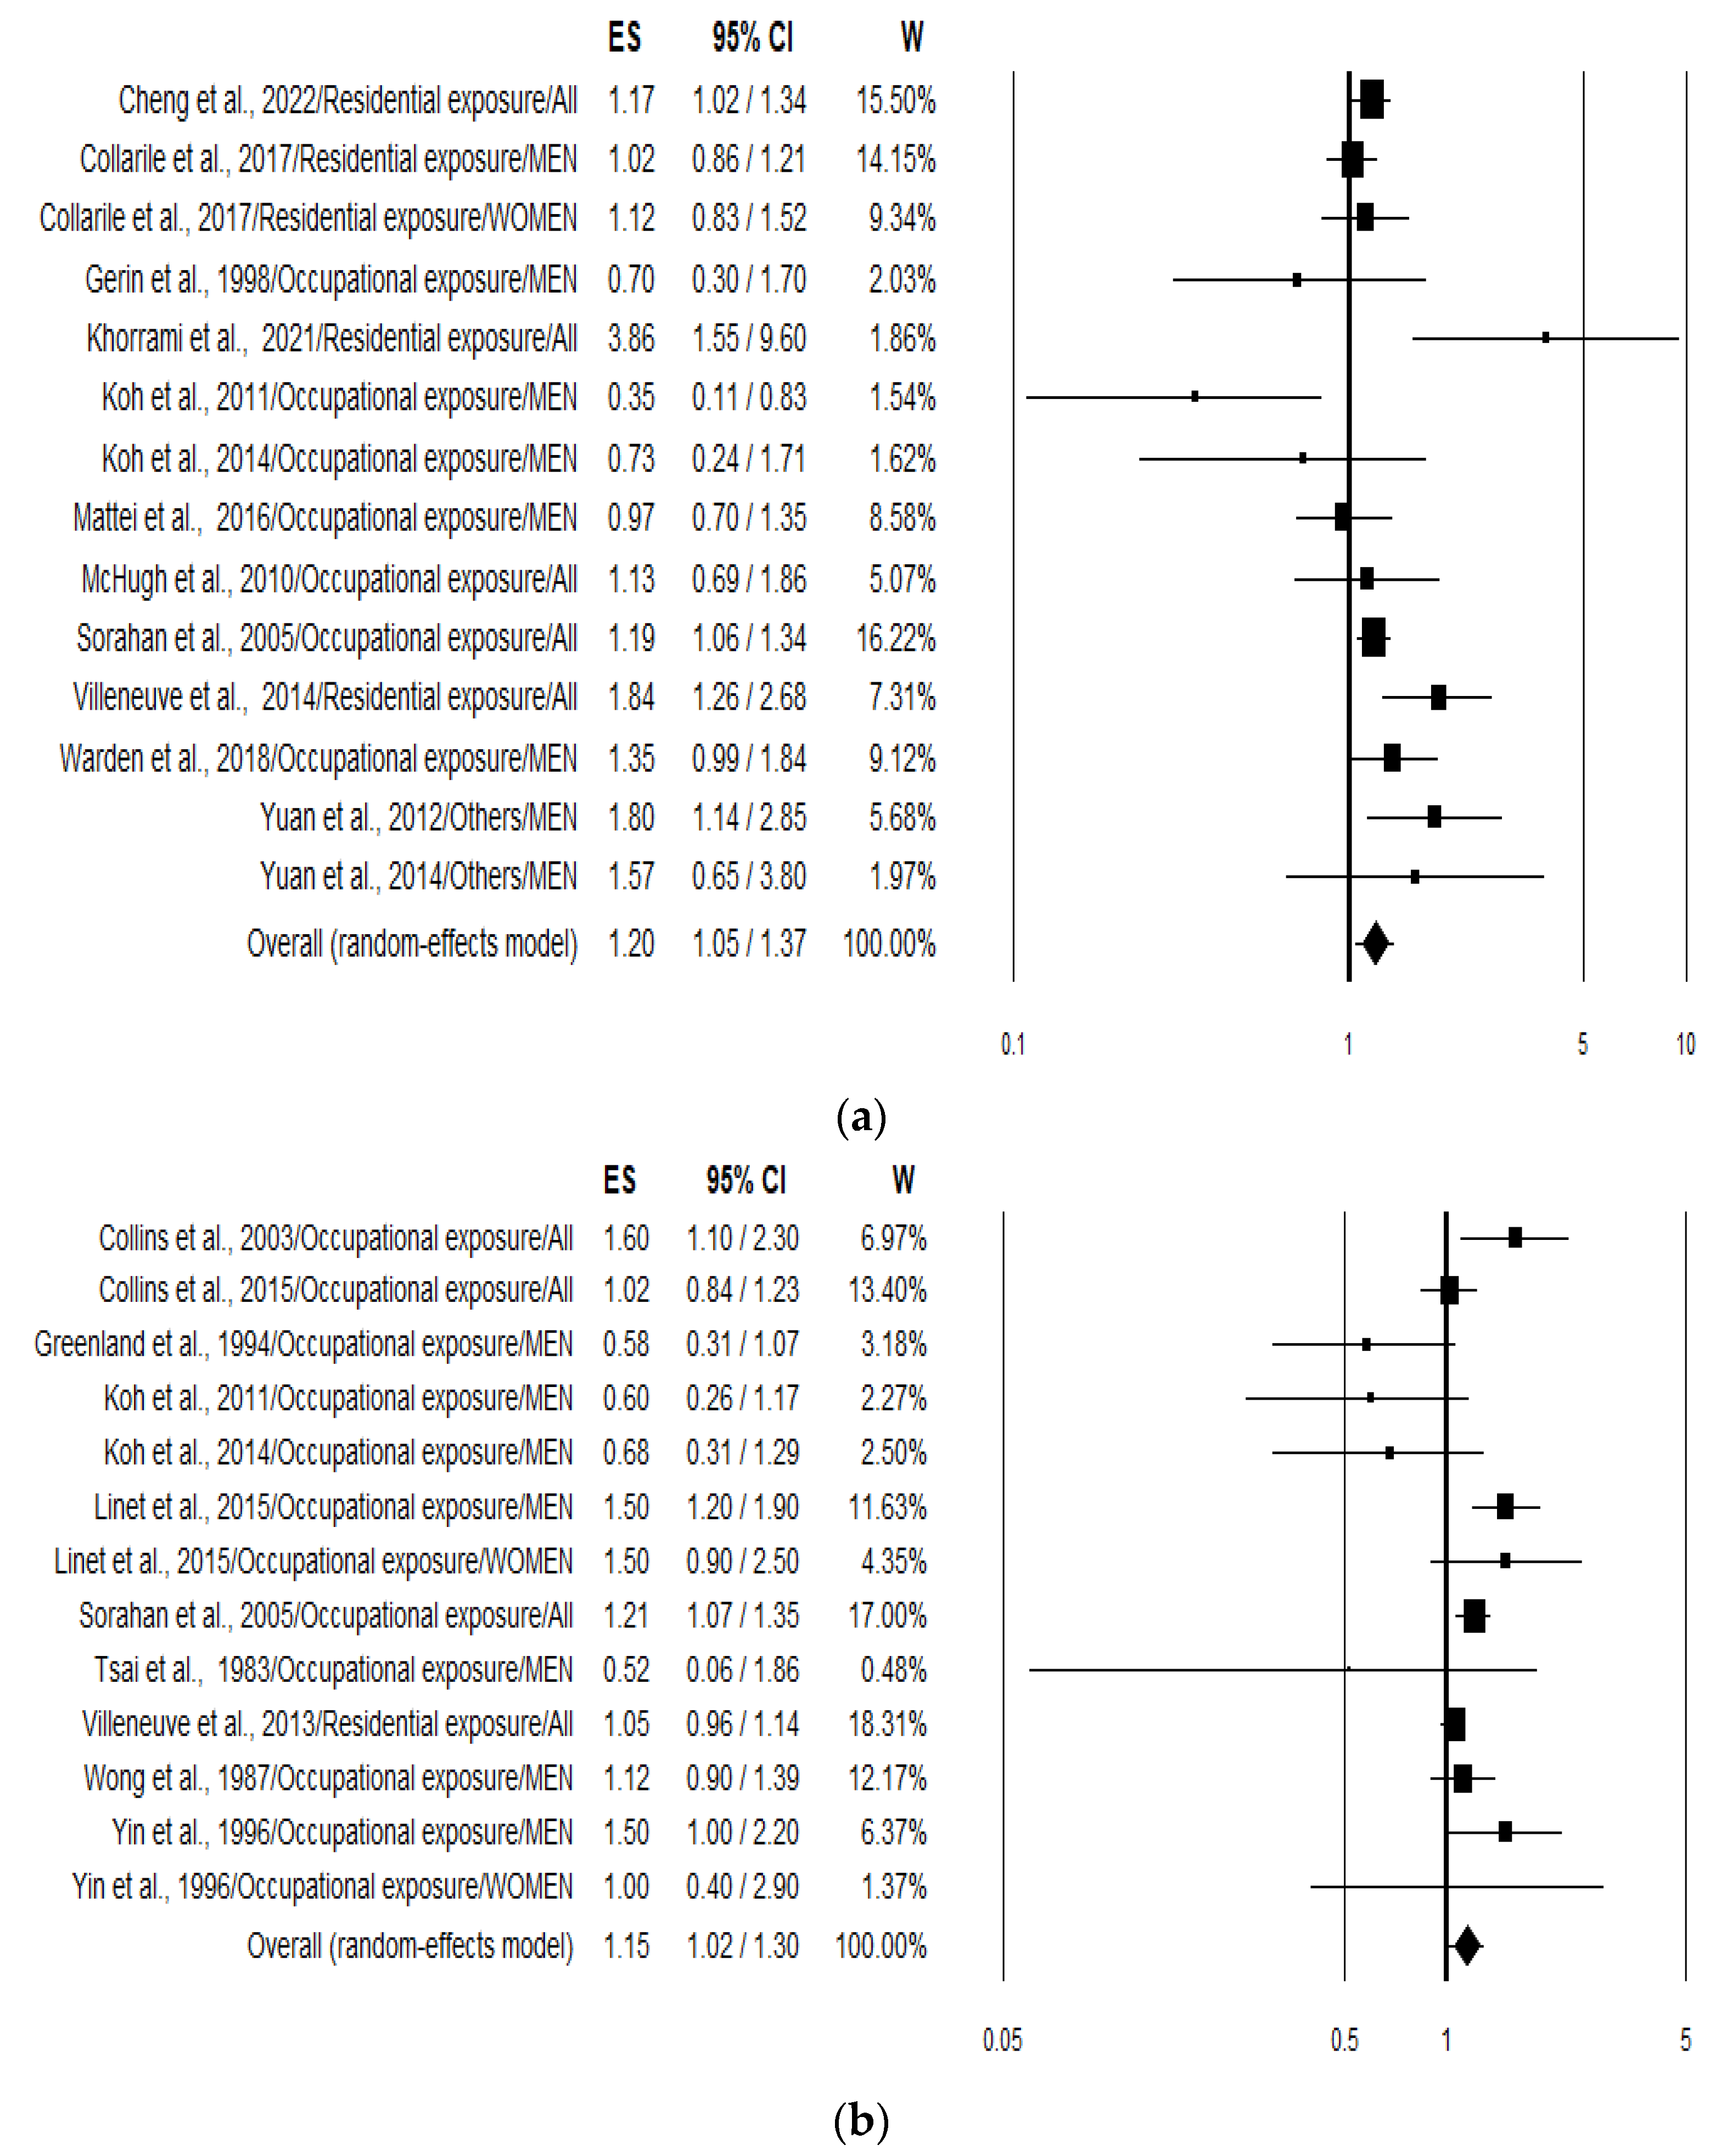
3.4. Meta-Analysis
3.5. Publication Bias
3.6. Sensitivity Analysis
4. Discussion
5. Conclusions
Supplementary Materials
Author Contributions
Funding
Institutional Review Board Statement
Data Availability Statement
Acknowledgments
Conflicts of Interest
References
- Sung, H.; Ferlay, J.; Siegel, R.L.; Laversanne, M.; Soerjomataram, I.; Jemal, A.; Bray, F. Global Cancer Statistics 2020: GLOBOCAN Estimates of Incidence and Mortality Worldwide for 36 Cancers in 185 Countries. CA Cancer J. Clin. 2021, 71, 209–249. [Google Scholar] [CrossRef]
- Thandra, K.C.; Barsouk, A.; Saginala, K.; Aluru, J.S.; Barsouk, A. Epidemiology of lung cancer. Contemp. Oncol. 2021, 25, 45–52. [Google Scholar]
- Purdue, M.P.; Hutchings, S.J.; Rushton, L.; Silverman, D.T. The proportion of cancer attributable to occupational exposures. Ann. Epidemiol. 2015, 25, 188–192. [Google Scholar] [CrossRef]
- IARC (International Agency for Research on Cancer). Monographs on the Evaluation of Carcinogenic Risks to Humans; IARC: Lyon, France, 2016; Volume 109. [Google Scholar]
- Kim, H.B.; Shim, J.Y.; Park, B.; Lee, Y.J. Long-term exposure to air pollutants and cancer mortality: A meta-analysis of cohort studies. Int. J. Environ. Res. Public Health 2018, 15, 2608. [Google Scholar] [CrossRef]
- Stieb, D.M.; Berjawi, R.; Emode, M.; Zheng, C.; Salama, D.; Hocking, R.; Lyrette, N.; Matz, C.; Lavigne, E.; Shin, H.H. Systematic review and meta-analysis of cohort studies of long-term outdoor nitrogen dioxide exposure and mortality. PLoS ONE 2021, 16, e0246451. [Google Scholar] [CrossRef] [PubMed]
- Galbraith, D.; Gross, S.A.; Paustenbach, D. Benzene and human health: A historical review and appraisal of associations with various diseases. Crit. Rev. Toxicol. 2010, 40, 1–46. [Google Scholar] [CrossRef] [PubMed]
- Sekar, A.; Varghese, G.K.; Ravi Varma, M.K. Analysis of benzene air quality standards, monitoring methods and concentrations in indoor and outdoor environment. Heliyon 2019, 29, e02918. [Google Scholar] [CrossRef] [PubMed]
- Statista Research Department. 2023. Available online: https://www.statista.com/statistics/1245172/benzene-market-volume-orldwide/#statisticContainer (accessed on 20 October 2023).
- IARC (International Agency for Research on Cancer). Monographs on the Evaluation of the Carcinogenic Risks to Humans; Chemical Agents and Related Occupations; IARC: Lyon, France, 2012; Volume 100F. [Google Scholar]
- Wei, T.; Jiao, R.; Nakyeyune, R.; Zang, Z.; Shao, Y.; Shen, Y.; Niu, C.; Zhu, L.; Ruan, X.; Liu, F. Exposure to outdoor air pollution at different periods and the risk of leukemia: A meta-analysis. Environ. Sci. Pollut. Res. Int. 2021, 28, 35376–35391. [Google Scholar] [CrossRef] [PubMed]
- Rana, I.; Dahlberg, S.; Steinmaus, C.; Zhang, L. Benzene exposure and non-Hodgkin lymphoma: A systematic review and meta-analysis of human studies. Lancet Planet Health 2021, 5, e633–e643. [Google Scholar] [CrossRef] [PubMed]
- IARC (International Agency for Research on Cancer). Monographs on the Evaluation of Carcinogenic Risks to Humans; Benzene; IARC: Lyon, France, 2018; Volume 120. [Google Scholar]
- Dekkers, O.M.; Vandenbroucke, J.P.; Cevallos, M.; Renehan, A.G.; Altman, D.G.; Egger, M. COSMOS-E: Guidance on conducting systematic reviews and meta-analyses of observational studies of etiology. PLoS Med. 2019, 16, e1002742. [Google Scholar] [CrossRef] [PubMed]
- Morgan, R.L.; Thayer, K.A.; Bero, L.; Bruce, N.; Falck-Ytter, Y.; Ghersi, D.; Guyatt, G.; Hooijmans, C.; Langendam, M.; Mandrioli, D.; et al. GRADE: Assessing the quality of evidence in environmental and occupational health. Environ. Int. 2016, 92–93, 611–616. [Google Scholar] [CrossRef] [PubMed]
- Morgan, R.L.; Thayer, K.A.; Santesso, N.; Holloway, A.C.; Blain, R.; Eftim, S.E.; Goldstone, A.E.; Ross, P.; Guyatt, G.; Schünemann, H.J. Evaluation of the risk of bias in non-randomized studies of interventions (ROBINS-I) and the ‘target experiment’ concept in studies of exposures: Rationale and preliminary instrument development. Environ. Int. 2018, 120, 382–387. [Google Scholar] [CrossRef] [PubMed]
- Schünemann, H.J.; Cuello, C.; Akl, E.A.; Mustafa, R.A.; Meerpohl, J.J.; Thayer, K.; Morgan, R.L.; Gartlehner, G.; Kunz, R.; Katikireddi, S.V.; et al. GRADE guidelines: 18. How ROBINS-I and other tools to assess risk of bias in nonrandomized studies should be used to rate the certainty of a body of evidence. J. Clin. Epidemiol. 2019, 111, 105–114. [Google Scholar] [CrossRef] [PubMed]
- Sterne, J.A.; Hernán, M.A.; Reeves, B.C.; Savović, J.; Berkman, N.D.; Viswanathan, M.; Henry, D.; Altman, D.G.; Ansari, M.T.; Boutron, I.; et al. ROBINS-I: A tool for assessing risk of bias in non-randomised studies of interventions. BMJ 2016, 355, i4919. [Google Scholar] [CrossRef] [PubMed]
- Higgins, J.P.; Thompson, S.G. Quantifying heterogeneity in a meta-analysis. Stat. Med. 2002, 21, 1539–1558. [Google Scholar] [CrossRef]
- Higgins, J.P.; Thompson, S.G.; Deeks, J.J.; Altman, D.G. Measuring inconsistency in meta-analyses. BMJ 2003, 327, 557–560. [Google Scholar] [CrossRef] [PubMed]
- Begg, C.B.; Mazumdar, M. Operating characteristics of a rank correlation test for publication bias. Biometrics 1994, 50, 1088–1101. [Google Scholar] [CrossRef]
- Egger, M.; Davey Smith, G.; Schneider, M.; Minder, C. Bias in meta-analysis detected by a simple, graphical test. BMJ 1997, 315, 629–634. [Google Scholar] [CrossRef]
- Cheng, I.; Yang, J.; Tseng, C.; Wu, J.; Shariff-Marco, S.; Park, S.L.; Conroy, S.M.; Inamdar, P.P.; Fruin, S.; Larson, T.; et al. Traffic-related air pollution and lung cancer incidence: The California multiethnic cohort study. Am. J. Respir. Crit. Care Med. 2022, 206, 1008–1018. [Google Scholar] [CrossRef]
- Khorrami, Z.; Pourkhosravani, M.; Rezapour, M.; Etemad, K.; Taghavi-Shahri, S.M.; Künzli, N.; Amini, H.; Khanjani, N. Multiple air pollutant exposure and lung cancer in Tehran, Iran. Sci. Rep. 2021, 11, 9239. [Google Scholar] [CrossRef]
- Warden, H.; Richardson, H.; Richardson, L.; Siemiatycki, J.; Ho, V. Associations between occupational exposure to benzene, toluene and xylene and risk of lung cancer in Montréal. Occup. Environ. Med. 2018, 75, 696–702. [Google Scholar] [CrossRef] [PubMed]
- Collarile, P.; Bidoli, E.; Barbone, F.; Zanier, L.; Del Zotto, S.; Fuser, S.; Stel, F.; Panato, C.; Gallai, I.; Serraino, D. Residence in proximity of a coal-oil-fired thermal power plant and risk of lung and bladder cancer in North-Eastern Italy. A population-based study: 1995–2009. Int. J. Environ. Res. Public Health 2017, 14, 860. [Google Scholar] [CrossRef] [PubMed]
- Mattei, F.; Liverani, S.; Guida, F.; Matrat, M.; Cenée, S.; Azizi, L.; Menvielle, G.; Sanchez, M.; Pilorget, C.; Lapôtre-Ledoux, B.; et al. Multidimensional analysis of the effect of occupational exposure to organic solvents on lung cancer risk: The ICARE study. Occup. Environ. Med. 2016, 73, 368–377. [Google Scholar] [CrossRef] [PubMed]
- Linet, M.S.; Yin, S.N.; Gilbert, E.S.; Dores, G.M.; Hayes, R.B.; Vermeulen, R.; Tian, H.Y.; Lan, Q.; Portengen, L.; Ji, B.T.; et al. A retrospective cohort study of cause-specific mortality and incidence of hematopoietic malignancies in Chinese benzene-exposed workers. Int. J. Cancer 2015, 137, 2184–2197. [Google Scholar] [CrossRef] [PubMed]
- Collins, J.J.; Anteau, S.E.; Swaen, G.M.; Bodner, K.M.; Bodnar, C.M. Lymphatic and hematopoietic cancers among benzene-exposed workers. J. Occup. Environ. Med. 2015, 57, 159–163. [Google Scholar] [CrossRef]
- Yuan, J.M.; Butler, L.M.; Gao, Y.T.; Murphy, S.E.; Carmella, S.G.; Wang, R.; Nelson, H.H.; Hecht, S.S. Urinary metabolites of a polycyclic aromatic hydrocarbon and volatile organic compounds in relation to lung cancer development in lifelong never smokers in the Shanghai Cohort Study. Carcinogenesis 2014, 35, 339–345. [Google Scholar] [CrossRef]
- Koh, D.H.; Chung, E.K.; Jang, J.K.; Lee, H.E.; Ryu, H.W.; Yoo, K.M.; Kim, E.A.; Kim, K.S. Cancer incidence and mortality among temporary maintenance workers in a refinery/petrochemical complex in Korea. Int. J. Occup. Environ. Health 2014, 20, 141–145. [Google Scholar] [CrossRef]
- Villeneuve, P.J.; Jerrett, M.; Su, J.; Burnett, R.T.; Chen, H.; Brook, J.; Wheeler, A.J.; Cakmak, S.; Goldberg, M.S. A cohort study of intra-urban variations in volatile organic compounds and mortality, Toronto, Canada. Environ. Pollut. 2013, 183, 30–39. [Google Scholar] [CrossRef]
- Villeneuve, P.J.; Jerrett, M.; Brenner, D.; Su, J.; Chen, H.; McLaughlin, J.R. A case-control study of long-term exposure to ambient volatile organic compounds and lung cancer in Toronto, Ontario, Canada. Am. J. Epidemiol. 2014, 179, 443–451. [Google Scholar] [CrossRef]
- Yuan, J.M.; Gao, Y.T.; Wang, R.; Chen, M.; Carmella, S.G.; Hecht, S.S. Urinary levels of volatile organic carcinogen and toxicant biomarkers in relation to lung cancer development in smokers. Carcinogenesis 2012, 33, 804–809. [Google Scholar] [CrossRef]
- Koh, D.H.; Kim, T.W.; Yoon, Y.H.; Shin, K.S.; Yoo, S.W. Lymphohematopoietic cancer mortality and morbidity of workers in a refinery/petrochemical complex in Korea. Saf. Health Work 2011, 2, 26–33. [Google Scholar] [CrossRef]
- McHugh, M.K.; Kachroo, S.; Liu, M.; D’Amelio, A.M., Jr.; Dong, Q.; Hong, W.K.; Greisinger, A.J.; Spitz, M.R.; Etzel, C.J. Assessing environmental and occupational risk factors for lung cancer in Mexican-Americans. Cancer Causes Control 2010, 21, 2157–2164. [Google Scholar] [CrossRef]
- Sorahan, T.; Kinlen, L.J.; Doll, R. Cancer risks in a historical UK cohort of benzene exposed workers. Occup. Environ. Med. 2005, 62, 231–236. [Google Scholar] [CrossRef]
- Collins, J.J.; Ireland, B.; Buckley, C.F.; Shepperly, D. Lymphohaematopoeitic cancer mortality among workers with benzene exposure. Occup. Environ. Med. 2003, 60, 676–679. [Google Scholar] [CrossRef]
- Gérin, M.; Siemiatycki, J.; Désy, M.; Krewski, D. Associations between several sites of cancer and occupational exposure to benzene, toluene, xylene, and styrene: Results of a case-control study in Montreal. Am. J. Ind. Med. 1998, 34, 144–156. [Google Scholar] [CrossRef]
- Yin, S.N.; Hayes, R.B.; Linet, M.S.; Li, G.L.; Dosemeci, M.; Travis, L.B.; Zhang, Z.N.; Li, D.G.; Chow, W.H.; Wacholder, S.; et al. An expanded cohort study of cancer among benzene-exposed workers in China. Benzene Study Group. Environ. Health Perspect. 1996, 104, 1339–1341. [Google Scholar] [CrossRef]
- Greenland, S.; Salvan, A.; Wegman, D.H.; Hallock, M.F.; Smith, T.J. A case-control study of cancer mortality at a transformer-assembly facility. Int. Arch. Occup. Environ. Health 1994, 66, 49–54. [Google Scholar] [CrossRef] [PubMed]
- Wong, O. An industry wide mortality study of chemical workers occupationally exposed to benzene. I. General results. Br. J. Ind. Med. 1987, 44, 365–381. [Google Scholar] [CrossRef]
- Tsai, S.P.; Wen, C.P.; Weiss, N.S.; Wong, O.; McClellan, W.A.; Gibson, R.L. Retrospective mortality and medical surveillance studies of workers in benzene areas of refineries. J. Occup. Med. 1983, 25, 685–692. [Google Scholar] [CrossRef]
- Zhang, Z.; Zhang, X.; Gao, Y.; Chen, Y.; Qin, L.; Wu, I.X. Risk factors for the development of lung cancer among never smokers: A systematic review. Cancer Epidemiol. 2022, 81, 102274. [Google Scholar] [CrossRef] [PubMed]
- Rabbani, G.; Nimmi, N.; Benke, G.P.; Dharmage, S.C.; Bui, D.; Sim, M.R.; Abramson, M.J.; Alif, S.M. Ever and cumulative occupational exposure and lung function decline in longitudinal population-based studies: A systematic review and meta-analysis. Occup. Environ. Med. 2023, 80, 51–60. [Google Scholar] [CrossRef] [PubMed]
- Liu, N.; Bu, Z.; Liu, W.; Kan, H.; Zhao, Z.; Deng, F.; Huang, C.; Zhao, B.; Zeng, X.; Sun, Y.; et al. Health effects of exposure to indoor volatile organic compounds from 1980 to 2017: A systematic review and meta-analysis. Indoor Air 2022, 32, e13038. [Google Scholar] [CrossRef] [PubMed]
- Chowdhury, R.; Shah, D.; Payal, A.R. Healthy Worker Effect Phenomenon: Revisited with Emphasis on Statistical Methods—A Review. Indian J. Occup. Environ. Med. 2017, 21, 2–8. [Google Scholar] [CrossRef] [PubMed]
- Khalade, A.; Jaakkola, M.S.; Pukkala, E.; Jaakkola, J.J. Exposure to benzene at work and the risk of leukemia: A systematic review and meta-analysis. Environ. Health 2010, 9, 31. [Google Scholar] [CrossRef] [PubMed]
- Vlaanderen, J.; Lan, Q.; Kromhout, H.; Rothman, N.; Vermeulen, R. Occupational benzene exposure and the risk of chronic myeloid leukemia: A meta-analysis of cohort studies incorporating study quality dimensions. Am. J. Ind. Med. 2012, 55, 779–785. [Google Scholar] [CrossRef] [PubMed]
- Infante, P.F. Benzene exposure and multiple myeloma: A detailed meta-analysis of benzene cohort studies. Ann. N. Y. Acad. Sci. 2006, 1076, 90–109. [Google Scholar] [CrossRef] [PubMed]
- Steinmaus, C.; Smith, A.H.; Jones, R.M.; Smith, M.T. Meta-analysis of benzene exposure and non-Hodgkin lymphoma: Biases could mask an important association. Occup. Environ. Med. 2008, 65, 371–378. [Google Scholar] [CrossRef] [PubMed]
- Poli, D.; Mozzoni, P.; Pinelli, S.; Cavallo, D.; Papaleo, B.; Caporossi, L. Sex Difference and Benzene Exposure: Does It Matter? Int. J. Environ. Res. Public Health 2022, 19, 2339. [Google Scholar] [CrossRef]
- Subrahmanyam, V.V.; Ross, D.; Eastmond, D.A.; Smith, M.T. Potential role of free radicals in benzene-induced myelotoxicity and leukemia. Free Radic. Biol. Med. 1991, 11, 495–515. [Google Scholar] [CrossRef]
- Zhou, Y.; Wang, K.; Wang, B.; Pu, Y.; Zhang, J. Occupational benzene exposure and the risk of genetic damage: A systematic review and meta-analysis. BMC Public Health 2020, 20, 1113. [Google Scholar] [CrossRef]
- Scholten, B.; Vlaanderen, J.; Stierum, R.; Portengen, L.; Rothman, N.; Lan, Q.; Pronk, A.; Vermeulen, R.A. A quantitative meta-analysis of the relation between occupational benzene exposure and biomarkers of cytogenetic damage. Environ. Health Perspect. 2020, 128, 87004. [Google Scholar] [CrossRef] [PubMed]
- Powley, M.W.; Carlson, G.P. Benzene metabolism by the isolated perfused lung. Inhal. Toxicol. 2002, 14, 569–584. [Google Scholar] [CrossRef] [PubMed]
- Liao, Q.; Zhang, Y.; Ma, R.; Zhang, Z.; Ji, P.; Xiao, M.; Du, R.; Liu, X.; Cui, Y.; Xing, X.; et al. Risk assessment and dose-effect of co-exposure to benzene, toluene, ethylbenzene, xylene, and styrene (BTEXS) on pulmonary function: A cross-sectional study. Environ. Pollut. 2022, 310, 119894. [Google Scholar] [CrossRef] [PubMed]


| First Author, Year Location Reference | Study Design, Name and Population Cases/Controls Incident Cases Dead Age Follow-Up | Assessment of Exposure | Types of Lung Cancer Incidence/ Mortality | Benzene Exposure | OR/RR/HR/IRR 1/SMR 2/SIR 3 (95% CI) | Matched or Adjusted Variables |
|---|---|---|---|---|---|---|
| Cheng et al., 2022 USA [23] | Cohort Multiethnic cohort study (MEC) Population: 97,288 Incident cases: 2796 Age: 45–75 years Follow-up: 17 years | Residential exposure Air-monitoring data | All types Incidence | Exposed 1 ppb increment | Men + Women (HR) 1.17 (1.02–1.34) | Age, race/ethnicity, sex, education, marital status, smoking, family history of lung cancer, occupation, socioeconomic status, nonsteroidal anti-inflammatory drugs, body mass index, alcohol, physical activity, energy intake, meat intake. |
| Khorrami et al., 2021 Iran [24] | Descriptive (ecologic, follow-up) Population: 9,134,708 Incident cases: 1653 Age: median 65.5 years Follow-up: 3 years | Residential exposure Land use regression models | All types Incidence | Exposed 10 µg/m3 increment | Men + Women (IRR) 3.86 (1.55–9.60) | Age, sex, socioeconomic status, life expectancy, smoking prevalence |
| Warden et al., 2018 Canada [25] | Population based case–control (Male) Cases: 894 Age: 64.2 ± 7.8 years Controls: 733 Age: 65.0 ± 7.6 years | Occupational exposure Interview: lifestyle and job features | All types | Men (OR) | Age, smoking (CSI: cumulative smoking index), respondent status, ethnolinguistic group, years of education, median household income as well as Groups 1 and 2A occupational carcinogens: diesel engine emissions, crystalline silica, coke dust, coal dust, and welding fumes. | |
| Incidence | Unexposed | 1.00 (Ref.) | ||||
| Ever exposed | 1.35 (0.99–1.84) | |||||
| Adenocarcinoma | Unexposed | 1.00 (Ref.) | ||||
| Ever exposed | 1.35 (0.90–2.02) | |||||
| Squamous carcinoma | Unexposed | 1.00 (Ref.) | ||||
| Ever exposed | 1.36 (0.92–2.00) | |||||
| Small cell carcinoma | Unexposed | 1.00 (Ref.) | ||||
| Ever exposed | 1.51 (0.88–2.56) | |||||
| Collarile et al., 2017 Italy [26] | Descriptive (follow-up) Incident cases: 801 men 275 women All age Follow-up: 15 years | Residential exposure Integrated approach based on punctual observations (local environmental monitoring systems) and numerical simulated fields | All types Incidence | µg/m3 | Men (IRR) | None |
| <1.1 | 1.00 (Ref.) | |||||
| 1.1–1.8 | 1.03 (0.87–1.22) | |||||
| >1.8 | 1.02 (0.86–1.21) | |||||
| Women (IRR) | ||||||
| <1.1 | 1.00 (Ref.) | |||||
| 1.1–1.8 | 1.09 (0.81–1.46) | |||||
| >1.8 | 1.12 (0.83–1.52) | |||||
| Mattei et al., 2016 France [27] | Population based case–control (Male) ICARE 4 study Cases: 2260 Age: 60 ± 9.1 years Controls: 2780 Age: 58 ± 79.9 years | Occupational exposure Interview: lifestyle behaviours and job features Job-exposure matrices (JEM) | All types Incidence | Men (OR) | Age, exposure to asbestos (CEI: Cumulative Exposure Index), smoking (CSI: Comprehensive Smoking Index) | |
| Unexposed | 1.00 (Ref.) | |||||
| Low | 1.29 (0.92–1.80) | |||||
| Medium | 1.14 (0.80–1.60) | |||||
| High | 0.97 (0.70–1.35) | |||||
| Linet et al., 2015 China [28] | Retrospective cohort 73,789 exposed Dead: 351 35,504 unexposed Dead: 119 Follow-up: 28 years Age > 12 y at start of first exposure | Occupational exposure Factory and job title-specific information on use of benzene containing materials | All types Mortality | Men (RR) | Age, sex, attained calendar year | |
| Unexposed | 1.00 (Ref.) | |||||
| Exposed | 1.5 (1.2–1.9) | |||||
| Woman (RR) | ||||||
| Unexposed | 1.00 (Ref.) | |||||
| Exposed | 1.5 (0.9–2.5) | |||||
| Collins et al., 2015 USA [29] | Retrospective cohort 2266 workers Dead: 146 Follow-up: >30 years | Occupational exposure Job-specific exposures | All types Mortality | Cumulative: ≥25 ppm per year | Men + Women (SMR) 1.05 (0.89–1.24) | None |
| Yuan et al., 2014 China [30] | Nested case–control Shanghai Cohort Study Cases: 82 Age: 58.1 ± 5.2 years Controls: 83 Age: 58.0 ± 5.4 years Lifelong never smokers | Exposure biomarker (S-phenyl mercapturic acid) in urine | All types Incidence | Men (OR) | Age at baseline, neighbourhood of residence at enrolment, years of sample storage, urinary cotinine level Never smokers | |
| Quartile 1 | 1.00 | |||||
| Quartile 2 | 1.03 (0.39–2.69) | |||||
| Quartile 3 | 1.10 (0.44–2.78) | |||||
| Quartile 4 | 1.57 (0.65–3.80) | |||||
| Koh et al., 2014 Korea [31] | Retrospective cohort 14,698 male Incident cases: 5 Death: 9 Age: 20–72 years Follow-up: 4–6 years | Occupational exposure Workers of refinery/petrochemical complex | All types Incidence Mortality | Exposed | Men (SIR) 0.73 (0.24–1.71) Men (SMR) 0.68 (0.31–1.29) | None |
| Villeneuve et al., 2014 Canada [32] | Case–control Cases: 445 Age: median 66 years Controls: 948 Hospital: 523, 50 years Population: 425 59 years | Residential exposure Land use regression model Interview: lifestyle behaviours | All types Incidence | Interquartile-Range Increase 0.15 μg/m3 | Men + Woman (OR) Population controls 1.84 (1.26–2.68) | Age, sex, pack-years of smoking, exposure to second-hand smoke, body mass index, family history of cancer, and neighbourhood measures of unemployment and median family income |
| Villeneuve et al., 2013 Canada [33] | Cohort “Ontario Tax Cohort study” 29,600 men 29,150 women Dead: 1410 Age: >35 years Follow-up: 22 years | Residential exposure Land use regression model | All types Mortality | Interquartile-Range increase 0.13 μg/m3 | Men + Women (RR) 1.05 (0.96–1.14) | Age, sex, family income, marital status, census area measures of income, immigration, unemployment, land use regression estimate of NO2. Indirect adjustment for smoking and body mass index. |
| Yuan et al., 2012 China [34] | Nested case–control Shanghai Cohort Study Cases: 343 Age: 69.4 ± 6.3 years Controls: 392 Age: 69.1 ± 6.0 years All Smokers | Exposure biomarkers (S-phenyl mercapturic acid) in urine | All types Incidence | Men (OR) | Age, neighbourhood of residence, and duration of biospecimen storage before laboratory analysis, number of cigarettes smoked per day, and number of years of smoking at baseline | |
| Quartile 1 | 1.00 | |||||
| Quartile 2 | 1.46 (0.91–2.35) | |||||
| Quartile 3 | 1.94 (1.23–3.07) | |||||
| Quartile 4 | 1.80 (1.14–2.85) | |||||
| Koh et al., 2011 Korea [35] | Retrospective cohort 8866 male Incident cases: 8 Dead: 5 Follow-up: Mortality 16 years Incidence 9 years Age: 20–74 y | Occupational exposure Work history in refinery and petrochemical companies | All types Incidence Mortality | Exposed | Men (SIR) 0.60 (0.26–1.17) Men (SMR) 0.35 (0.11–0.83) | None |
| McHugh et al., 2010 USA [36] | Case–control Mexican-Americans Cases: 38 Age: 63.8 ± 11.0 years Controls: 51 Age: 61.5 ± 12.8 years | Occupational exposure Self-reported responses | All types Incidence | Men + Women (OR) | Age, sex, and smoking | |
| Unexposed | 1.00 (Ref.) | |||||
| Exposed | 1.13 (0.69–1.86) | |||||
| Sorahan et al., 2005 UK [37] | Cohort 4740/5130 Men 352/384 Women Incident cases: 293 Death: 294 Follow-up: 30 years | Occupational exposure Type of industry | All types Incidence Mortality | Exposed ≥ 25 ppm | Men + Women (IRR) 1.19 (1.06–1.34) Men + Women (SMR) 1.21 (1.07–1.35) | None |
| Collins et al., 2003 USA [38] | Retrospective cohort 4417 workers Dead: 252 Follow-up: >30 years | Occupational exposure Job type at the different plants | All types Mortality | >100 ppm per day | Men + Women (SMR) 1.6 (1.1–2.3) | None |
| Gerin et al., 1998 Canada [39] | Population-based case–control (Men) Cases: 857 Controls: 1349 Age: 35–70 years | Occupational exposure Interview: lifestyle behaviours and job features | All types | Men (OR) | Age, family income, ethnic group, cigarette smoking, respondent status, arsenic, asbestos, chromium VI, nickel, crystalline silica, beryllium, cadmium, polycyclic aromatic hydrocarbons | |
| Incidence | Unexposed | 1.00 (Ref.) | ||||
| Low | 1.1 (0.8–1.5) | |||||
| Medium | 0.8 (0.5–1.3) | |||||
| High | 0.7 (0.3–1.7) | |||||
| Adenocarcinoma | Unexposed | 1.00 (Ref.) | ||||
| Low | 1.1 (0.6–1.8) | |||||
| Medium/High | 0.9 (0.4–1.9) | |||||
| Squamous carcinoma | Unexposed | 1.00 (Ref.) | ||||
| Low | 1.3 (0.9–1.9) | |||||
| Medium/High | 1.2 (0.7–2.1) | |||||
| Small cell carcinoma | Unexposed | 1.00 (Ref.) | ||||
| Low | 1.10 (0.6–1.9) | |||||
| Medium/High | 0.30 (0.1–0.9) | |||||
| Yin et al., 1996 China [40] | Cohort Men and woman Exposed: 74,828 38,833 men 35,995 women Follow-up: 10.5 years Unexposed: 35,805 20,795 men 15,010 women Follow-up: 11.7 years Dead: 125 | Occupational exposure Type of industry | All types Mortality | Men (RR) | Age | |
| Unexposed | 1.00 (Ref.) | |||||
| Exposed | 1.50 (1.0–2.2) | |||||
| Women (RR) | ||||||
| Unexposed | 1.00 (Ref.) | |||||
| Exposed | 1.00 (0.4–2.9) | |||||
| Greenland et al., 1994 USA [41] | Case–control Case: 139 lung cancer death Control: 1202 non-cancer death Age: 21–90 years | Occupational exposure Job history records | All types Mortality | Men (RR) | None | |
| Unexposed | 1.00 (Ref.) | |||||
| Exposed | 0.58 (0.31–1.07) | |||||
| Wong 1987 USA [42] | Historical prospective 7676 Men Dead: 47 Follow-up: 32 years | Occupational exposure Chemical workers | All types Mortality | Exposed | Men (SMR) 1.12 (0.90–1.39) | Age, race, sex, calendar time |
| Tsai et al., 1983 USA [43] | Retrospective cohort 454 Men Dead: 2 Age: average at entry 33.8 years Follow-up: 13 years | Occupational exposure Workers in benzene processes or operations | All types Mortality | Exposed 1.34 ± 1.39 ppm | Men (SMR) 0.52 (0.06–1.86) | None |
| Combined Risk Estimate | Test of Heterogeneity | Publication Bias | |||||
|---|---|---|---|---|---|---|---|
| Value (95% CI) | p | Q | I2 % | p | p (Egger Test) | p (Begg Test) | |
| ALL (n = 27) 2 | 1.17 (1.08–1.28) | <0.001 | 56.79 | 54.22 | 0.0004 | 0.906 | 0.574 |
| Smoking | |||||||
| Adjusted (n = 10) | 1.26 (1.08–1.48) | 0.005 | 24.02 | 62.81 | 0.004 | 0.077 | 0.245 |
| Not adjusted (n = 17) | 1.13 (1.02–1.26) | 0.021 | 32.20 | 50.31 | 0.009 | 0.105 | 0.161 |
| Exposure | |||||||
| Residential (n = 6) | 1.19 (1.02–1.39) | 0.030 | 17.10 | 70.76 | 0.004 | 0.051 | 0.091 |
| Occupational (n = 19) | 1.14 (1.03–1.27) | 0.015 | 33.16 | 45.71 | 0.016 | 0.052 | 0.086 |
| Others: biomarkers (n = 2) | 1.75 (1.16–2.63) | 0.007 | 0.07 | 0.00 | 0.788 | --- | --- |
| Sex | |||||||
| Men (n = 15) | 1.07 (0.90–1.28) | 0.428 | 32.81 | 57.34 | 0.003 | 0.136 | 0.299 |
| Women (n = 3) | 1.19 (0.93–1.54) | 0.168 | 1.06 | 0.00 | 0.588 | 0.900 | 0.602 |
| Men and Women (n = 9) | 1.20 (1.08–1.34) | 0.001 | 22.75 | 64.84 | 0.004 | 0.029 | 0.144 |
| Study design | |||||||
| Case Control (n = 8) | 1.21 (0.93–1.57) | 0.159 | 17.03 | 58.89 | 0.017 | 0.498 | 0.458 |
| Cohort (n = 19) | 1.15 (1.06–1.26) | 0.001 | 38.43 | 53.16 | 0.003 | 0.970 | 0.506 |
| Continent | |||||||
| North America (n = 11) | 1.15 (1.02–1.29) | 0.022 | 21.18 | 52.79 | 0.020 | 0.772 | 0.938 |
| Asia (n = 11) | 1.23 (0.92–1.63) | 0.157 | 24.64 | 59.42 | 0.006 | 0.179 | 0.073 |
| Europe (n = 5) | 1.15 (1.07–1.24) | <0.001 | 4.02 | 0.48 | 0.403 | 0.178 | 0.142 |
| INCIDENCE (n = 14) | 1.20 (1.05–1.37) | 0.007 | 28.38 | 54.19 | 0.008 | 0.799 | 0.784 |
| Smoking | |||||||
| Adjusted (n = 9) | 1.34 (1.10–1.64) | 0.005 | 17.90 | 55.31 | 0.022 | 0.282 | 0.297 |
| Not adjusted (n = 5) | 1.06 (0.89–1.27) | 0.494 | 8.00 | 49.98 | 0.092 | 0.096 | 0.142 |
| Exposure | |||||||
| Residential (n = 5) | 1.28 (1.02–1.61) | 0.031 | 14.66 | 72.72 | 0.005 | 0.114 | 0.142 |
| Occupational (n = 7) | 1.08 (0.89–1.30) | 0.460 | 9.80 | 38.75 | 0.134 | 0.067 | 0.051 |
| Others: biomarkers (n = 2) | 1.75 (1.16–2.63) | 0.007 | 0.07 | 0.00 | 0.788 | --- | --- |
| Sex | |||||||
| Men (n = 8) | 1.09 (0.86–1.38) | 0.492 | 14.64 | 52.20 | 0.041 | 0.719 | 0.458 |
| Women (n = 1) | |||||||
| Men and Women (n = 5) | 1.32 (1.09–1.60) | 0.005 | 11.31 | 64.64 | 0.023 | 0.125 | 0.142 |
| Study design | |||||||
| Case Control (n = 7) | 1.32 (1.05–1.66) | 0.019 | 10.72 | 44.02 | 0.097 | 0.850 | 0.881 |
| Cohort (n = 7) | 1.12 (0.96–1.32) | 0.147 | 15.21 | 60.54 | 0.019 | 0.743 | 0.176 |
| Continent | |||||||
| North America (n = 5) | 1.28 (1.04–1.56) | 0.018 | 6.97 | 42.64 | 0.137 | 0.864 | 1.000 |
| Asia (n = 5) | 1.29 (0.64–2.59) | 0.481 | 14.78 | 72.93 | 0.005 | 0.481 | 0.142 |
| Europe (n = 4) | 1.12 (1.02–1.22) | 0.013 | 2.92 | 0.00 | 0.405 | 0.348 | 0.497 |
| MORTALITY (n = 13) | 1.15 (1.02–1.30) | 0.023 | 27.62 | 56.55 | 0.006 | 0.838 | 0.542 |
| Smoking | |||||||
| Adjusted (n = 1) | |||||||
| Not adjusted (n = 12) | 1.17 (1.01–1.35) | 0.037 | 23.11 | 52.41 | 0.017 | 0.314 | 0.273 |
| Exposure | |||||||
| Residential (n = 1) | |||||||
| Occupational (n = 12) | 1.17 (1.01–1.35) | 0.037 | 23.11 | 52.41 | 0.017 | 0.314 | 0.273 |
| Others: biomarkers (n = 0) | |||||||
| Sex | |||||||
| Men (n = 7) | 1.03 (0.77–1.37) | 0.867 | 17.14 | 64.99 | 0.009 | 0.079 | 0.293 |
| Women (n = 2) | 1.38 (0.87–2.17) | 0.167 | 0.51 | 0.00 | 0.476 | --- | --- |
| Men and Women (n = 4) | 1.14 (1.00–1.29) | 0.049 | 8.24 | 63.61 | 0.041 | 0.420 | 0.174 |
| Study design | |||||||
| Case Control (n = 1) | |||||||
| Cohort (n = 12) | 1.17 (1.05–1.32) | 0.006 | 23.18 | 52.55 | 0.017 | 0.818 | 0.583 |
| Continent | |||||||
| North America (n = 6) | 1.07 (0.93–1.24) | 0.343 | 9.54 | 47.58 | 0.089 | 0.796 | 0.573 |
| Asia (n = 6) | 1.21 (0.91–1.61) | 0.199 | 9.62 | 48.02 | 0.087 | 0.073 | 0.039 |
| Europe (n = 1) | |||||||
Disclaimer/Publisher’s Note: The statements, opinions and data contained in all publications are solely those of the individual author(s) and contributor(s) and not of MDPI and/or the editor(s). MDPI and/or the editor(s) disclaim responsibility for any injury to people or property resulting from any ideas, methods, instructions or products referred to in the content. |
© 2024 by the authors. Licensee MDPI, Basel, Switzerland. This article is an open access article distributed under the terms and conditions of the Creative Commons Attribution (CC BY) license (https://creativecommons.org/licenses/by/4.0/).
Share and Cite
Chiavarini, M.; Rosignoli, P.; Sorbara, B.; Giacchetta, I.; Fabiani, R. Benzene Exposure and Lung Cancer Risk: A Systematic Review and Meta-Analysis of Human Studies. Int. J. Environ. Res. Public Health 2024, 21, 205. https://doi.org/10.3390/ijerph21020205
Chiavarini M, Rosignoli P, Sorbara B, Giacchetta I, Fabiani R. Benzene Exposure and Lung Cancer Risk: A Systematic Review and Meta-Analysis of Human Studies. International Journal of Environmental Research and Public Health. 2024; 21(2):205. https://doi.org/10.3390/ijerph21020205
Chicago/Turabian StyleChiavarini, Manuela, Patrizia Rosignoli, Beatrice Sorbara, Irene Giacchetta, and Roberto Fabiani. 2024. "Benzene Exposure and Lung Cancer Risk: A Systematic Review and Meta-Analysis of Human Studies" International Journal of Environmental Research and Public Health 21, no. 2: 205. https://doi.org/10.3390/ijerph21020205
APA StyleChiavarini, M., Rosignoli, P., Sorbara, B., Giacchetta, I., & Fabiani, R. (2024). Benzene Exposure and Lung Cancer Risk: A Systematic Review and Meta-Analysis of Human Studies. International Journal of Environmental Research and Public Health, 21(2), 205. https://doi.org/10.3390/ijerph21020205