
The Impact of Physical Activity at School on Children’s Body Mass during 2 Years of Observation


Abstract
:1. Introduction
2. Materials and Methods
2.1. Participants
2.2. Research Methodology
2.3. Measurements
2.4. Statistical Analysis
3. Results
3.1. Description of the Group
3.2. Evaluation of the Anthropometric Indicators
3.2.1. Height
3.2.2. Body Weight
3.3. BMI
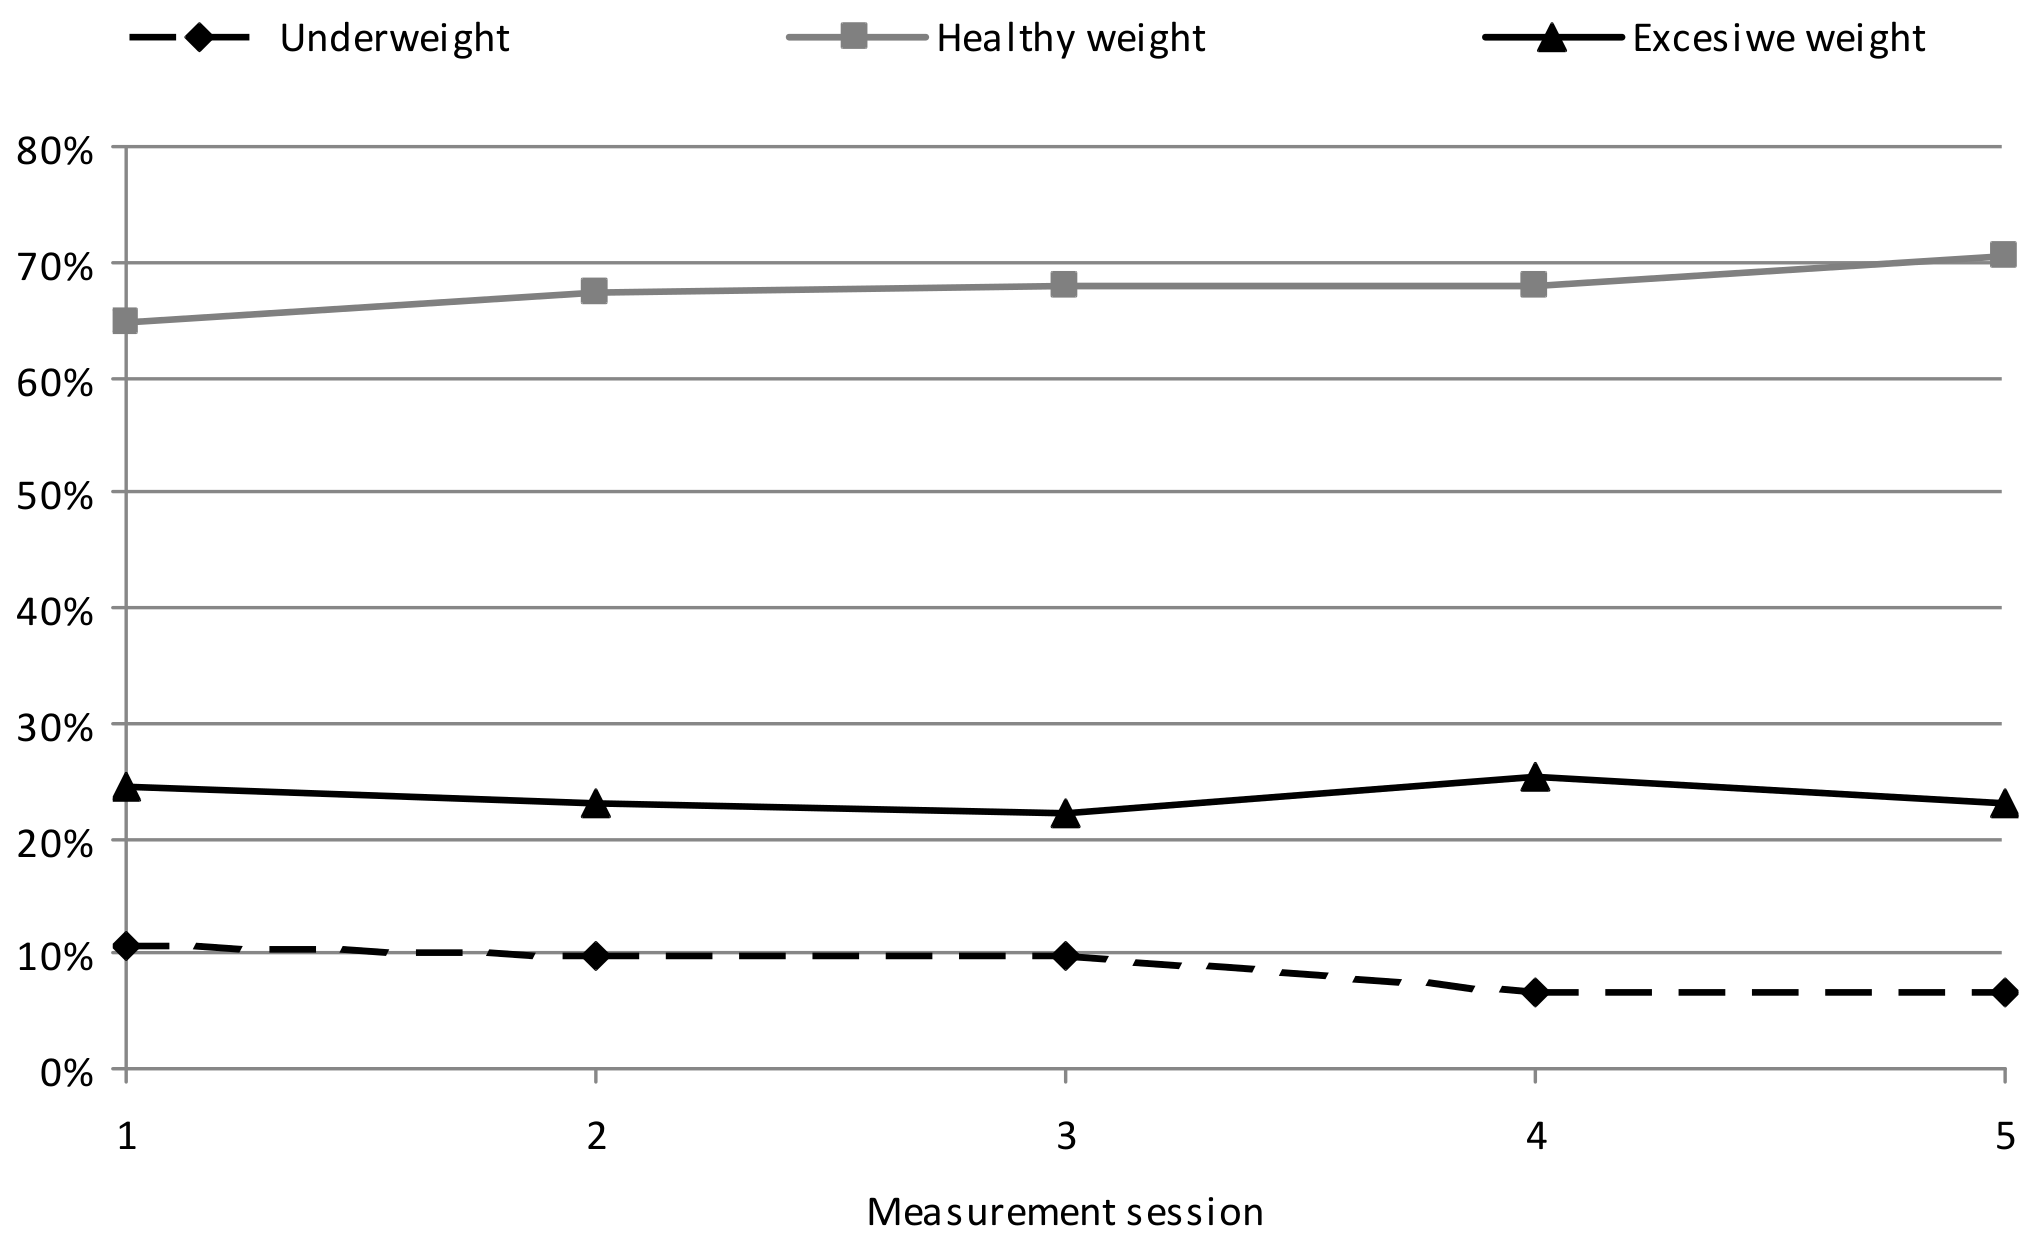
3.4. Analysis of BMI Variability during the Study
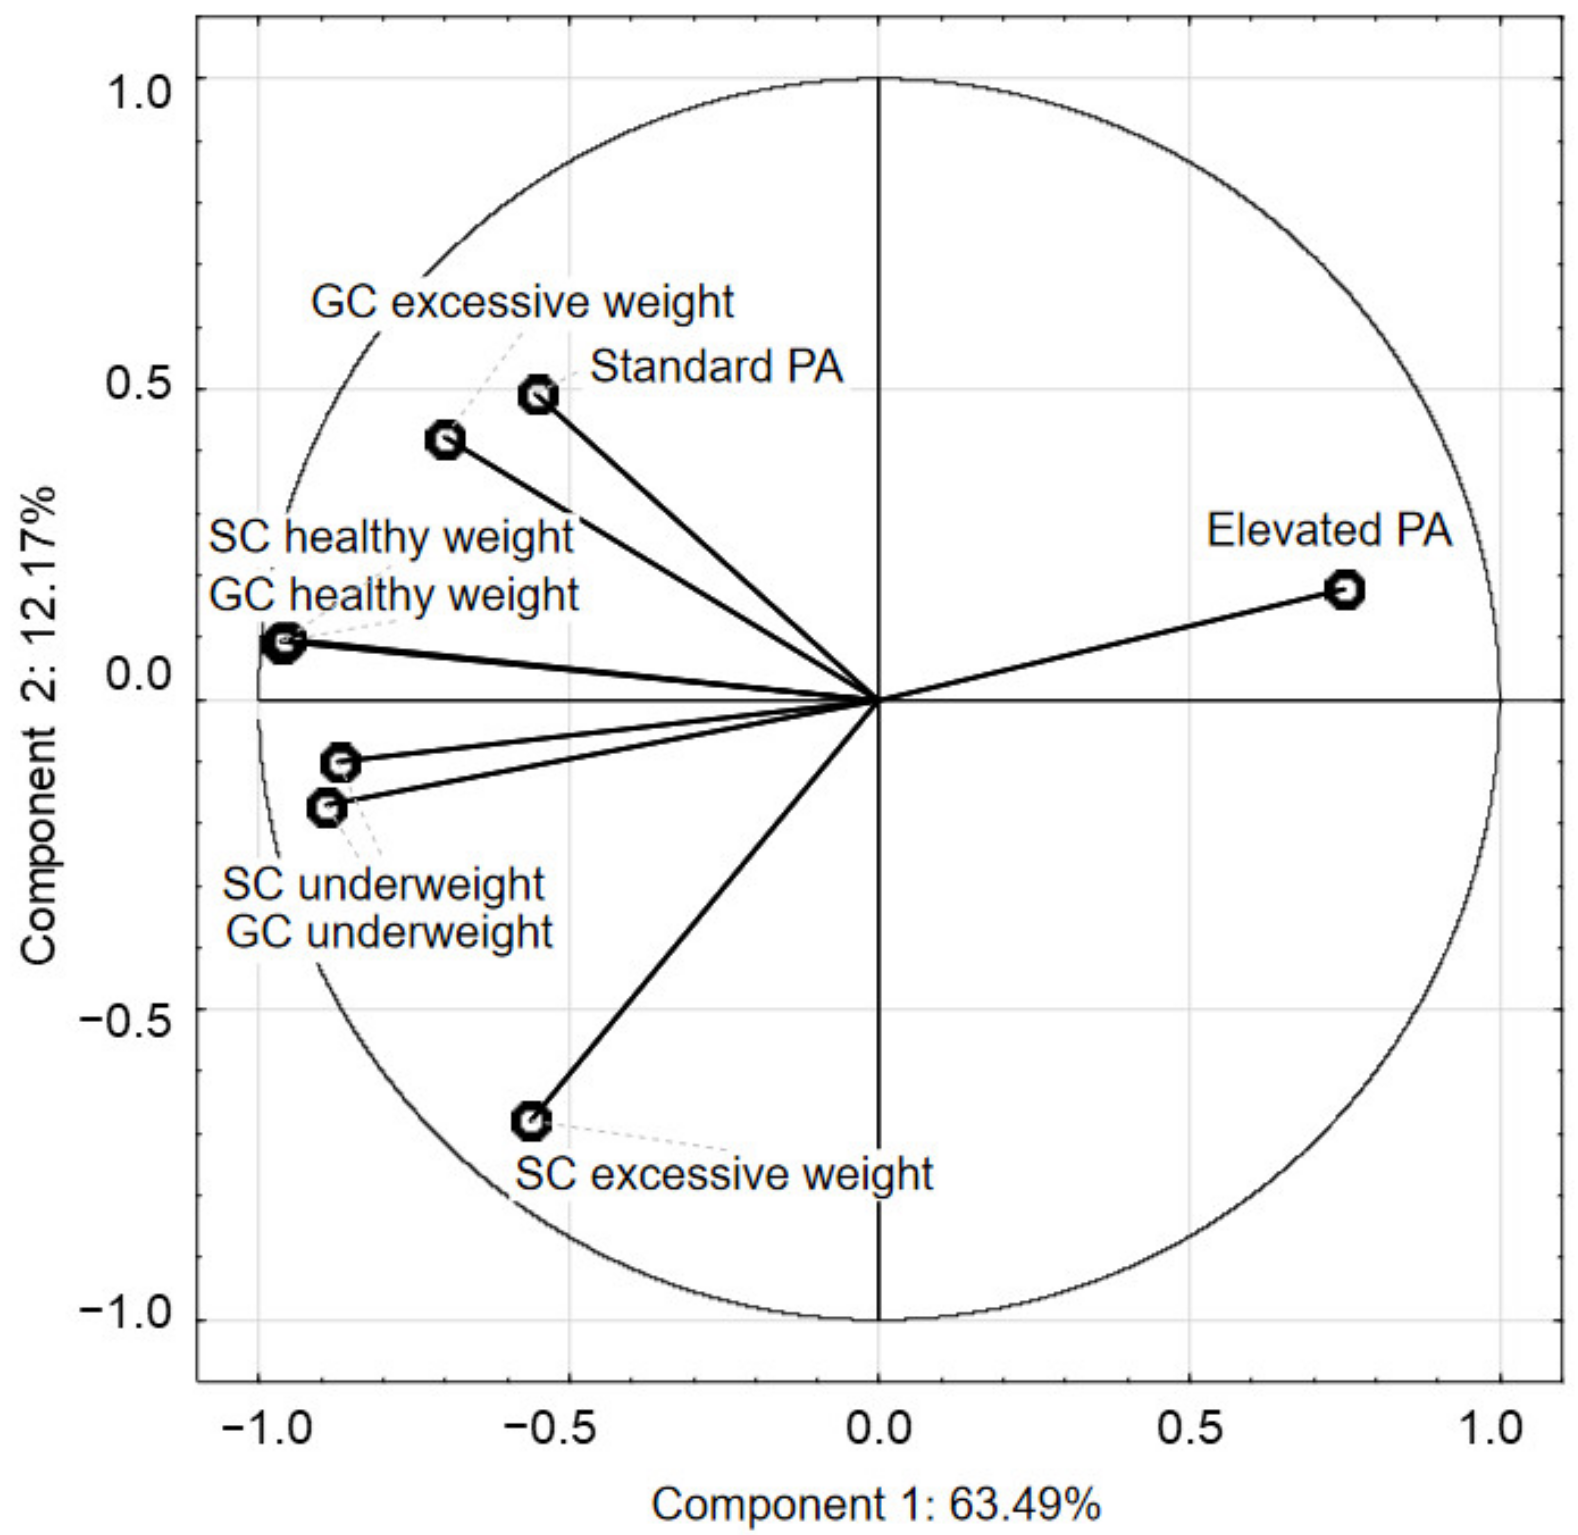
3.5. PCA
4. Discussion
5. Conclusions
Author Contributions
Funding
Institutional Review Board Statement
Informed Consent Statement
Data Availability Statement
Acknowledgments
Conflicts of Interest
References
- Lee, E.Y.; Yoon, K.H. Epidemic obesity in children and adolescents: Risk factors and prevention. Front. Med. 2018, 12, 658–666. [Google Scholar] [CrossRef] [PubMed]
- OECD Obesity Update 2017. Available online: http://www.oecd.org/health/obesity-update.htm (accessed on 19 December 2021).
- Suder, A.; Gomula, A.; Koziel, S. Central overweight and obesity in Polish schoolchildren aged 7–18 years: Secular changes of waist circumference between 1966 and 2012. Eur. J. Pediatr. 2017, 176, 909–916. [Google Scholar] [CrossRef] [PubMed]
- World Health Organization. Obesity and overweight. Available online: https://www.who.int/news-room/fact-sheets/detail/obesity-and-overweight (accessed on 12 December 2021).
- Abarca-Gómez, L.; Abdeen, Z.A.; Hamid, Z.A.; Abu-Rmeileh, N.M.; Acosta-Cazares, B.; Acuin, C.; Adams, R.J.; Aekplakorn, W.; Afsana, K.; Aguilar-Salinas, C.A.; et al. Worldwide trends in body-mass index, underweight, overweight, and obesity from 1975 to 2016: A pooled analysis of 2416 population-based measurement studies in 128·9 million children, adolescents, and adults. Lancet 2017, 390, 2627–2642. [Google Scholar]
- EU Platform on Diet, Physical Activity and Health. Available online: http://ec.europa.eu/health/ph_determinants/life_style/nutrition/documents/iotf_en.pdf (accessed on 4 December 2021).
- World Health Organization. Comprehensive Implementation Plan on Maternal, Infant and Young Child Nutrition. Available online: https://www.who.int/publications/i/item/WHO-NMH-NHD-14.2 (accessed on 3 December 2021).
- Jarosz, M.; Charzewska, J.; Wolnicka, W.; Wajszczyk, B.; Chwojnowska, Z.; Taraszewska, A.; Jaczewska-Schuetz, J. Nutritional status of children and adolescents—Preliminary results the programme KIK/34 “Preventing overweight and obesity” in Swiss-Polish Cooperation Programme. Pol. J. Hum. Nutr. Metab. 2016, 43, 231–238. [Google Scholar]
- Fijałkowska, A.; Oblacińska, A.; Stalmach, M. Nadwaga i Otyłość u Polskich 8-Latków w Świetle Uwarunkowań Biologicznych, Behawioralnych i Społecznych; Institute of Mother and Child: Warsaw, Poland, 2017. [Google Scholar]
- Brzeziński, M.; Jankowski, M.; Jankowska, A.; Niedzielska, A.; Kamińska, B. Is there a rapid increase in prevalence of obesity in Polish children? An 18-year prospective observational study in Gdansk, Poland. Arch. Med. Sci. 2018, 14, 22–29. [Google Scholar] [CrossRef] [Green Version]
- Epstein, L.H.; Roemmich, J.N.; Robinson, J.L.; Paluch, R.A.; Winiewicz, D.D.; Fuerch, J.H.; Robinson, T.N. A Randomized Trial of the Effects of Reducing Television Viewing and Computer Use on Body Mass Index in Young Children. Arch. Pediatr. Adolesc. Med. 2008, 162, 239. [Google Scholar] [CrossRef]
- Wojtyniak, B.; Goryński, P. Health Status of Polish Population and Its Determinants, 2020; National Institute of Public Health: Warsaw, Poland, 2020. [Google Scholar]
- Przednowek, K.H.; Niewczas, M.; Wójcik, Ł.; Paśko, W.; Iskra, J.; Przednowek, K. Physical fitness percentiles of Polish children aged 4–7 years. Sci. Rep. 2021, 11, 7367. [Google Scholar] [CrossRef]
- Messing, S.; Rütten, A.; Abu-Omar, K.; Ungerer-Röhrich, U.; Goodwin, L.; Burlacu, I.; Gediga, G. How Can Physical Activity Be Promoted Among Children and Adolescents? A Systematic Review of Reviews Across Settings. Front. Public Health 2019, 7, 55. [Google Scholar] [CrossRef]
- Hernando-Garijo, A.; Hortigüela-Alcalá, D.; Sánchez-Miguel, P.A.; González-Víllora, S. Fundamental pedagogical aspects for the implementation of models-based practice in physical education. Int. J. Environ. Res. Public Health 2021, 18, 7152. [Google Scholar] [CrossRef]
- Guthold, R.; Stevens, G.A.; Riley, L.M.; Bull, F.C. Global trends in insufficient physical activity among adolescents: A pooled analysis of 298 population-based surveys with 1·6 million participants. Lancet Child Adolesc. Health 2020, 4, 23–35. [Google Scholar] [CrossRef]
- Maszczak, T. Physical condition of school youth in the light of population research. Phys. Act. Health 2017, 12, 63–68. [Google Scholar]
- Zembura, P.; Korcz, A.; Cieśla, E.; Gołdys, A.; Nałȩcz, H. Results from Poland’s 2018 Report Card on Physical Activity for Children and Youth. J. Phys. Act. Health 2018, 15, S395–S397. [Google Scholar] [CrossRef] [PubMed]
- Mazur, J.; Małkowska-Szkutnik, A. Zdrowie Uczniów w 2018 Roku na Tle Nowego Modelu Badań HBSC; Institute of Mother and Child: Warsaw, Poland, 2018. [Google Scholar]
- Ng, A.K.; Hairi, N.N.; Jalaludin, M.Y.; Majid, H.A. Dietary intake, physical activity and muscle strength among adolescents: The Malaysian Health and Adolescents Longitudinal Research Team (MyHeART) study. BMJ Open 2019, 9, e026275. [Google Scholar] [CrossRef] [PubMed] [Green Version]
- Martínez-Gómez, D.; Welk, G.J.; Puertollano, M.A.; del-Campo, J.; Moya, J.M.; Marcos, A.; Veiga, O.L. AFINOS Study Group Associations of physical activity with muscular fitness in adolescents: Physical activity and muscular fitness in adolescents. Scand. J. Med. Sci. Sports 2011, 21, 310–317. [Google Scholar] [CrossRef] [PubMed] [Green Version]
- Jiménez-Pavón, D.; Fernández-Vázquez, A.; Alexy, U.; Pedrero, R.; Cuenca-García, M.; Polito, A.; Vanhelst, J.; Manios, Y.; Kafatos, A.; Molnar, D.; et al. Association of objectively measured physical activity with body components in European adolescents. BMC Public Health 2013, 13, 667. [Google Scholar] [CrossRef] [Green Version]
- Hallal, P.C.; Andersen, L.B.; Bull, F.C.; Guthold, R.; Haskell, W.; Ekelund, U. Global physical activity levels: Surveillance progress, pitfalls, and prospects. Lancet 2012, 380, 247–257. [Google Scholar] [CrossRef]
- Bull, F.C.; Al-Ansari, S.S.; Biddle, S.; Borodulin, K.; Buman, M.P.; Cardon, G.; Carty, C.; Chaput, J.P.; Chastin, S.; Chou, R.; et al. World Health Organization 2020 guidelines on physical activity and sedentary behaviour. Br. J. Sports Med. 2020, 54, 1451–1462. [Google Scholar] [CrossRef]
- World Health Organization. Standards for Healthy Eating, Physical Activity, Sedentary Behaviour and Sleep in Early Childhood Education and Care Settings: A Toolkit. Available online: https://apps.who.int/iris/handle/10665/345926 (accessed on 10 January 2022).
- American Academy of Pediatrics Committee on Public Education. Children, adolescents, and television. Pediatrics 2001, 107, 423–426. [Google Scholar] [CrossRef] [Green Version]
- GMON MDD software. Available online: https://www.gmon.eu/upd_en. (accessed on 7 March 2022).
- Marfell-Jones, M.; Old, T.; Steward, A.; Carter, J.E.L. International Standards for Anthropometric Assessment; ISAK: Palmerston North, New Zealand, 2012. [Google Scholar]
- Tanita Cooperation, Tokio, Japan. Available online: https://tanita.lv/kupit/TANITA_SC240-10/?lang=en. (accessed on 7 March 2022).
- Kułaga, Z.; Litwin, M.; Tkaczyk, M.; Palczewska, I.; Zajączkowska, M.; Zwolińska, D.; Krynicki, T.; Wasilewska, A.; Moczulska, A.; Morawiec-Knysak, A.; et al. Polish 2010 growth references for school-aged children and adolescents. Eur. J. Pediatr. 2011, 170, 599–609. [Google Scholar] [CrossRef] [Green Version]
- Kułaga, Z.; Różdżyńska, A.; Grajda, A. Percentile charts for growth and nutritional status assessment in Polish children and adolescents from birth to 18 year of age. Stand. Med. Pediatr. 2015, 12, 119–135. [Google Scholar]
- Microsoft Excel. Available online: https://www.microsoft.com/pl-pl/microsoft-365/excel (accessed on 4 March 2022).
- StatSoft. Elektroniczny Podręcznik Statystyki. Kraków, 2006. Available online: https://www.statsoft.pl/textbook/stathome.html (accessed on 4 March 2022).
- Brown, T.; Moore, T.H.; Hooper, L.; Gao, Y.; Zayegh, A.; Ijaz, S.; Elwenspoek, M.; Foxen, S.C.; Magee, L.; O’Malley, C.; et al. Interventions for preventing obesity in children. Cochrane Database Syst. Rev. 2019, 23, 001871. [Google Scholar] [CrossRef] [PubMed] [Green Version]
- Vicente-Rodríguez, G.; Benito, P.J.; Casajus, J.A.; Ara, I.; Aznar, S.; Castillo, M.J.; Dorado, C.; González-Agüero, A.; González-Gallego, J.; González-Gross, M.; et al. Physical activity, exercise and sport practice to fight against youth and childhood obesity. Nutr. Hosp. 2016, 33, 1–21. [Google Scholar]
- Weintraub, D.L.; Tirumalai, E.C.; Haydel, K.F.; Fujimoto, M.; Fulton, J.E.; Robinson, T.N. Team sports for overweight children: The Stanford Sports to Prevent Obesity Randomized Trial (SPORT). Arch. Pediatr. Adolesc. Med. 2008, 162, 232–237. [Google Scholar] [CrossRef] [Green Version]
- Piercy, K.L.; Troiano, R.P.; Ballard, R.M.; Carlson, S.A.; Fulton, J.E.; Galuska, D.A.; George, S.M.; Olson, R.D. The Physical Activity Guidelines for Americans. JAMA 2018, 19, 2020–2028. [Google Scholar] [CrossRef] [PubMed]
- Nelson, T.F.; Stovitz, S.D.; Thomas, M.; LaVoi, N.M.; Bauer, K.W.; Neumark-Sztainer, D. Do youth sports prevent pediatric obesity? A systematic review and commentary. Curr. Sport Med. Rep. 2011, 10, 360–370. [Google Scholar] [CrossRef] [PubMed] [Green Version]
- Lee, J.E.; Pope, Z.; Gao, Z. The role of youth sports in promoting children’s physical activity and preventing pediatric obesity: A systematic review. Behav. Med. 2018, 44, 62–76. [Google Scholar] [CrossRef]
- Guagliano, J.; Rosenkranz, R.; Kolt, G. Girls’ physical activity levels during organised sports in Australia. Med. Sci. Sports Exerc. 2013, 45, 116–122. [Google Scholar] [CrossRef]
- Bi, C.; Yang, J.; Sun, J.; Song, Y.; Wu, X.; Zhang, F. Benefits of normal body mass index on physical fitness: A cross-sectional study among children and adolescents in Xinjiang Uyghur Autonomous Region, China. PLoS ONE 2019, 14, e0220863. [Google Scholar] [CrossRef] [Green Version]
- Wirnitzer, K.C.; Drenowatz, C.; Cocca, A.; Tanous, D.R.; Motevalli, M.; Wirnitzer, G.; Schätzer, M.; Ruedl, G.; Kirschner, W. Health behaviors of Austrian secondary level pupils at a glance: First results of the From Science 2 School Study focusing on sports linked to mixed, vegetarian, and vegan diets. Int. J. Environ. Res. Public Health 2021, 18, 12782. [Google Scholar] [CrossRef]
- Hilpert, M.; Brockmeier, K.; Dordel, S.; Koch, B.; Weiß, V.; Ferrari, N.; Tokarski, W.; Graf, C. Sociocultural influence on obesity and lifestyle in children: A study of daily activities, leisure time behavior, motor skills, and eight status. Obes. Facts 2017, 10, 168–178. [Google Scholar] [CrossRef]
- Maier, I.B.; Ozel, Y.; Wagnerberger, S.; Bischoff, S.C.; Bergheim, I. Dietary patterns and leisure time activity of overweight and normal weight children in Germany: Sex-specific differences. Nutr. J. 2013, 12, 14. [Google Scholar] [CrossRef] [PubMed] [Green Version]
- Godakanda, I.; Abeysena, C.; Lokubalasooriya, A. Sedentary behavior during leisure time, physical activity and dietary habits as risk factors of overweight among school children aged 14-15 years: Case control study. BMC Res. Notes 2018, 11, 186. [Google Scholar] [CrossRef] [PubMed] [Green Version]
- Stoś, K.; Rychlik, E.; Woźniak, A.; Ołtarzewski, M.; Wojda, B.; Przygoda, B.; Matczuk, E.; Pietraś, E.; Kłys, W. Krajowe Badanie Sposobu Żywienia i Stanu Odżywienia Populacji Polskiej; National Institute of Public Health: Warsaw, Poland, 2021. [Google Scholar]
- Zhou, B.; Bentham, J.; Di Cesare, M.; Bixby, H.; Danaei, G.; Cowan, M.J.; Paciorek, C.J.; Singh, G.; Hajifathalian, K.; Bennett, J.E.; et al. Worldwide trends in blood pressure from 1975 to 2015: A pooled analysis of 1479 population-based measurement studies with 19·1 million participants. Lancet 2017, 389, 37–55. [Google Scholar] [CrossRef] [Green Version]
- Janssen, X.; Basterfield, L.; Parkinson, K.N.; Pearce, M.S.; Reilly, J.K.; Adamson, A.J.; Reilly, J.J. Non-linear longitudinal associations between moderate-to-vigorous physical activity and adiposity across the adiposity distribution during childhood and adolescence: Gateshead Millennium Study. Int. J. Obes. 2019, 43, 744–750. [Google Scholar] [CrossRef] [Green Version]
- Mann, K.D.; Howe, L.D.; Basterfield, L.; Parkinson, K.N.; Pearce, M.S.; Reilly, J.K.; Adamson, A.J.; Reilly, J.J.; Janssen, X. Longitudinal study of the associations between change in sedentary behavior and change in adiposity during childhood and adolescence: Gateshead Millennium Study. Int. J. Obes. 2017, 41, 1042–1047. [Google Scholar] [CrossRef] [Green Version]
- Tanaka, C.; Janssen, X.; Pearce, M.; Parkinson, K.; Basterfield, L.; Adamson, A.; Reilly, J.J. Bidirectional associations between adiposity, sedentary behavior, and physical activity: A longitudinal study in children. J. Phys. Act. Health 2018, 15, 918–926. [Google Scholar] [CrossRef]
- Hamułka, J.; Wadolowska, L.; Hoffmann, M.; Kowalkowska, J.; Gutkowska, K. Effect of an education program on nutrition knowledge, attitudes toward nutrition, diet quality, lifestyle, and body composition in Polish teenagers—The ABC of Healthy Eating Project: Design, Protocol, and Methodology. Nutrients 2018, 10, 1439. [Google Scholar] [CrossRef] [Green Version]
- Wądołowska, L.; Hamułka, J.; Kowalkowska, J.; Kostecka, M.; Wądołowska, K.; Biezanowska-Kopec, R.; Czarniecka-Skubina, E.; Kozirok, W.; Piotrowska, A. Prudent-active and fast-food-sedentary dietary-lifestyle patterns: The association with adiposity, nutrition knowledge and sociodemographic factors in Polish teenagers—The ABC of Healthy Eating Project. Nutrients 2018, 10, 1988. [Google Scholar] [CrossRef] [Green Version]
- Brophy, S.; Crowley, A.; Mistry, R.; Hill, R.; Choudhury, S.; Thomas, N.E.; Rapport, F. Recommendations to improve physical activity among teenagers—A qualitative study with ethnic minority and European teenagers. BMC Public Health 2011, 11, 412. [Google Scholar] [CrossRef] [Green Version]
- Marques, A.; da Costa, F.C. Levels of physical activity of urban adolescents according to age and gender. Int. J. Sports Sci. 2013, 3, 23–27. [Google Scholar]
- Larson, L.R.; Szczytko, R.; Bowers, E.P.; Stephens, L.E.; Stevenson, K.T.; Floyd, M.F. Outdoor time, screen time, and connection to nature: Troubling trends among rural youth? Environ. Behav. 2018, 51, 966–991. [Google Scholar] [CrossRef]
- Mascherini, G.; Galanti, G.; Massetti, L.; Cala, P.; Modesti, P.A. Growth charts for height, weight, and BMI (6-18 y) for the Tuscany youth sports population. Int. J. Environ. Res. Public Health 2019, 16, 4975. [Google Scholar] [CrossRef] [PubMed] [Green Version]
- Arundell, L.; Salmon, J.; Koorts, H.; Contardo Ayala, A.M.; Timperio, A. Exploring when and how adolescents sit: Cross-sectional analysis of activPAL-measured patterns of daily sitting time, bouts and breaks. BMC Public Health 2019, 19, 653. [Google Scholar] [CrossRef] [PubMed] [Green Version]
- Haidar, A.; Ranjit, N.; Archer, N.; Hoelscher, D.M. Parental and peer social support is associated with healthier physical activity behaviours in adolescents: A cross-sectional analysis of Texas School Physical Activity and Nutrition (TX SPAN) data. BMC Public Health 2019, 19, 640. [Google Scholar] [CrossRef]
- Keke, L.M.; Samouda, H.; Jacobs, J.; di Pompeo, C.; Lemdani, M.; Hubert, H.; Zitouni, D.; Guinhouya, B.C. Body mass index and childhood obesity classification systems: A comparison of the French, International Obesity Task Force (IOTF) and World Health Organization (WHO) references. Epidemiol. Public Health 2015, 63, 173–182. [Google Scholar]
- Kurth, B.M.; Schaffrath Rosario, A. Overweight and obesity in children and adolescents in Germany. Bundesgesundheitsbl 2010, 53, 643–652. [Google Scholar] [CrossRef] [Green Version]
- Carayanni, V.; Vlachopapadopoulou, E.; Koutsouki, D.; Bogdanis, G.C.; Psaltopoulou, T.; Manios, Y.; Karachaliou, F.; Hatzakis, A.; Michalacos, S. Effects of nutrition, and physical activity habits and perceptions of body mass index (BMI) in children aged 12–15 years: A cross-sectional study comparing boys and girls. Children 2021, 8, 277. [Google Scholar] [CrossRef]
- Ługowska, K.; Kolanowski, W.; Trafialek, J. Eating behaviour and physical fitness in 10-year-old children attending general education and sports classes. Int. J. Environ. Res. Public Health 2020, 18, 6467. [Google Scholar] [CrossRef]
- Al-Khudairy, L.; Loveman, E.; Colquitt, J.L.; Mead, E.; Johnson, R.E.; Fraser, H.; Olajide, J.; Murphy, M.; Velho, R.M.; O’Malley, C.; et al. Diet, physical activity and behavioural interventions for the treatment of overweight or obese adolescents aged 12 to 17 years. Cochrane Database Syst. Rev. 2017, 6, 012691. [Google Scholar] [CrossRef] [Green Version]


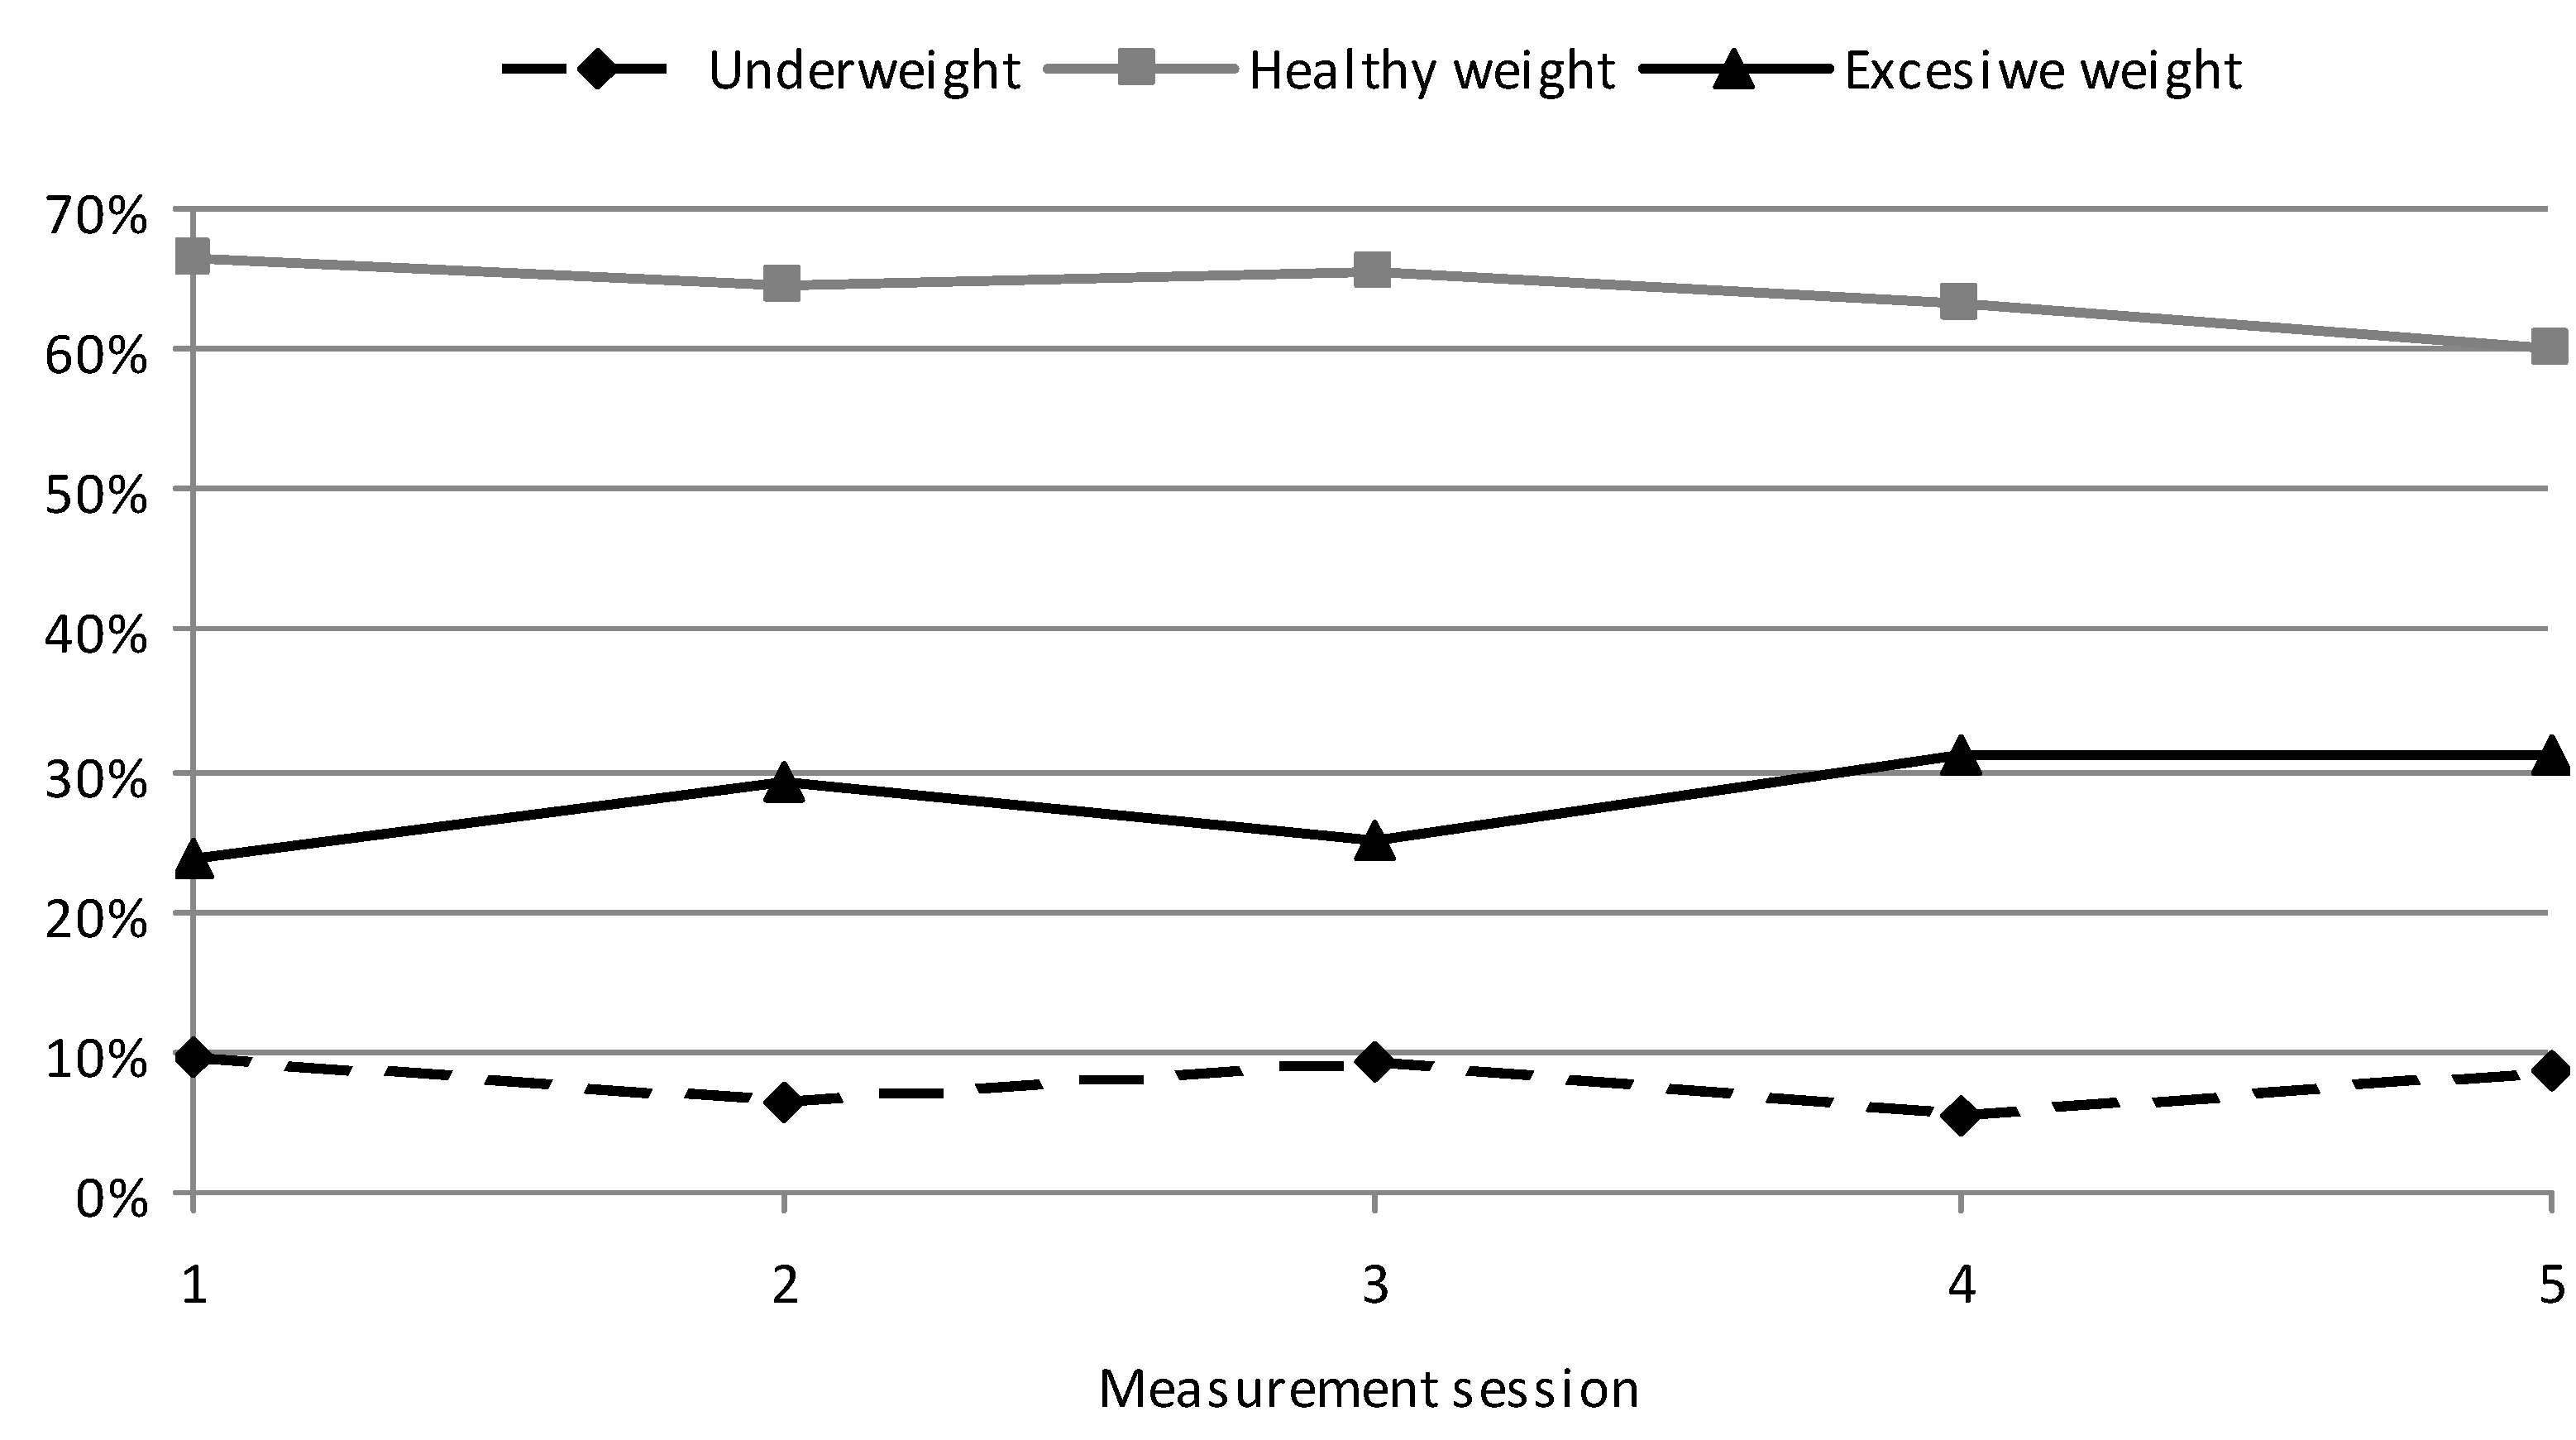
| Variables | Measurement Session | |||||||||
|---|---|---|---|---|---|---|---|---|---|---|
| I | II | III | IV | V | ||||||
| Average age (years) | 10.27 | 10.90 | 11.27 | 11.90 | 12.26 | |||||
| Class type | GC | SC | GC | SC | GC | SC | GC | SC | GC | SC |
| Underweight | 9.69 | 10.66 | 6.30 | 9.83 | 9.45 | 9.84 | 5.54 | 6.55 | 8.81 | 6.55 |
| Healthy weight | 66.55 | 64.75 | 64.39 | 67.22 | 65.39 | 68.03 | 63.40 | 68,04 | 60.01 | 70.51 |
| Overweight | 13.31 | 17.22 | 18.86 | 13.94 | 15.59 | 15.57 | 22.01 | 14.75 | 24.76 | 14.76 |
| Obesity | 10.45 | 7.37 | 10.45 | 9.01 | 9.57 | 6.56 | 9.05 | 10.66 | 6.42 | 8.19 |
| Variables | Measurement Session | |||||||||
|---|---|---|---|---|---|---|---|---|---|---|
| I | II | III | IV | V | ||||||
| Average age (years) | 10.27 | 10.90 | 11.27 | 11.90 | 12.26 | |||||
| Class type | GC | SC | GC | SC | GC | SC | GC | SC | GC | SC |
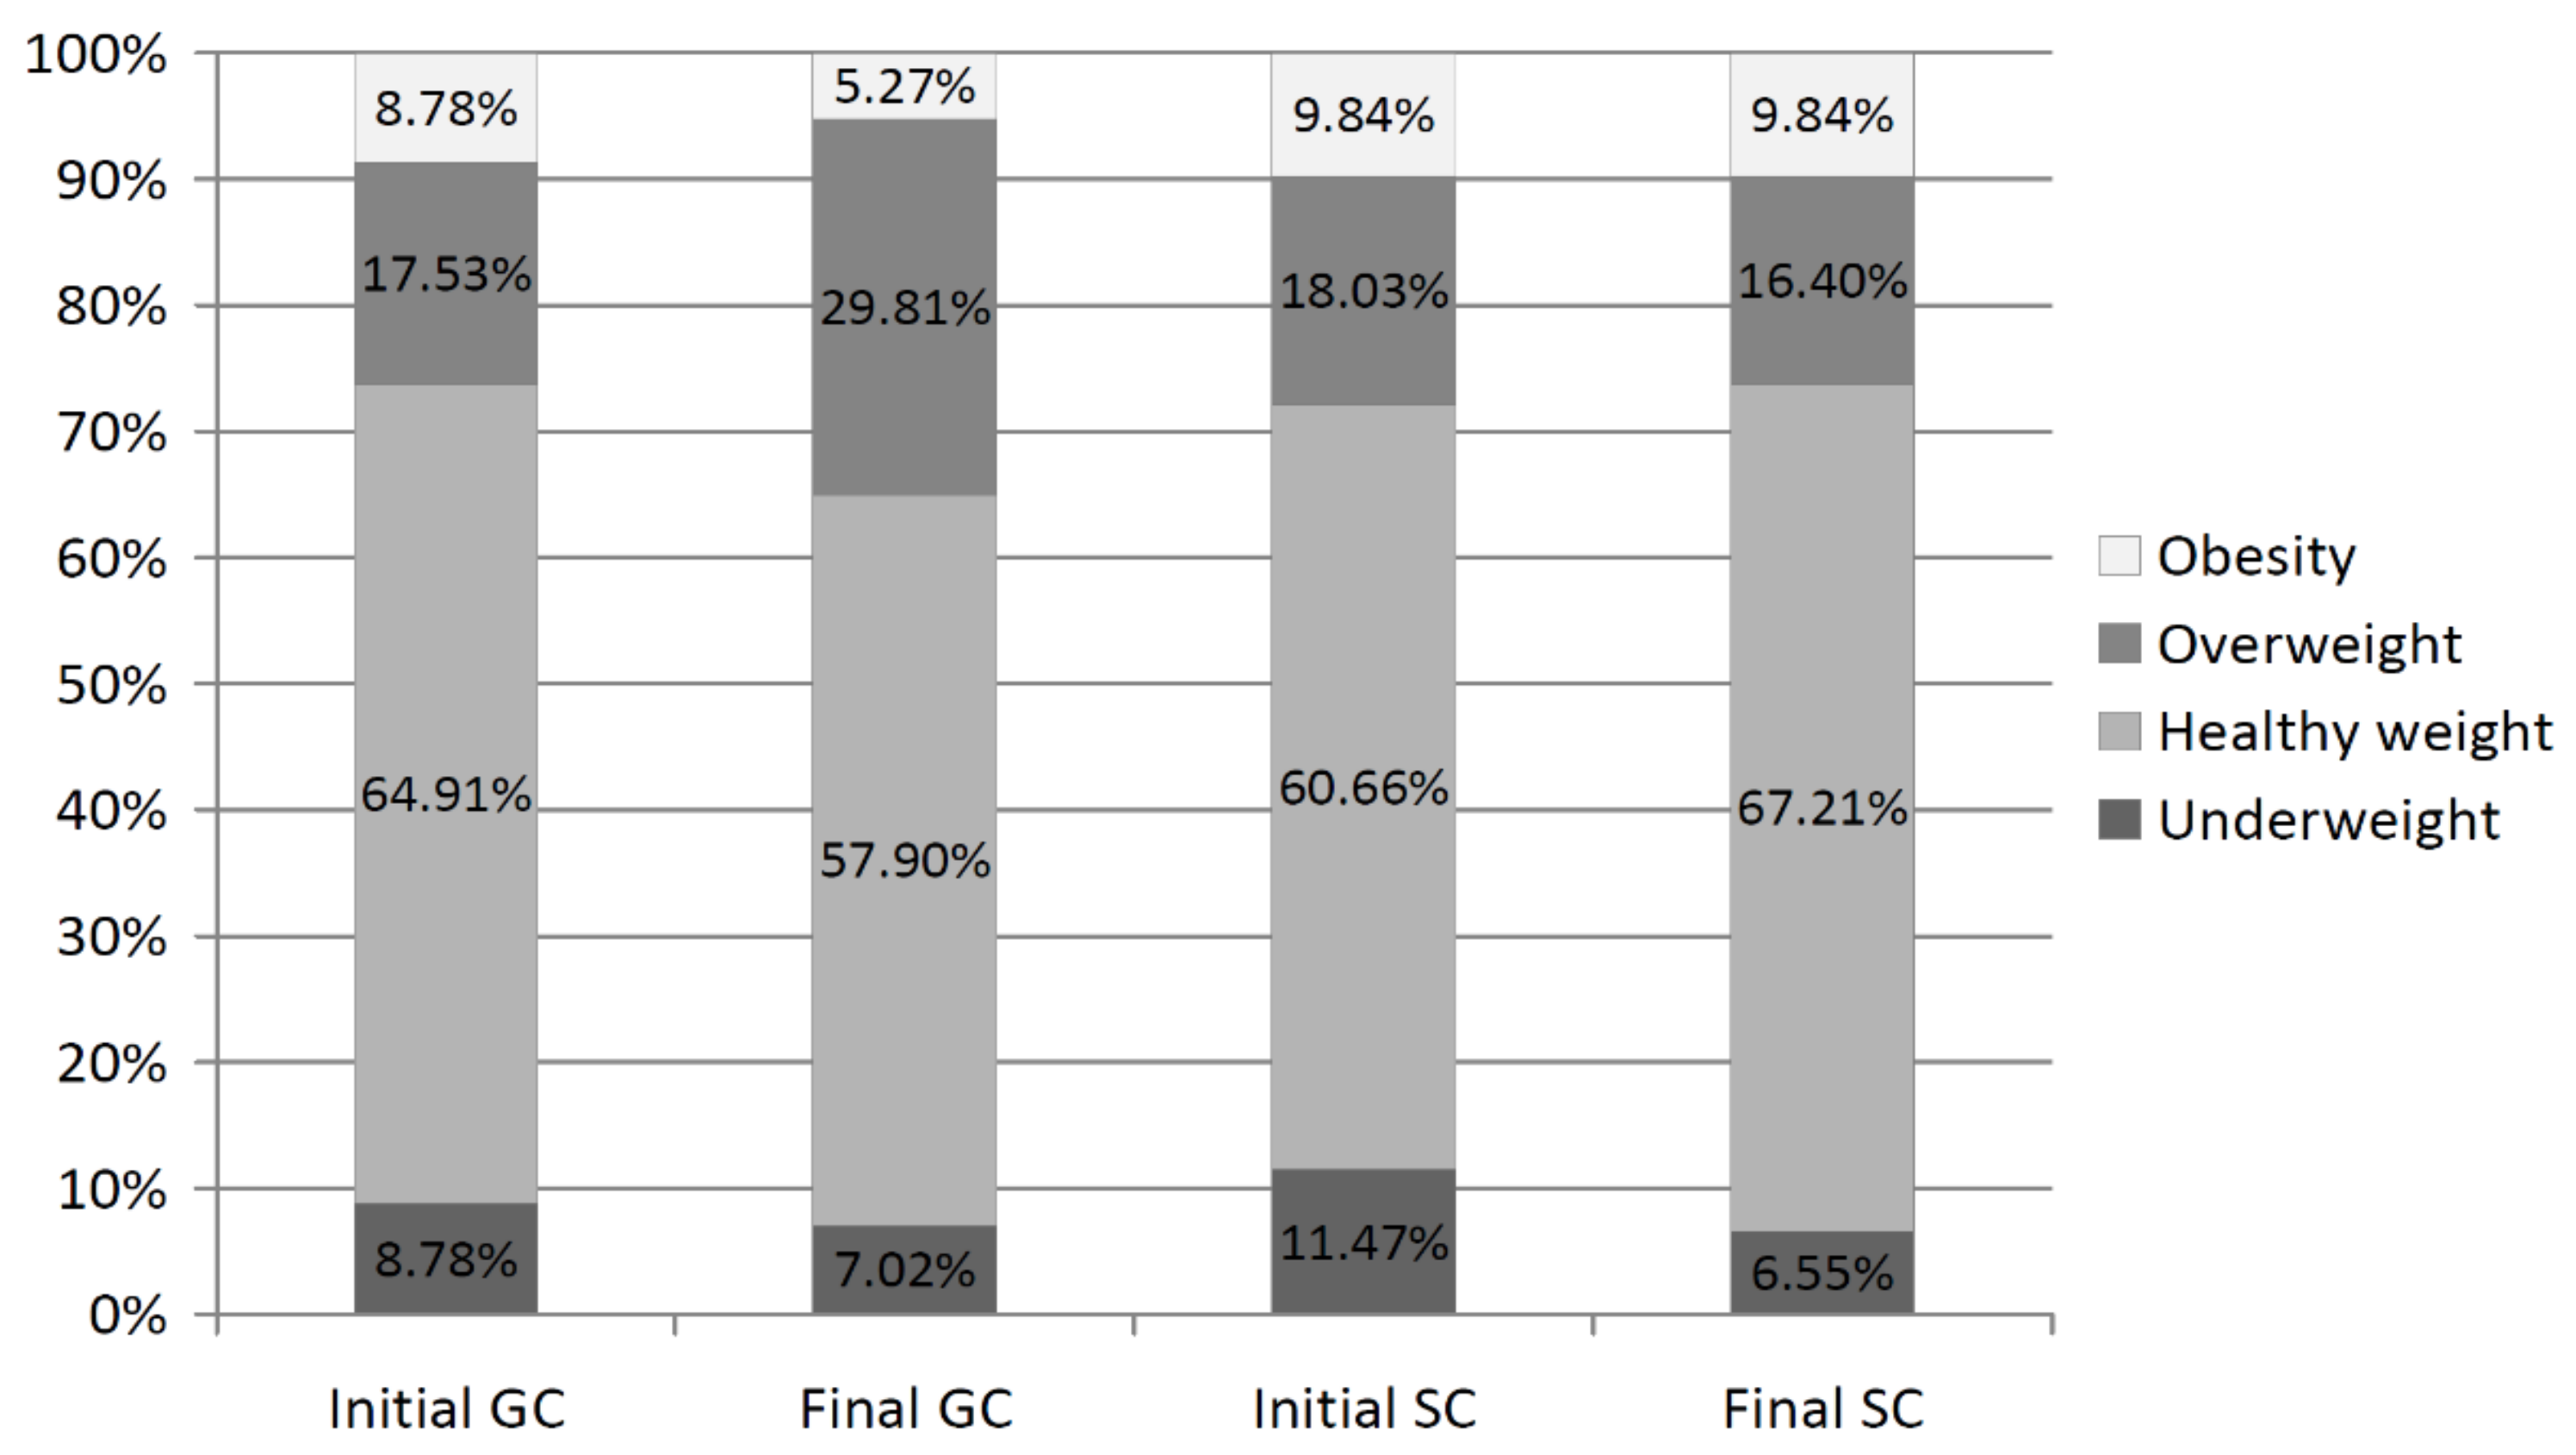
| Underweight | 8.78 | 11.47 | 3.50 | 11.47 | 5.26 | 9.84 | 3.51 | 6.55 | 7.02 | 6.55 |
| Healthy weight | 64.91 | 60.66 | 66.67 | 62.31 | 70.18 | 67.21 | 63.16 | 65.57 | 57.90 | 67.21 |
| Overweight | 17.53 | 18.03 | 21.05 | 14.75 | 17.54 | 14.75 | 22.81 | 16.40 | 29.81 | 16.40 |
| Obesity | 8.78 | 9.84 | 8.78 | 11.47 | 7.02 | 8.20 | 10.52 | 11.48 | 5.27 | 9.84 |
| Variables | Measurement Session | |||||||||
|---|---|---|---|---|---|---|---|---|---|---|
| I | II | III | IV | V | ||||||
| Average age (years) | 10.27 | 10.90 | 11.27 | 11.90 | 12.26 | |||||
| Class type | GC | SC | GC | SC | GC | SC | GC | SC | GC | SC |
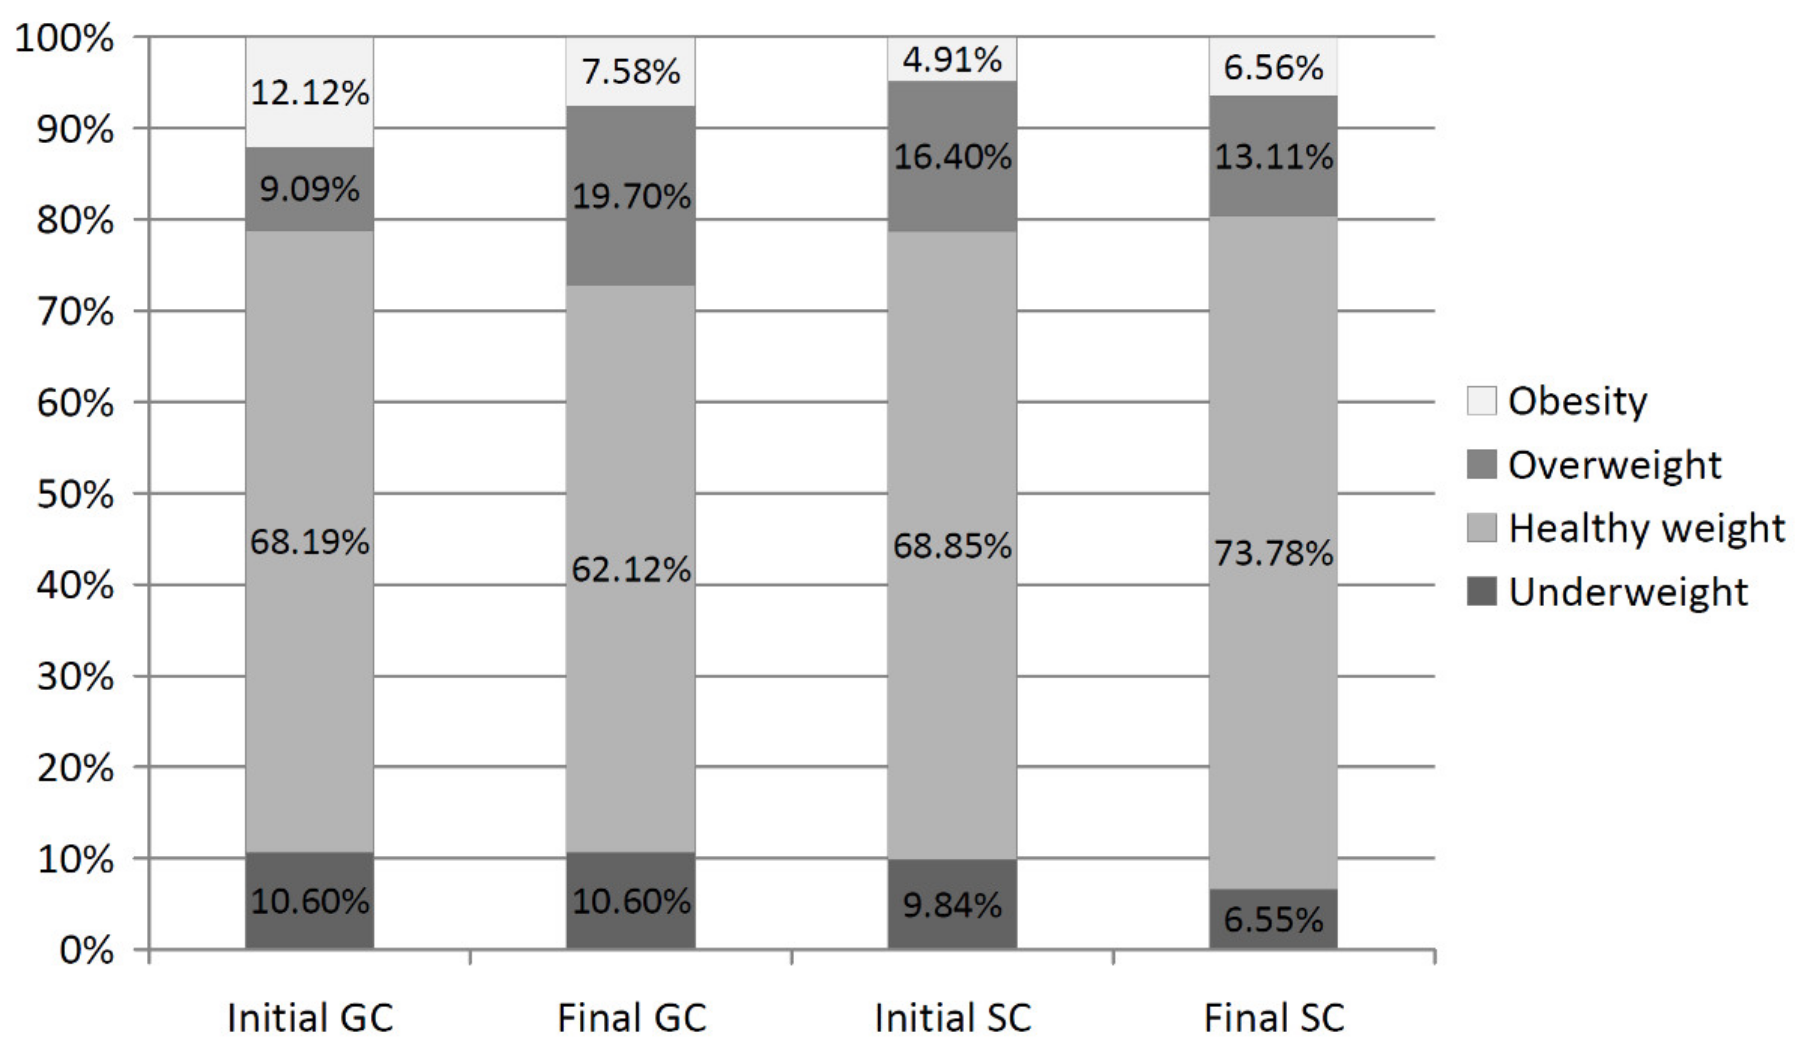
| Underweight | 10.60 | 9.84 | 9.09 | 8.19 | 13.64 | 9.84 | 7.57 | 6.55 | 10.60 | 6.55 |
| Healthy weight | 68.19 | 68.85 | 62.12 | 72.13 | 60.60 | 68.85 | 63.64 | 70.50 | 62.12 | 73.78 |
| Overweight | 9.09 | 16.40 | 16.67 | 13.12 | 13.64 | 16.39 | 21.22 | 13.11 | 19.70 | 13.11 |
| Obesity | 12.12 | 4.91 | 12.12 | 6.56 | 12.12 | 4.92 | 7.57 | 9.84 | 7.58 | 6.56 |
| Variables | GC | SC |
|---|---|---|
| Underweight | ||
| Initial measurement session | 9.69% | 10.66% |
| Final measurement session | 8.81% | 6.55% |
| stayed underweight | 5.69% | 5.74% |
| from underweight to healthy weight | 4.06% | 4.92% |
| from healthy weight to underweight | 3.12% | 0.82% |
| Overweight | ||
| Initial measurement session | 13.31% | 17.22% |
| Final measurement session | 24.74% | 14.76% |
| stayed overweight | 12.19% | 9.01% |
| from overweight to healthy weight | 0.81% | 4.92% |
| from healthy weight to overweight | 8.94% | 3.27% |
| from overweight to obesity | 0.81% | 2.50% |
| from obesity to overweight | 3.61% | 2.48% |
| Obesity | ||
| Initial measurement session | 10.45% | 7.37% |
| Final measurement session | 6.42% | 8.19% |
| stayed overweight | 5.61% | 5.69% |
| from overweight to obesity | 0.81% | 2.50% |
| from obesity to healthy weight | none | none |
| from healthy weight to obesity | none | none |
| Body Mass Categories | Average BMI (kg/m2) | SD |
|---|---|---|
| GC underweight | 14.33 | 0.48 |
| GC healthy weight | 16.08 | 0.43 |
| GC excessive weight | 23.04 | 2.18 |
| SC underweight | 14.04 | 0.41 |
| SC healthy weight | 16.27 | 0.71 |
| SC excessive weight | 22.65 | 1.28 |
Publisher’s Note: MDPI stays neutral with regard to jurisdictional claims in published maps and institutional affiliations. |
© 2022 by the authors. Licensee MDPI, Basel, Switzerland. This article is an open access article distributed under the terms and conditions of the Creative Commons Attribution (CC BY) license (https://creativecommons.org/licenses/by/4.0/).
Share and Cite
Ługowska, K.; Kolanowski, W.; Trafialek, J. The Impact of Physical Activity at School on Children’s Body Mass during 2 Years of Observation. Int. J. Environ. Res. Public Health 2022, 19, 3287. https://doi.org/10.3390/ijerph19063287
Ługowska K, Kolanowski W, Trafialek J. The Impact of Physical Activity at School on Children’s Body Mass during 2 Years of Observation. International Journal of Environmental Research and Public Health. 2022; 19(6):3287. https://doi.org/10.3390/ijerph19063287
Chicago/Turabian StyleŁugowska, Katarzyna, Wojciech Kolanowski, and Joanna Trafialek. 2022. "The Impact of Physical Activity at School on Children’s Body Mass during 2 Years of Observation" International Journal of Environmental Research and Public Health 19, no. 6: 3287. https://doi.org/10.3390/ijerph19063287
APA StyleŁugowska, K., Kolanowski, W., & Trafialek, J. (2022). The Impact of Physical Activity at School on Children’s Body Mass during 2 Years of Observation. International Journal of Environmental Research and Public Health, 19(6), 3287. https://doi.org/10.3390/ijerph19063287