
Certain Dietary Nutrients Reduce the Risk of Eye Affliction/Retinopathy in Individuals with Diabetes: National Health and Nutrition Examination Survey, 2003–2018

Abstract
1. Introduction
2. Materials and Methods
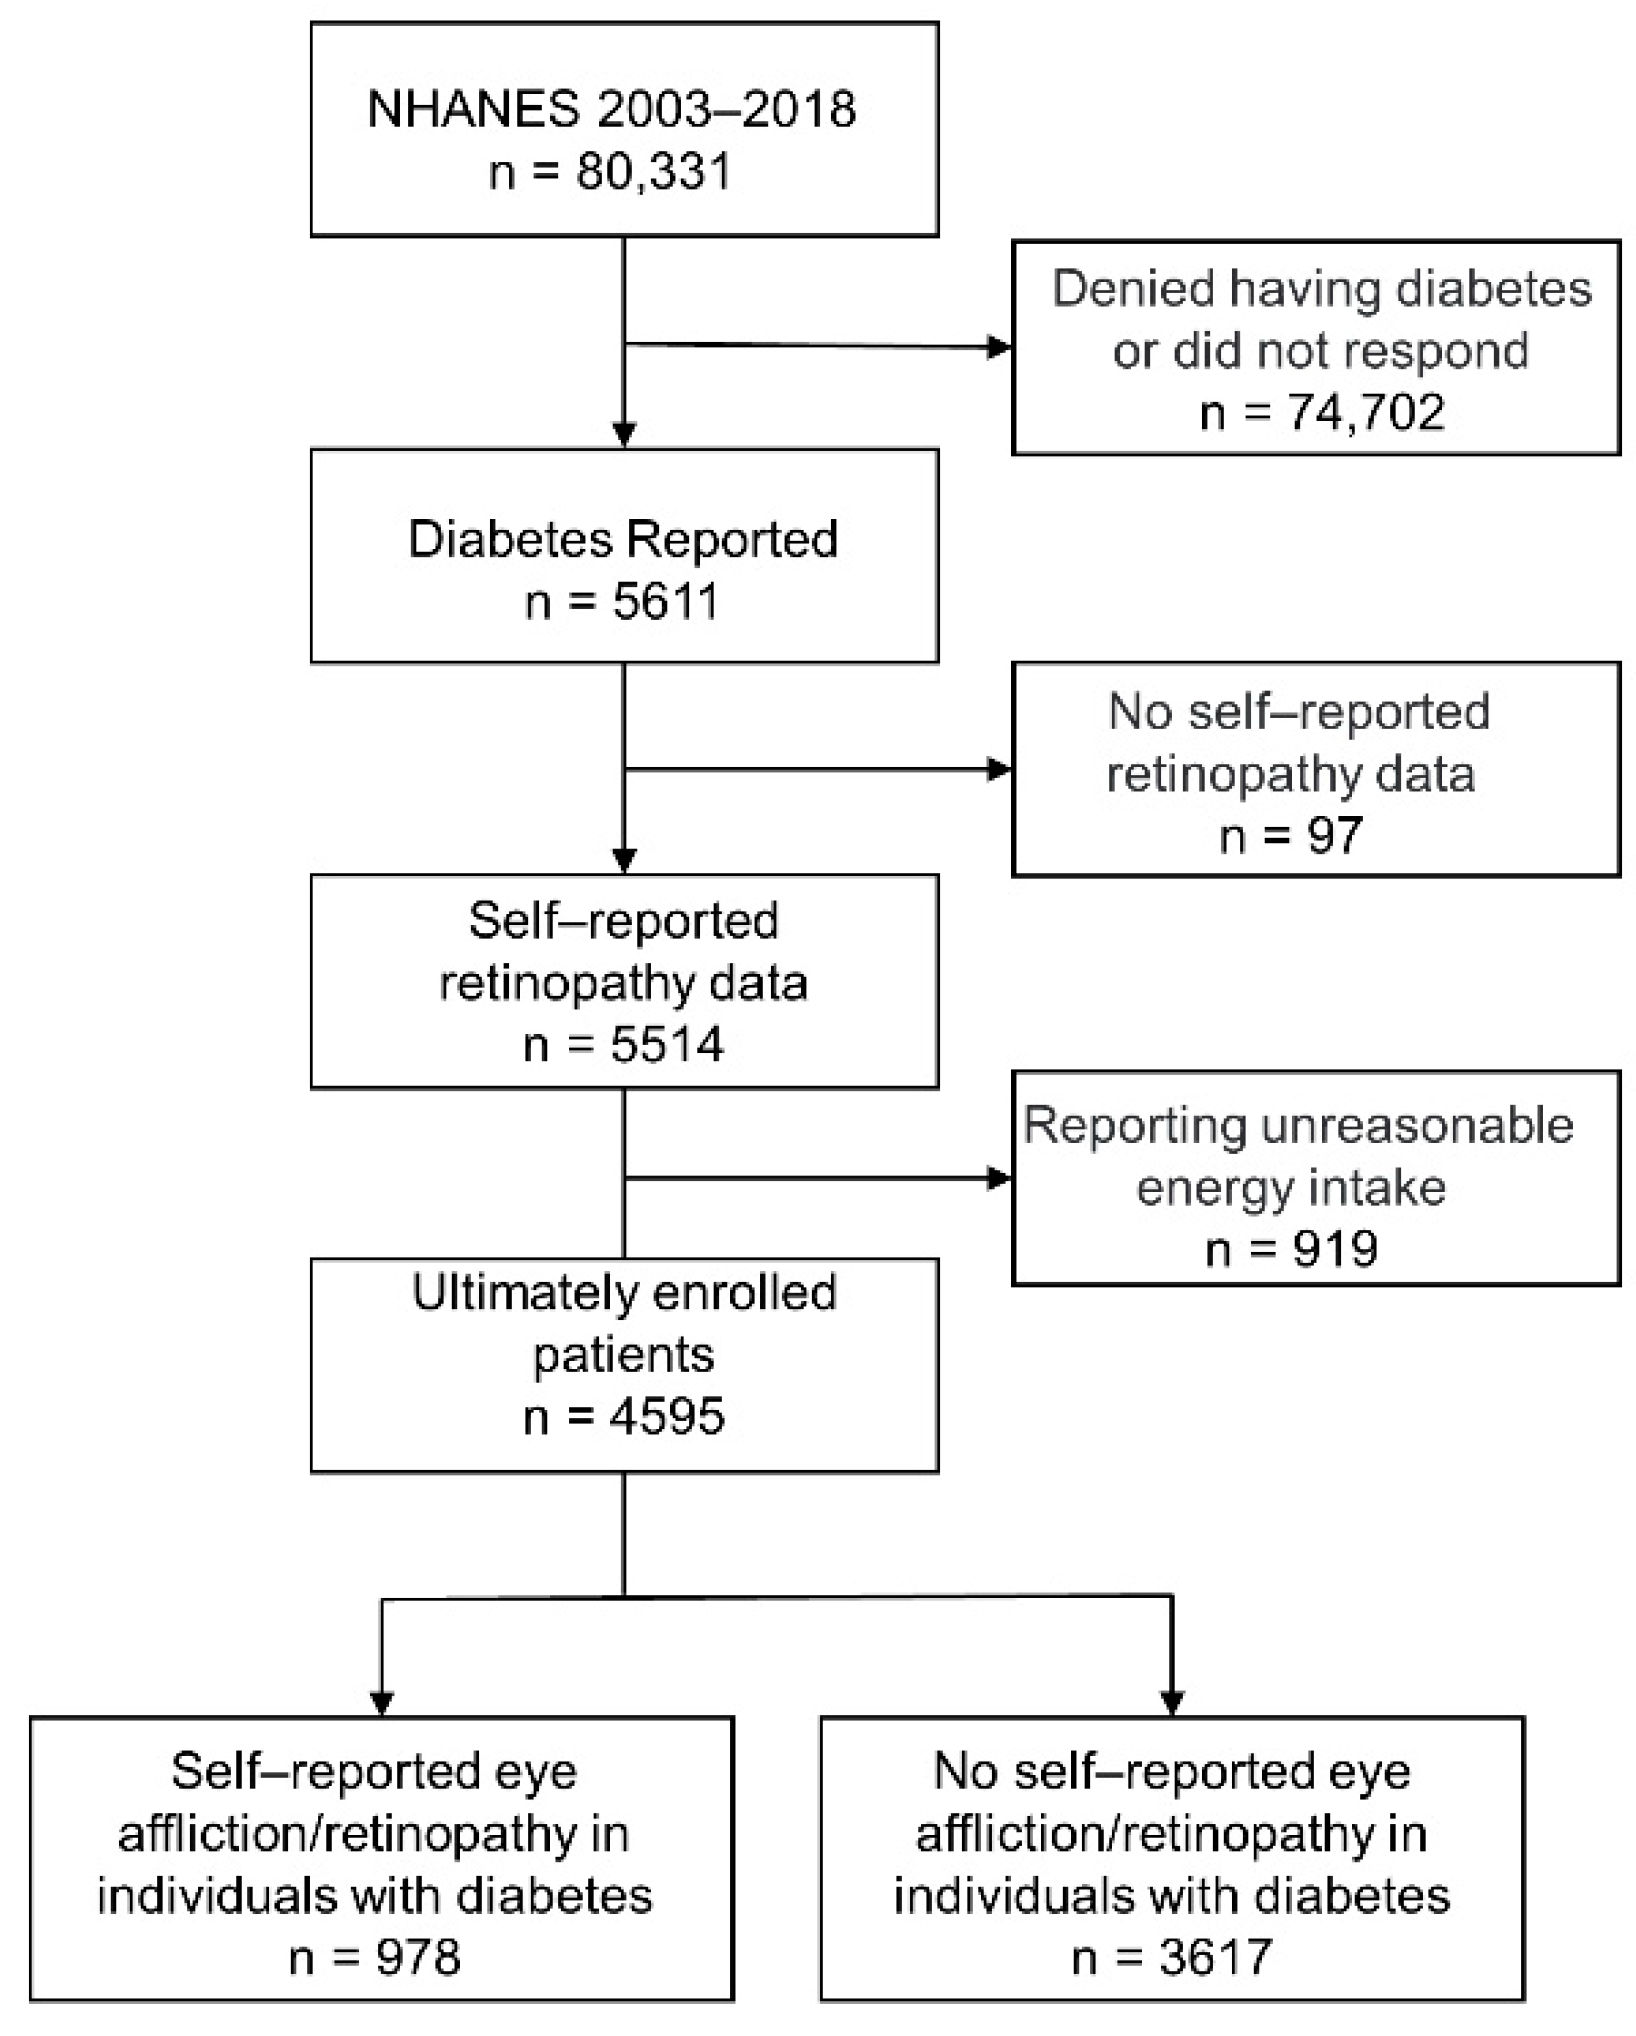
2.1. Study Population
2.2. Outcome and Covariates
2.3. Ascertainment of Diet
2.4. Statistical Analysis
3. Results
3.1. Characteristics of Participants
3.2. Macrodietary Nutrients
3.3. Dietary Fatty Acids
3.4. Dietary Vitamins
3.5. Formatting of Mathematical Components
4. Discussion
5. Conclusions
Author Contributions
Funding
Institutional Review Board Statement
Informed Consent Statement
Data Availability Statement
Conflicts of Interest
References
- Gyawali, R.; Toomey, M.; Stapleton, F.; Zangerl, B.; Dillon, L.; Ho, K.C.; Keay, L.; Alkhawajah, S.M.M.; Liew, G.; Jalbert, I. Systematic review of diabetic eye disease practice guidelines: More applicability, transparency and development rigor are needed. J. Clin. Epidemiol. 2021, 140, 56–68. [Google Scholar] [CrossRef] [PubMed]
- Antonetti, D.A.; Klein, R.; Gardner, T.W. Diabetic retinopathy. N. Engl. J. Med. 2012, 366, 1227–1239. [Google Scholar] [CrossRef] [PubMed]
- Cheloni, R.; Gandolfi, S.A.; Signorelli, C.; Odone, A. Global prevalence of diabetic retinopathy: Protocol for a systematic review and meta-analysis. BMJ Open 2019, 9, e022188. [Google Scholar] [CrossRef] [PubMed]
- Yau, J.W.; Rogers, S.L.; Kawasaki, R.; Lamoureux, E.L.; Kowalski, J.W.; Bek, T.; Chen, S.J.; Dekker, J.M.; Fletcher, A.; Grauslund, J.; et al. Global prevalence and major risk factors of diabetic retinopathy. Diabetes Care 2012, 35, 556–564. [Google Scholar] [CrossRef]
- Klein, B.E. Overview of epidemiologic studies of diabetic retinopathy. Ophthalmic Epidemiol. 2007, 14, 179–183. [Google Scholar] [CrossRef]
- Li, Y.; Teng, D.; Shi, X.; Qin, G.; Qin, Y.; Quan, H.; Shi, B.; Sun, H.; Ba, J.; Chen, B.; et al. Prevalence of diabetes recorded in mainland China using 2018 diagnostic criteria from the American Diabetes Association: National cross sectional study. BMJ Clin. Res. Ed. 2020, 369, m997. [Google Scholar] [CrossRef]
- Wong, T.Y.; Cheung, C.M.; Larsen, M.; Sharma, S.; Simó, R. Diabetic retinopathy. Nat. Reviews. Dis. Prim. 2016, 2, 16012. [Google Scholar] [CrossRef]
- Flaxel, C.J.; Adelman, R.A.; Bailey, S.T.; Fawzi, A.; Lim, J.I.; Vemulakonda, G.A.; Ying, G.S. Diabetic Retinopathy Preferred Practice Pattern®. Ophthalmology 2020, 127, 66–145. [Google Scholar] [CrossRef]
- Tan, G.S.; Gan, A.; Sabanayagam, C.; Tham, Y.C.; Neelam, K.; Mitchell, P.; Wang, J.J.; Lamoureux, E.L.; Cheng, C.Y.; Wong, T.Y. Ethnic Differences in the Prevalence and Risk Factors of Diabetic Retinopathy: The Singapore Epidemiology of Eye Diseases Study. Ophthalmology 2018, 125, 529–536. [Google Scholar] [CrossRef]
- Muni, R.H.; Kohly, R.P.; Lee, E.Q.; Manson, J.E.; Semba, R.D.; Schaumberg, D.A. Prospective study of inflammatory biomarkers and risk of diabetic retinopathy in the diabetes control and complications trial. JAMA Ophthalmol. 2013, 131, 514–521. [Google Scholar] [CrossRef]
- Hayes, A.; Arima, H.; Woodward, M.; Chalmers, J.; Poulter, N.; Hamet, P.; Clarke, P. Changes in Quality of Life Associated with Complications of Diabetes: Results from the ADVANCE Study. Value Health J. Int. Soc. Pharm. Outcomes Res. 2016, 19, 36–41. [Google Scholar] [CrossRef]
- Dow, C.; Mancini, F.; Rajaobelina, K.; Boutron-Ruault, M.C.; Balkau, B.; Bonnet, F.; Fagherazzi, G. Diet and risk of diabetic retinopathy: A systematic review. Eur. J. Epidemiol. 2018, 33, 141–156. [Google Scholar] [CrossRef]
- Brazionis, L.; Itsiopoulos, C.; Rowley, K.; O’Dea, K. Factor analysis identifies a Mediterranean-style pattern of dietary intake that is protective against diabetic retinopathy. Asia Pac. J. Clin. Nutr. 2005, 14, S73. [Google Scholar] [CrossRef]
- Millen, A.E.; Klein, R.; Folsom, A.R.; Stevens, J.; Palta, M.; Mares, J.A. Relation between intake of vitamins C and E and risk of diabetic retinopathy in the Atherosclerosis Risk in Communities Study. Am. J. Clin. Nutr. 2004, 79, 865–873. [Google Scholar] [CrossRef]
- Domanico, D.; Fragiotta, S.; Cutini, A.; Carnevale, C.; Zompatori, L.; Vingolo, E.M. Circulating levels of reactive oxygen species in patients with nonproliferative diabetic retinopathy and the influence of antioxidant supplementation: 6-month follow-up. Indian J. Ophthalmol. 2015, 63, 9–14. [Google Scholar] [CrossRef]
- Tanaka, S.; Yoshimura, Y.; Kawasaki, R.; Kamada, C.; Tanaka, S.; Horikawa, C.; Ohashi, Y.; Araki, A.; Ito, H.; Akanuma, Y.; et al. Fruit intake and incident diabetic retinopathy with type 2 diabetes. Epidemiol. Camb. Mass. 2013, 24, 204–211. [Google Scholar] [CrossRef]
- Mayer-Davis, E.J.; Bell, R.A.; Reboussin, B.A.; Rushing, J.; Marshall, J.A.; Hamman, R.F. Antioxidant nutrient intake and diabetic retinopathy: The San Luis Valley Diabetes Study. Ophthalmology 1998, 105, 2264–2270. [Google Scholar] [CrossRef]
- Chen, T.C.; Clark, J.; Riddles, M.K.; Mohadjer, L.K.; Fakhouri, T.H.I. National Health and Nutrition Examination Survey, 2015–2018: Sample Design and Estimation Procedures. Vital Health Statistics. Ser. 2 Data Eval. Methods Res. 2020, 184, 1–35. [Google Scholar]
- Sun, Y.; Wang, D.; Zhou, Q. Caffeine intake and the risk of recurrent kidney stones in adults, an analysis of 2007–2014 National Health and Nutrition Examination Surveys. Eur. J. Nutr. 2020, 59, 2683–2692. [Google Scholar] [CrossRef]
- Alcubierre, N.; Navarrete-Muñoz, E.M.; Rubinat, E.; Falguera, M.; Valls, J.; Traveset, A.; Vilanova, M.B.; Marsal, J.R.; Hernandez, M.; Granado-Casas, M.; et al. Association of low oleic acid intake with diabetic retinopathy in type 2 diabetic patients: A case-control study. Nutr. Metab. 2016, 13, 40. [Google Scholar] [CrossRef]
- Ganesan, S.; Raman, R.; Kulothungan, V.; Sharma, T. Influence of dietary-fibre intake on diabetes and diabetic retinopathy: Sankara Nethralaya-Diabetic Retinopathy Epidemiology and Molecular Genetic Study (report 26). Clin. Exp. Ophthalmol. 2012, 40, 288–294. [Google Scholar] [CrossRef]
- Vuksan, V.; Rogovik, A.L.; Jovanovski, E.; Jenkins, A.L. Fiber facts: Benefits and recommendations for individuals with type 2 diabetes. Curr. Diabetes Rep. 2009, 9, 405–411. [Google Scholar] [CrossRef]
- Ghanim, H.; Chaudhuri, A.; Dandona, P. Associations between dietary fiber and inflammation, hepatic function, and risk of type 2 diabetes in older men: Potential mechanisms for the benefits of fiber on diabetes risk: Response to wannamethee et al. Diabetes Care 2010, 33, e44. [Google Scholar] [CrossRef]
- Hopping, B.N.; Erber, E.; Grandinetti, A.; Verheus, M.; Kolonel, L.N.; Maskarinec, G. Dietary fiber, magnesium, and glycemic load alter risk of type 2 diabetes in a multiethnic cohort in Hawaii. J. Nutr. 2010, 140, 68–74. [Google Scholar] [CrossRef]
- Davis, J.N.; Alexander, K.E.; Ventura, E.E.; Toledo-Corral, C.M.; Goran, M.I. Inverse relation between dietary fiber intake and visceral adiposity in overweight Latino youth. Am. J. Clin. Nutr. 2009, 90, 1160–1166. [Google Scholar] [CrossRef]
- Reynolds, A.N.; Akerman, A.P.; Mann, J. Dietary fibre and whole grains in diabetes management: Systematic review and meta-analyses. PLoS Med. 2020, 17, e1003053. [Google Scholar] [CrossRef]
- Chandalia, M.; Garg, A.; Lutjohann, D.; von Bergmann, K.; Grundy, S.M.; Brinkley, L.J. Beneficial effects of high dietary fiber intake in patients with type 2 diabetes mellitus. N. Engl. J. Med. 2000, 342, 1392–1398. [Google Scholar] [CrossRef]
- Dhingra, D.; Michael, M.; Rajput, H.; Patil, R.T. Dietary fibre in foods: A review. J. Food Sci. Technol. 2012, 49, 255–266. [Google Scholar] [CrossRef]
- Sasaki, M.; Kawasaki, R.; Rogers, S.; Man, R.E.; Itakura, K.; Xie, J.; Flood, V.; Tsubota, K.; Lamoureux, E.; Wang, J.J. The Associations of Dietary Intake of Polyunsaturated Fatty Acids with Diabetic Retinopathy in Well-Controlled Diabetes. Investig. Ophthalmol. Vis. Sci. 2015, 56, 7473–7479. [Google Scholar] [CrossRef]
- Sala-Vila, A.; Díaz-López, A.; Valls-Pedret, C.; Cofán, M.; García-Layana, A.; Lamuela-Raventós, R.M.; Castañer, O.; Zanon-Moreno, V.; Martinez-Gonzalez, M.A.; Toledo, E.; et al. Dietary Marine ω-3 Fatty Acids and Incident Sight-Threatening Retinopathy in Middle-Aged and Older Individuals with Type 2 Diabetes: Prospective Investigation from the PREDIMED Trial. JAMA Ophthalmol. 2016, 134, 1142–1149. [Google Scholar] [CrossRef]
- Roig-Revert, M.J.; Lleó-Pérez, A.; Zanón-Moreno, V.; Vivar-Llopis, B.; Marín-Montiel, J.; Dolz-Marco, R.; Alonso-Muñoz, L.; Albert-Fort, M.; López-Gálvez, M.I.; Galarreta-Mira, D.; et al. Enhanced Oxidative Stress and Other Potential Biomarkers for Retinopathy in Type 2 Diabetics: Beneficial Effects of the Nutraceutic Supplements. BioMed. Res. Int. 2015, 2015, 408180. [Google Scholar] [CrossRef] [PubMed]
- Yahagi, N.; Shimano, H.; Hasty, A.H.; Amemiya-Kudo, M.; Okazaki, H.; Tamura, Y.; Iizuka, Y.; Shionoiri, F.; Ohashi, K.; Osuga, J.; et al. A crucial role of sterol regulatory element-binding protein-1 in the regulation of lipogenic gene expression by polyunsaturated fatty acids. J. Biol. Chem. 1999, 274, 35840–35844. [Google Scholar] [CrossRef]
- Lottenberg, A.M.; Afonso Mda, S.; Lavrador, M.S.; Machado, R.M.; Nakandakare, E.R. The role of dietary fatty acids in the pathology of metabolic syndrome. J. Nutr. Biochem. 2012, 23, 1027–1040. [Google Scholar] [CrossRef] [PubMed]
- Ferrara, N. Role of vascular endothelial growth factor in regulation of physiological angiogenesis. Am. J. Physiology. Cell Physiol. 2001, 280, C1358–C1366. [Google Scholar] [CrossRef] [PubMed]
- Conner, E.M.; Grisham, M.B. Inflammation, free radicals, and antioxidants. Nutrition 1996, 12, 274–277. [Google Scholar] [CrossRef]
- Ford, E.S.; Liu, S.; Mannino, D.M.; Giles, W.H.; Smith, S.J. C-reactive protein concentration and concentrations of blood vitamins, carotenoids, and selenium among United States adults. Eur. J. Clin. Nutr. 2003, 57, 1157–1163. [Google Scholar] [CrossRef] [PubMed]
- Coyne, T.; Ibiebele, T.I.; Baade, P.D.; Dobson, A.; McClintock, C.; Dunn, S.; Leonard, D.; Shaw, J. Diabetes mellitus and serum carotenoids: Findings of a population-based study in Queensland, Australia. Am. J. Clin. Nutr. 2005, 82, 685–693. [Google Scholar] [CrossRef]
- Kang, Q.; Yang, C. Oxidative stress and diabetic retinopathy: Molecular mechanisms, pathogenetic role and therapeutic implications. Redox Biol. 2020, 37, 101799. [Google Scholar] [CrossRef]
- Mesquida, M.; Drawnel, F.; Fauser, S. The role of inflammation in diabetic eye disease. Semin. Immunopathol. 2019, 41, 427–445. [Google Scholar] [CrossRef]
- Malaguarnera, G.; Gagliano, C.; Salomone, S.; Giordano, M.; Bucolo, C.; Pappalardo, A.; Drago, F.; Caraci, F.; Avitabile, T.; Motta, M. Folate status in type 2 diabetic patients with and without retinopathy. Clin. Ophthalmol. 2015, 9, 1437–1442. [Google Scholar] [CrossRef]
- Lei, X.W.; Li, Q.; Zhang, J.Z.; Zhang, Y.M.; Liu, Y.; Yang, K.H. The Protective Roles of Folic Acid in Preventing Diabetic Retinopathy Are Potentially Associated with Suppressions on Angiogenesis, Inflammation, and Oxidative Stress. Ophthalmic Res. 2019, 62, 80–92. [Google Scholar] [CrossRef]
- McNair, P.; Christiansen, C.; Madsbad, S.; Lauritzen, E.; Faber, O.; Binder, C.; Transbøl, I. Hypomagnesemia, a risk factor in diabetic retinopathy. Diabetes 1978, 27, 1075–1077. [Google Scholar] [CrossRef]
- Shivakumar, K. Pro-fibrogenic effects of magnesium deficiency in the cardiovascular system. Magnes. Res. 2002, 15, 307–315. [Google Scholar]
- Maier, J.A.; Malpuech-Brugère, C.; Zimowska, W.; Rayssiguier, Y.; Mazur, A. Low magnesium promotes endothelial cell dysfunction: Implications for atherosclerosis, inflammation and thrombosis. Biochim. Biophys. Acta. 2004, 1689, 13–21. [Google Scholar] [CrossRef]
- Zhou, Q.; Olinescu, R.M.; Kummerow, F.A. Influence of low magnesium concentrations in the medium on the antioxidant system in cultured human arterial endothelial cells. Magnes. Res. 1999, 12, 19–29. [Google Scholar]
- Garfinkel, D.; Garfinkel, L. Magnesium and regulation of carbohydrate metabolism at the molecular level. Magnesium 1988, 7, 249–261. [Google Scholar]
- Rodríguez-Morán, M.; Guerrero-Romero, F. Oral magnesium supplementation improves insulin sensitivity and metabolic control in type 2 diabetic subjects: A randomized double-blind controlled trial. Diabetes Care 2003, 26, 1147–1152. [Google Scholar] [CrossRef]
- Uriu-Adams, J.Y.; Keen, C.L. Copper, oxidative stress, and human health. Mol. Asp. Med. 2005, 26, 268–298. [Google Scholar] [CrossRef]
- Maugeri, G.; D’Amico, A.G.; Rasà, D.M.; La Cognata, V.; Saccone, S.; Federico, C.; Cavallaro, S.; D’Agata, V. Caffeine Prevents Blood Retinal Barrier Damage in a Model, In Vitro, of Diabetic Macular Edema. J. Cell. Biochem. 2017, 118, 2371–2379. [Google Scholar] [CrossRef]
- Shi, Y.; Wu, X.; Gong, Y.; Qiu, Y.; Zhang, H.; Huang, Z.; Su, K. Protective effects of caffeic acid phenethyl ester on retinal ischemia/reperfusion injury in rats. Curr. Eye Res. 2010, 35, 930–937. [Google Scholar] [CrossRef]
- Kim, J.H.; Lee, B.J.; Kim, J.H.; Yu, Y.S.; Kim, K.W. Anti-angiogenic effect of caffeic acid on retinal neovascularization. Vasc. Pharmacol. 2009, 51, 262–267. [Google Scholar] [CrossRef]


| Total n = 4595 | Self-Reported Eye Affliction/Retinopathy in Individuals with Diabetes | t/χ2 | p-Value a | ||
|---|---|---|---|---|---|
| Yes n = 978 | No n = 3617 | ||||
| Male, n (%) | 2288 (49.79) | 497 (50.82) | 1791 (49.52) | 0.52 | 0.470 |
| Age (year, ± s) | 62.19 ± 13.20 | 62.62 ± 12.18 | 62.08 ± 13.45 | 1.15 | 0.252 |
| Duration of diabetes (year, ± s) | 12.23 ± 11.76 | 16.90 ± 12.80 | 10.96 ± 11.14 | 14.28 | <0.0001 |
| BMI (kg/m2, ± s) | 32.30 ± 7.52 | 32.61 ± 7.84 | 32.22 ± 7.43 | 1.42 | 0.157 |
| SBP (mmHg, ± s) | 132.22 ± 20.57 | 133.05 ± 21.76 | 131.99 ± 20.22 | 1.40 | 0.161 |
| DBP (mmHg, ± s) | 68.34 ± 13.27 | 67.70 ± 13.14 | 68.51 ± 13.30 | −1.67 | 0.095 |
| Hypertension, n (%) | 3196 (69.55) | 697 (71.27) | 2499 (69.09) | 1.72 | 0.189 |
| Taking insulin now, n (%) | 1294 (28.16) | 489 (50.00) | 805 (22.26) | 284.90 | <0.0001 |
| Smoke, n (%) | 0.52 | 0.770 | |||
| Smoking now | 597 (12.99) | 124 (12.68) | 473 (13.08) | ||
| Cigarettes | 1674 (36.43) | 368 (37.63) | 1306 (36.11) | ||
| Never | 2295 (49.95) | 485 (49.59) | 1810 (50.04) | ||
| Drinks, n (%) | 1304 (28.39) | 288 (29.45) | 1016 (28.09) | 0.70 | 0.403 |
| Race, n (%) | 23.48 | <0.0001 | |||
| Non-Hispanic whites | 1636 (35.60) | 319 (32.62) | 1317 (36.41) | ||
| Non-Hispanic black | 1251 (27.23) | 266 (27.20) | 985 (27.23) | ||
| Mexican American | 876 (19.06) | 189 (19.33) | 687 (18.99) | ||
| Other race | 832 (18.11) | 204 (20.86) | 628 (17.36) | ||
| Education Level, n (%) | 12.72 | 0.005 | |||
| Less than high school | 868 (18.89) | 213 (21.78) | 655 (18.11) | ||
| High school | 1810 (39.39) | 394 (40.29) | 1416 (39.15) | ||
| College | 1203 (26.18) | 248 (25.36) | 955 (26.40) | ||
| College above | 705 (15.34) | 122 (12.47) | 583 (16.12) | ||
| C-reactive protein (mg/dL) b | 0.29 (0.12–0.65) | 0.28 (0.13–0.62) | 0.29 (0.12–0.65) | 0.91 | 0.365 |
| HDL—Cholesterol (mmol/L) b | 1.19 (1.01–1.45) | 1.19 (1.01–1.45) | 1.19 (1.01–1.45) | 0.86 | 0.392 |
| LDL—Cholesterol (mmol/L) b | 2.48 (1.91–3.18) | 2.37 (1.89–3.18) | 2.51 (1.91–3.18) | −0.59 | 0.553 |
| Total Cholesterol (mmol/L) b | 4.58 (3.88–5.40) | 4.55 (3.90–5.40) | 4.58 (3.88–5.40) | 0.08 | 0.939 |
| Triglyceride (mmol/L) b | 1.43 (1.01–2.10) | 1.42 (1.01–2.13) | 1.43 (1.02–2.09) | −0.41 | 0.685 |
| Glycohemoglobin (%) b | 6.90 (6.20–8.10) | 7.20 (6.30–8.40) | 6.90 (6.20–8.00) | 3.59 | <0.0001 |
| Albumin, urine (mg/L) b | 15.05 (6.43–50.00) | 20.50 (7.83–77.13) | 14.00 (6.20–42.70) | 6.21 | <0.0001 |
| Creatinine, urine (mg/dL) b | 100.00(62.00–149.00) | 96.00(61.00–142.00) | 101.00(63.00–151.00) | −1.40 | 0.161 |
| Quintile of Macrodietary Nutrients, OR (95% CI) | |||||
|---|---|---|---|---|---|
| 1 | 2 | 3 | 4 | 5 | |
| Energy (kcal) | 1.00 | 1.04 (0.84–1.30) | 1.00 (0.80–1.25) | 0.82 (0.65–1.03) | 0.98 (0.79–1.23) |
| Protein (gm) | 1.00 | 1.16 (0.93–1.45) | 1.03 (0.82–1.29) | 1.00 (0.79–1.26) | 1.18 (0.95–1.48) |
| Carbohydrate (gm) | 1.00 | 0.98 (0.79–1.21) | 0.92 (0.74–1.14) | 0.81 (0.65–1.01) | 0.82 (0.66–1.03) |
| Total sugars (gm) | 1.00 | 1.11 (0.90–1.38) | 0.81 (0.65–1.02) | 0.93 (0.74–1.16) | 0.81 (0.64–1.01) |
| Dietary fiber (gm) | 1.00 | 1.11 (0.90–1.38) | 0.97 (0.78–1.21) | 0.80 (0.64–1.00) | 0.78 (0.62–0.98) |
| Cholesterol (mg) | 1.00 | 1.19 (0.95–1.49) | 1.03 (0.82–1.30) | 0.98 (0.77–1.23) | 1.26 (1.01–1.58) |
| Moisture (gm) | 1.00 | 1.12 (0.90–1.39) | 0.90 (0.72–1.13) | 0.96 (0.77–1.21) | 1.01 (0.80–1.26) |
| Quintile of Dietary Nutrients, OR (95% CI) | p Trend | |||||
|---|---|---|---|---|---|---|
| 1 | 2 | 3 | 4 | 5 | ||
| Dietary fiber (gm) | ||||||
| Model 1 | 1.00 | 1.11 (0.90–1.37) | 0.96 (0.77–1.20) | 0.80 (0.63–0.99) | 0.77 (0.61–0.96) | 0.001 |
| Model 2 | 1.00 | 1.35 (0.99–1.84) | 0.92 (0.66–1.29) | 0.82 (0.58–1.15) | 0.75 (0.52–1.07) | 0.006 |
| Model 3 | 1.00 | 1.35 (0.97–1.85) | 0.99 (0.74–1.30) | 0.85 (0.61–1.17) | 0.74 (0.49–1.01) | 0.016 |
| Model 4 | 1.00 | 1.34 (0.96–1.85) | 1.03 (0.73–1.46) | 0.85 (0.59–1.21) | 0.80 (0.55–1.16) | 0.034 |
| Cholesterol (mg) | ||||||
| Model 1 | 1.00 | 1.18 (0.95–1.48) | 1.03 (0.82–1.30) | 0.97 (0.77–1.23) | 1.27 (1.01–1.59) | 0.273 |
| Model 2 | 1.00 | 1.44 (1.04–1.98) | 0.98 (0.70–1.39) | 1.10 (0.78–1.55) | 1.64 (1.18–2.29) | 0.054 |
| Model 3 | 1.00 | 1.19 (0.94–1.49) | 1.00 (0.80–1.26) | 1.06 (0.84–1.33) | 1.28 (1.01–1.61) | 0.153 |
| Model 4 | 1.00 | 1.46 (1.04–2.05) | 1.04 (0.72–1.49) | 1.13 (0.79–1.62) | 1.52 (1.07–2.16) | 0.138 |
| SFA 4:0 (Butanoic) (gm) | ||||||
| Model 1 | 1.00 | 0.79 (0.63–0.99) | 0.93 (0.67–1.04) | 1.05 (0.85–1.30) | 0.86 (0.68–1.07) | 0.903 |
| Model 2 | 1.00 | 0.72 (0.52–1.00) | 0.83 (0.60–1.15) | 1.14 (0.83–1.57) | 0.82 (0.58–1.16) | 0.885 |
| Model 3 | 1.00 | 0.89 (0.71–1.13) | 0.94 (0.74–1.18) | 1.17 (0.93–1.48) | 0.92 (0.73–1.17) | 0.160 |
| Model 4 | 1.00 | 0.77 (0.54–1.09) | 0.85 (0.61–1.20) | 1.23 (0.88–1.72) | 0.91 (0.63–1.31) | 0.515 |
| SFA 8:0 (Octanoic) (gm) | ||||||
| Model 1 | 1.00 | 0.73 (0.58–0.91) | 0.89 (0.71–1.10) | 0.94 (0.75–1.16) | 0.92 (0.74–1.14) | 0.841 |
| Model 2 | 1.00 | 0.74 (0.53–1.03) | 0.86 (0.62–1.18) | 0.92 (0.66–1.28) | 1.02 (0.73–1.42) | 0.599 |
| Model 3 | 1.00 | 0.75 (0.59–0.94) | 0.89 (0.71–1.13) | 0.93 (0.74–1.18) | 0.94 (0.74–1.19) | 0.117 |
| Model 4 | 1.00 | 0.74 (0.52–1.05) | 0.84 (0.60–1.19) | 0.93 (0.66–1.33) | 1.05 (0.74–1.49) | 0.516 |
| MFA 16:1 (Hexadecenoic) (gm) | ||||||
| Model 1 | 1.00 | 1.11 (0.88–1.39) | 1.10 (0.88–1.38) | 0.96 (0.76–1.22) | 1.27 (1.02–1.60) | 0.160 |
| Model 2 | 1.00 | 1.14 (0.83–1.56) | 1.07 (0.76–1.50) | 1.14 (0.82–1.60) | 1.21 (0.84–1.73) | 0.349 |
| Model 3 | 1.00 | 1.10 (0.87–1.38) | 1.12 (0.90–1.42) | 0.96 (0.76–1.21) | 1.40 (1.10–1.78) | 0.018 |
| Model 4 | 1.00 | 1.20 (0.86–1.67) | 1.03 (0.72–1.46) | 1.17 (0.82–1.66) | 1.16 (0.79–1.69) | 0.525 |
| Vitamin A (mcg) | ||||||
| Model 1 | 1.00 | 0.93 (0.75–1.15) | 0.82 (0.65–1.02) | 0.92 (0.74–1.14) | 0.73 (0.58–0.92) | 0.016 |
| Model 2 | 1.00 | 0.86 (0.62–1.19) | 1.02 (0.73–1.41) | 1.00 (0.73–1.37) | 0.68 (0.48–0.96) | 0.157 |
| Model 3 | 1.00 | 1.01 (0.80–1.28) | 0.81 (0.65–1.00) | 1.02 (0.81–1.28) | 0.78 (0.62–0.98) | 0.043 |
| Model 4 | 1.00 | 0.84 (0.60–1.19) | 1.03 (0.73–1.45) | 1.02 (0.73–1.42) | 0.70 (0.48–1.02) | 0.278 |
| Alpha-carotene, (mcg) | ||||||
| Model 1 | 1.00 | 1.03 (0.83–1.27) | 0.69 (0.55–0.87) | 0.92 (0.74–1.14) | 0.92 (0.71–1.14) | 0.234 |
| Model 2 | 1.00 | 1.35 (0.97–1.88) | 0.96 (0.68–1.36) | 1.16 (0.83–1.64) | 1.05 (0.75–1.48) | 0.861 |
| Model 3 | 1.00 | 1.12 (0.80–1.41) | 0.73 (0.58–0.92) | 0.99 (0.79–1.26) | 0.95 (0.75–1.19) | 0.224 |
| Model 4 | 1.00 | 1.35 (0.95–1.91) | 0.87 (0.60–1.26) | 1.13 (0.79–1.62) | 1.12 (0.78–1.59) | 0.948 |
| Folate, DFE (mcg) | ||||||
| Model 1 | 1.00 | 0.84 (0.67–1.04) | 0.96 (0.77–1.19) | 0.75 (0.59–0.94) | 0.83 (0.66–1.04) | 0.055 |
| Model 2 | 1.00 | 0.80 (0.58–1.11) | 0.87 (0.63–1.19) | 0.77 (0.55–1.07) | 0.96 (0.69–1.33) | 0.611 |
| Model 3 | 1.00 | 0.89 (0.71–1.13) | 1.10 (0.87–1.39) | 0.80 (0.64–1.01) | 0.89 (0.70–1.21) | 0.066 |
| Model 4 | 1.00 | 0.80 (0.57–1.12) | 0.88 (0.63–1.22) | 0.82 (0.58–1.17) | 1.00 (0.71–1.42) | 0.921 |
| Magnesium (mg) | ||||||
| Model 1 | 1.00 | 0.94 (0.76–1.17) | 0.90 (0.72–1.12) | 0.76 (0.60–0.95) | 0.78 (0.62–0.98) | 0.006 |
| Model 2 | 1.00 | 1.06 (0.77–1.44) | 0.88 (0.64–1.21) | 0.76 (0.54–1.07) | 0.78 (0.54–1.11) | 0.040 |
| Model 3 | 1.00 | 0.98 (0.78–1.24) | 0.98 (0.77–1.23) | 0.77 (0.56–1.08) | 0.78 (0.54–1.01) | 0.032 |
| Model 4 | 1.00 | 1.12 (0.81–1.55) | 0.96 (0.69–1.35) | 0.86 (0.60–1.22) | 0.77 (0.53–1.12) | 0.079 |
| Copper (mg) | ||||||
| Model 1 | 1.00 | 0.73 (0.59–0.91) | 0.83 (0.67–1.02) | 0.72 (0.58–0.89) | 0.66 (0.52–0.82) | 0.001 |
| Model 2 | 1.00 | 0.72 (0.53–0.98) | 0.77 (0.57–1.05) | 0.59 (0.42–0.83) | 0.64 (0.45–0.91) | 0.003 |
| Model 3 | 1.00 | 0.74 (0.56–0.97) | 0.86 (0.68–1.08) | 0.61 (0.44–0.90) | 0.68 (0.44–0.89) | 0.011 |
| Model 4 | 1.00 | 0.77 (0.56–1.07) | 0.83 (0.60–1.15) | 0.63 (0.45–0.90) | 0.70 (0.49–1.01) | 0.019 |
| Caffeine (mg) | ||||||
| Model 1 | 1.00 | 0.80 (0.64–0.99) | 0.95 (0.76–1.18) | 0.86 (0.69–1.07) | 0.88 (0.71–1.10) | 0.441 |
| Model 2 | 1.00 | 0.65 (0.47–0.90) | 0.99 (0.72–1.34) | 0.87 (0.62–1.21) | 0.87 (0.61–1.24) | 0.837 |
| Model 3 | 1.00 | 0.83 (0.66–1.04) | 0.99 (0.79–1.25) | 0.84 (0.67–1.05) | 0.87 (0.69–1.10) | 0.331 |
| Model 4 | 1.00 | 0.67 (0.47–0.95) | 1.01 (0.73–1.41) | 0.80 (0.56–1.13) | 0.96 (0.66–1.39) | 0.977 |
| Quintile of Dietary Fatty Acids, OR (95% CI) | |||||
|---|---|---|---|---|---|
| 1 | 2 | 3 | 4 | 5 | |
| Total fat (gm) | 1.00 | 0.93 (0.74–1.16) | 1.05 (0.84–1.31) | 1.01 (0.81–1.26) | 0.99 (0.79–1.23) |
| Total saturated fatty acids (gm) | 1.00 | 0.98 (0.79–1.23) | 1.04 (0.83–1.30) | 0.95 (0.76–1.19) | 1.06 (0.85–1.33) |
| SFA 4:0 (Butanoic) (gm) | 1.00 | 0.79 (0.63–0.99) | 0.83 (0.67–1.04) | 1.05 (0.85–1.30) | 0.86 (0.69–1.07) |
| SFA 6:0 (Hexanoic) (gm) | 1.00 | 0.84 (0.67–1.05) | 0.98 (0.79–1.23) | 1.09 (0.88–1.36) | 0.96 (0.77–1.20) |
| SFA 8:0 (Octanoic) (gm) | 1.00 | 0.72 (0.58–0.91) | 0.88 (0.71–1.10) | 0.94 (0.75–1.16) | 0.92 (0.74–1.14) |
| SFA 10:0 (Decanoic) (gm) | 1.00 | 0.82 (0.65–1.03) | 0.98 (0.79–1.22) | 1.02 (0.82–1.26) | 0.97 (0.78–1.21) |
| SFA 12:0 (Dodecanoic) (gm) | 1.00 | 0.85 (0.68–1.06) | 0.98 (0.79–1.22) | 0.80 (0.64–1.01) | 1.02 (0.82–1.27) |
| SFA 14:0 (Tetradecanoic) (gm) | 1.00 | 0.88 (0.70–1.01) | 0.94 (0.75–1.18) | 1.13 (0.91–1.40) | 1.02 (0.81–1.27) |
| SFA 16:0 (Hexadecanoic) (gm) | 1.00 | 0.97 (0.77–1.21) | 1.04 (0.83–1.30) | 0.95 (0.76–1.19) | 1.11 (0.89–1.38) |
| SFA 18:0 (Octadecanoic) (gm) | 1.00 | 0.97 (0.77–1.21) | 1.00 (0.80–1.25) | 0.94 (0.75–1.18) | 1.03 (0.83–1.29) |
| Total monounsaturated fatty acids (gm) | 1.00 | 0.91 (0.72–1.14) | 1.08 (0.87–1.35) | 1.00 (0.80–1.25) | 0.97 (0.78–1.21) |
| MFA 16:1 (Hexadecenoic) (gm) | 1.00 | 1.11 (0.89–1.39) | 1.11 (0.88–1.39) | 0.96 (0.76–1.22) | 1.27 (1.02–1.59) |
| MFA 18:1 (Octadecenoic) (gm) | 1.00 | 0.99 (0.79–1.24) | 1.10 (0.88–1.37) | 1.04 (0.83–1.30) | 0.95 (0.76–1.19) |
| MFA 20:1 (Eicosenoic) (gm) | 1.00 | 0.91 (0.73–1.14) | 0.85 (0.68–1.07) | 1.19 (0.96–1.47) | 0.86 (0.68–1.07) |
| MFA 22:1 (Docosenoic) (gm) | 1.00 | 1.14 (0.91–1.42) | 1.14 (0.91–1.43) | 1.13 (0.90–1.41) | 1.13 (0.91–1.42) |
| Total polyunsaturated fatty acids (gm) | 1.00 | 1.01 (0.81–1.26) | 1.06 (0.85–1.32) | 1.18 (0.95–1.47) | 0.90 (0.71–1.13) |
| PFA 18:2 (Octadecadienoic) (gm) | 1.00 | 0.98 (0.78–1.23) | 1.03 (0.83–1.29) | 1.20 (0.97–1.49) | 0.86 (0.68–1.08) |
| PFA 18:3 (Octadecatrienoic) (gm) | 1.00 | 0.99 (0.79–1.24) | 1.19 (0.96–0.48) | 1.08 (0.87–1.35) | 0.92 (0.73–1.15) |
| PFA 18:4 (Octadecatetraenoic) (gm) | 1.00 | 1.01 (0.78–1.31) | 0.98 (0.80–1.20) | 1.07 (0.87–1.32) | 0.98 (0.80–1.19) |
| PFA 20:4 (Eicosatetraenoic) (gm) | 1.00 | 0.99 (0.79–1.24) | 0.95 (0.76–1.19) | 0.92 (0.73–1.15) | 1.10 (0.88–1.36) |
| PFA 20:5 (Eicosapentaenoic) (gm) | 1.00 | 1.02 (0.81–1.28) | 1.19 (0.95–1.48) | 1.19 (0.95–1.49) | 1.10 (0.88–1.38) |
| PFA 22:5 (Docosapentaenoic) (gm) | 1.00 | 0.92 (0.74–1.15) | 1.10 (0.89–1.37) | 0.89 (0.71–1.11) | 0.95 (0.76–1.18) |
| PFA 22:6 (Docosahexaenoic) (gm) | 1.00 | 1.11 (0.89–1.39) | 0.88 (0.69–1.11) | 1.16 (0.93–1.45) | 1.03 (0.82–1.29) |
| Quintile of Dietary Vitamins, OR (95% CI) | |||||
|---|---|---|---|---|---|
| 1 | 2 | 3 | 4 | 5 | |
| Vitamin E as alpha-tocopherol (mg) | 1.00 | 0.98 (0.79–1.22) | 1.06 (0.85–1.32) | 0.93 (0.75–1.16) | 0.81 (0.64–1.02) |
| Retinol (mcg) | 1.00 | 1.23 (0.99–1.52) | 0.94 (0.75–1.18) | 0.94 (0.75–1.18) | 1.03 (0.83–1.29) |
| Vitamin A (mcg) | 1.00 | 0.93 (0.75–1.15) | 0.83 (0.66–1.03) | 0.93 (0.75–1.15) | 0.74 (0.59–0.93) |
| Alpha-carotene (mcg) | 1.00 | 1.03 (0.83–1.28) | 0.70 (0.55–0.88) | 0.93 (0.75–1.16) | 0.93 (0.74–1.15) |
| Beta-carotene (mcg) | 1.00 | 1.01 (0.81–1.26) | 1.01 (0.81–1.25) | 0.98 (0.80–1.23) | 0.81 (0.65–1.02) |
| Beta-cryptoxanthin (mcg) | 1.00 | 0.90 (0.72–1.13) | 1.10 (0.88–1.37) | 0.97 (0.77–1.21) | 0.95 (0.76–1.19) |
| Lycopene (mcg) | 1.00 | 0.78 (0.62–0.97) | 0.73 (0.58–0.91) | 0.89 (0.72–1.10) | 0.85 (0.69–1.06) |
| Lutein + zeaxanthin (mcg) | 1.00 | 1.03 (0.83–1.28) | 0.96 (0.77–1.20) | 1.01 (0.81–1.25) | 0.83 (0.66–1.04) |
| Thiamin (Vitamin B1) (mg) | 1.00 | 1.07 (0.86–1.34) | 1.03 (0.82–1.28) | 1.05 (0.84–1.31) | 0.87 (0.69–1.10) |
| Riboflavin (Vitamin B2) (mg) | 1.00 | 0.90 (0.72–1.26) | 0.94 (0.75–1.17) | 0.94 (0.76–1.18) | 0.92 (0.74–1.15) |
| Niacin (mg) | 1.00 | 0.94 (0.75–1.17) | 0.97 (0.77–1.21) | 1.02 (0.82–1.27) | 0.94 (0.75–1.18) |
| Vitamin B6 (mg) | 1.00 | 0.98 (0.79–1.22) | 0.97 (0.78–0.21) | 0.88 (0.70–1.10) | 0.91 (0.73–1.15) |
| Folate, DFE (mcg) | 1.00 | 0.85 (0.68–1.06) | 0.97 (0.78–1.20) | 075 (0.60–0.95) | 0.84 (0.67–1.05) |
| Total choline (mg) | 1.00 | 1.20 (0.97–1.50) | 0.88 (0.70–1.11) | 0.99 (0.78–1.24) | 1.16 (0.93–1.45) |
| Vitamin B12 (mcg) | 1.00 | 0.80 (0.94–0.99) | 0.94 (0.76–1.17) | 0.92 (0.74–1.14) | 0.86 (0.69–1.07) |
| Vitamin C (mg) | 1.00 | 1.08 (0.87–1.34) | 1.03 (0.83–1.29) | 1.01 (0.81–1.26) | 0.85 (0.68–1.07) |
| Vitamin D (D2 + D3) (mcg) | 1.00 | 1.10 (0.88–1.37) | 0.99 (0.79–1.24) | 1.03 (0.83–1.30) | 1.00 (0.80–1.25) |
| Vitamin K (mcg) | 1.00 | 1.06 (0.85–1.33) | 1.10 (0.89–1.38) | 0.98 (0.78–1.22) | 0.84 (0.66–1.06) |
| Quintile of Dietary Micronutrients, OR (95% CI) | |||||
|---|---|---|---|---|---|
| 1 | 2 | 3 | 4 | 5 | |
| Calcium (mg) | 1.00 | 0.94 (0.76–1.18) | 0.97 (0.78–1.20) | 0.92 (0.73–1.15) | 0.93 (0.74–1.16) |
| Phosphorus (mg) | 1.00 | 1.05 (0.84–1.31) | 0.92 (0.74–1.16) | 0.98 (0.79–1.23) | 0.98 (0.79–1.23) |
| Magnesium (mg) | 1.00 | 0.95 (0.77–1.17) | 0.91 (0.73–1.13) | 0.77 (0.61–0.96) | 0.79 (0.64–0.99) |
| Iron (mg) | 1.00 | 1.16 (0.93–1.44) | 1.12 (0.90–1.40) | 0.99 (0.79–1.24) | 0.89 (0.70–1.12) |
| Zinc (mg) | 1.00 | 0.95 (0.76–1.18) | 0.84 (0.67–1.05) | 0.97 (0.78–1.21) | 0.94 (0.76–1.18) |
| Copper (mg) | 1.00 | 0.74 (0.60–0.92) | 0.84 (0.68–1.03) | 0.73 (0.58–0.90) | 0.67 (0.54–0.84) |
| Sodium (mg) | 1.00 | 0.95 (0.76–1.18) | 0.93 (0.74–1.16) | 0.93 (0.74–1.16) | 1.02 (0.82–1.26) |
| Potassium (mg) | 1.00 | 1.01 (0.82–1.26) | 0.88 (0.70–1.10) | 0.87 (0.69–1.08) | 0.90 (0.72–1.12) |
| Selenium (mcg) | 1.00 | 1.01 (0.81–1.26) | 1.04 (0.83–1.30) | 0.98 (0.78–1.23) | 1.08 (0.86–1.34) |
| Caffeine (mg) | 1.00 | 0.80 (0.64–0.99) | 0.95 (0.76–1.18) | 0.87 (0.69–1.08) | 0.89 (0.72–1.11) |
Publisher’s Note: MDPI stays neutral with regard to jurisdictional claims in published maps and institutional affiliations. |
© 2022 by the authors. Licensee MDPI, Basel, Switzerland. This article is an open access article distributed under the terms and conditions of the Creative Commons Attribution (CC BY) license (https://creativecommons.org/licenses/by/4.0/).
Share and Cite
Zhang, G.; Sun, X.; Yuan, T.; Guo, C.; Zhou, Z.; Wang, L.; Dou, G. Certain Dietary Nutrients Reduce the Risk of Eye Affliction/Retinopathy in Individuals with Diabetes: National Health and Nutrition Examination Survey, 2003–2018. Int. J. Environ. Res. Public Health 2022, 19, 12173. https://doi.org/10.3390/ijerph191912173
Zhang G, Sun X, Yuan T, Guo C, Zhou Z, Wang L, Dou G. Certain Dietary Nutrients Reduce the Risk of Eye Affliction/Retinopathy in Individuals with Diabetes: National Health and Nutrition Examination Survey, 2003–2018. International Journal of Environmental Research and Public Health. 2022; 19(19):12173. https://doi.org/10.3390/ijerph191912173
Chicago/Turabian StyleZhang, Guoheng, Xiaojia Sun, Tianhao Yuan, Changmei Guo, Ziyi Zhou, Ling Wang, and Guorui Dou. 2022. "Certain Dietary Nutrients Reduce the Risk of Eye Affliction/Retinopathy in Individuals with Diabetes: National Health and Nutrition Examination Survey, 2003–2018" International Journal of Environmental Research and Public Health 19, no. 19: 12173. https://doi.org/10.3390/ijerph191912173
APA StyleZhang, G., Sun, X., Yuan, T., Guo, C., Zhou, Z., Wang, L., & Dou, G. (2022). Certain Dietary Nutrients Reduce the Risk of Eye Affliction/Retinopathy in Individuals with Diabetes: National Health and Nutrition Examination Survey, 2003–2018. International Journal of Environmental Research and Public Health, 19(19), 12173. https://doi.org/10.3390/ijerph191912173