Development of a Conceptual Framework for Occupational Safety and Health in Palestinian Manufacturing Industries


Abstract
1. Introduction
2. Materials and Methods
2.1. Data Collection and Sample
2.2. Data Analysis
2.2.1. Thematic Analysis Approach
2.2.2. Statistical Analysis
2.2.3. OSHA Rate Formulas
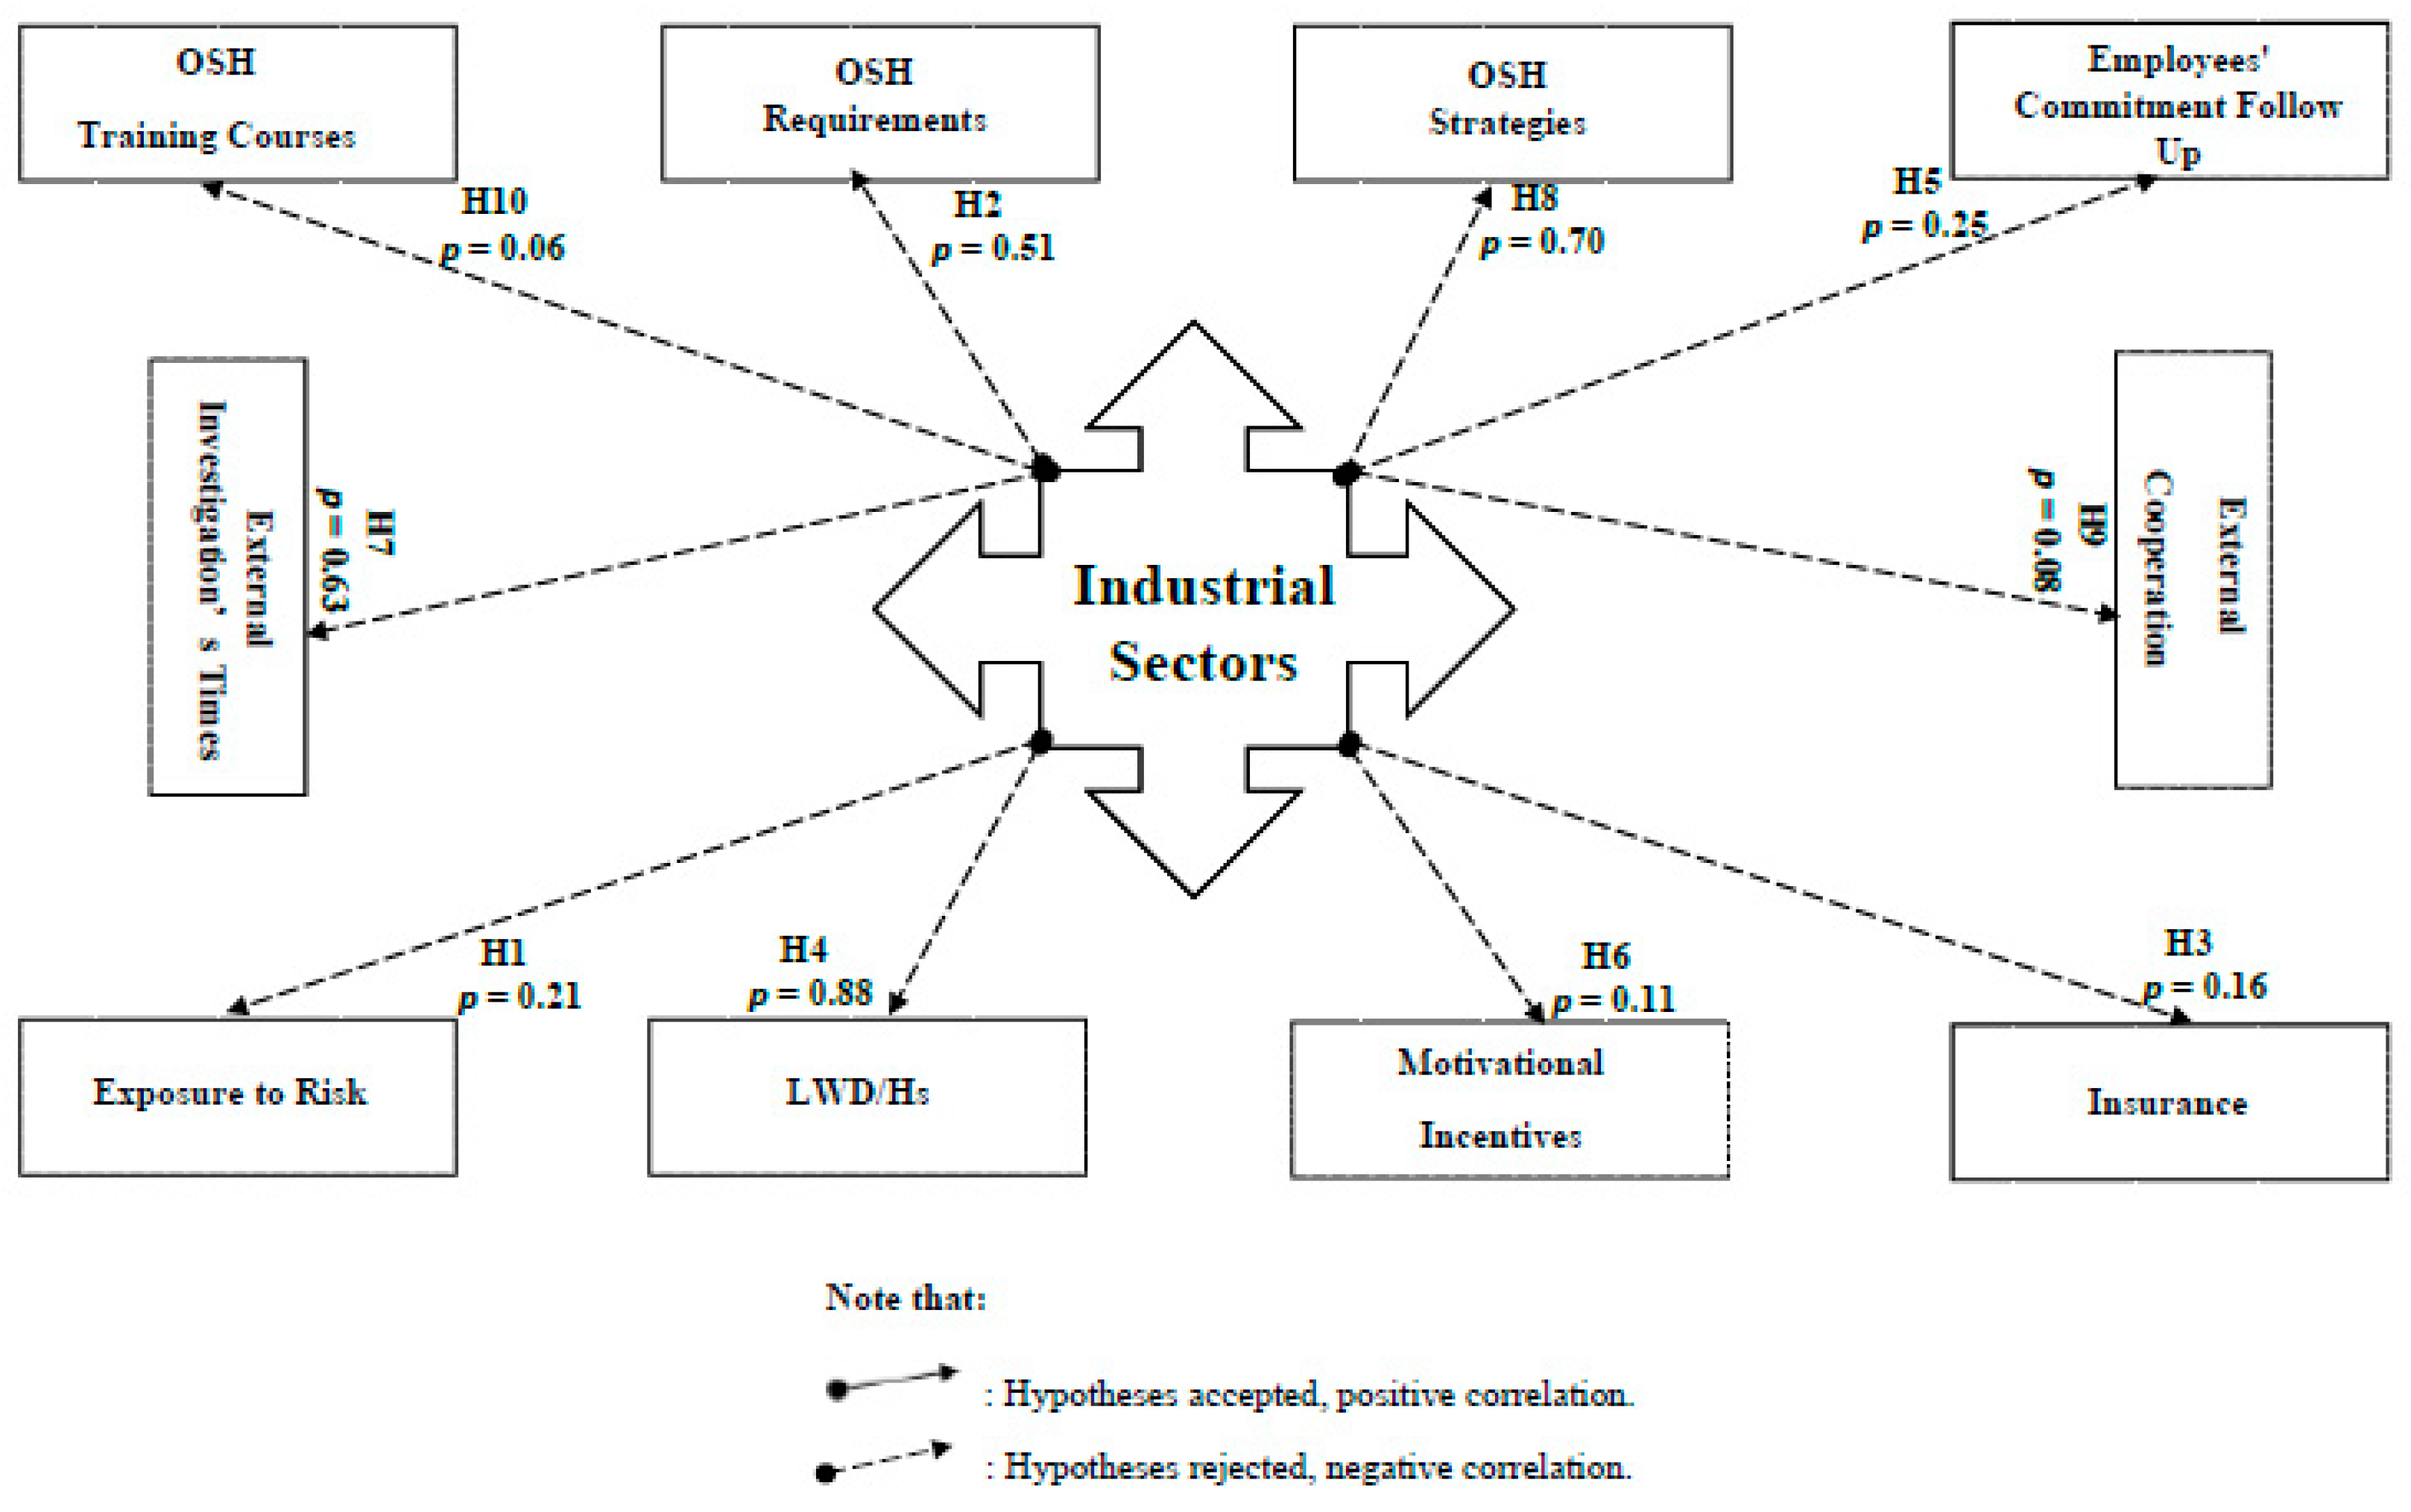
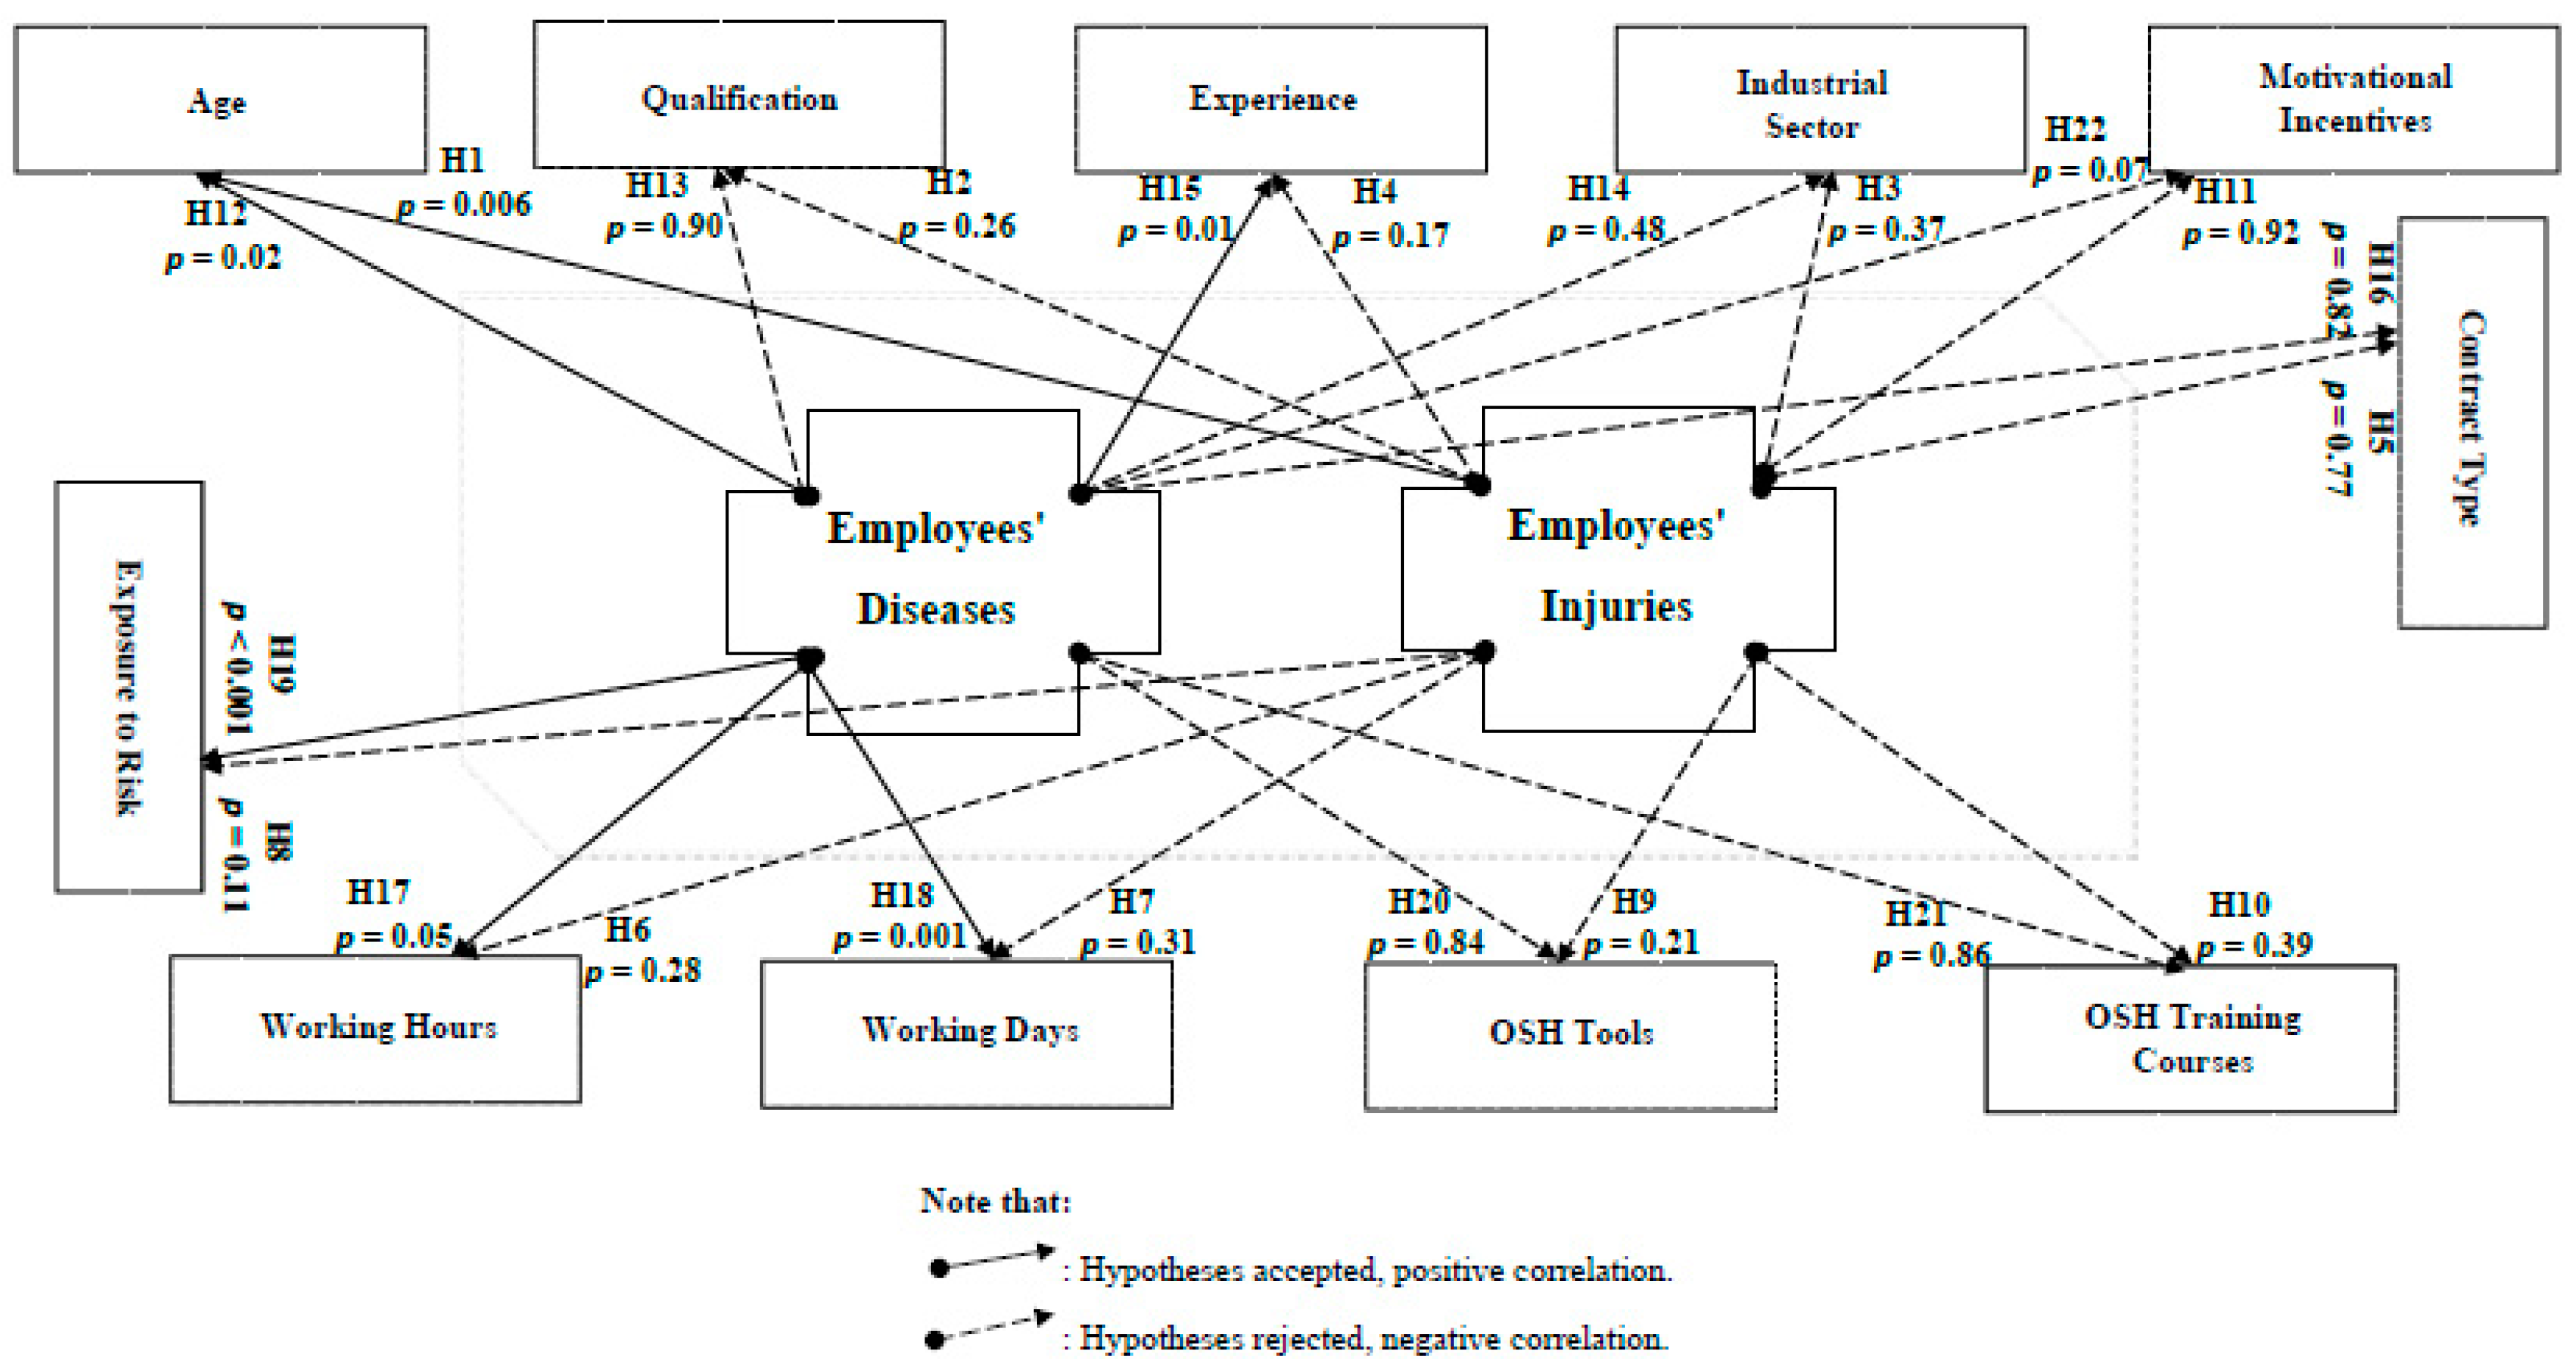
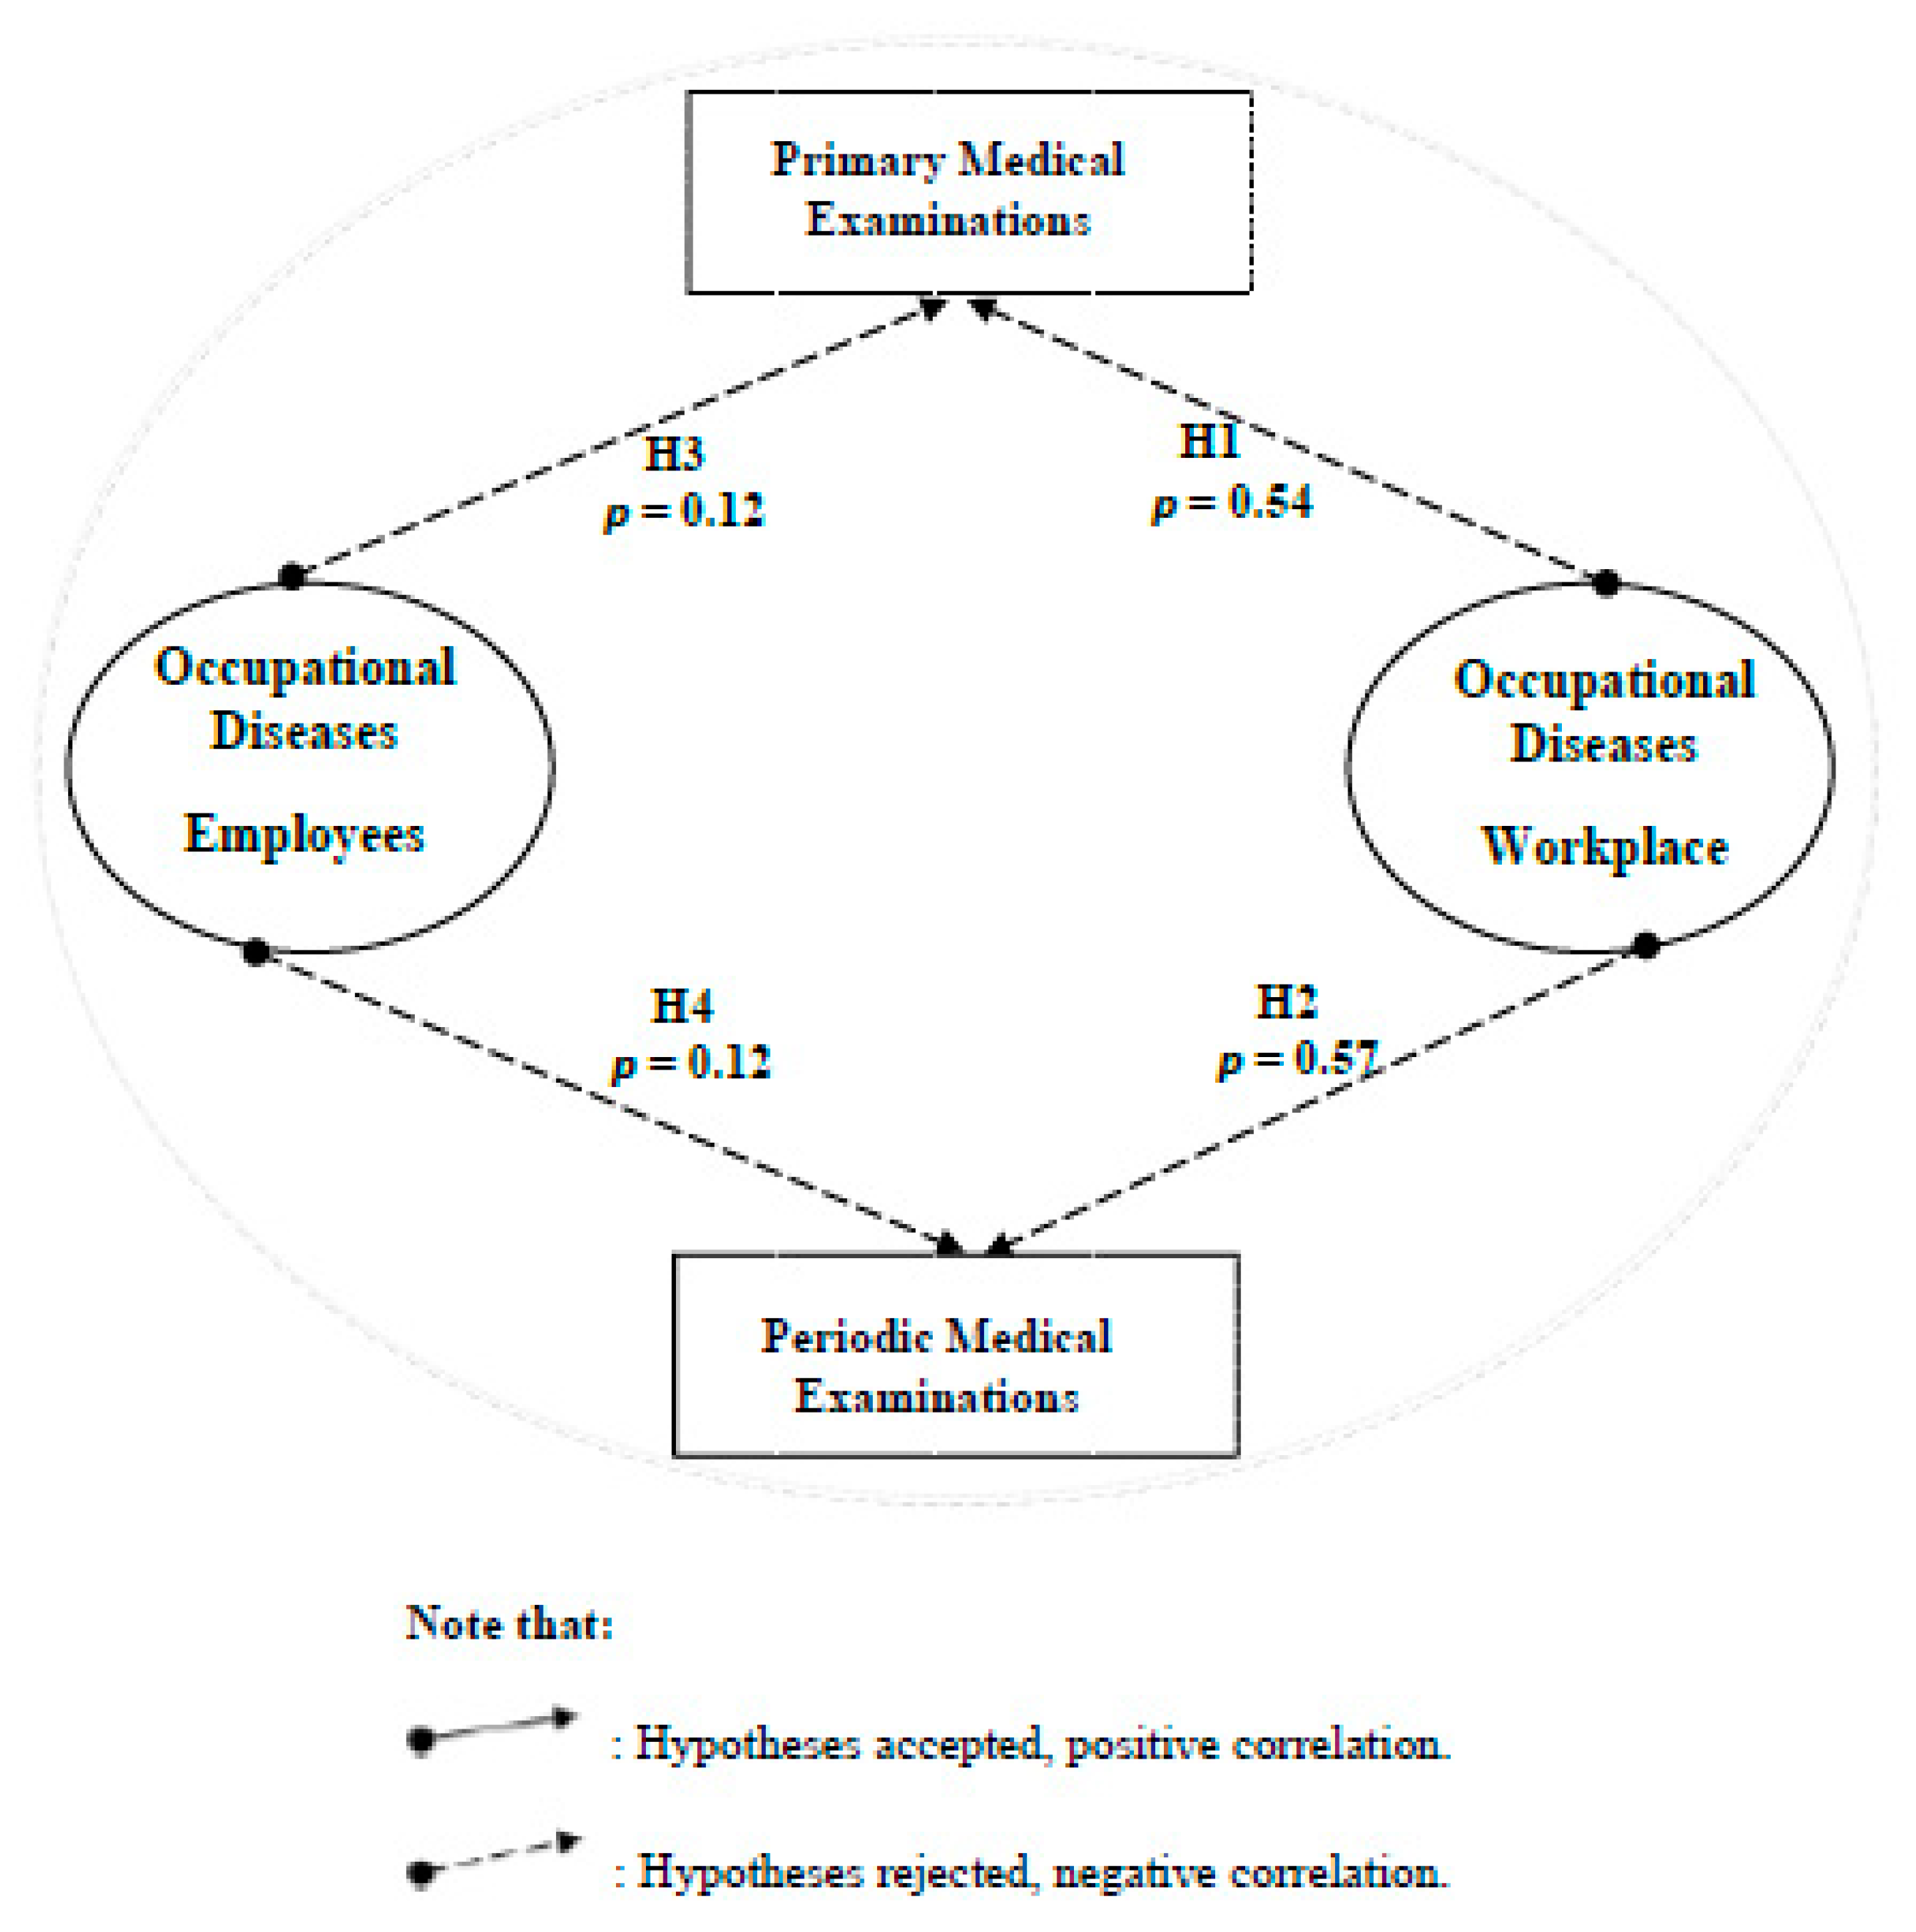
2.2.4. OSH Correlation
3. Results
3.1. Collected Data and Interviews’ Analyses
3.2. Questionnaires’Analysis
3.2.1. Survey Population
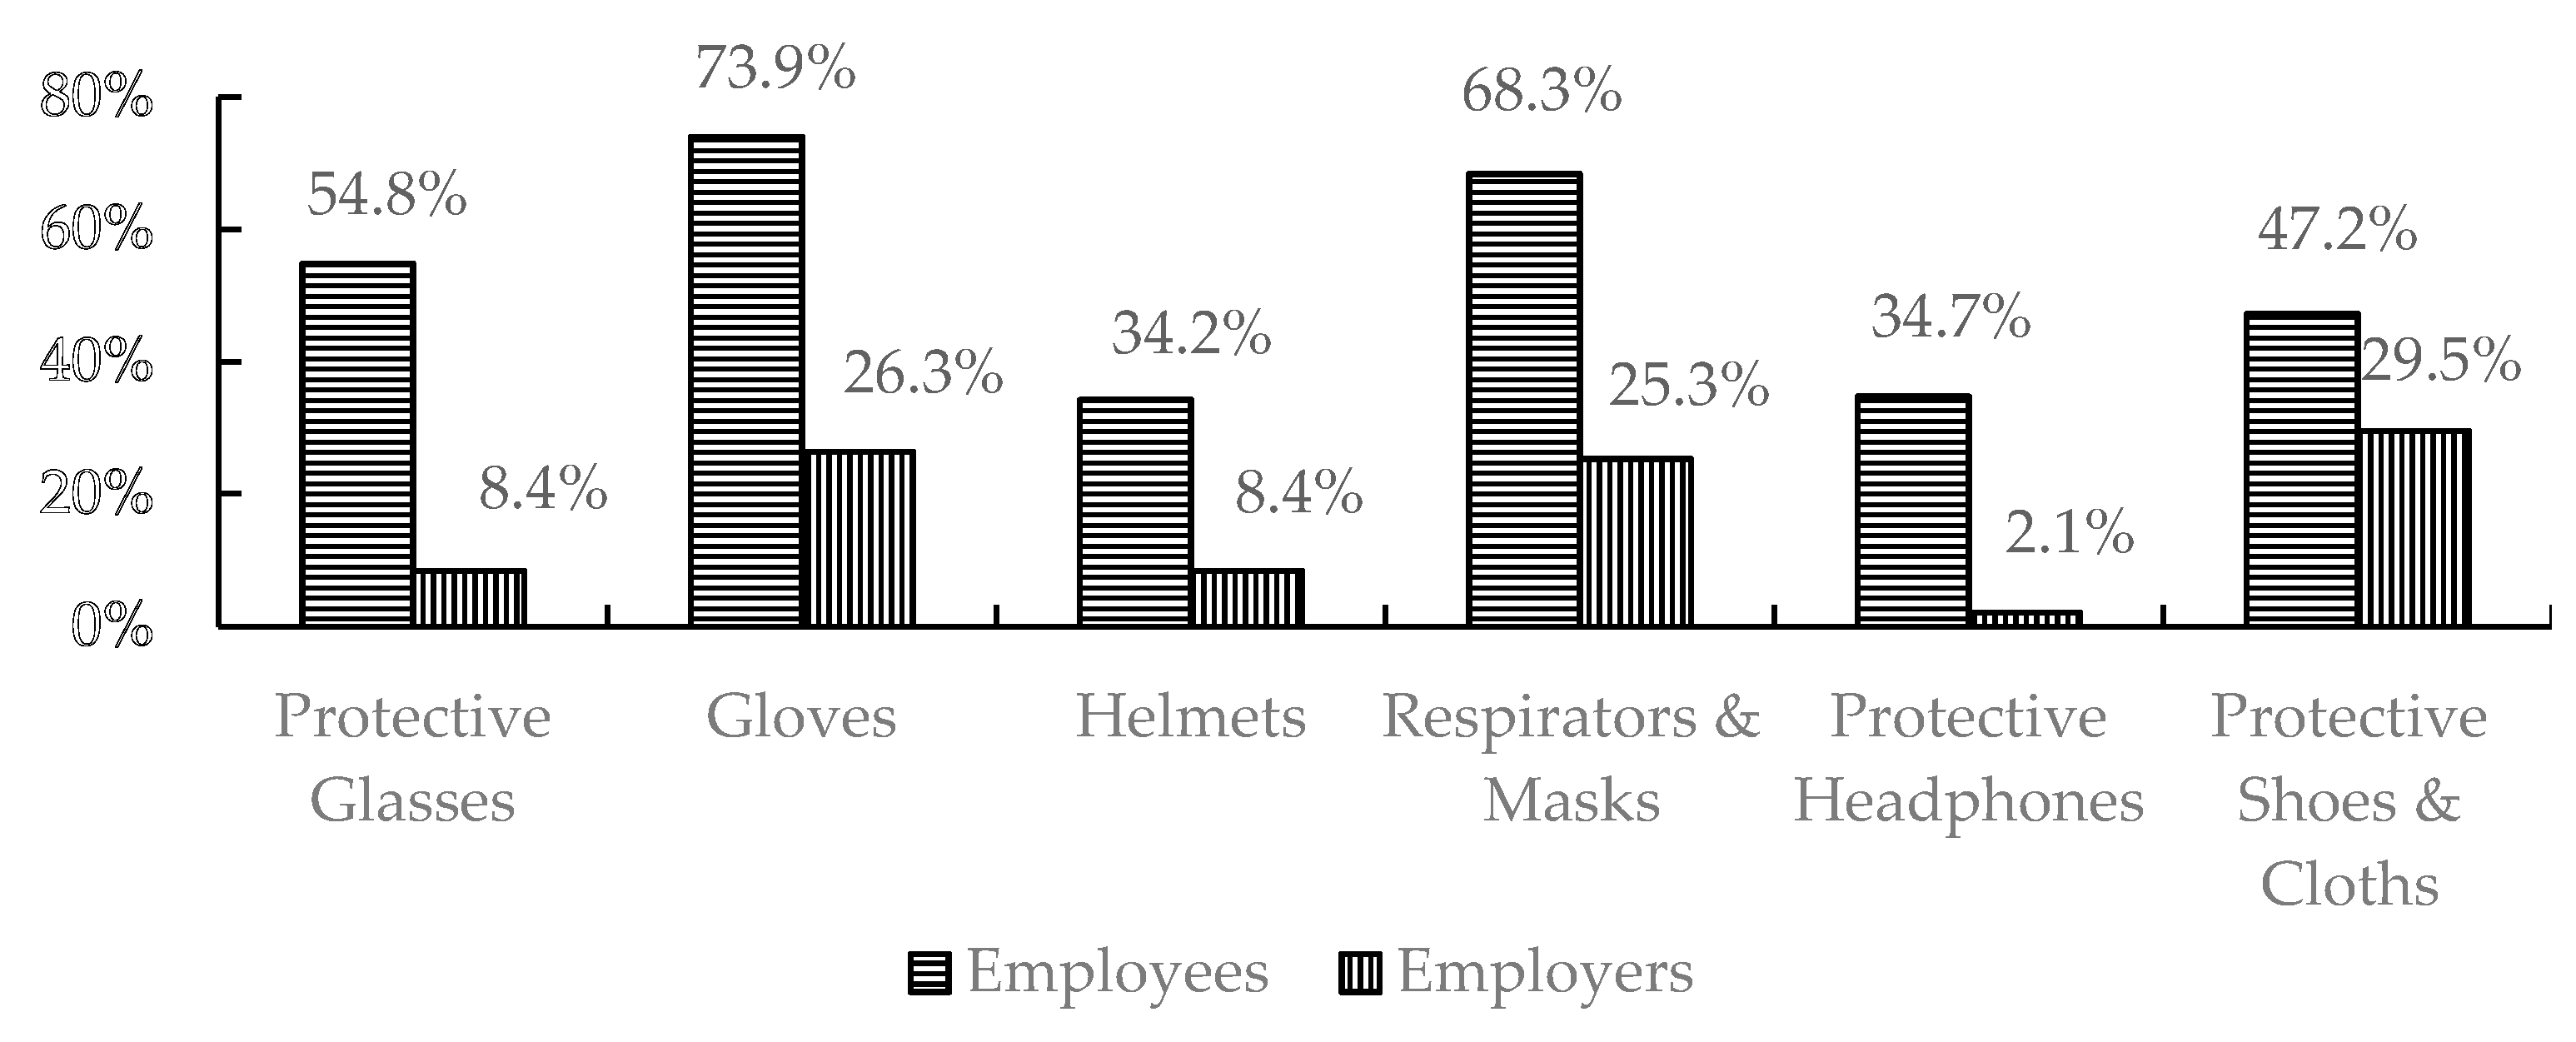
3.2.2. OSH Requirements and Tools
3.2.3. Exposure to Risk
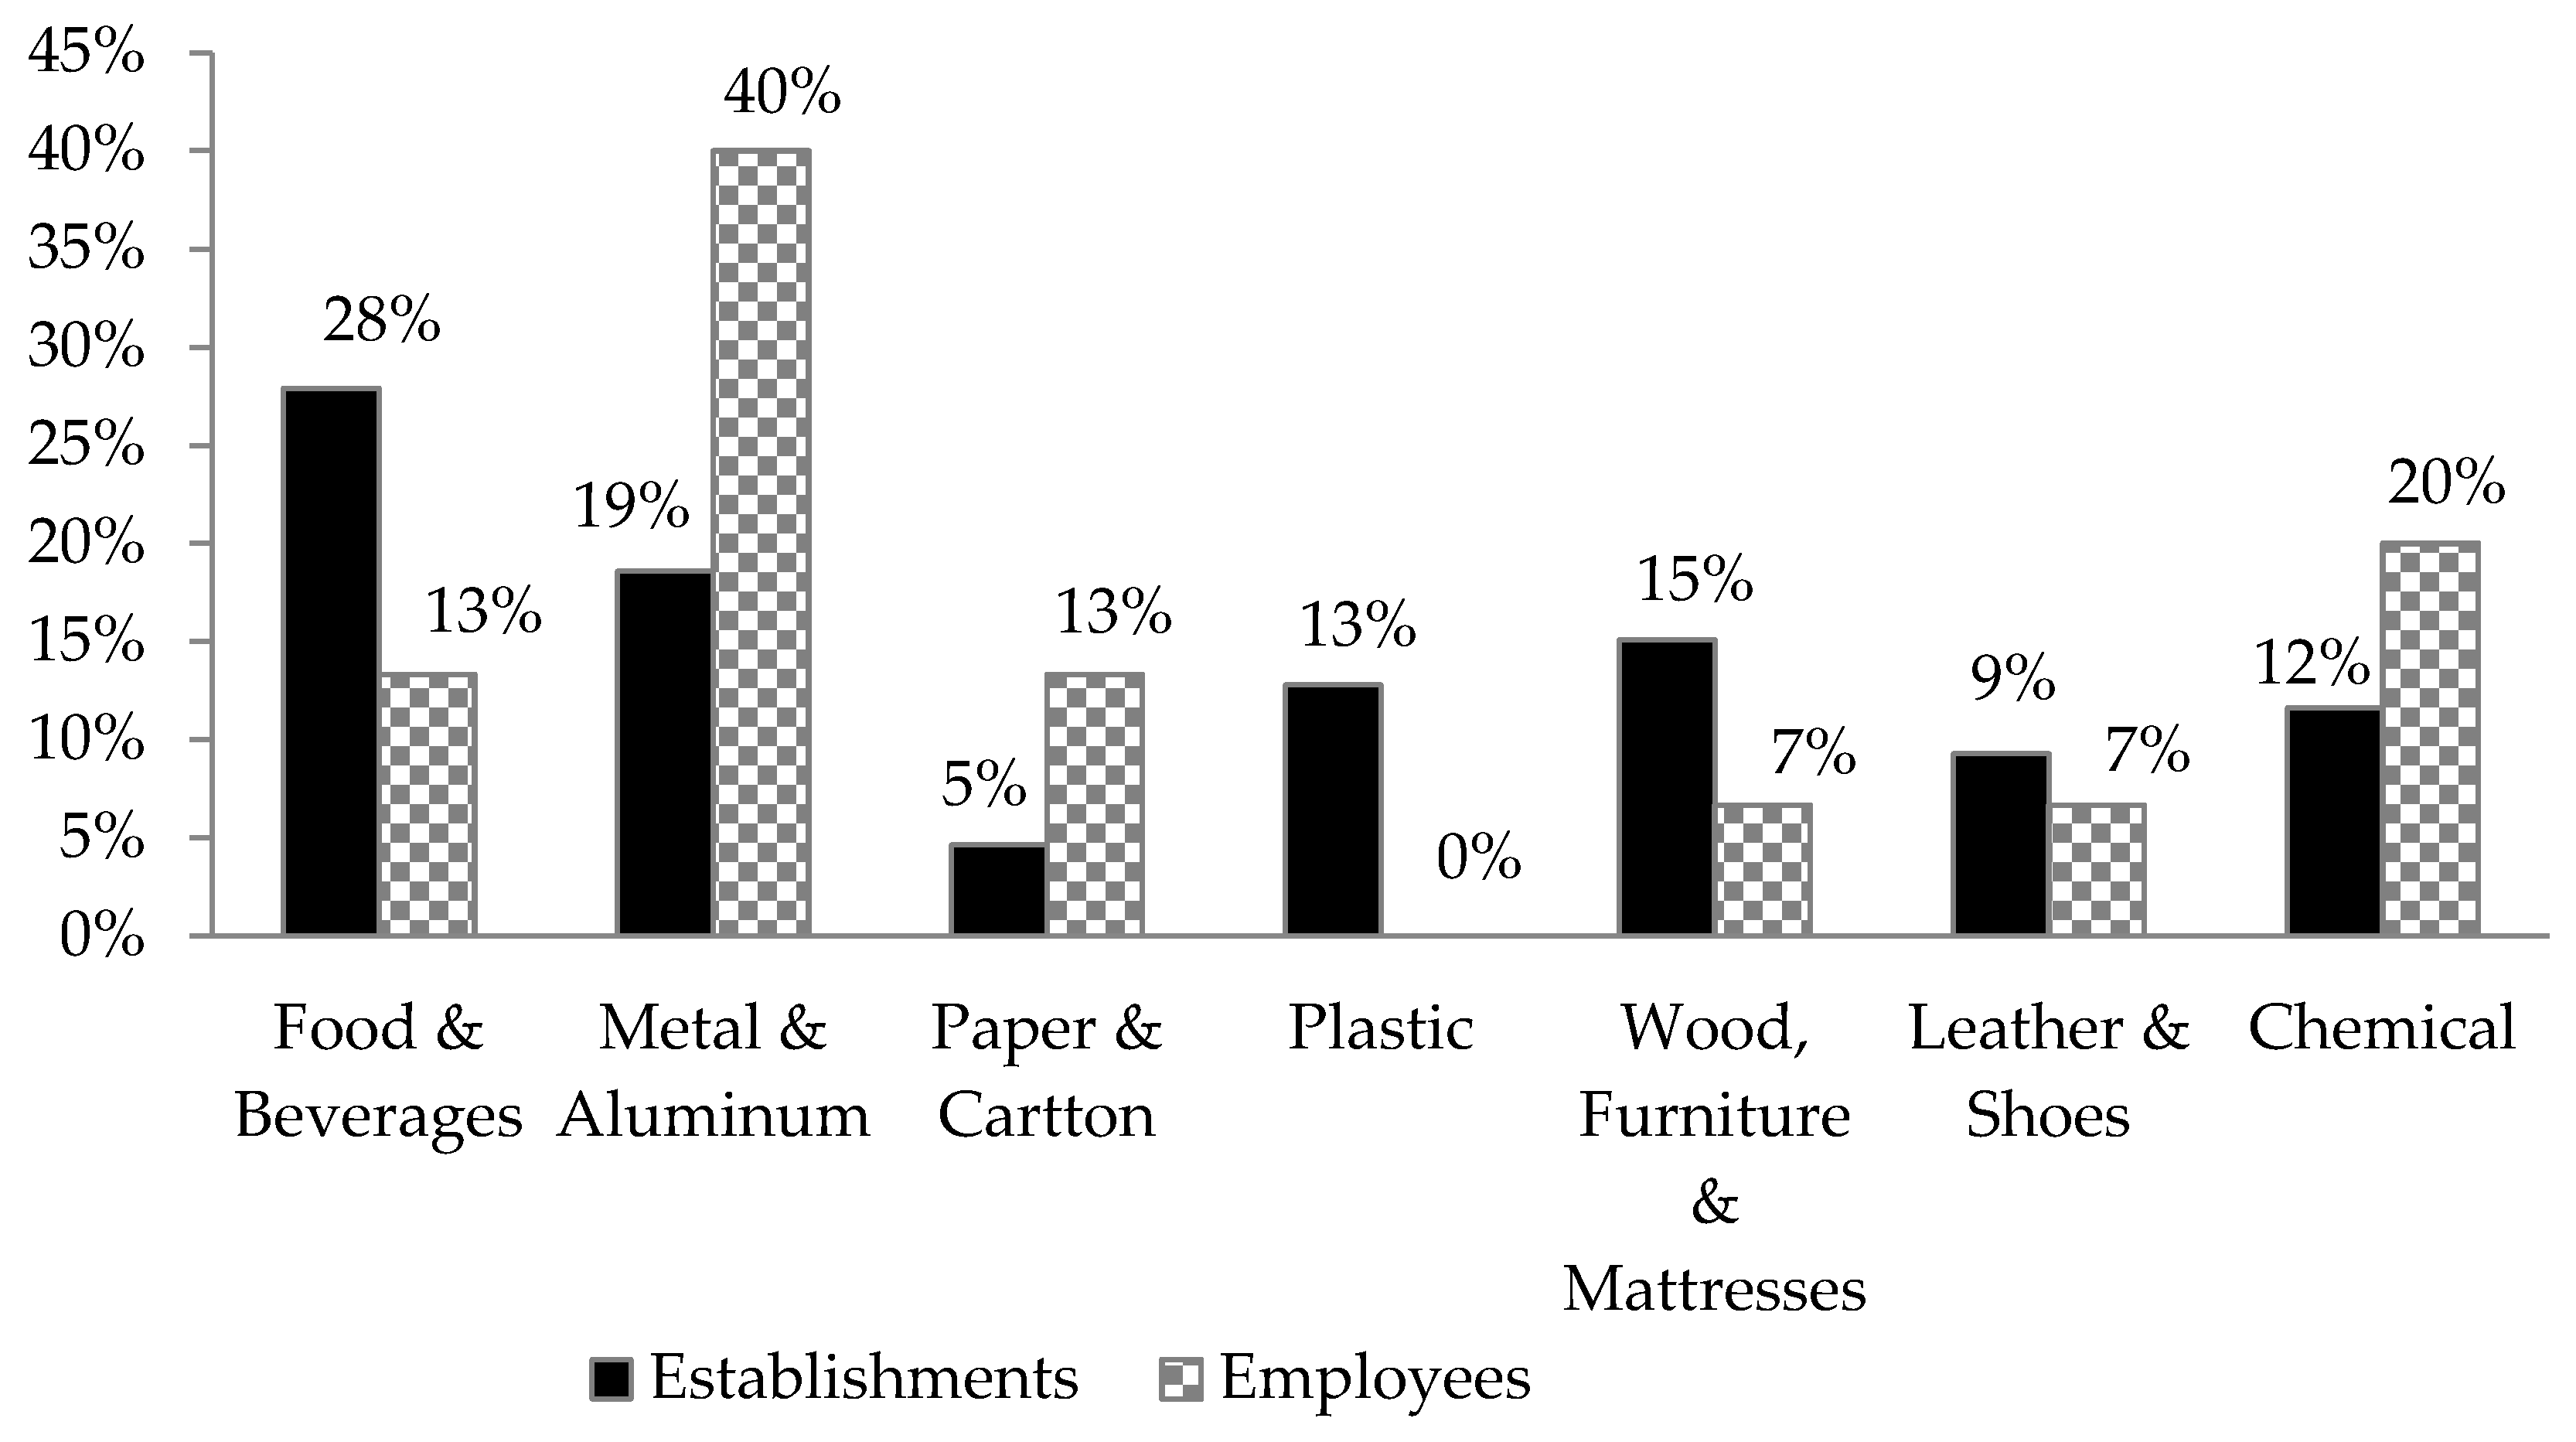
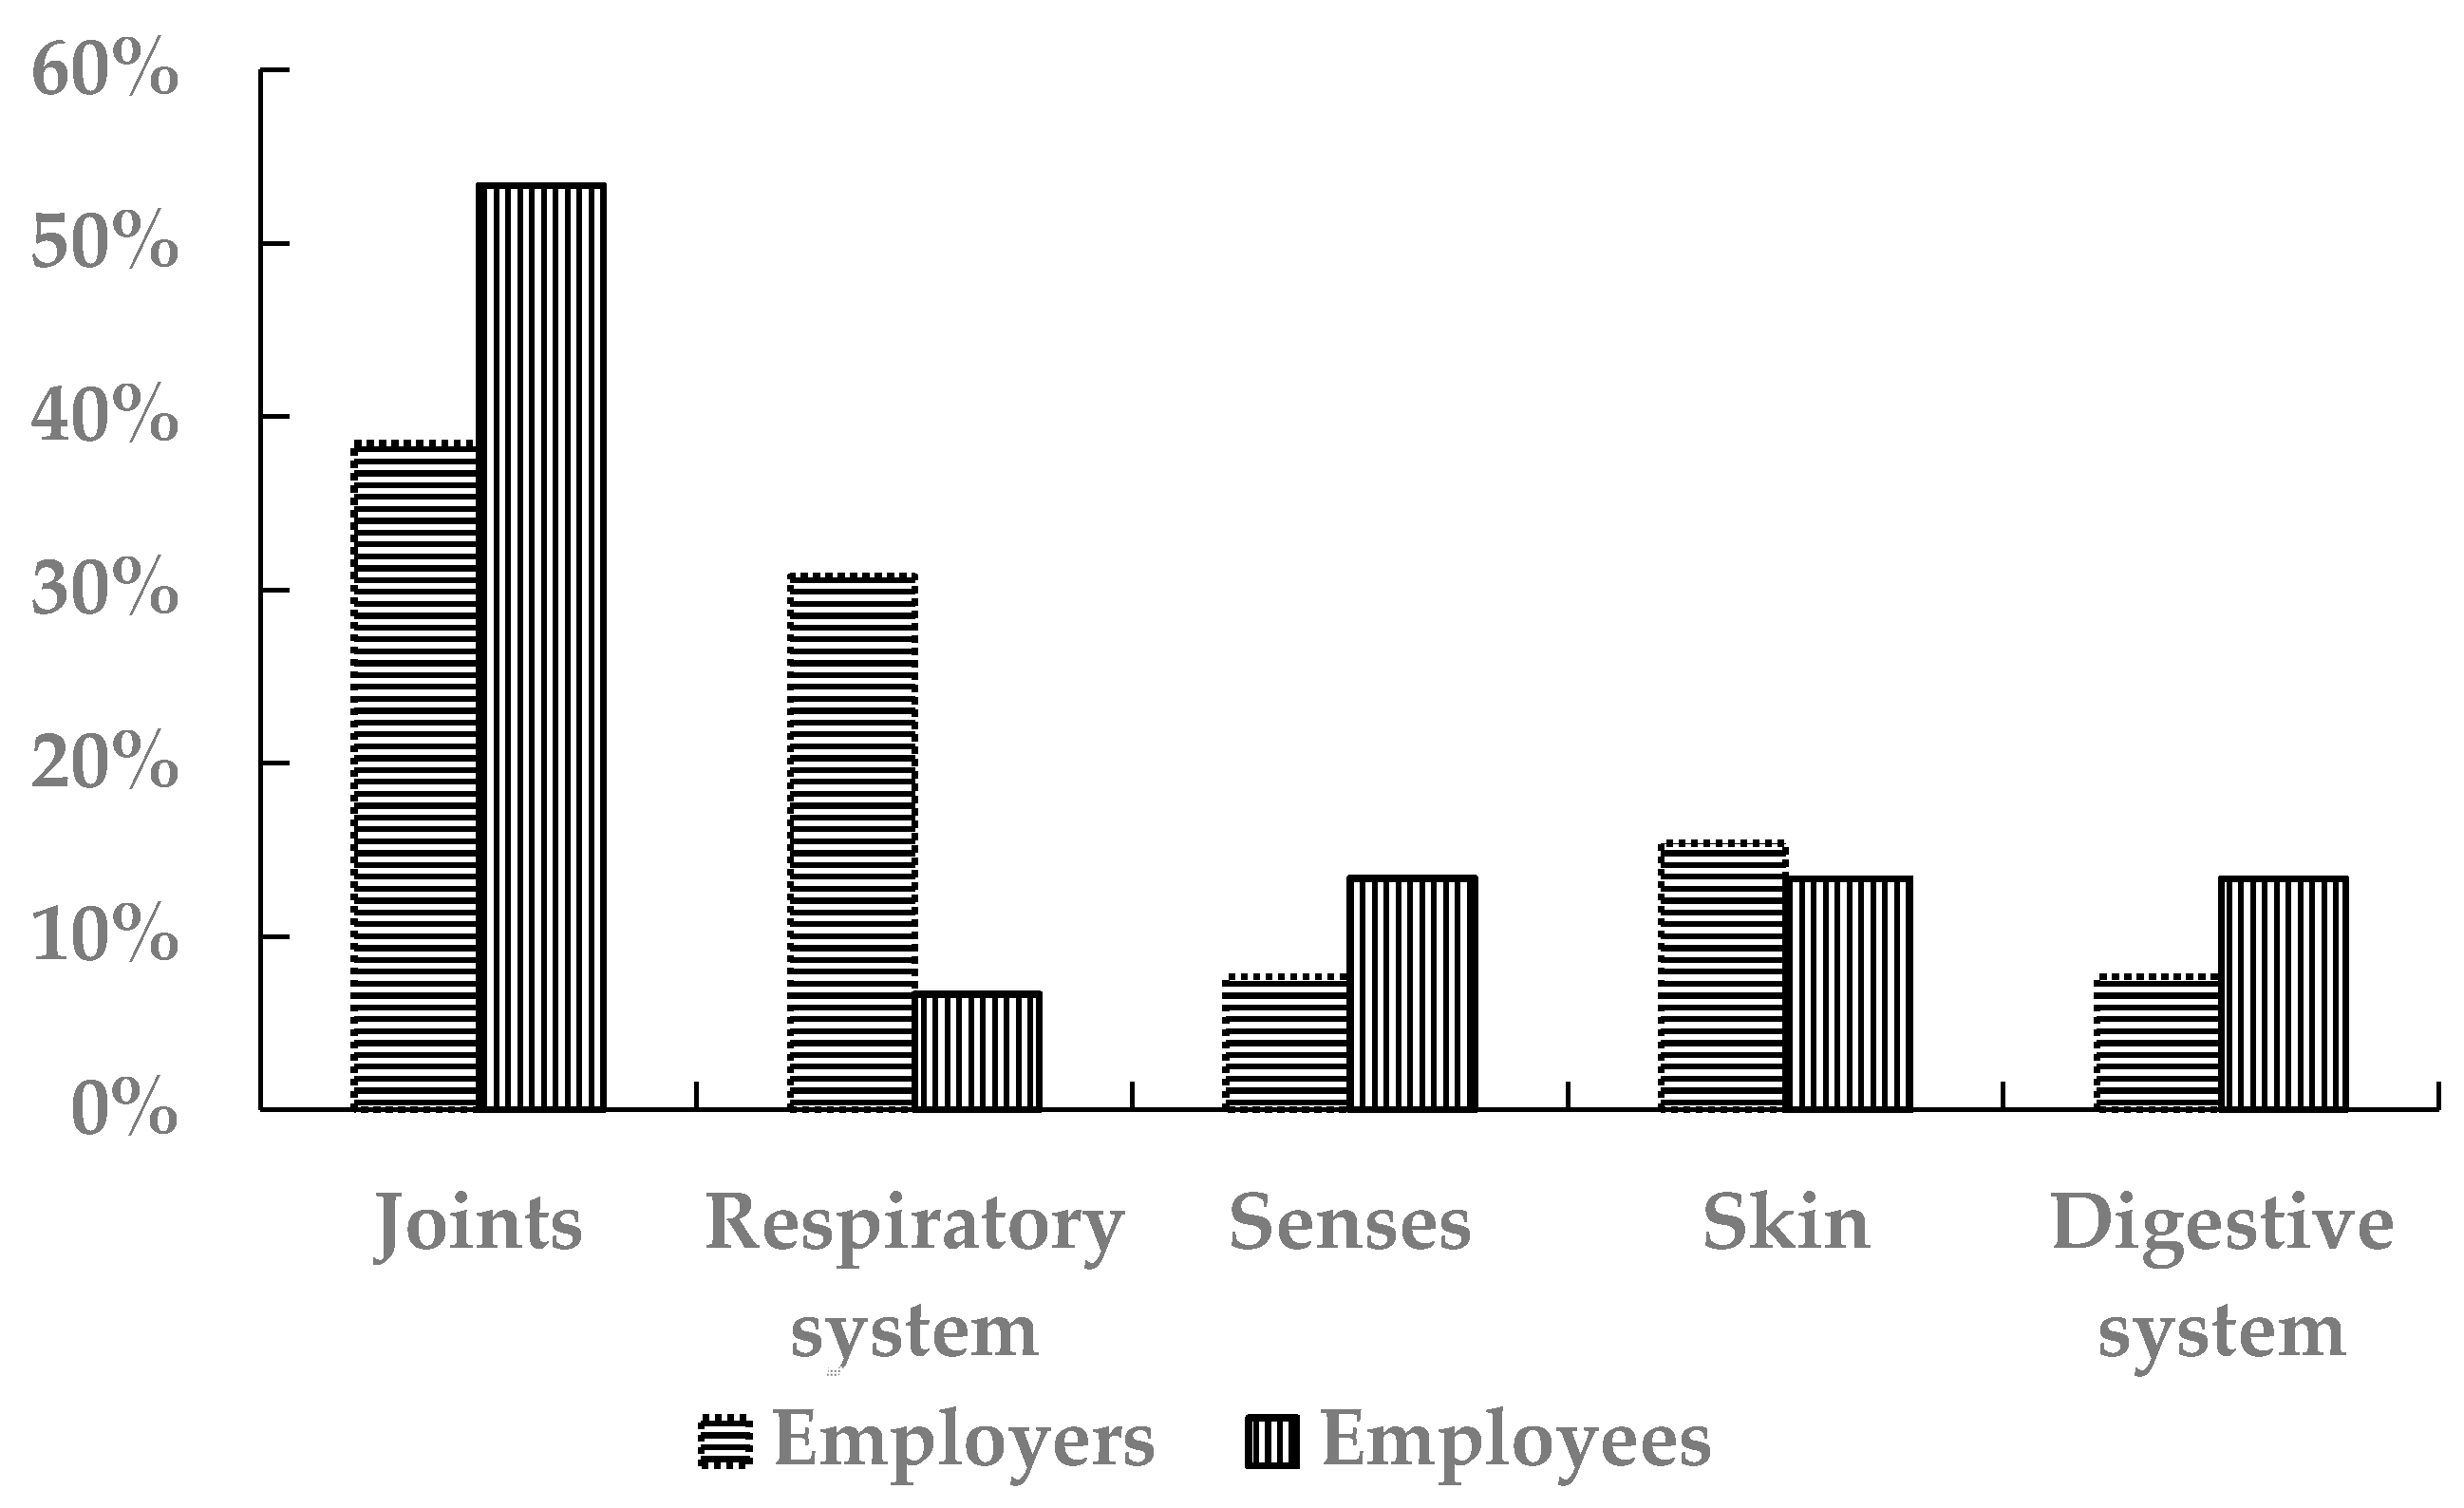
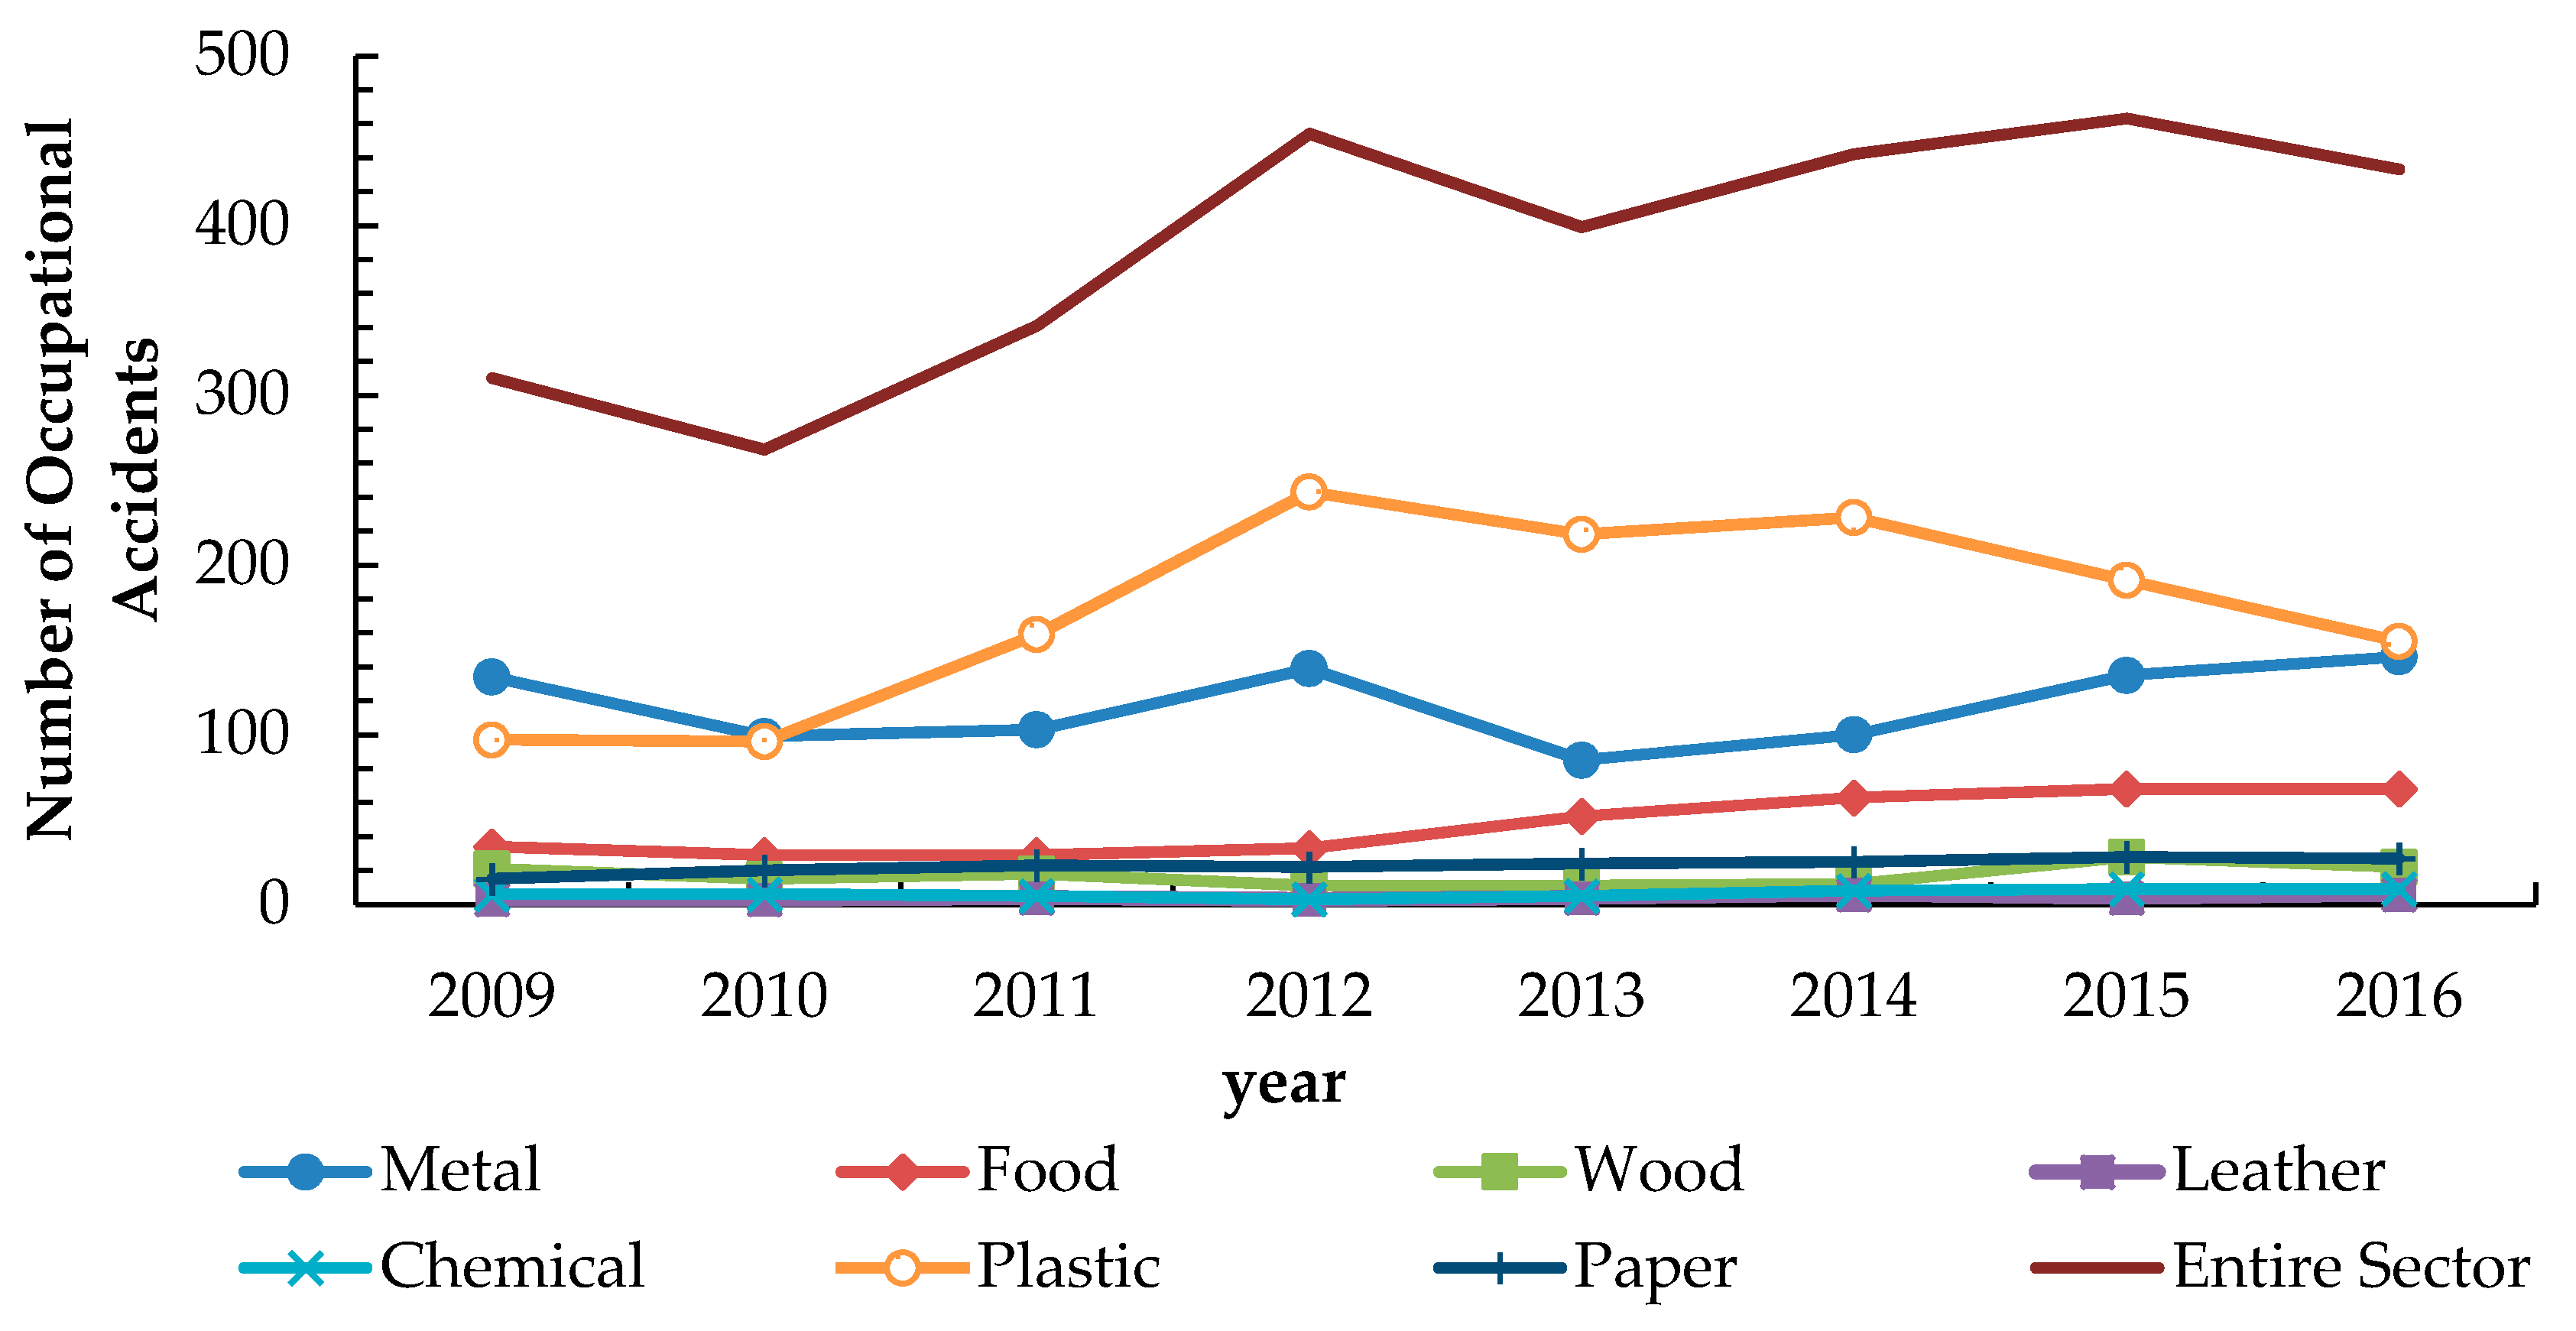
3.2.4. Occupational Accidents and Diseases
3.2.5. Accidents’ Causes
3.2.6. Lost Working Days
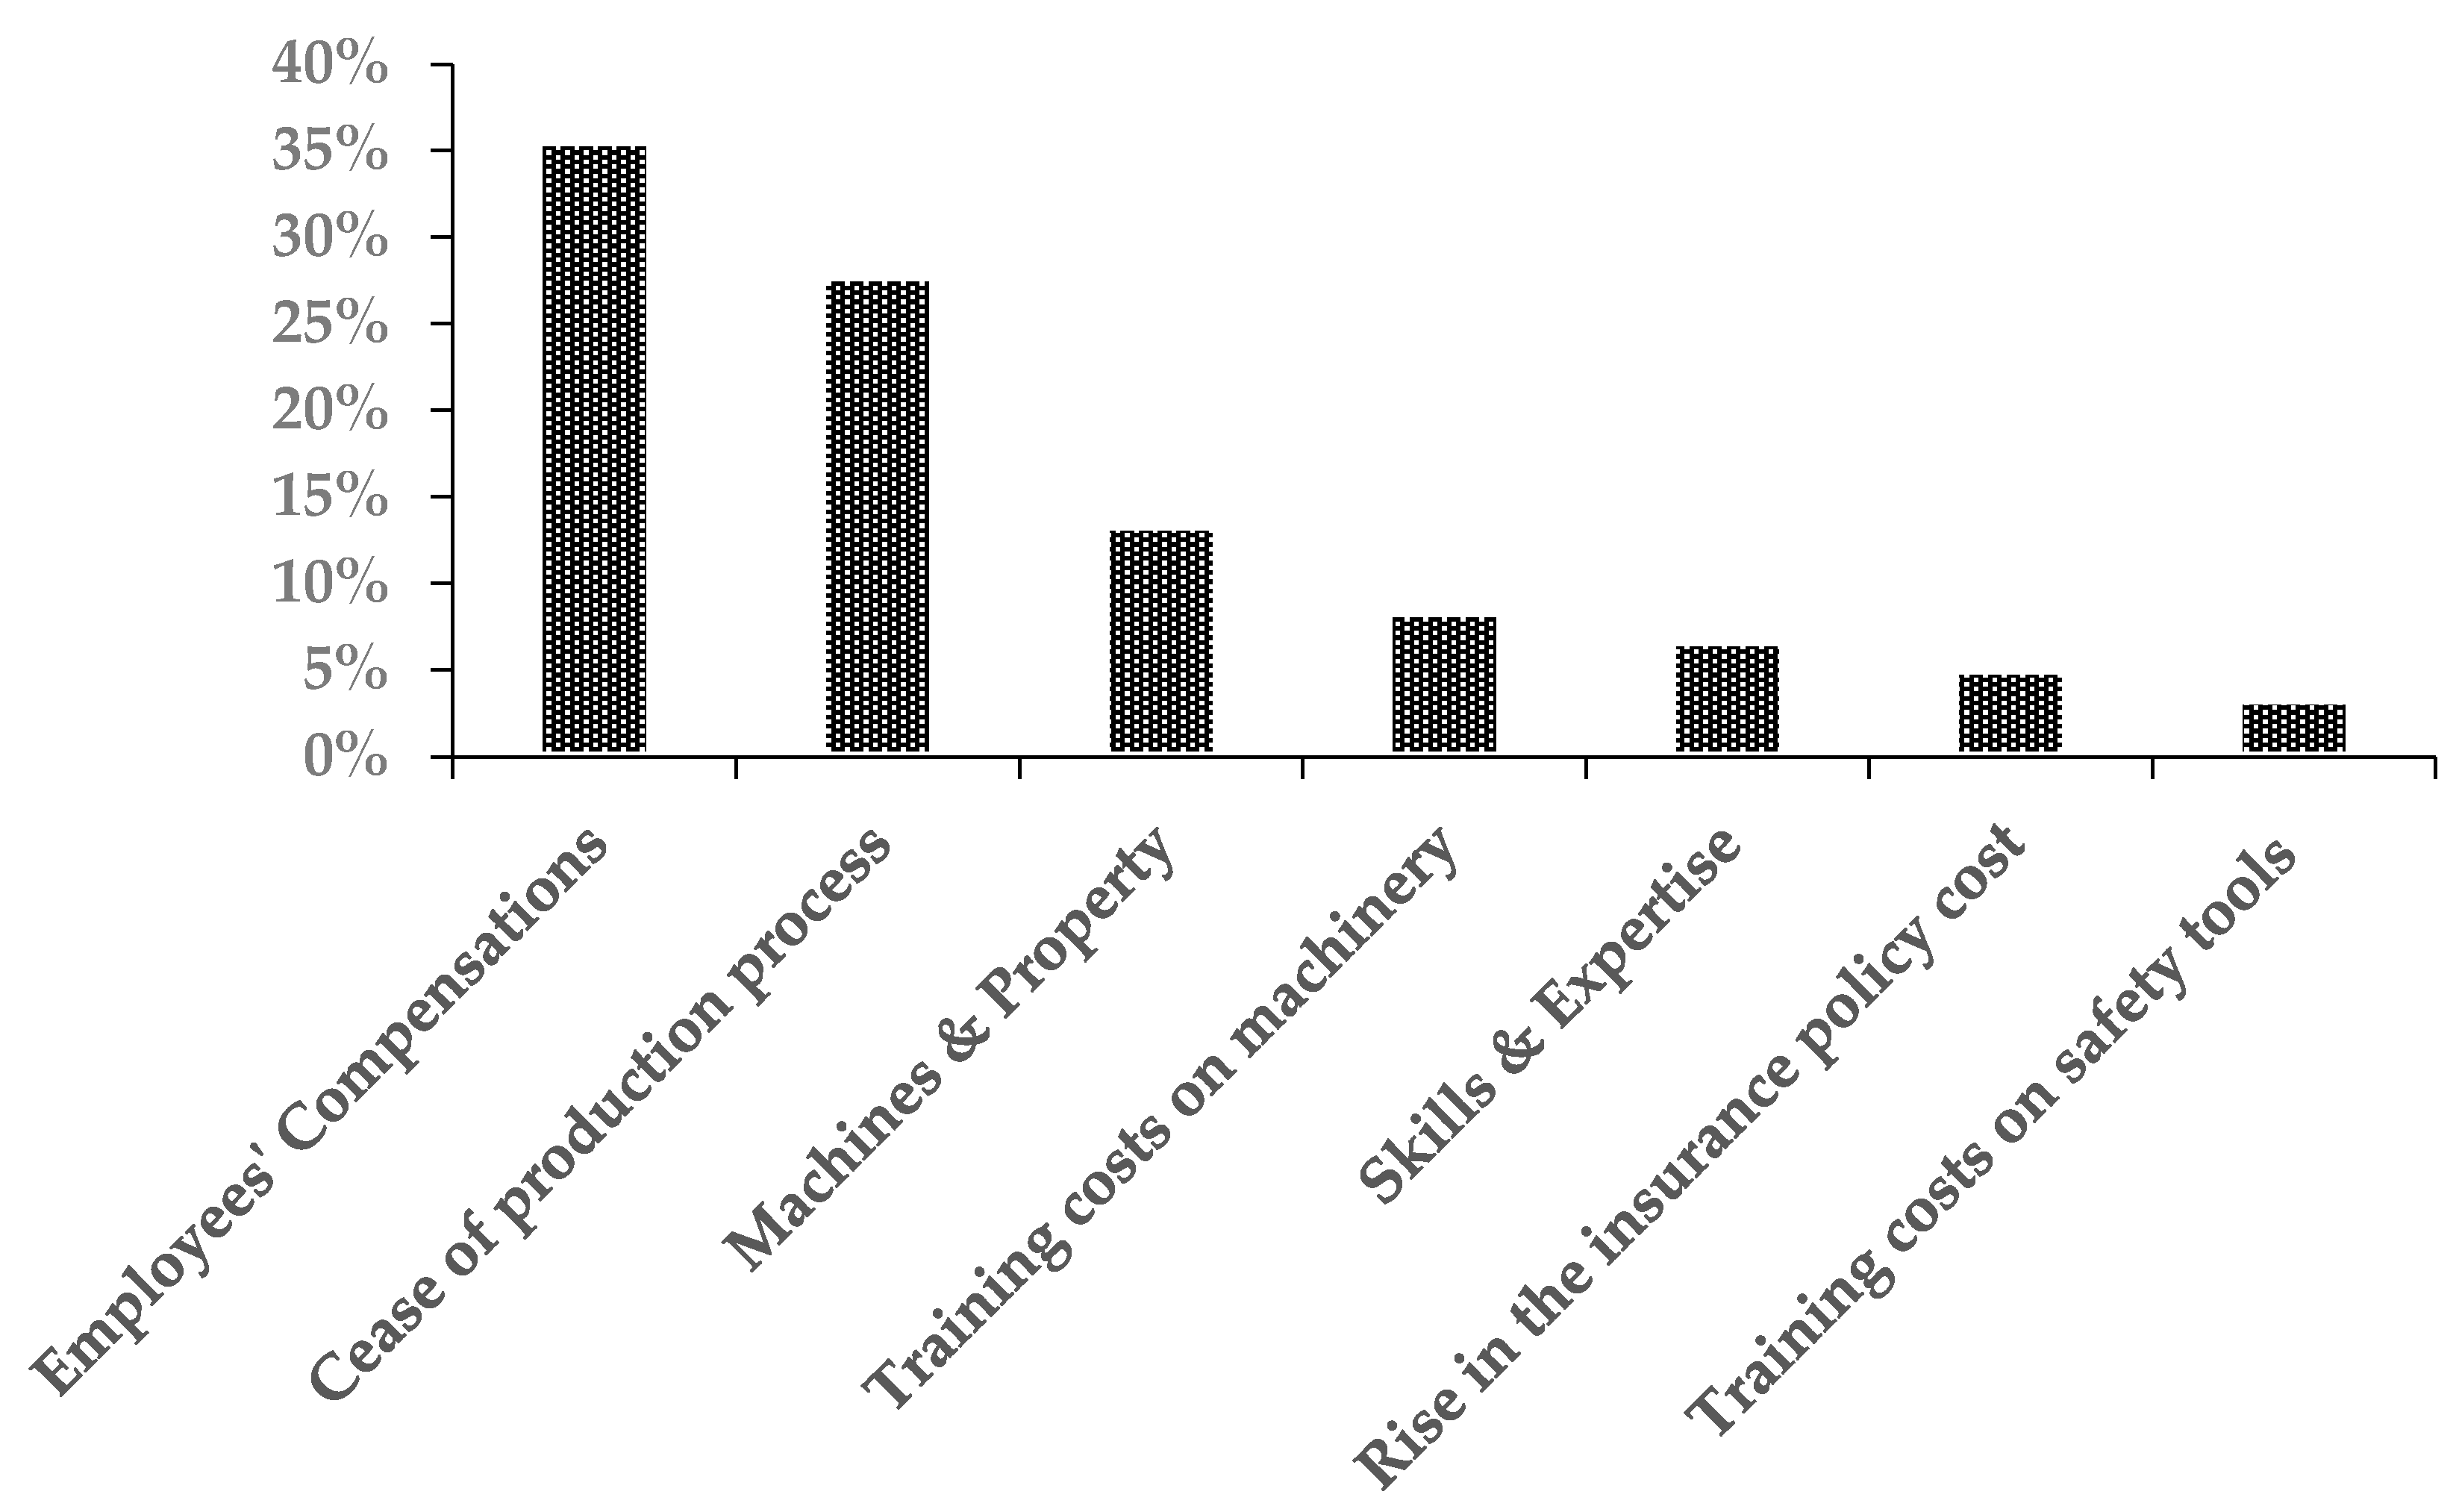
3.2.7. Financial Losses
3.2.8. External Investigation
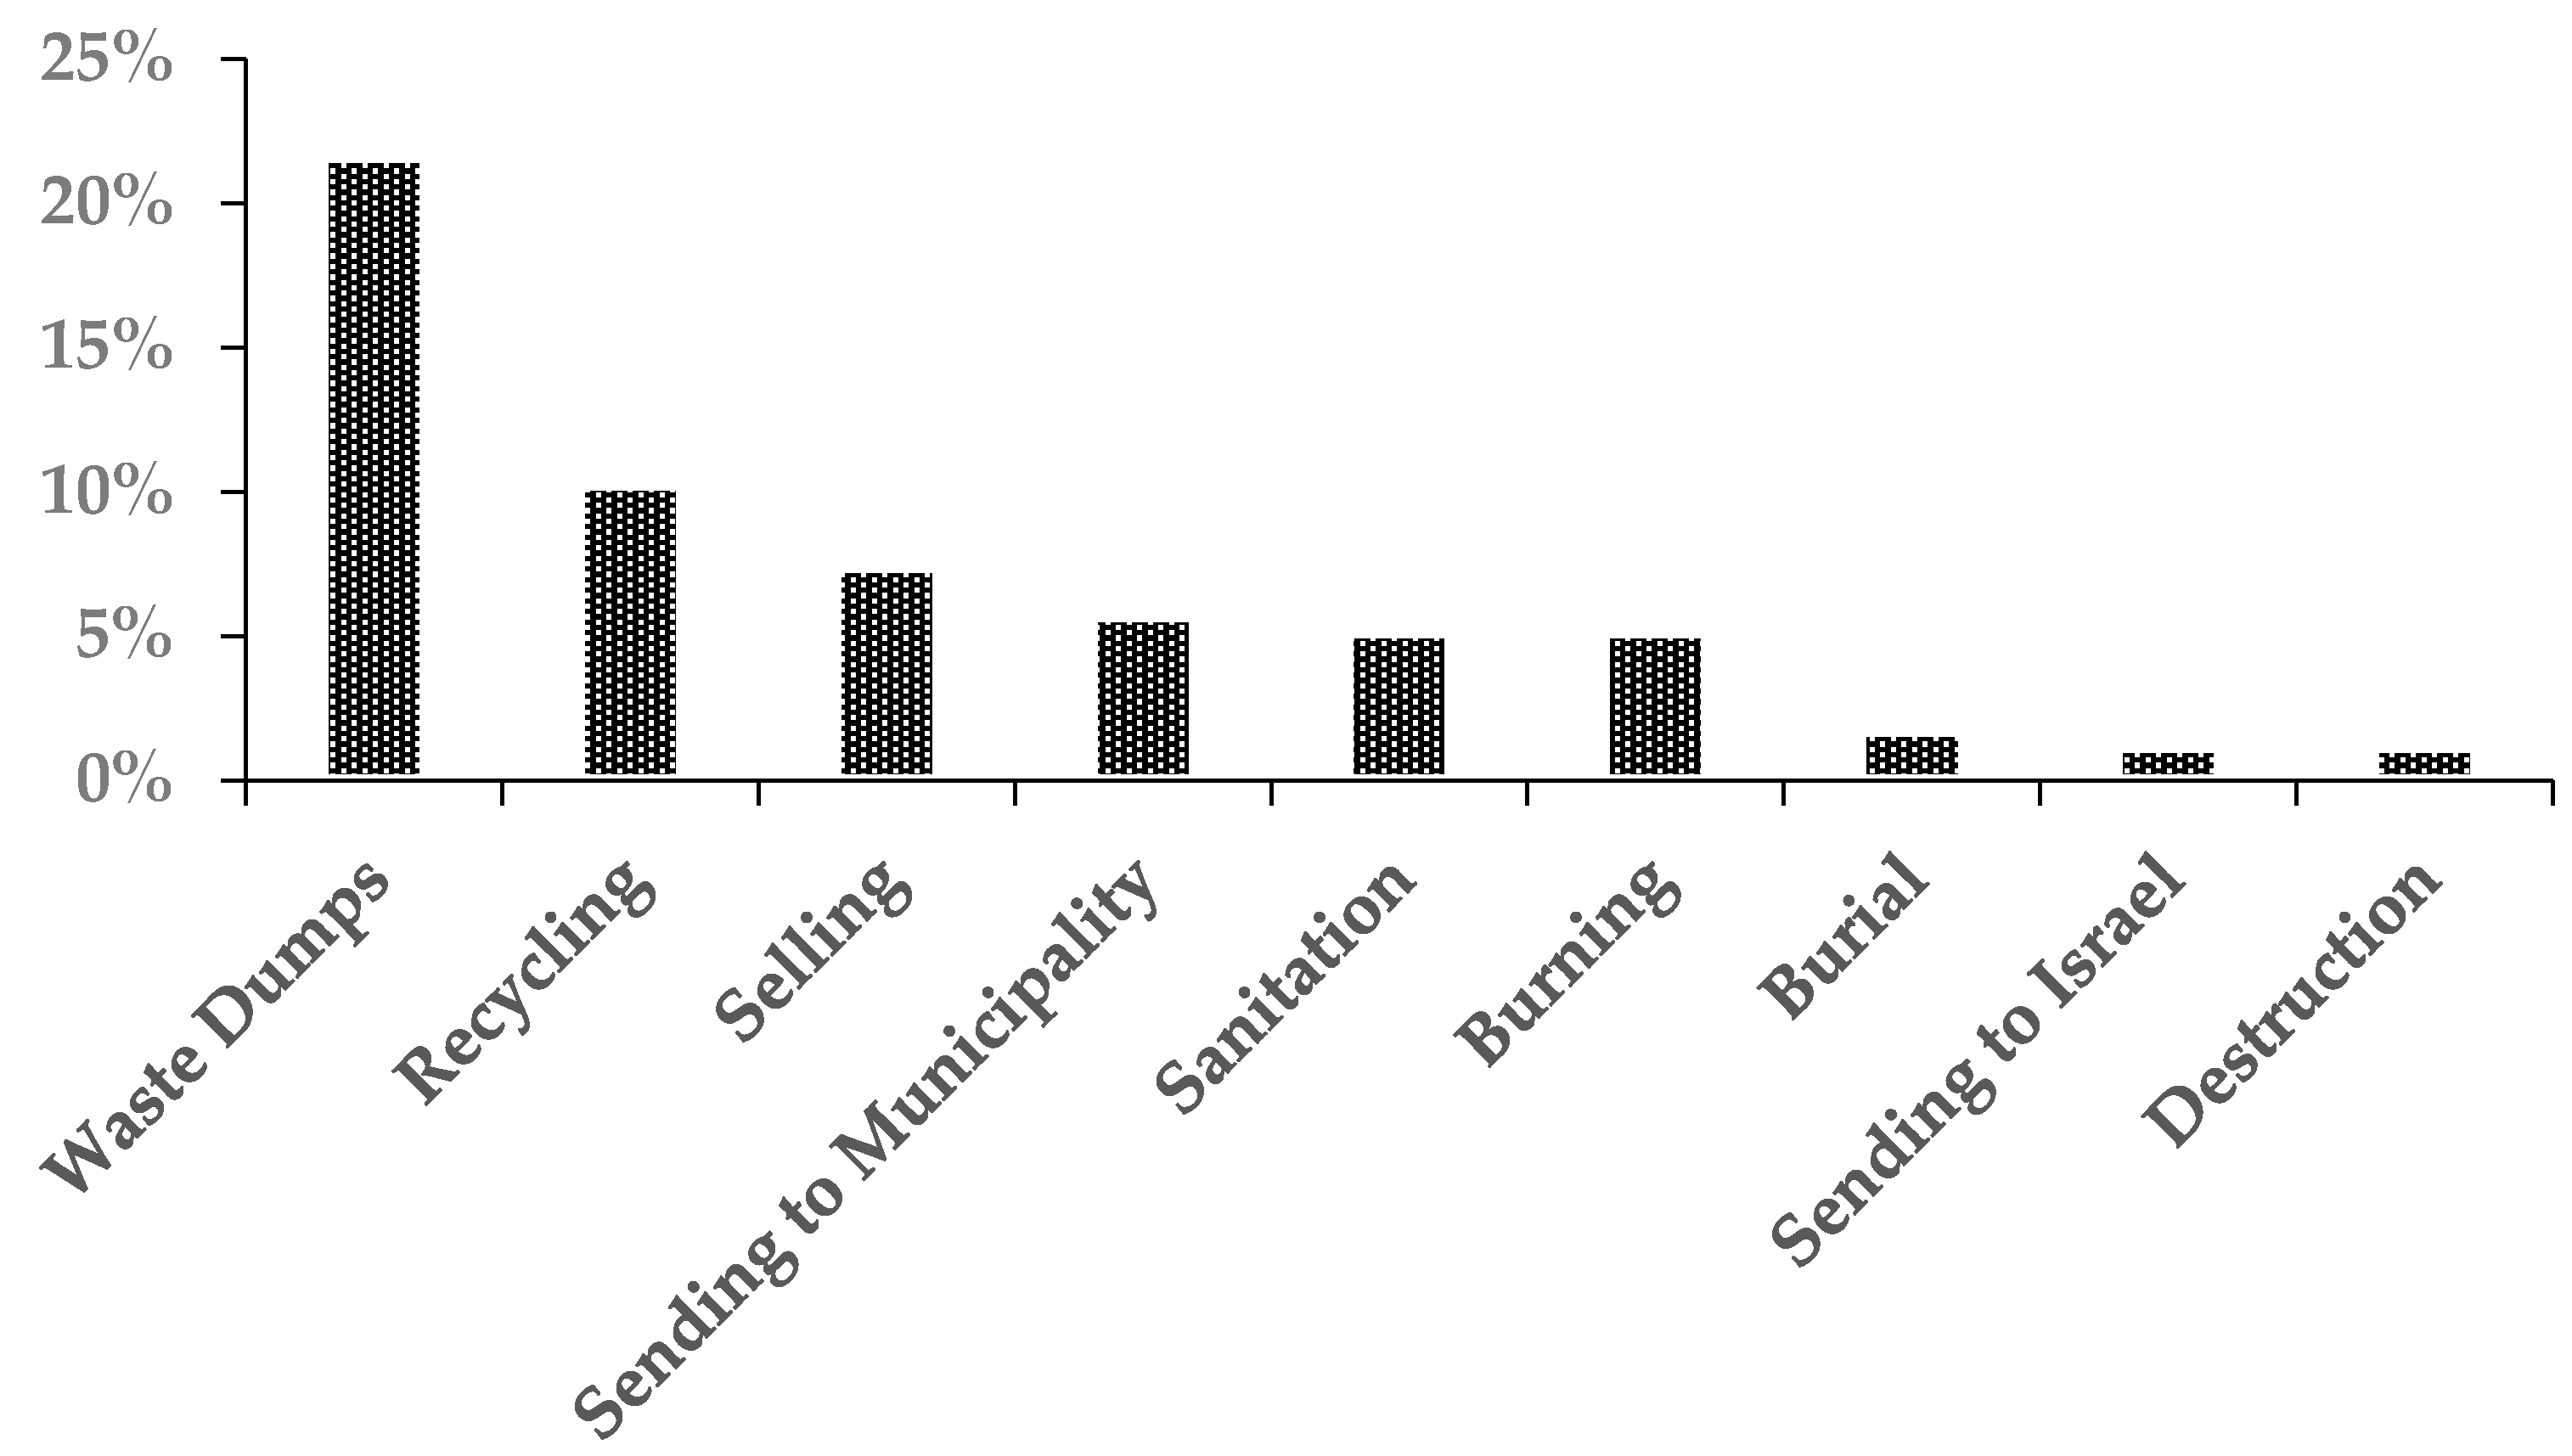
3.2.9. Environmental Considerations
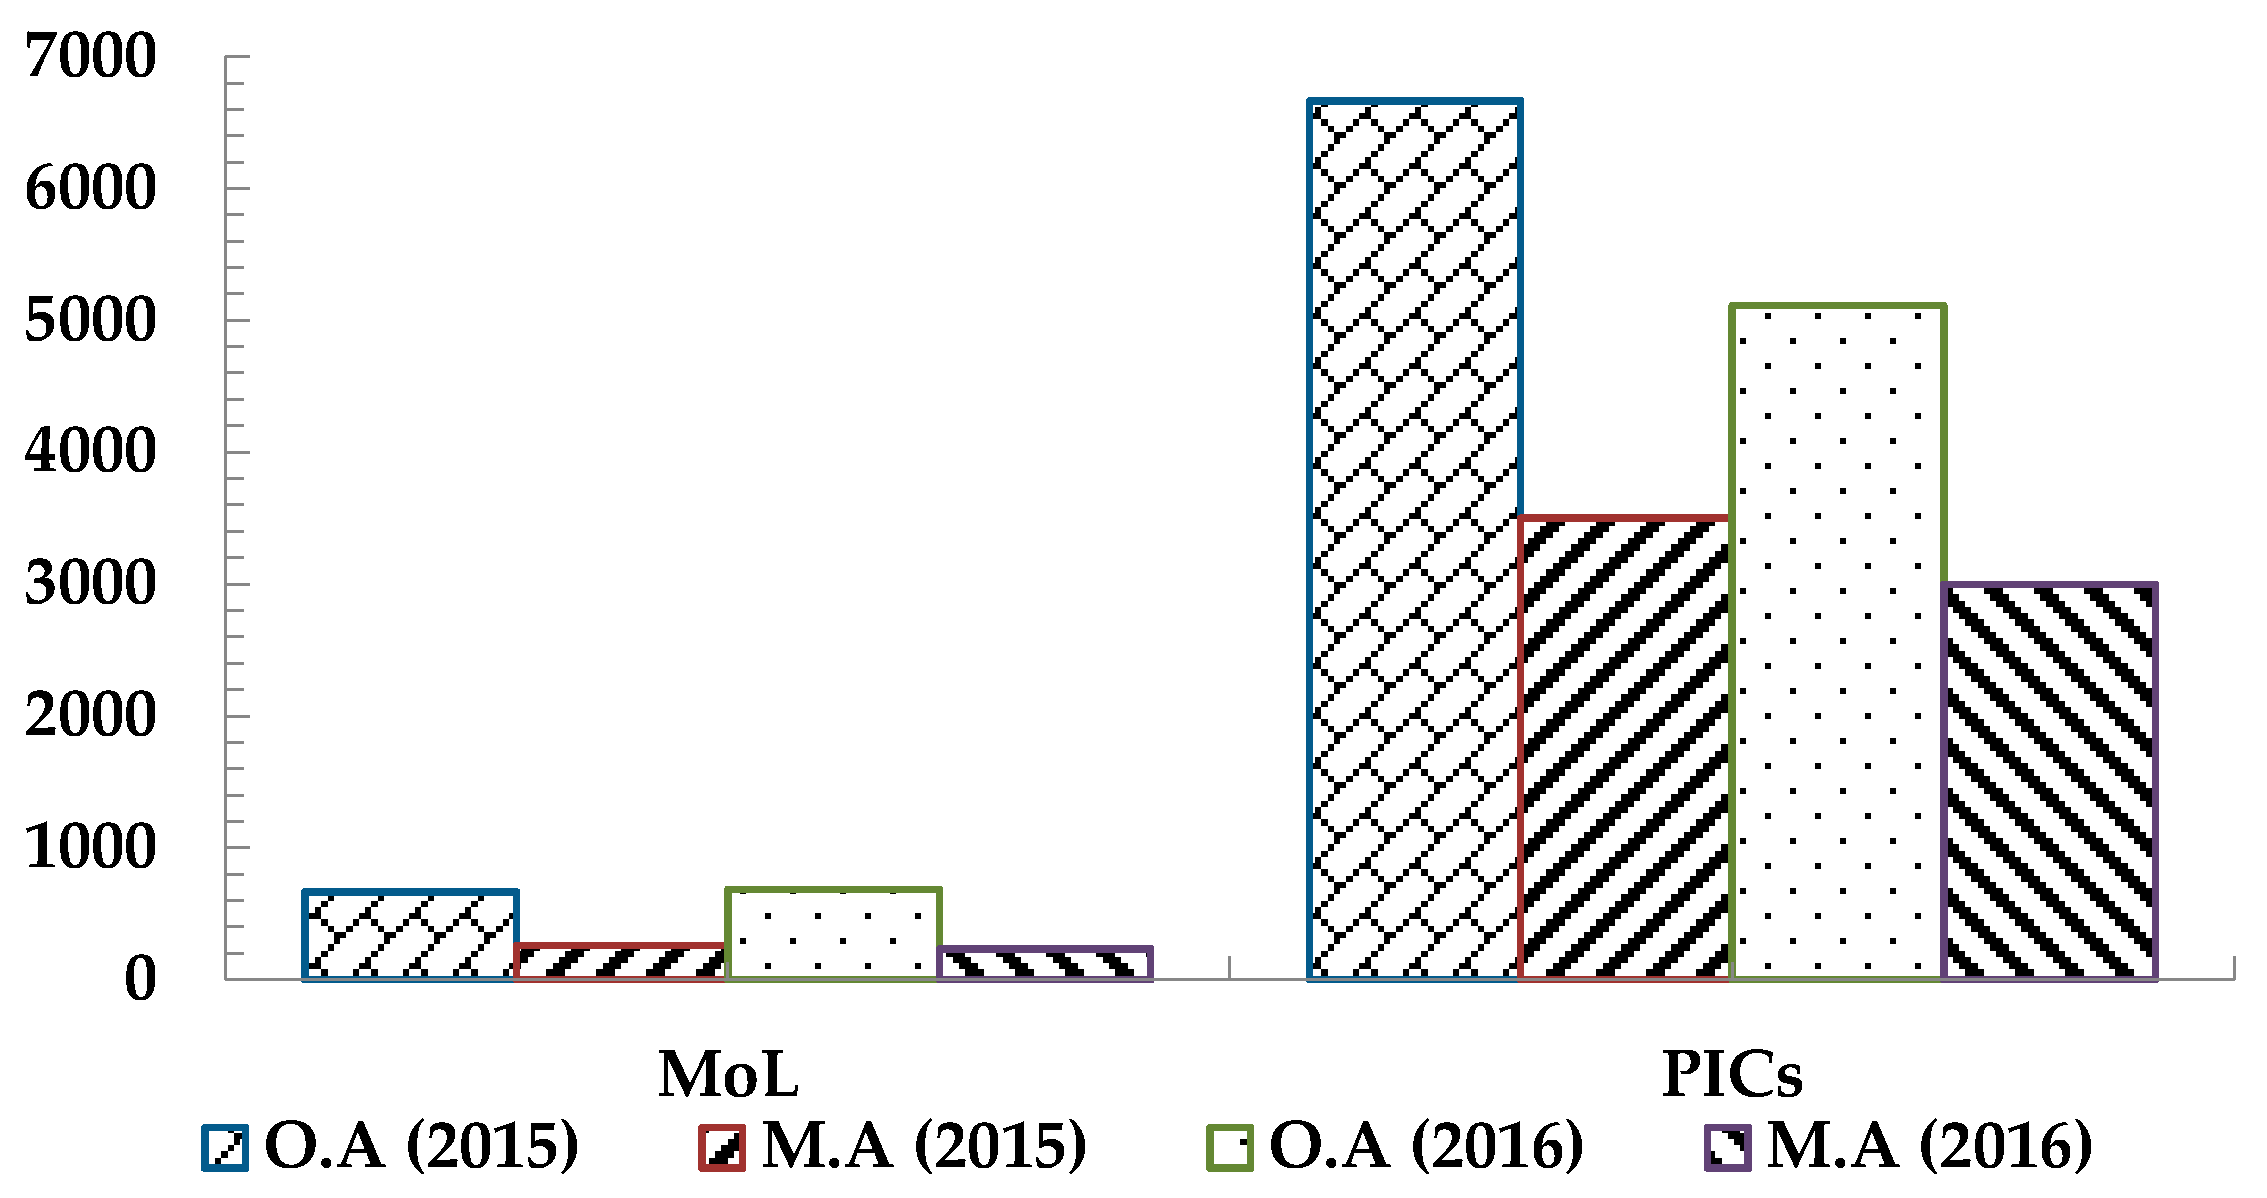
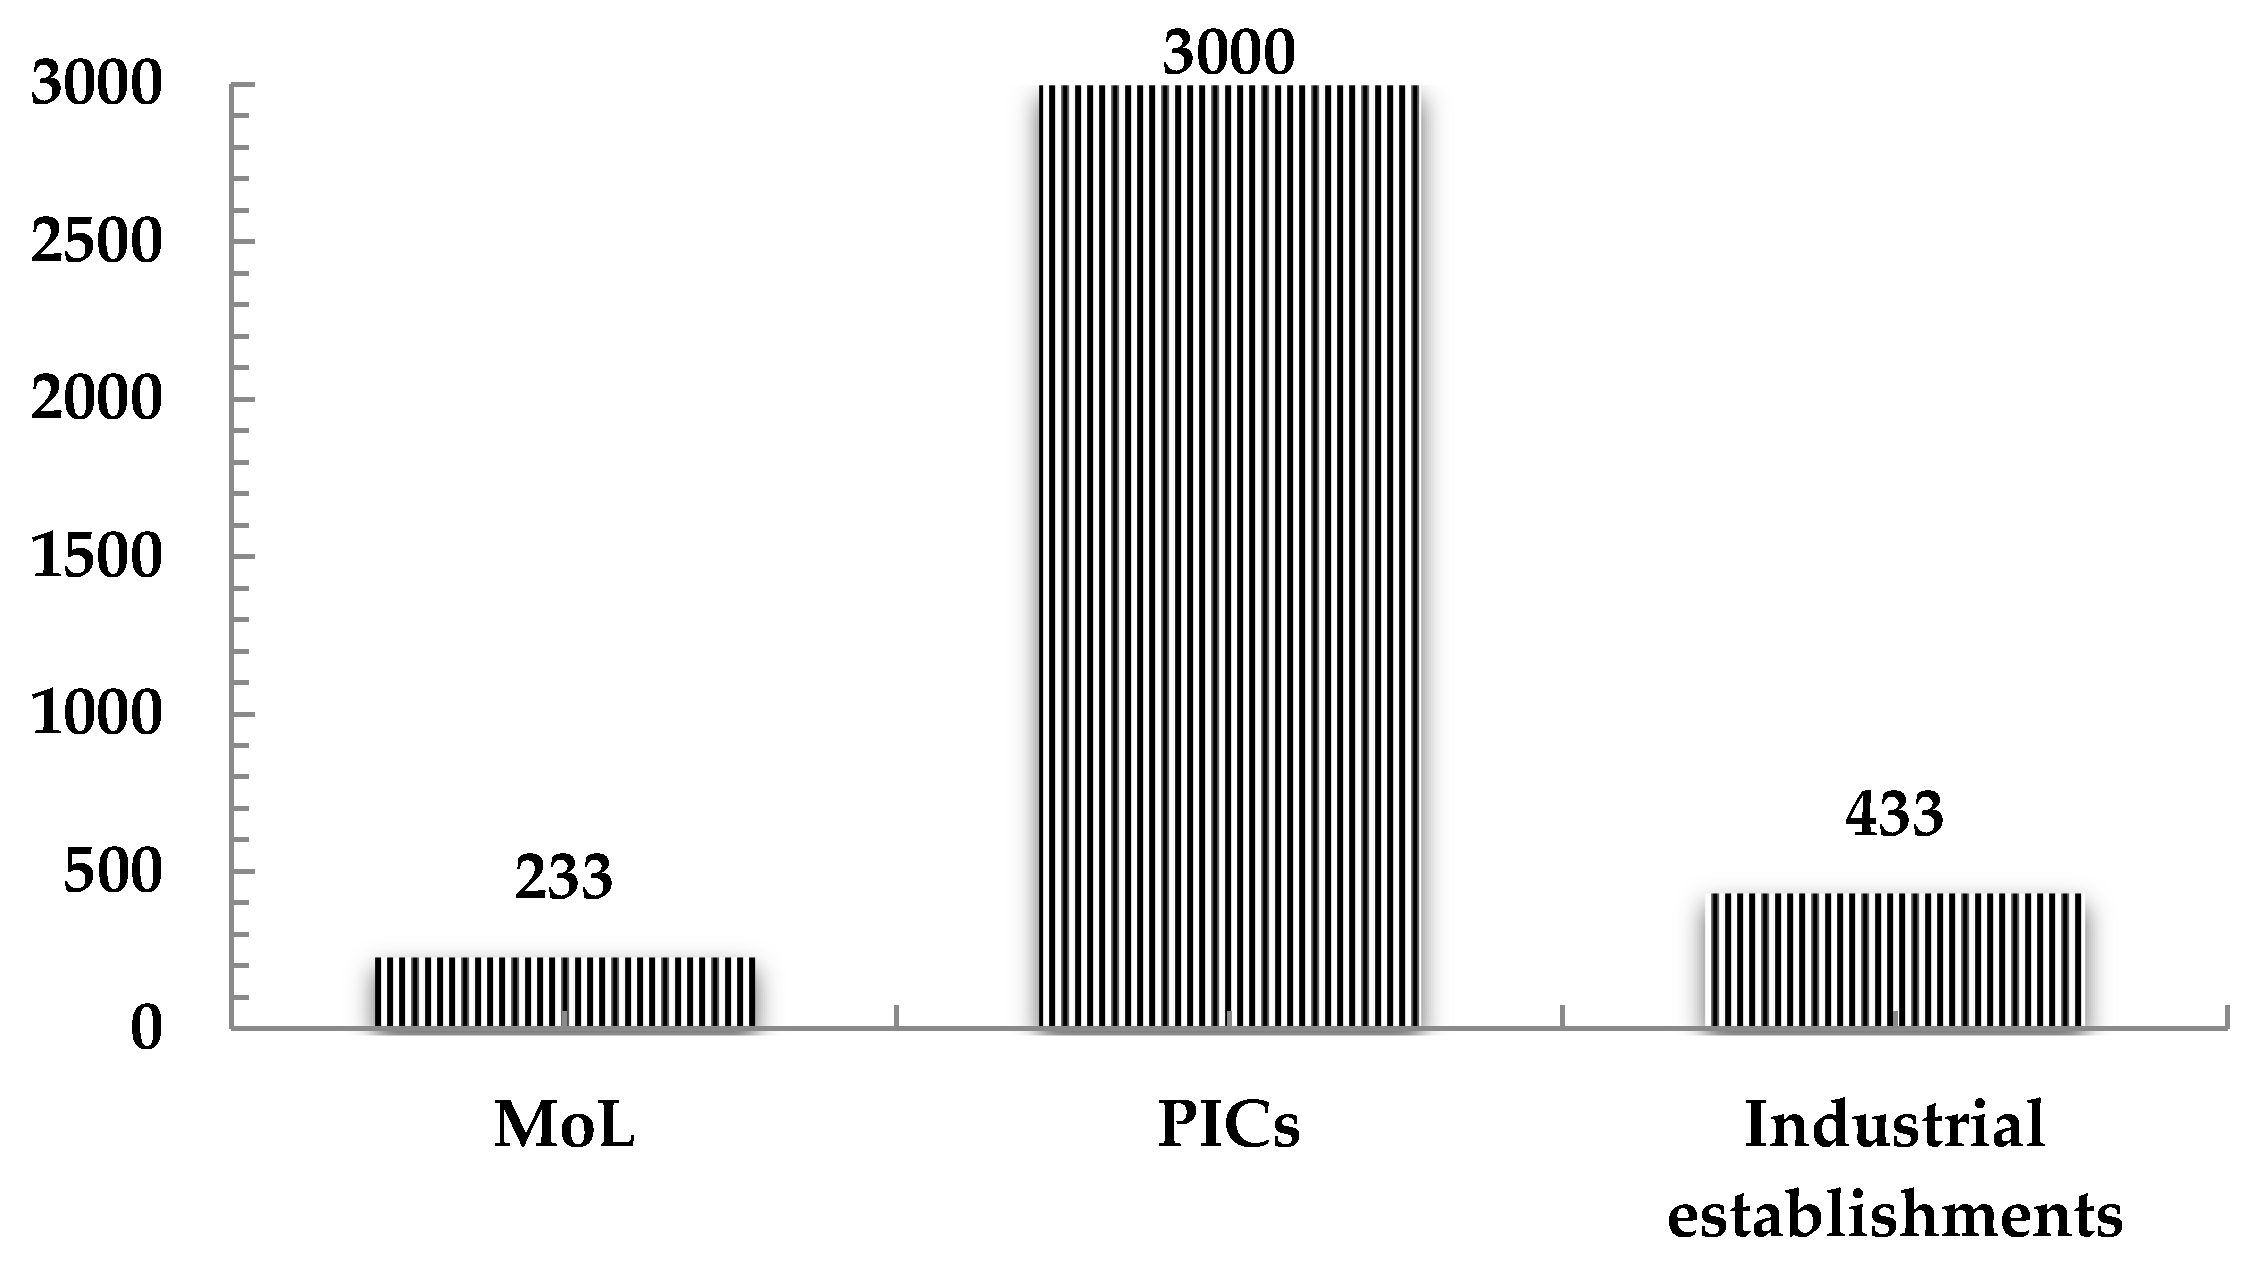
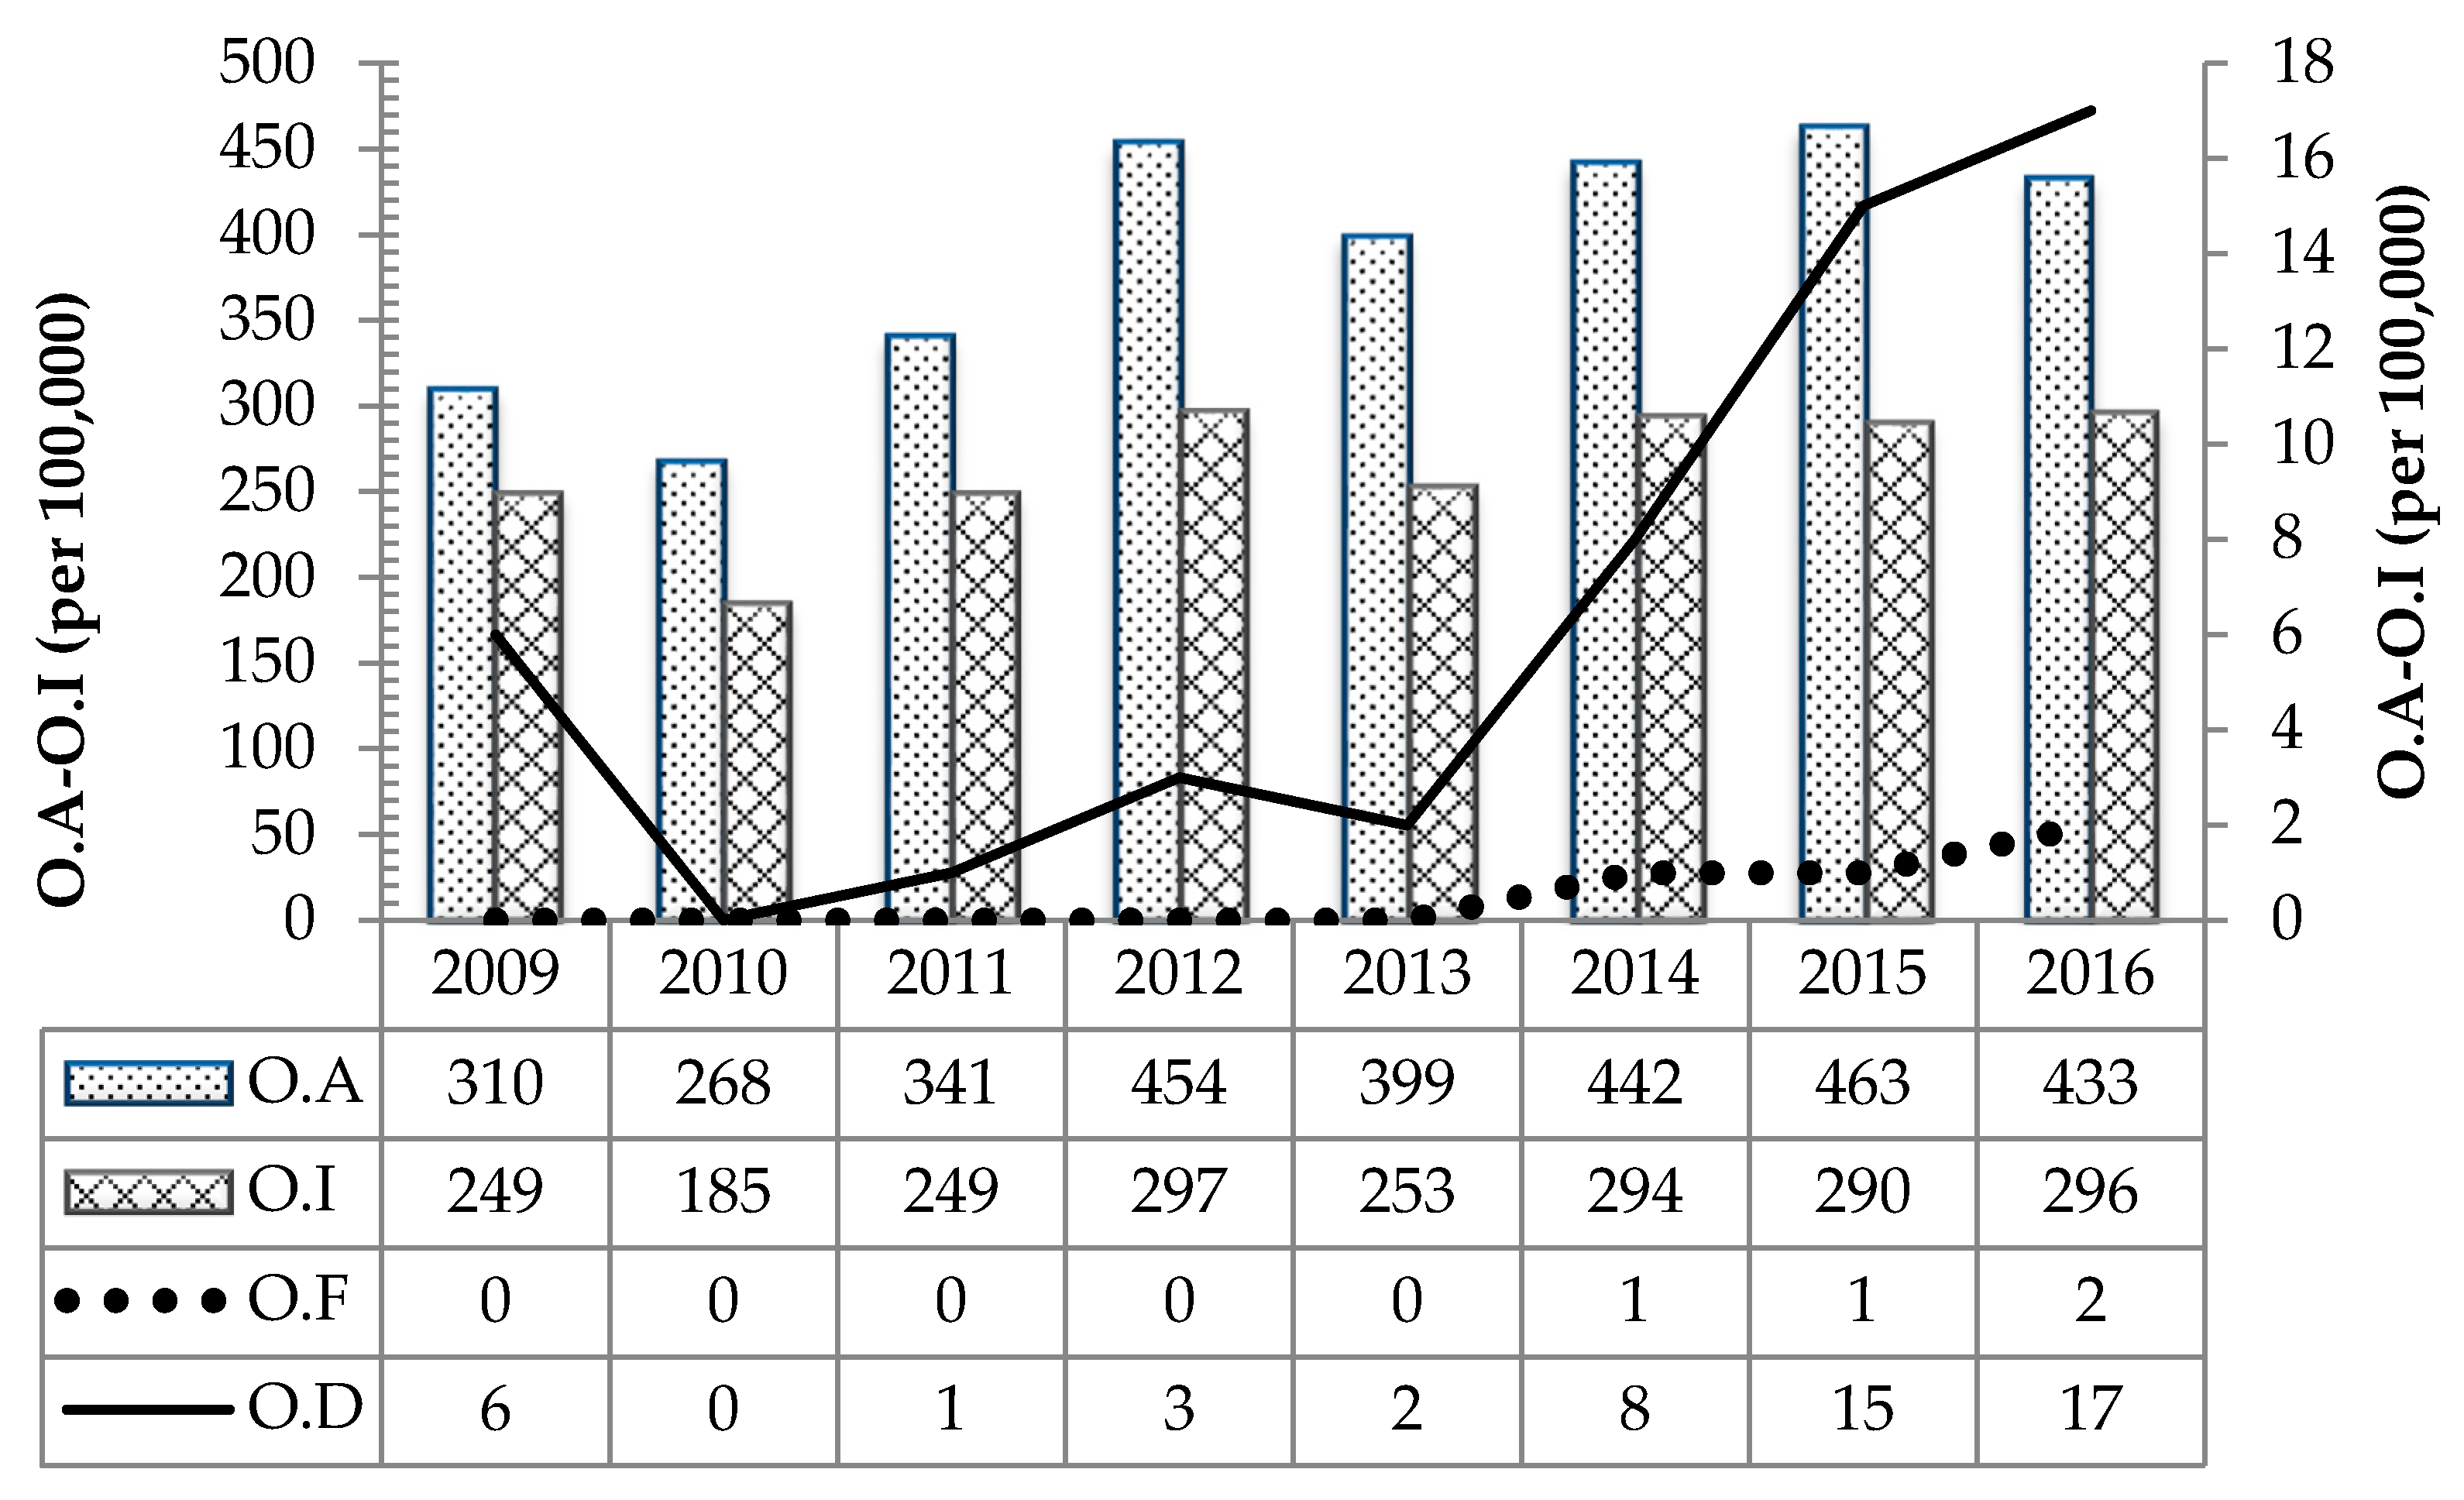
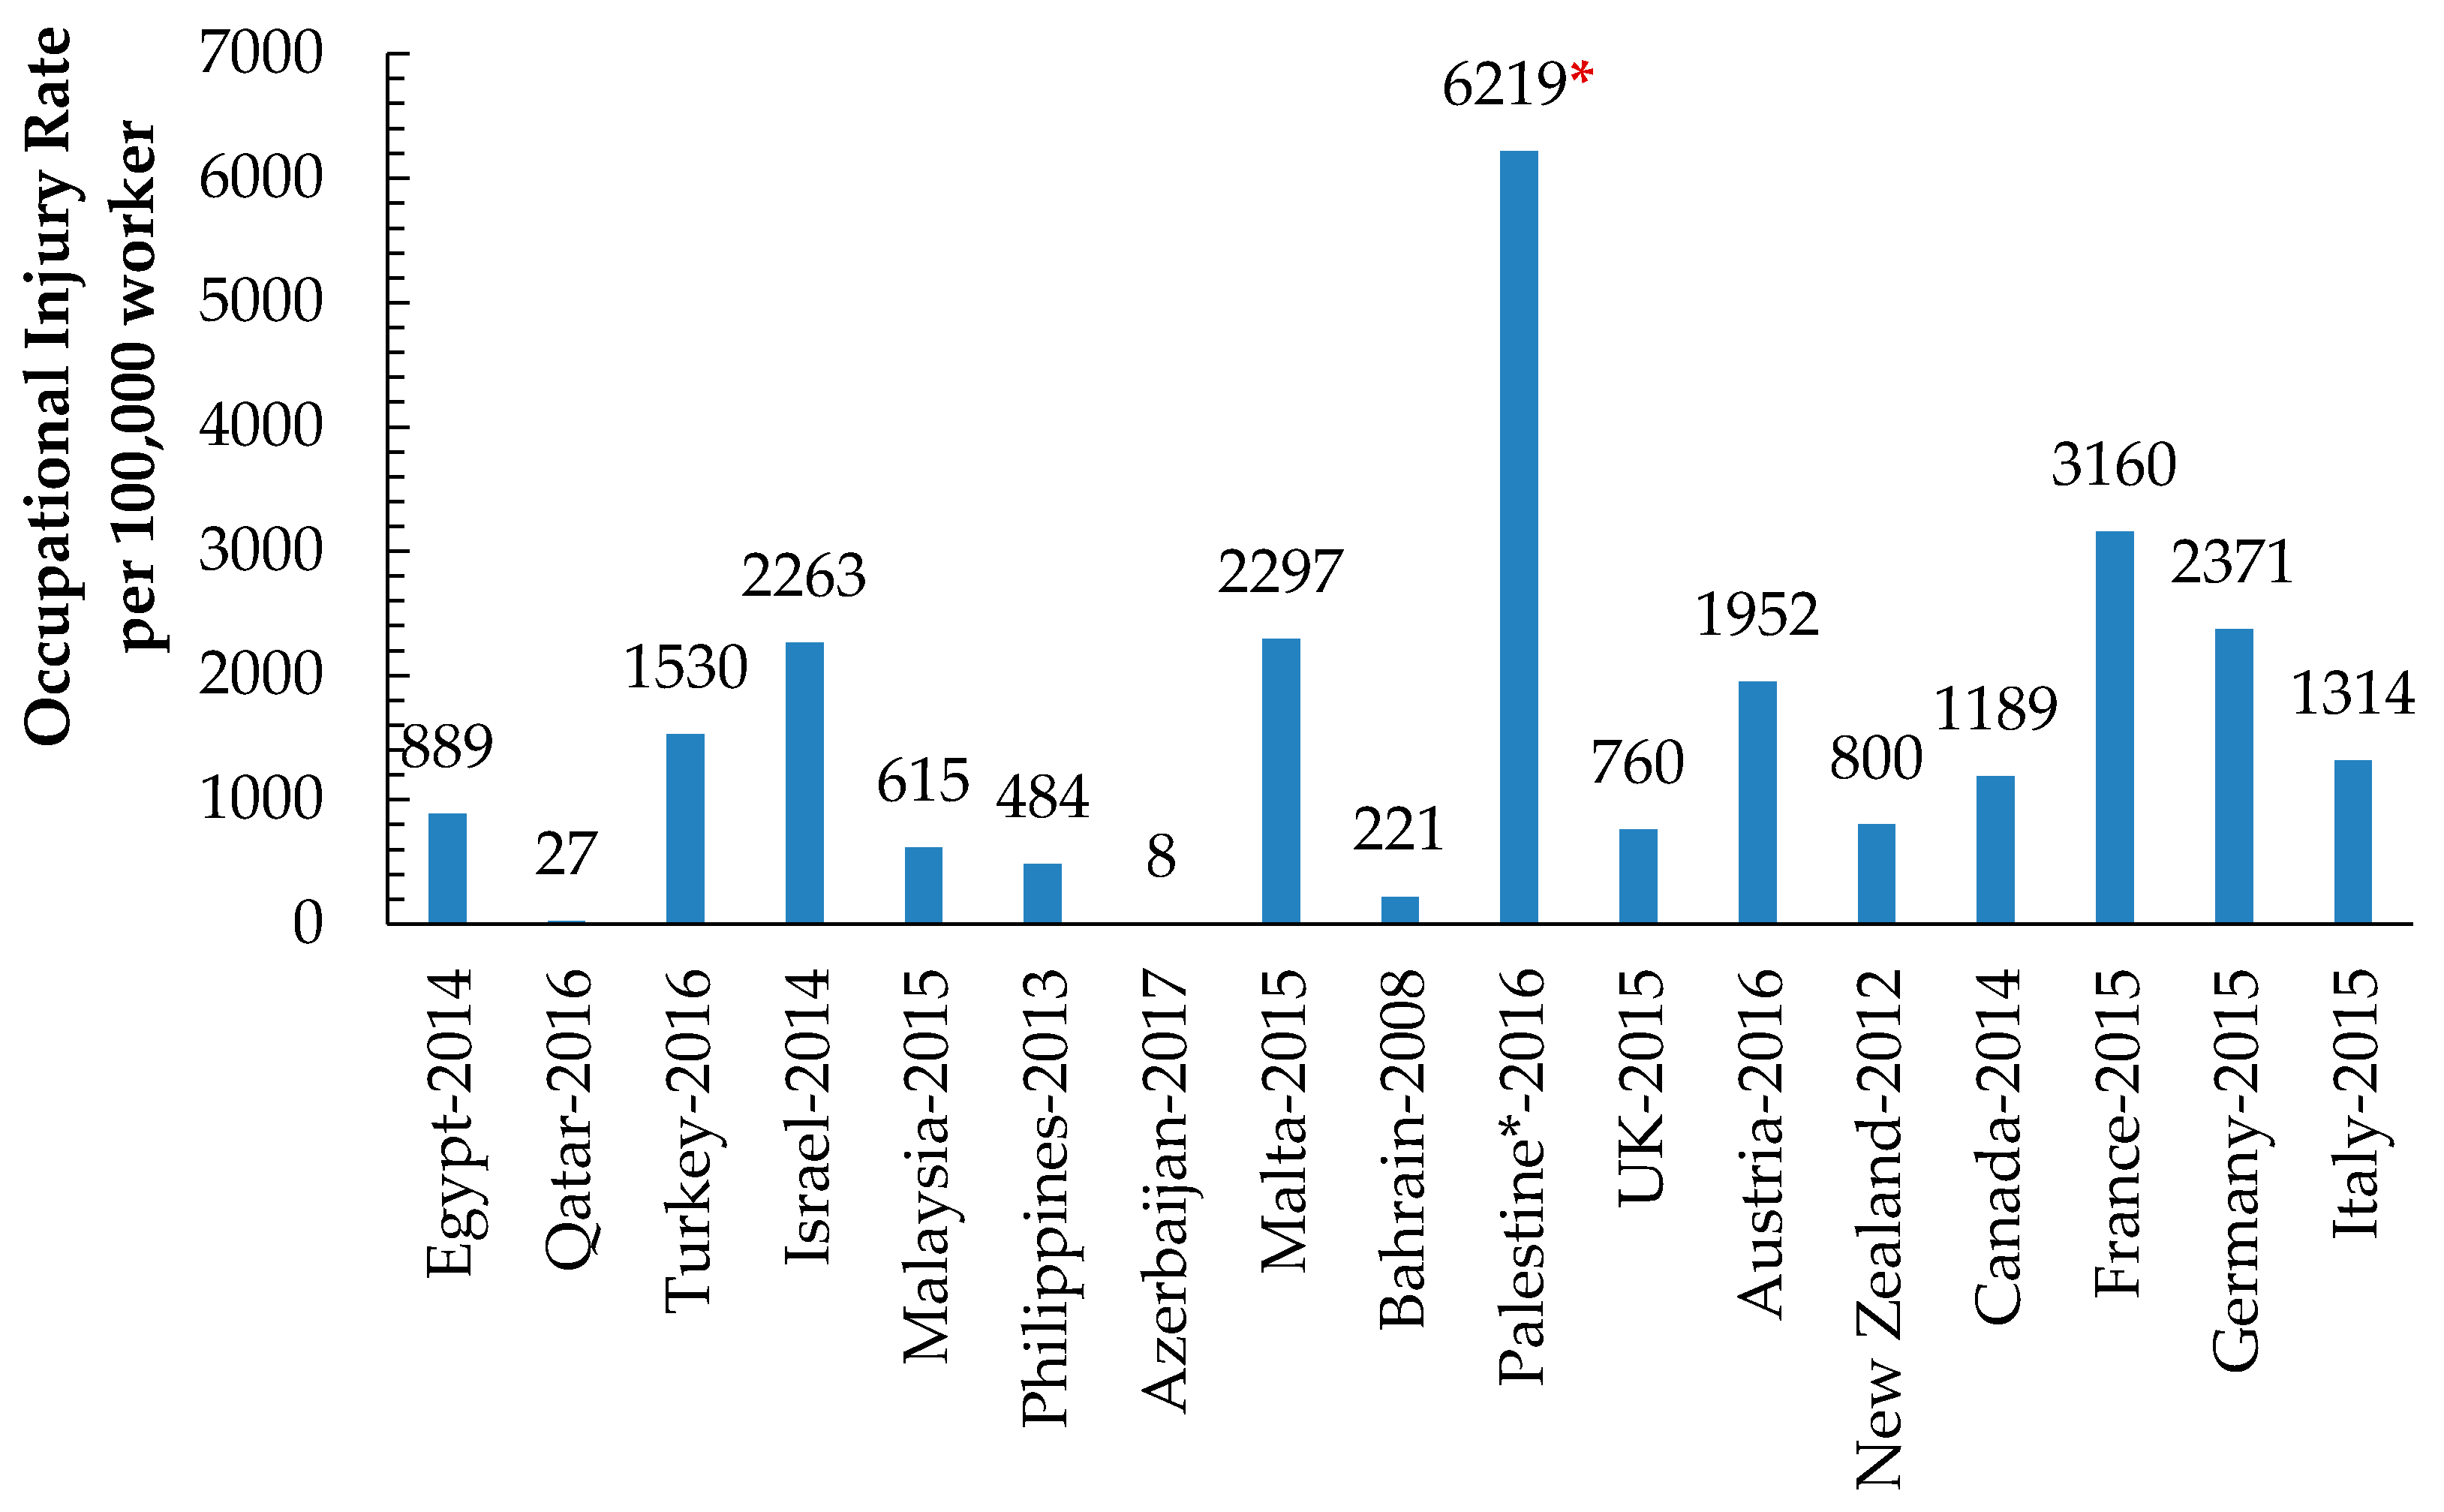
3.3. OSH Trends and Rates in the Palestinian Manufacturing Sector
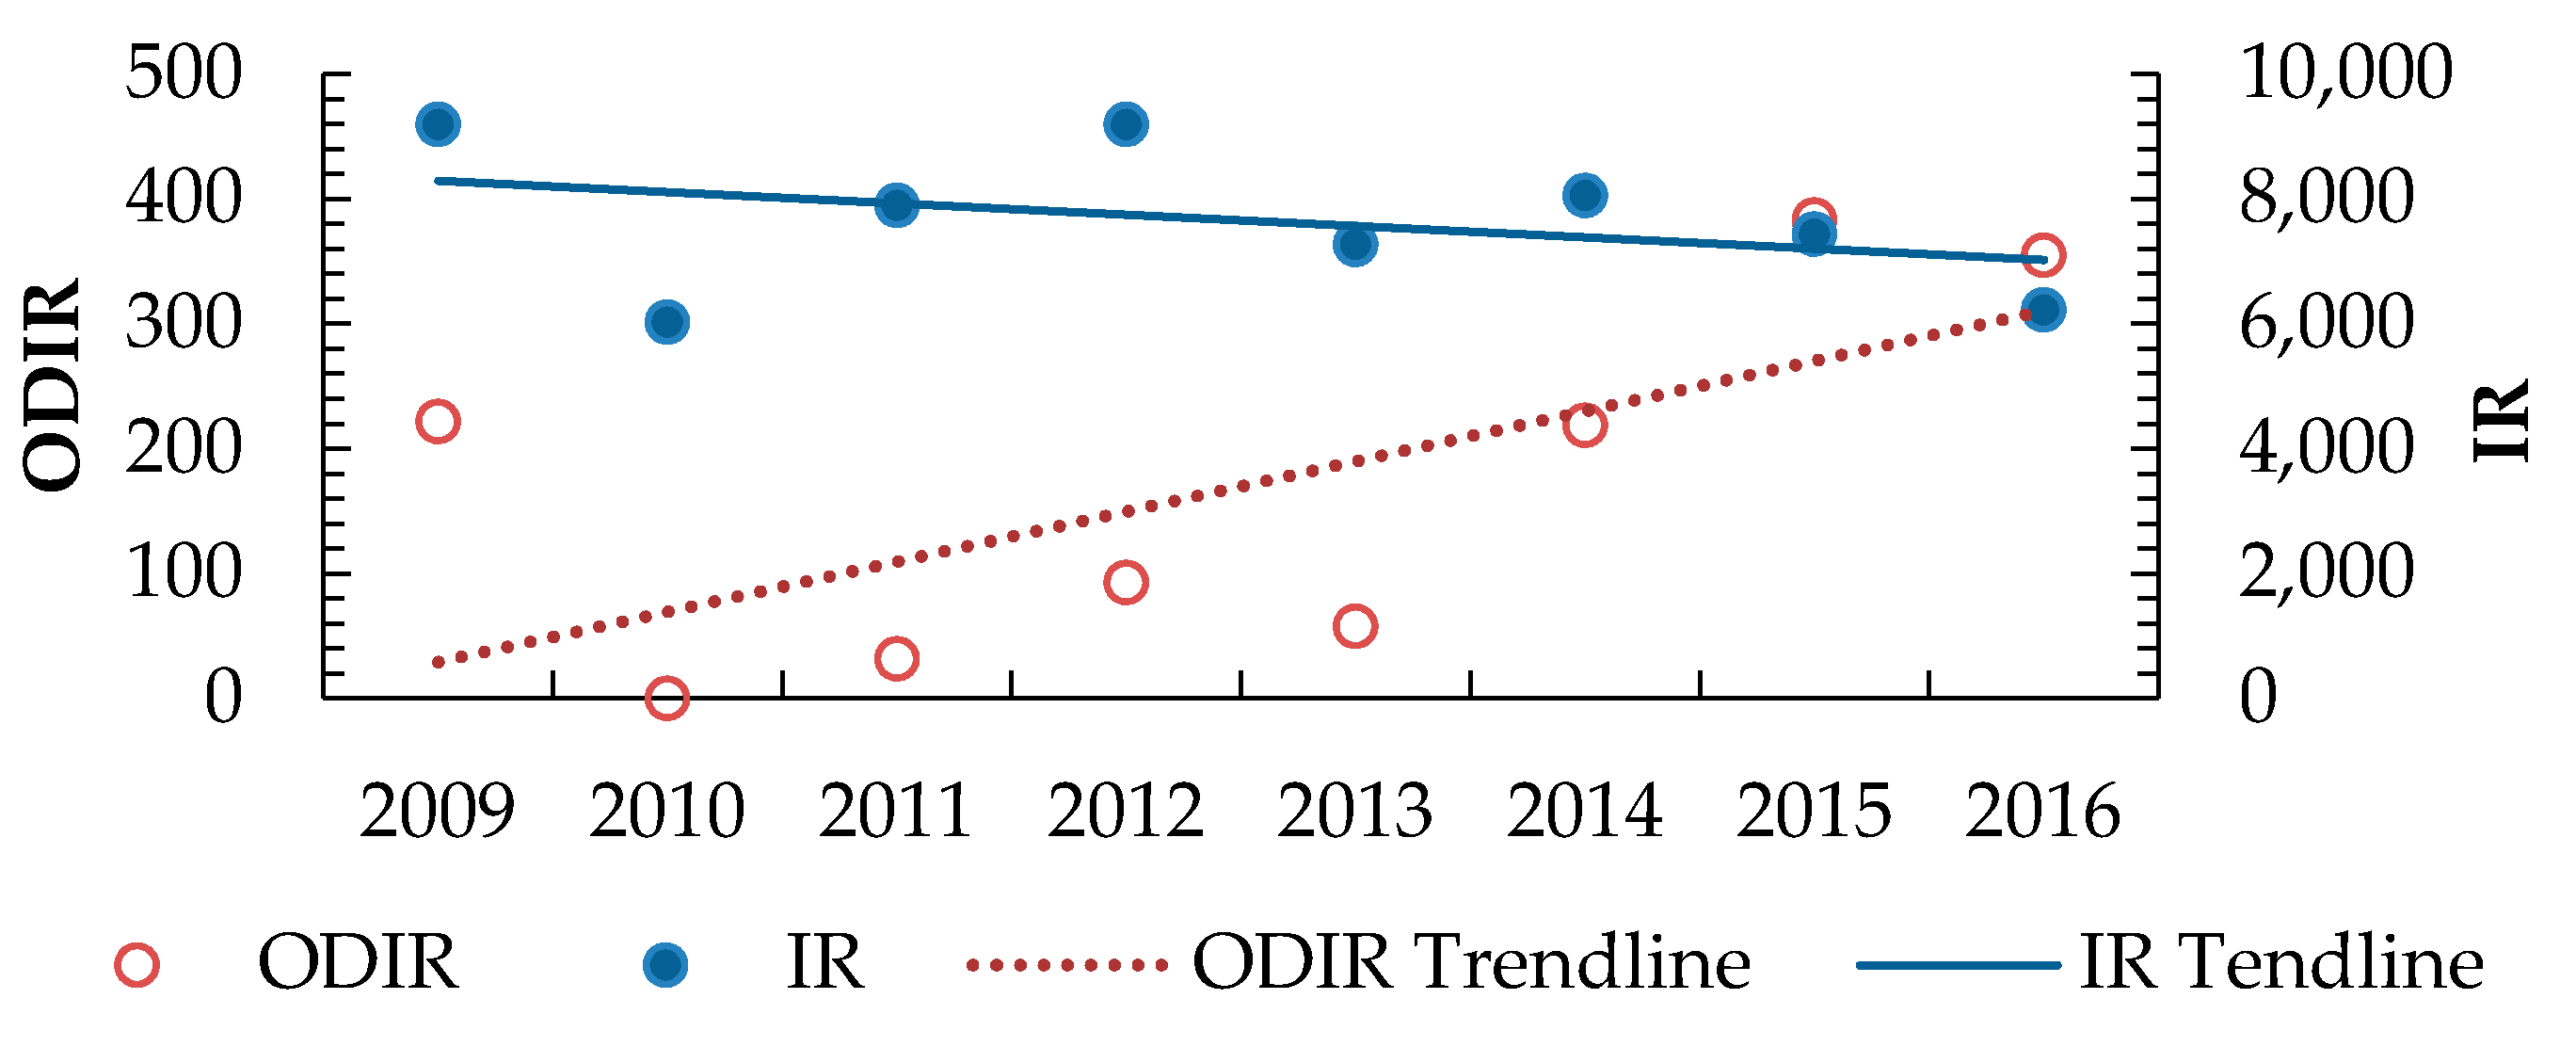
3.4. Incident and Fatality Accident Rates
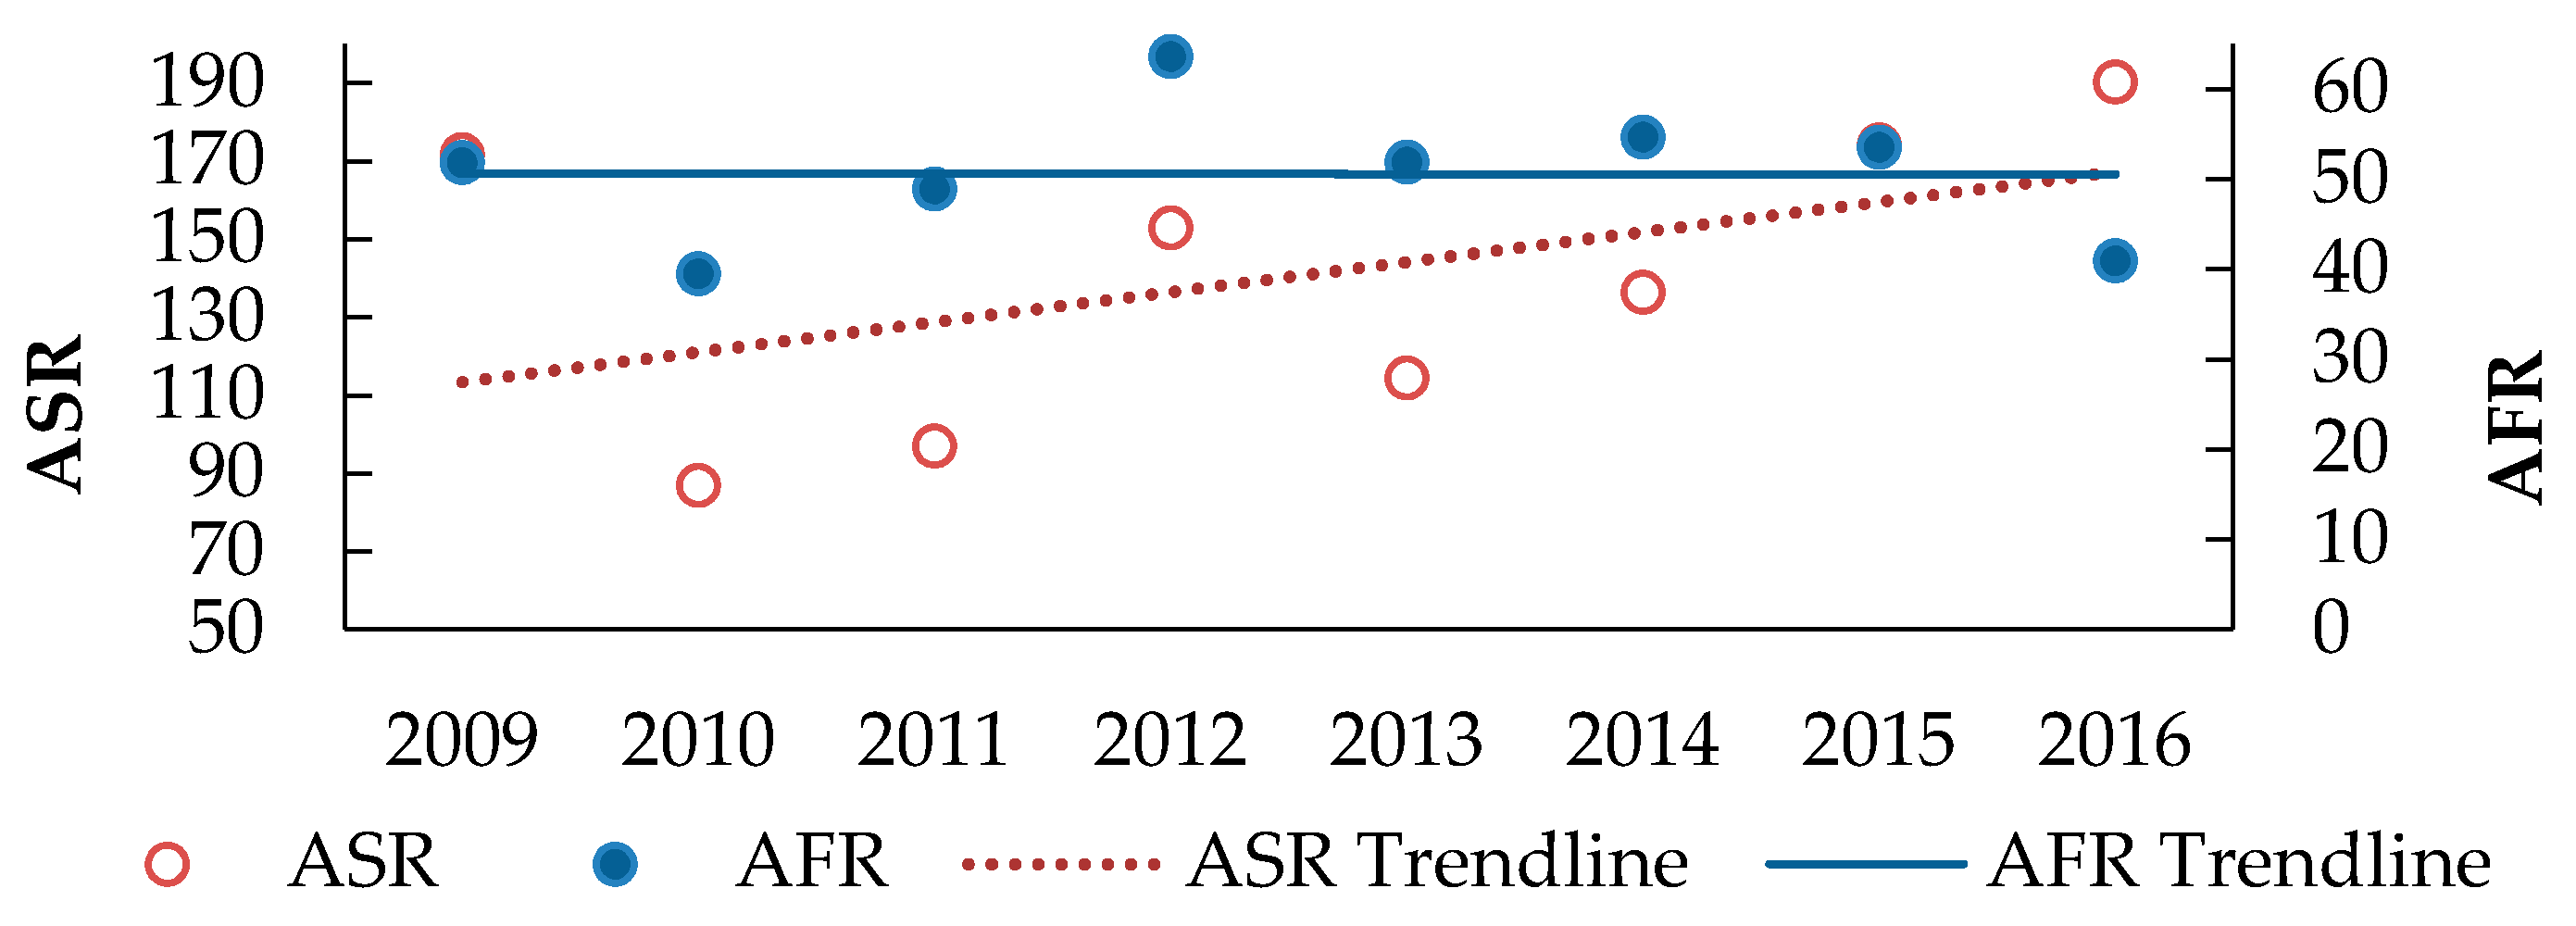
3.5. Occupational Incident and Accident Frequency Rates
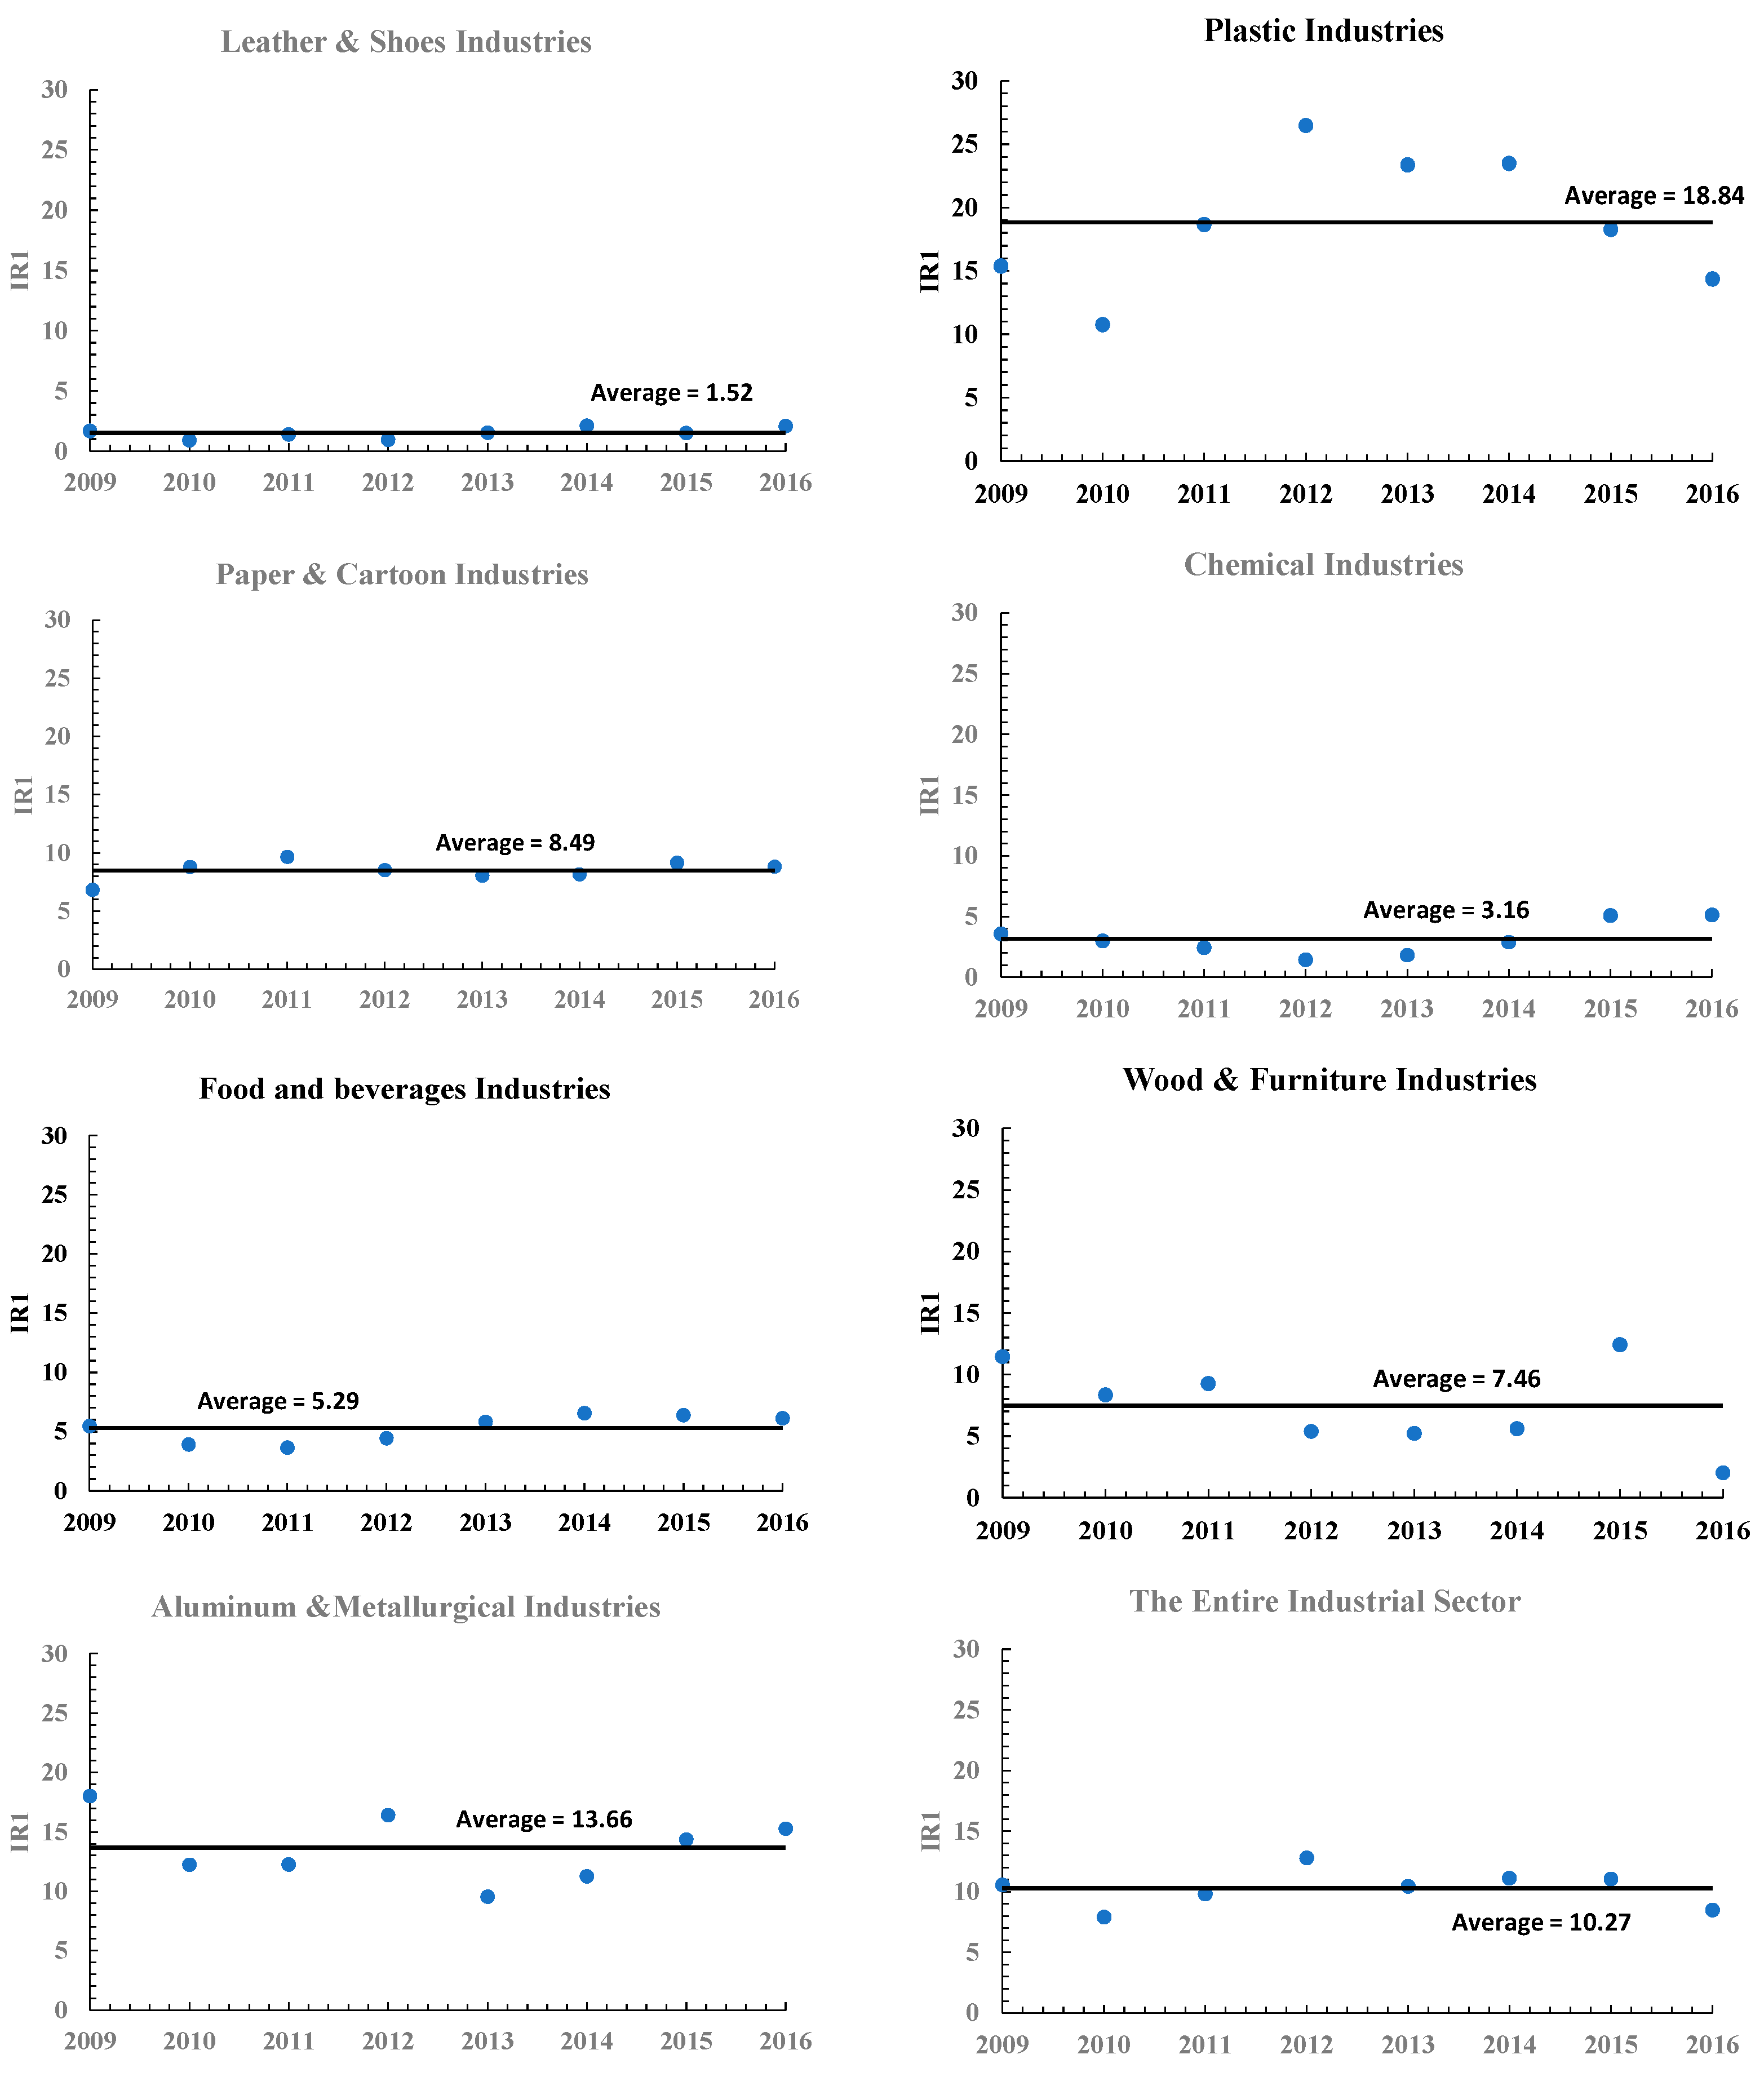
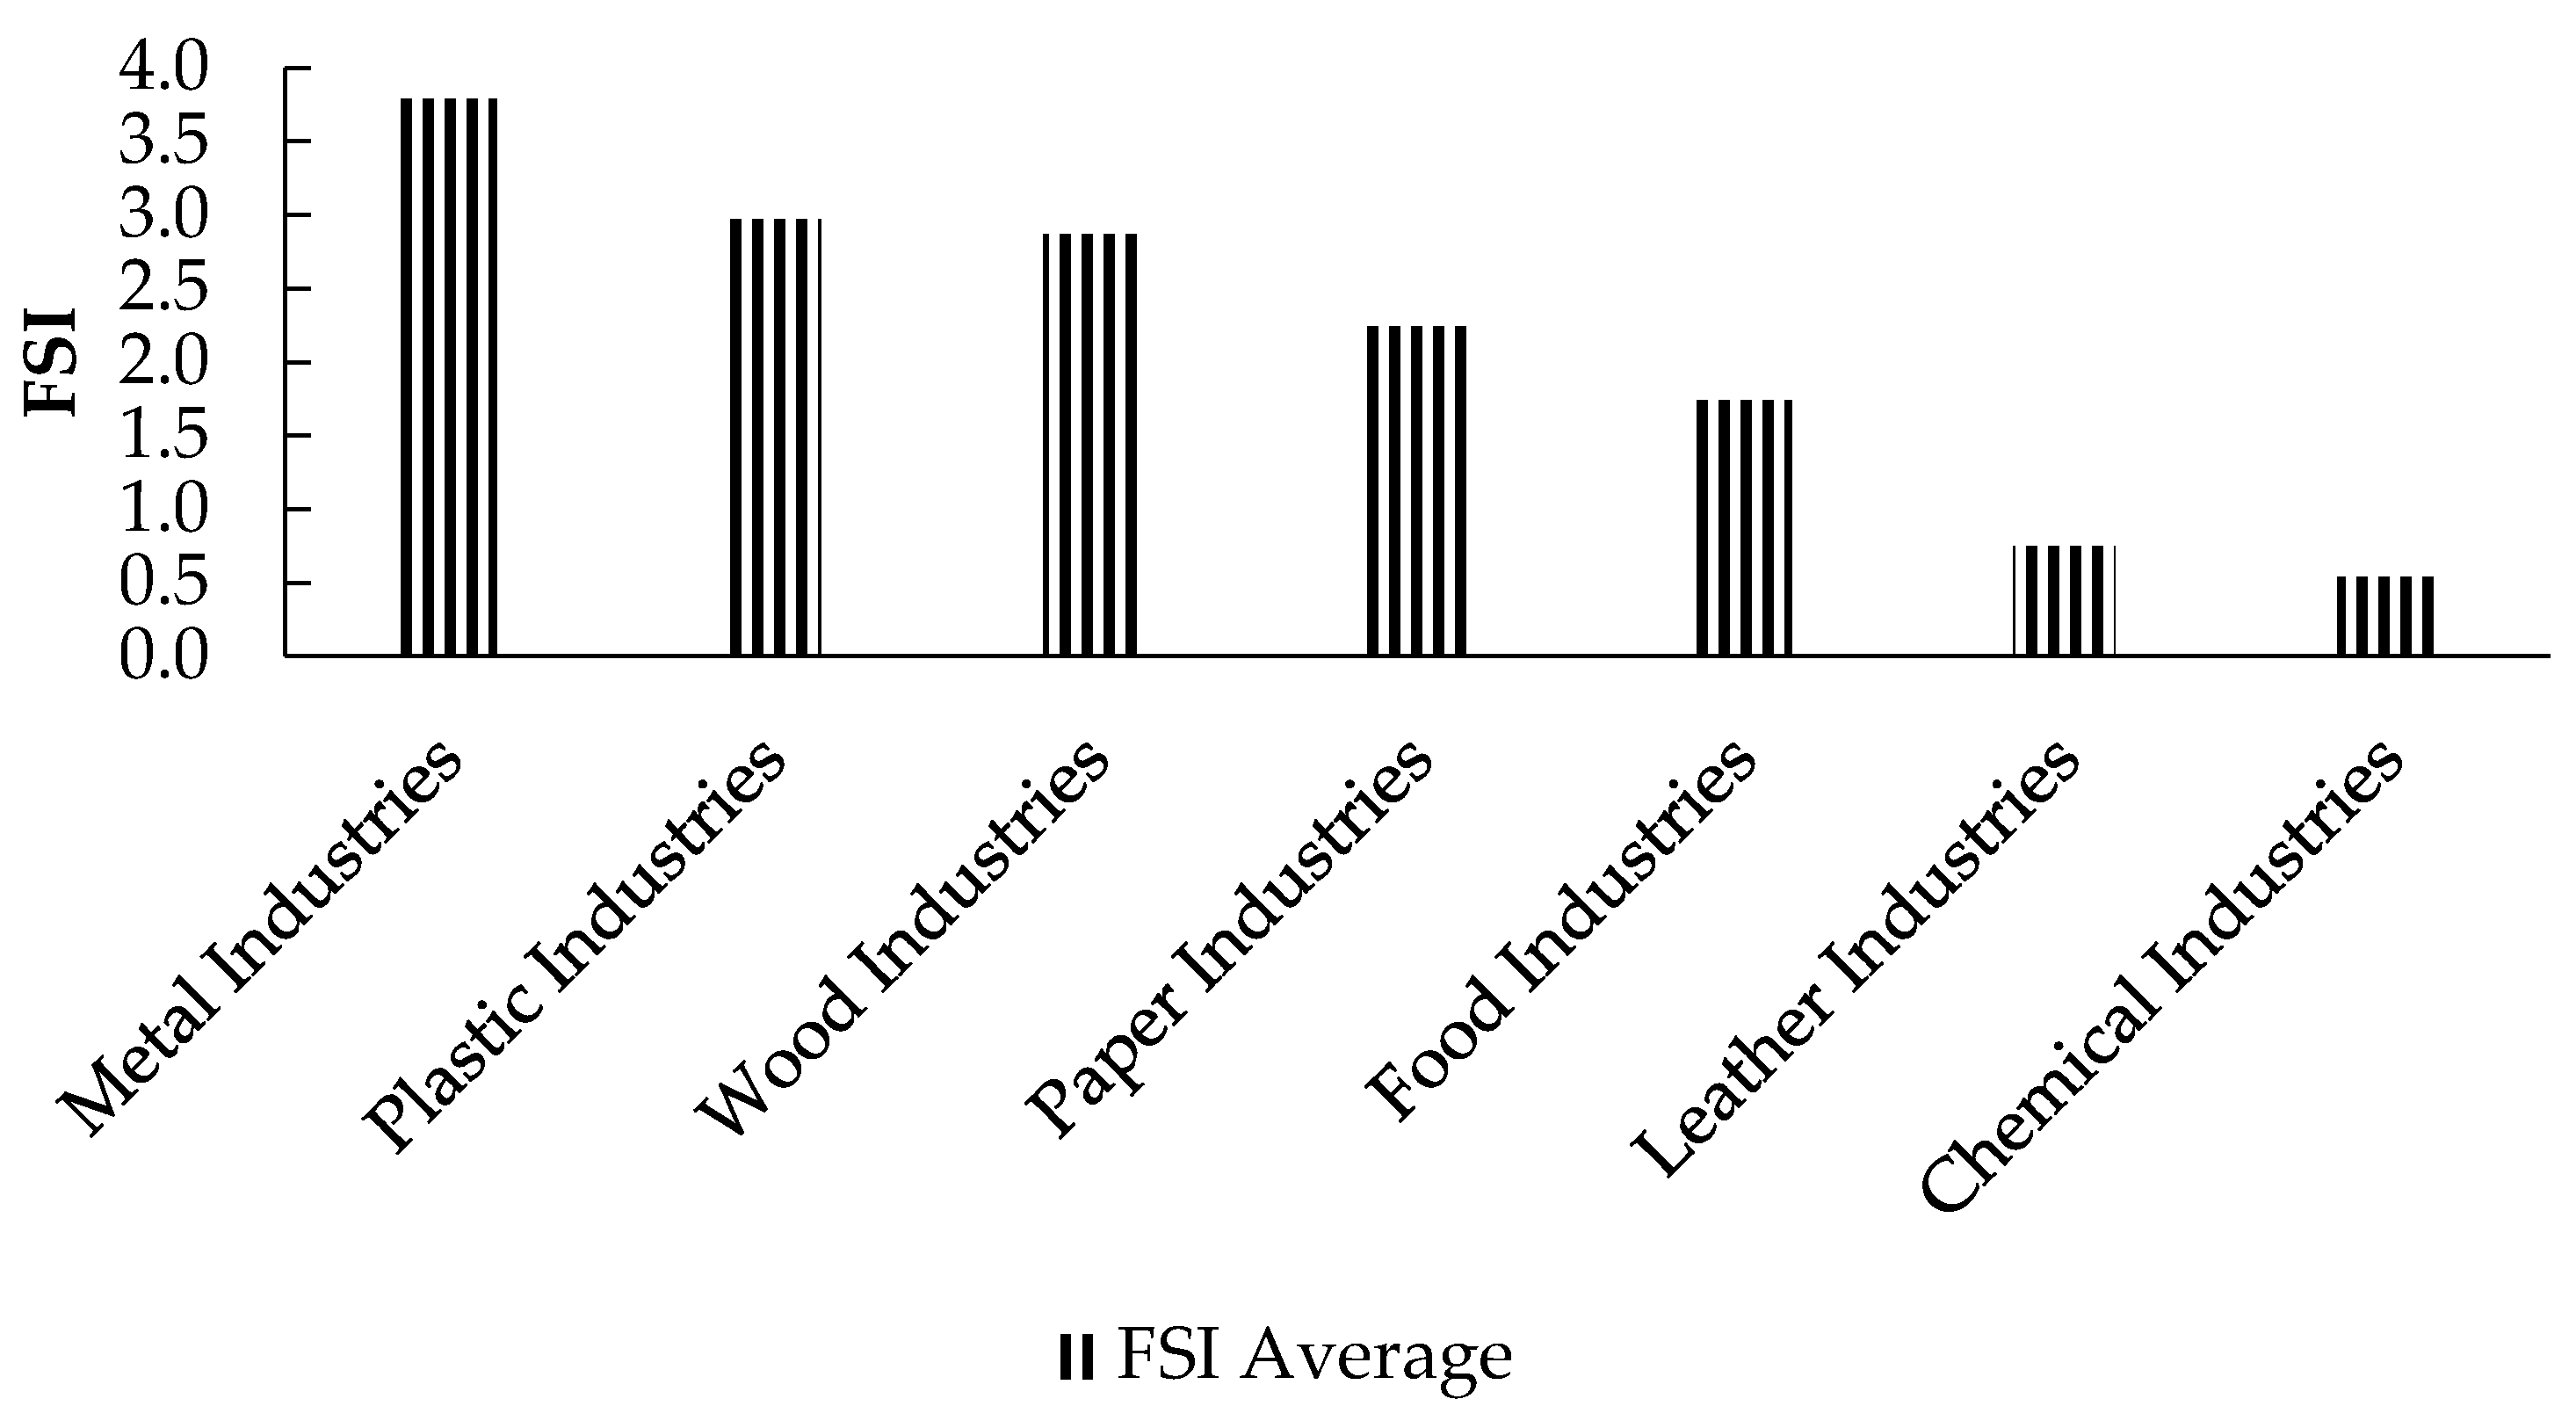
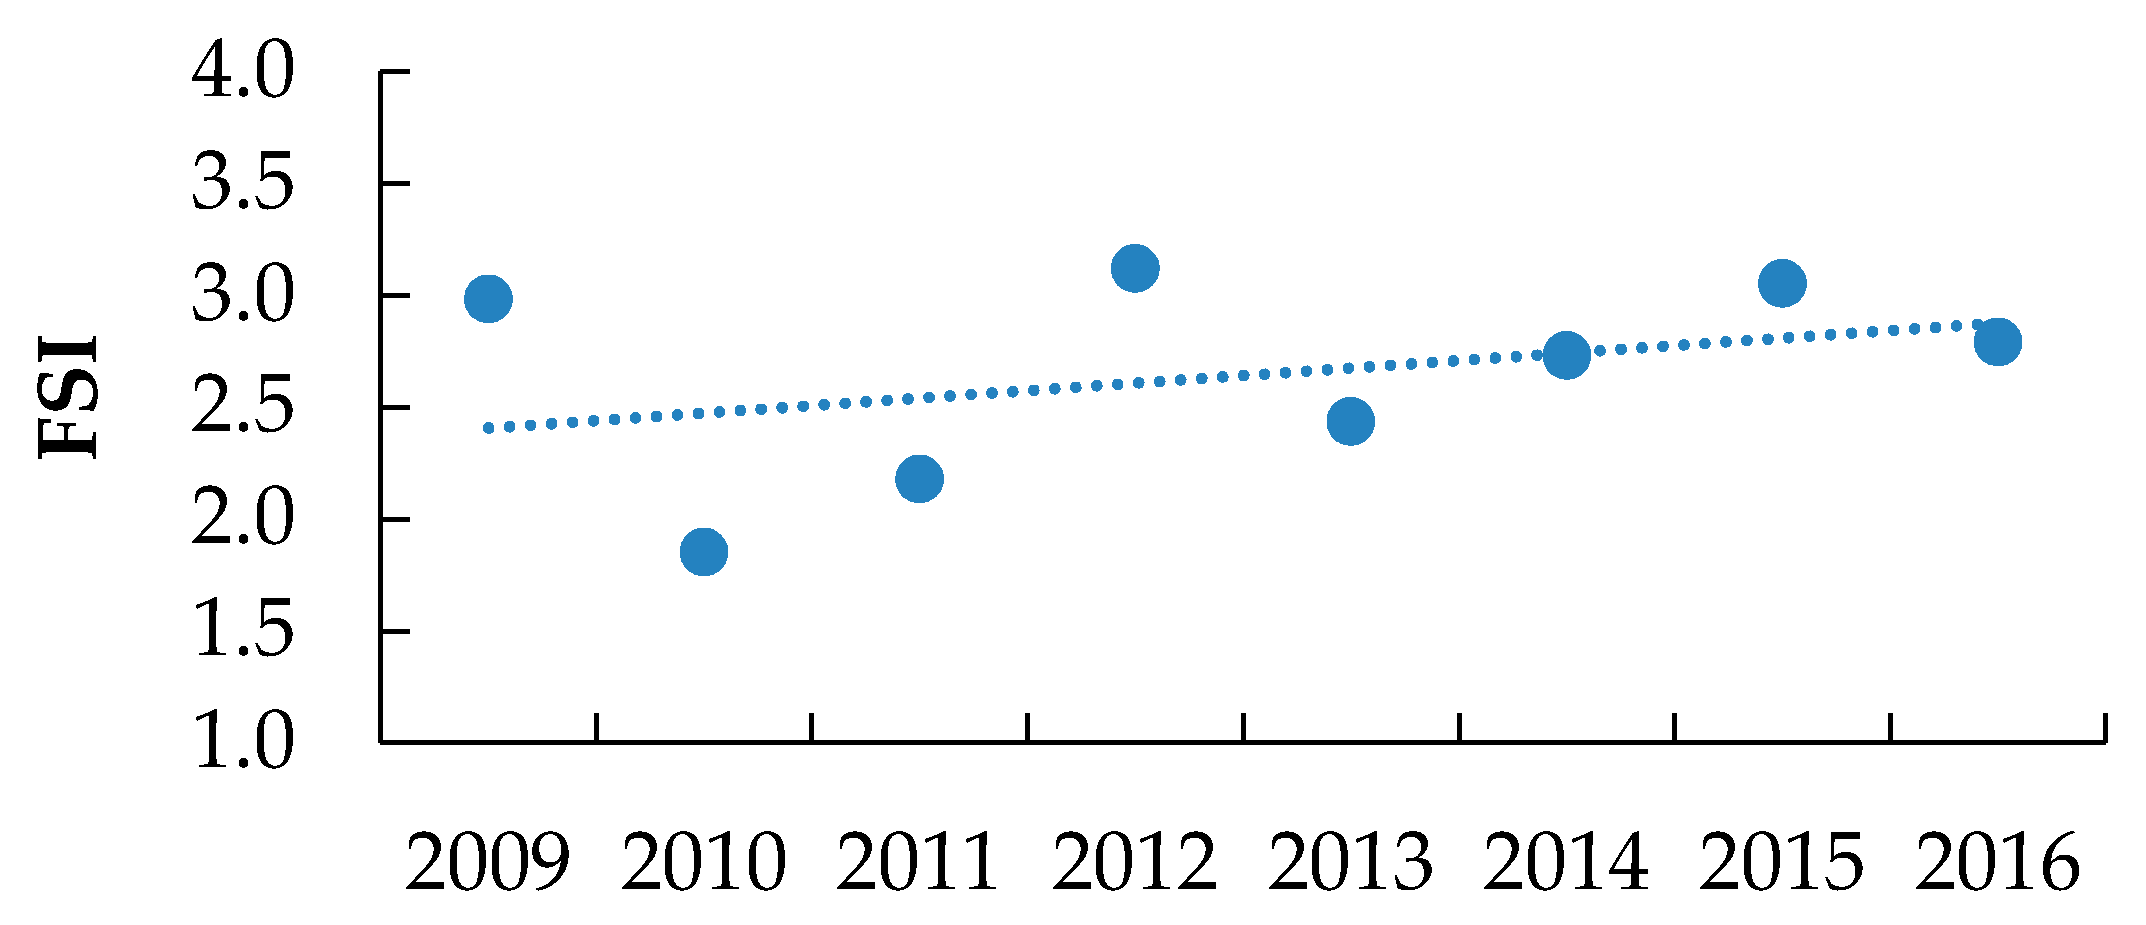
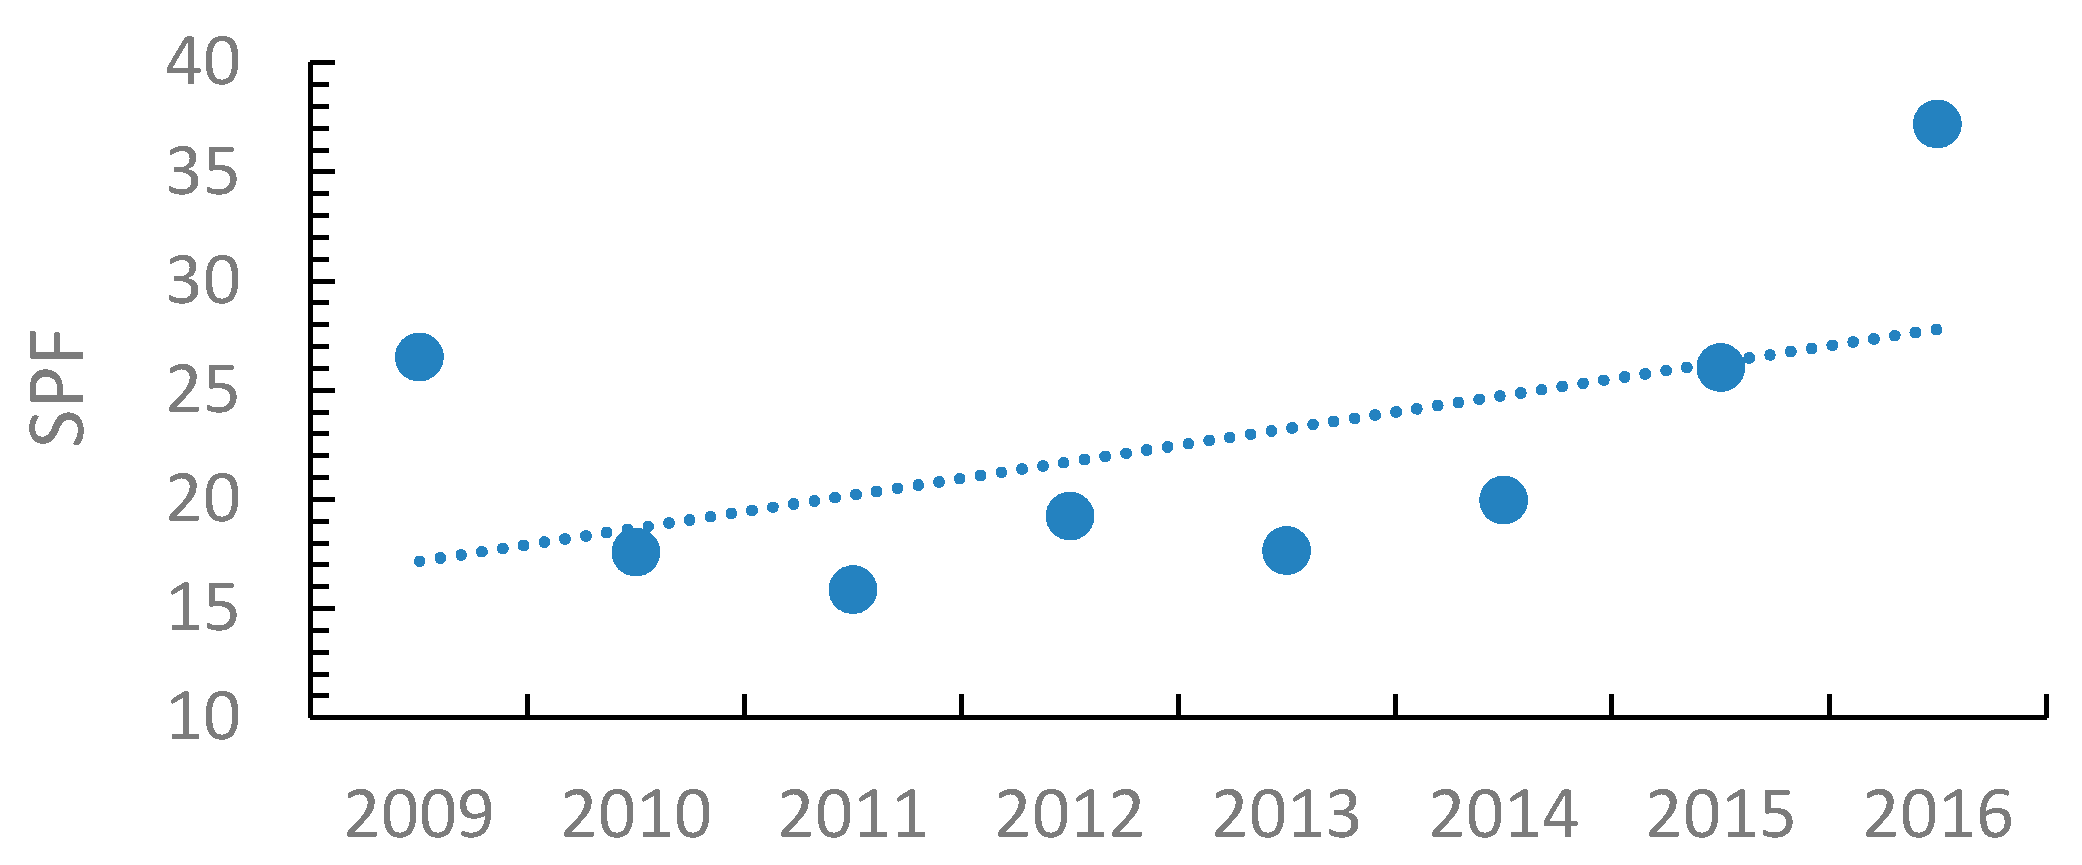
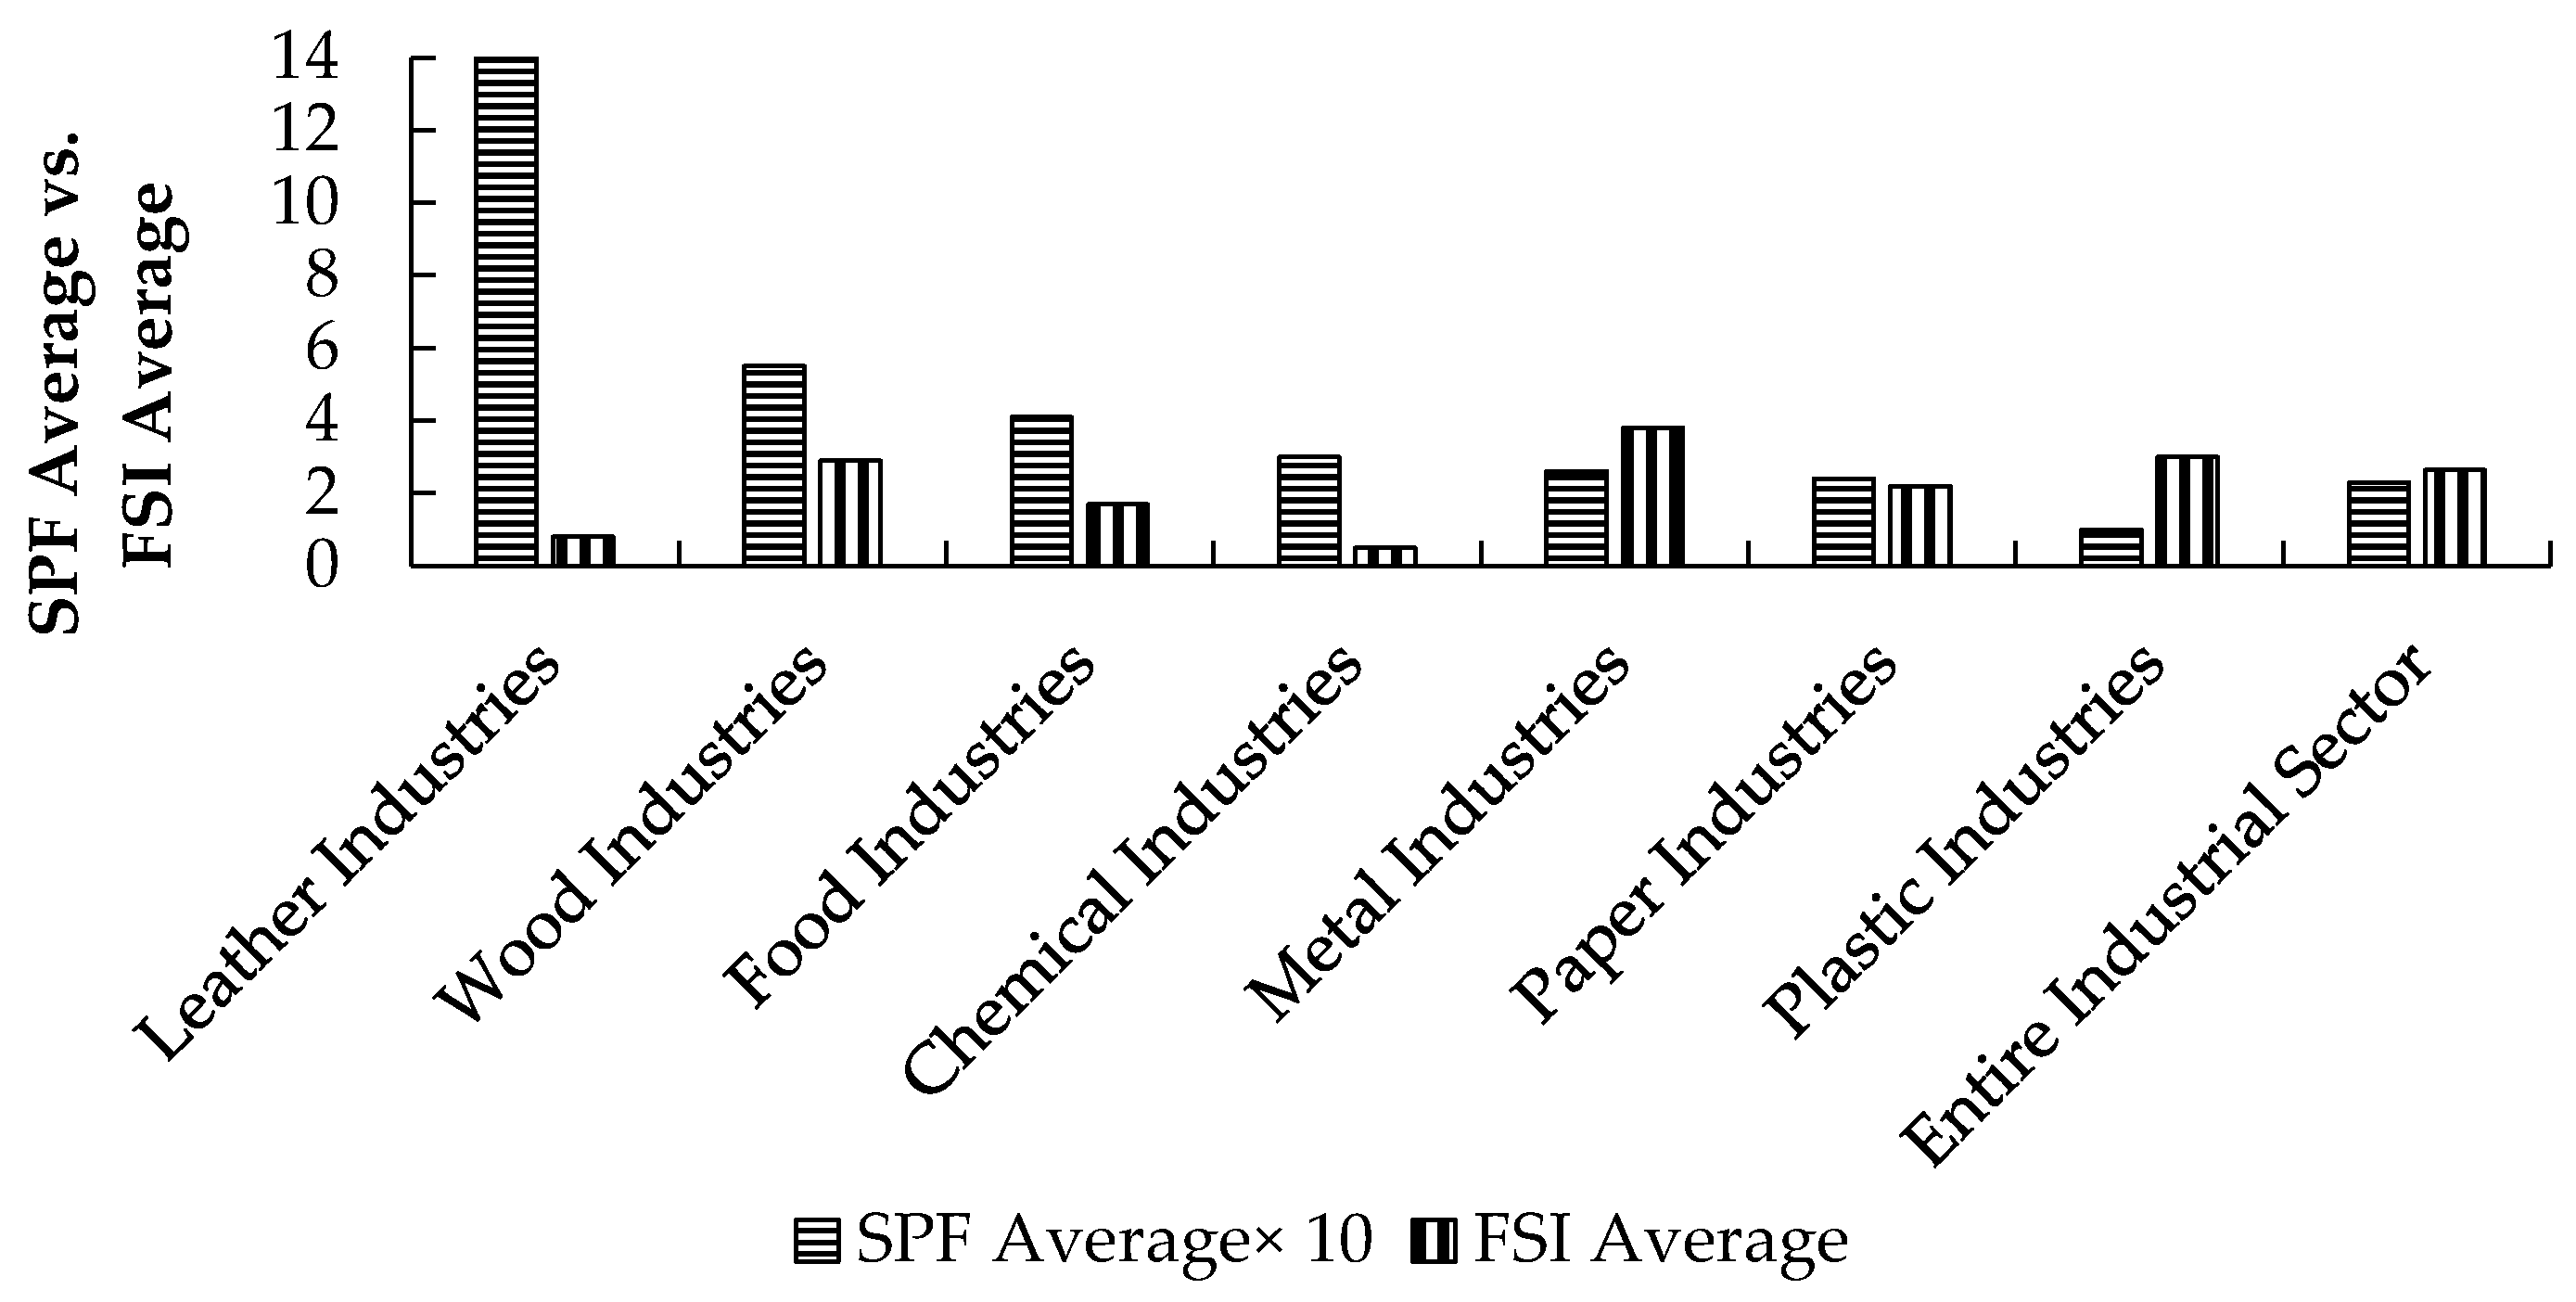
3.6. Frequency Severity Index and Safety Performance Factor
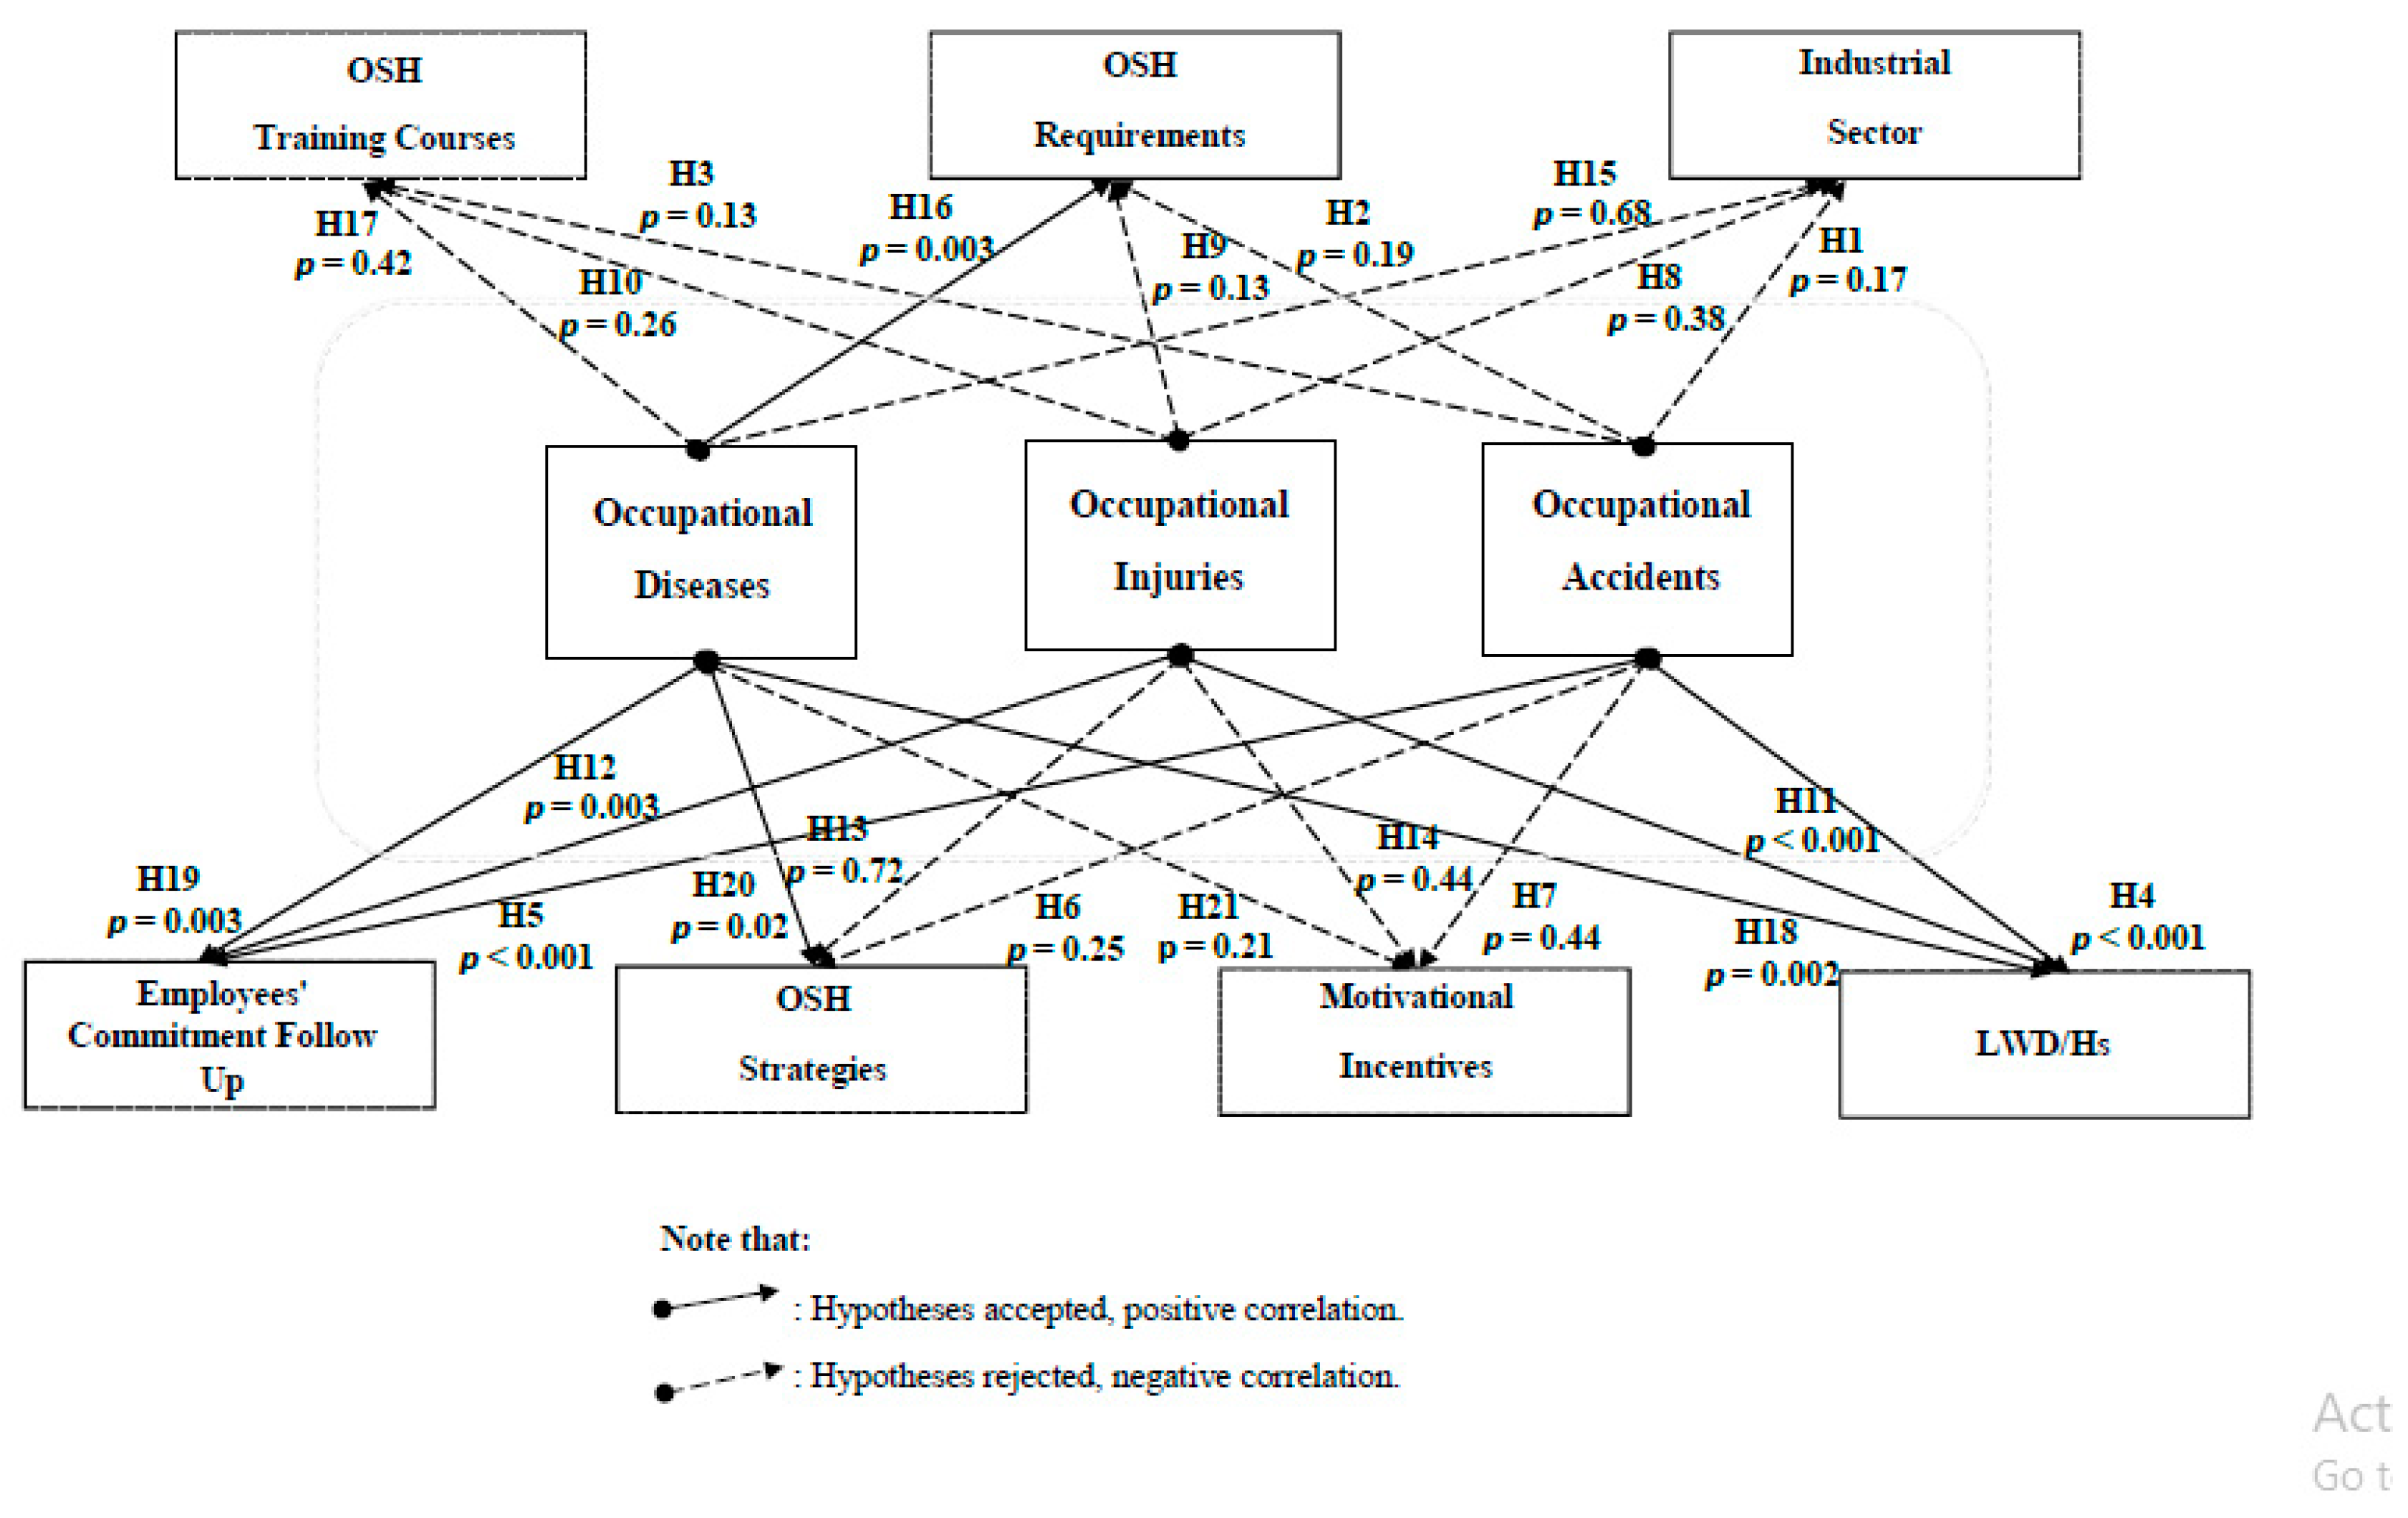
3.7. OSH Correlations
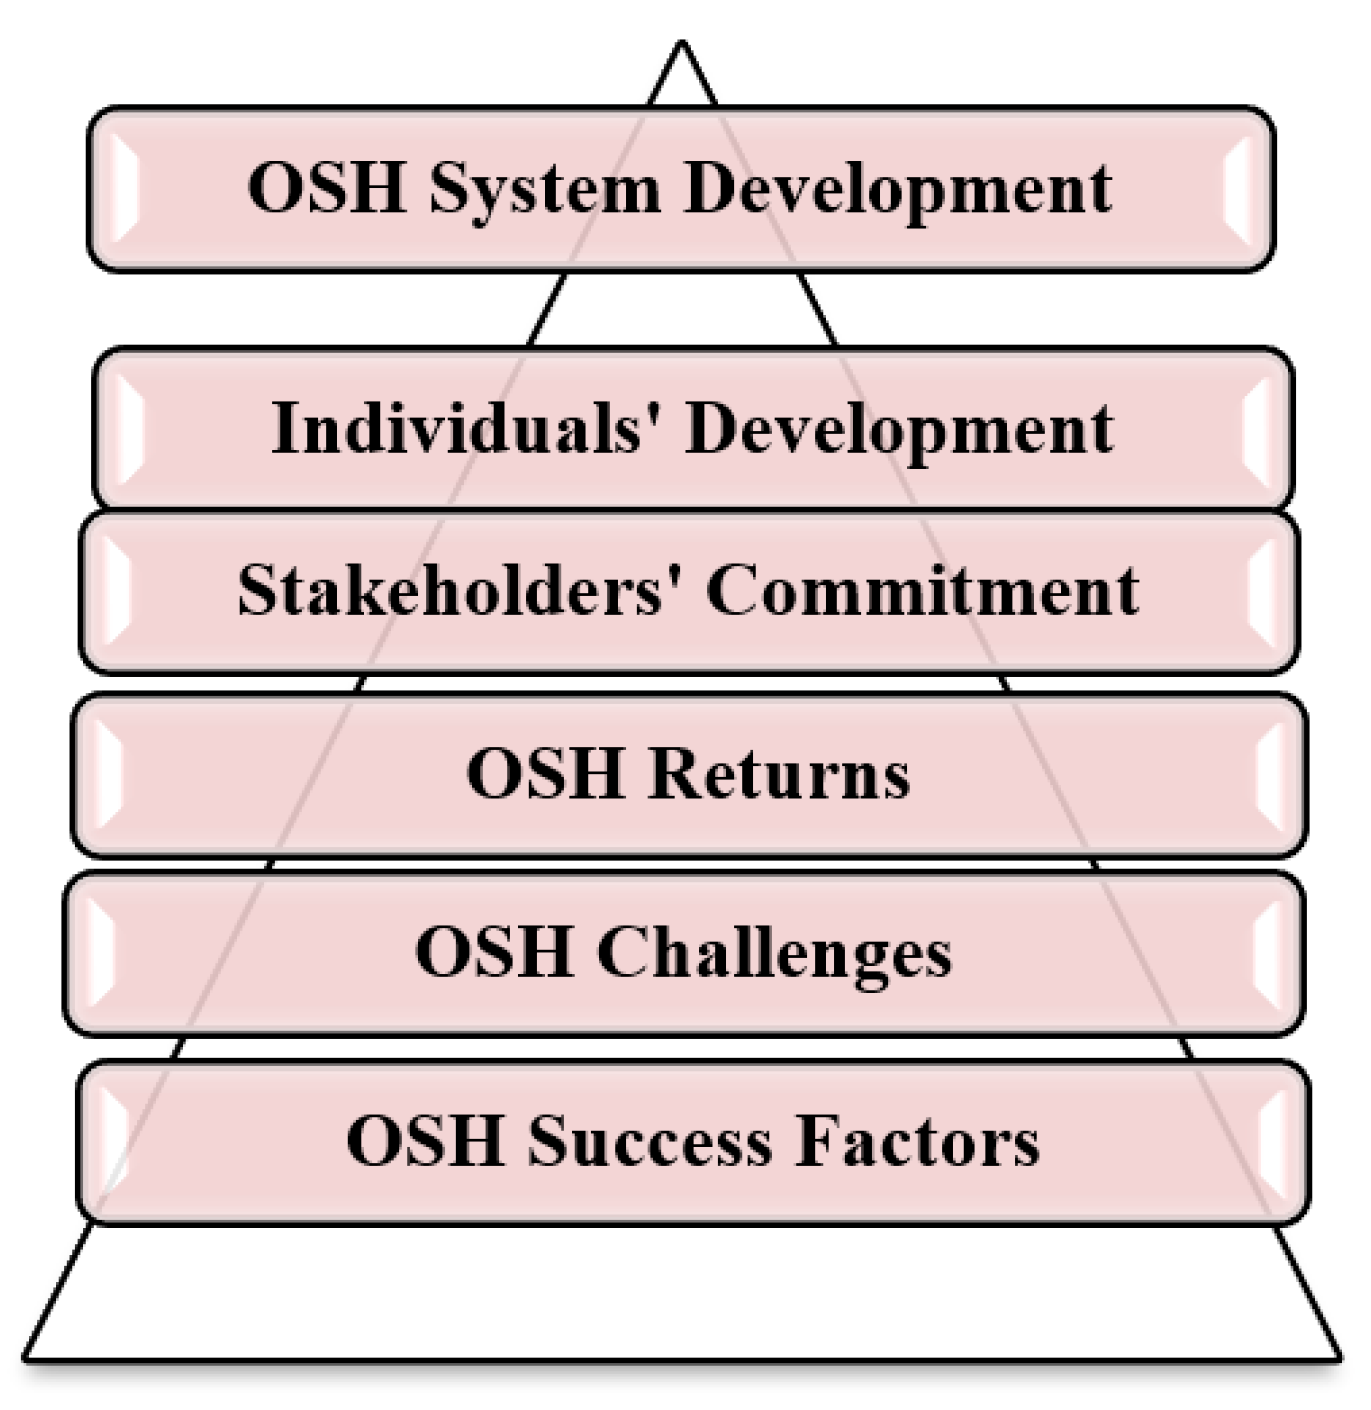
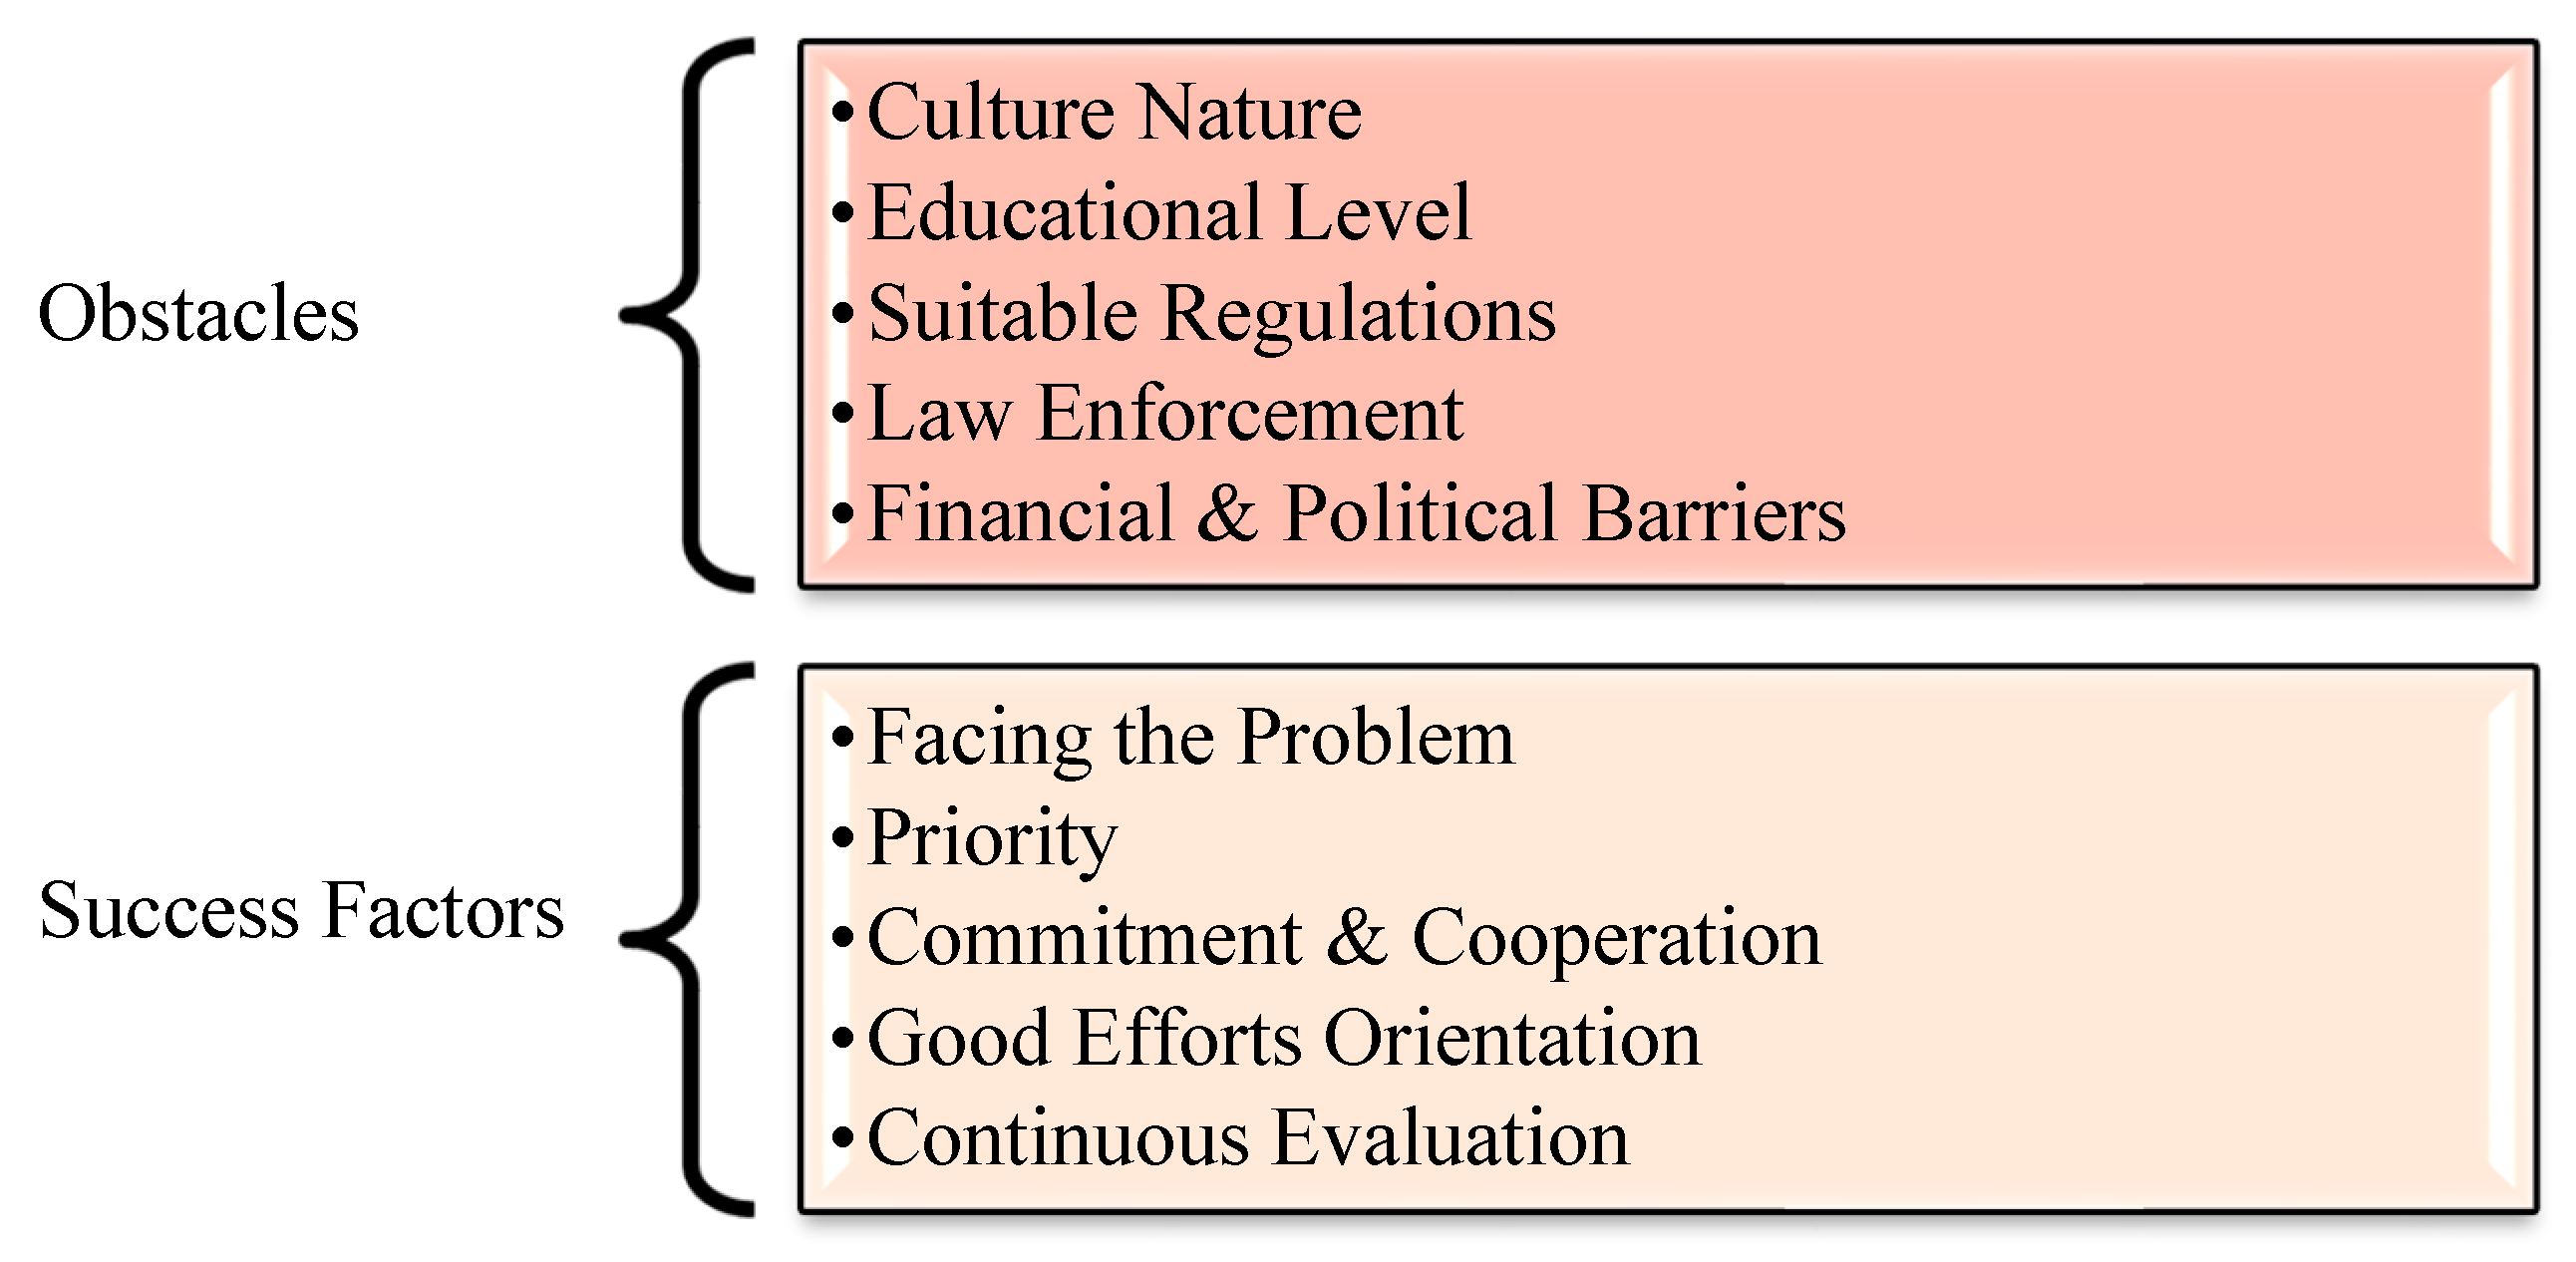
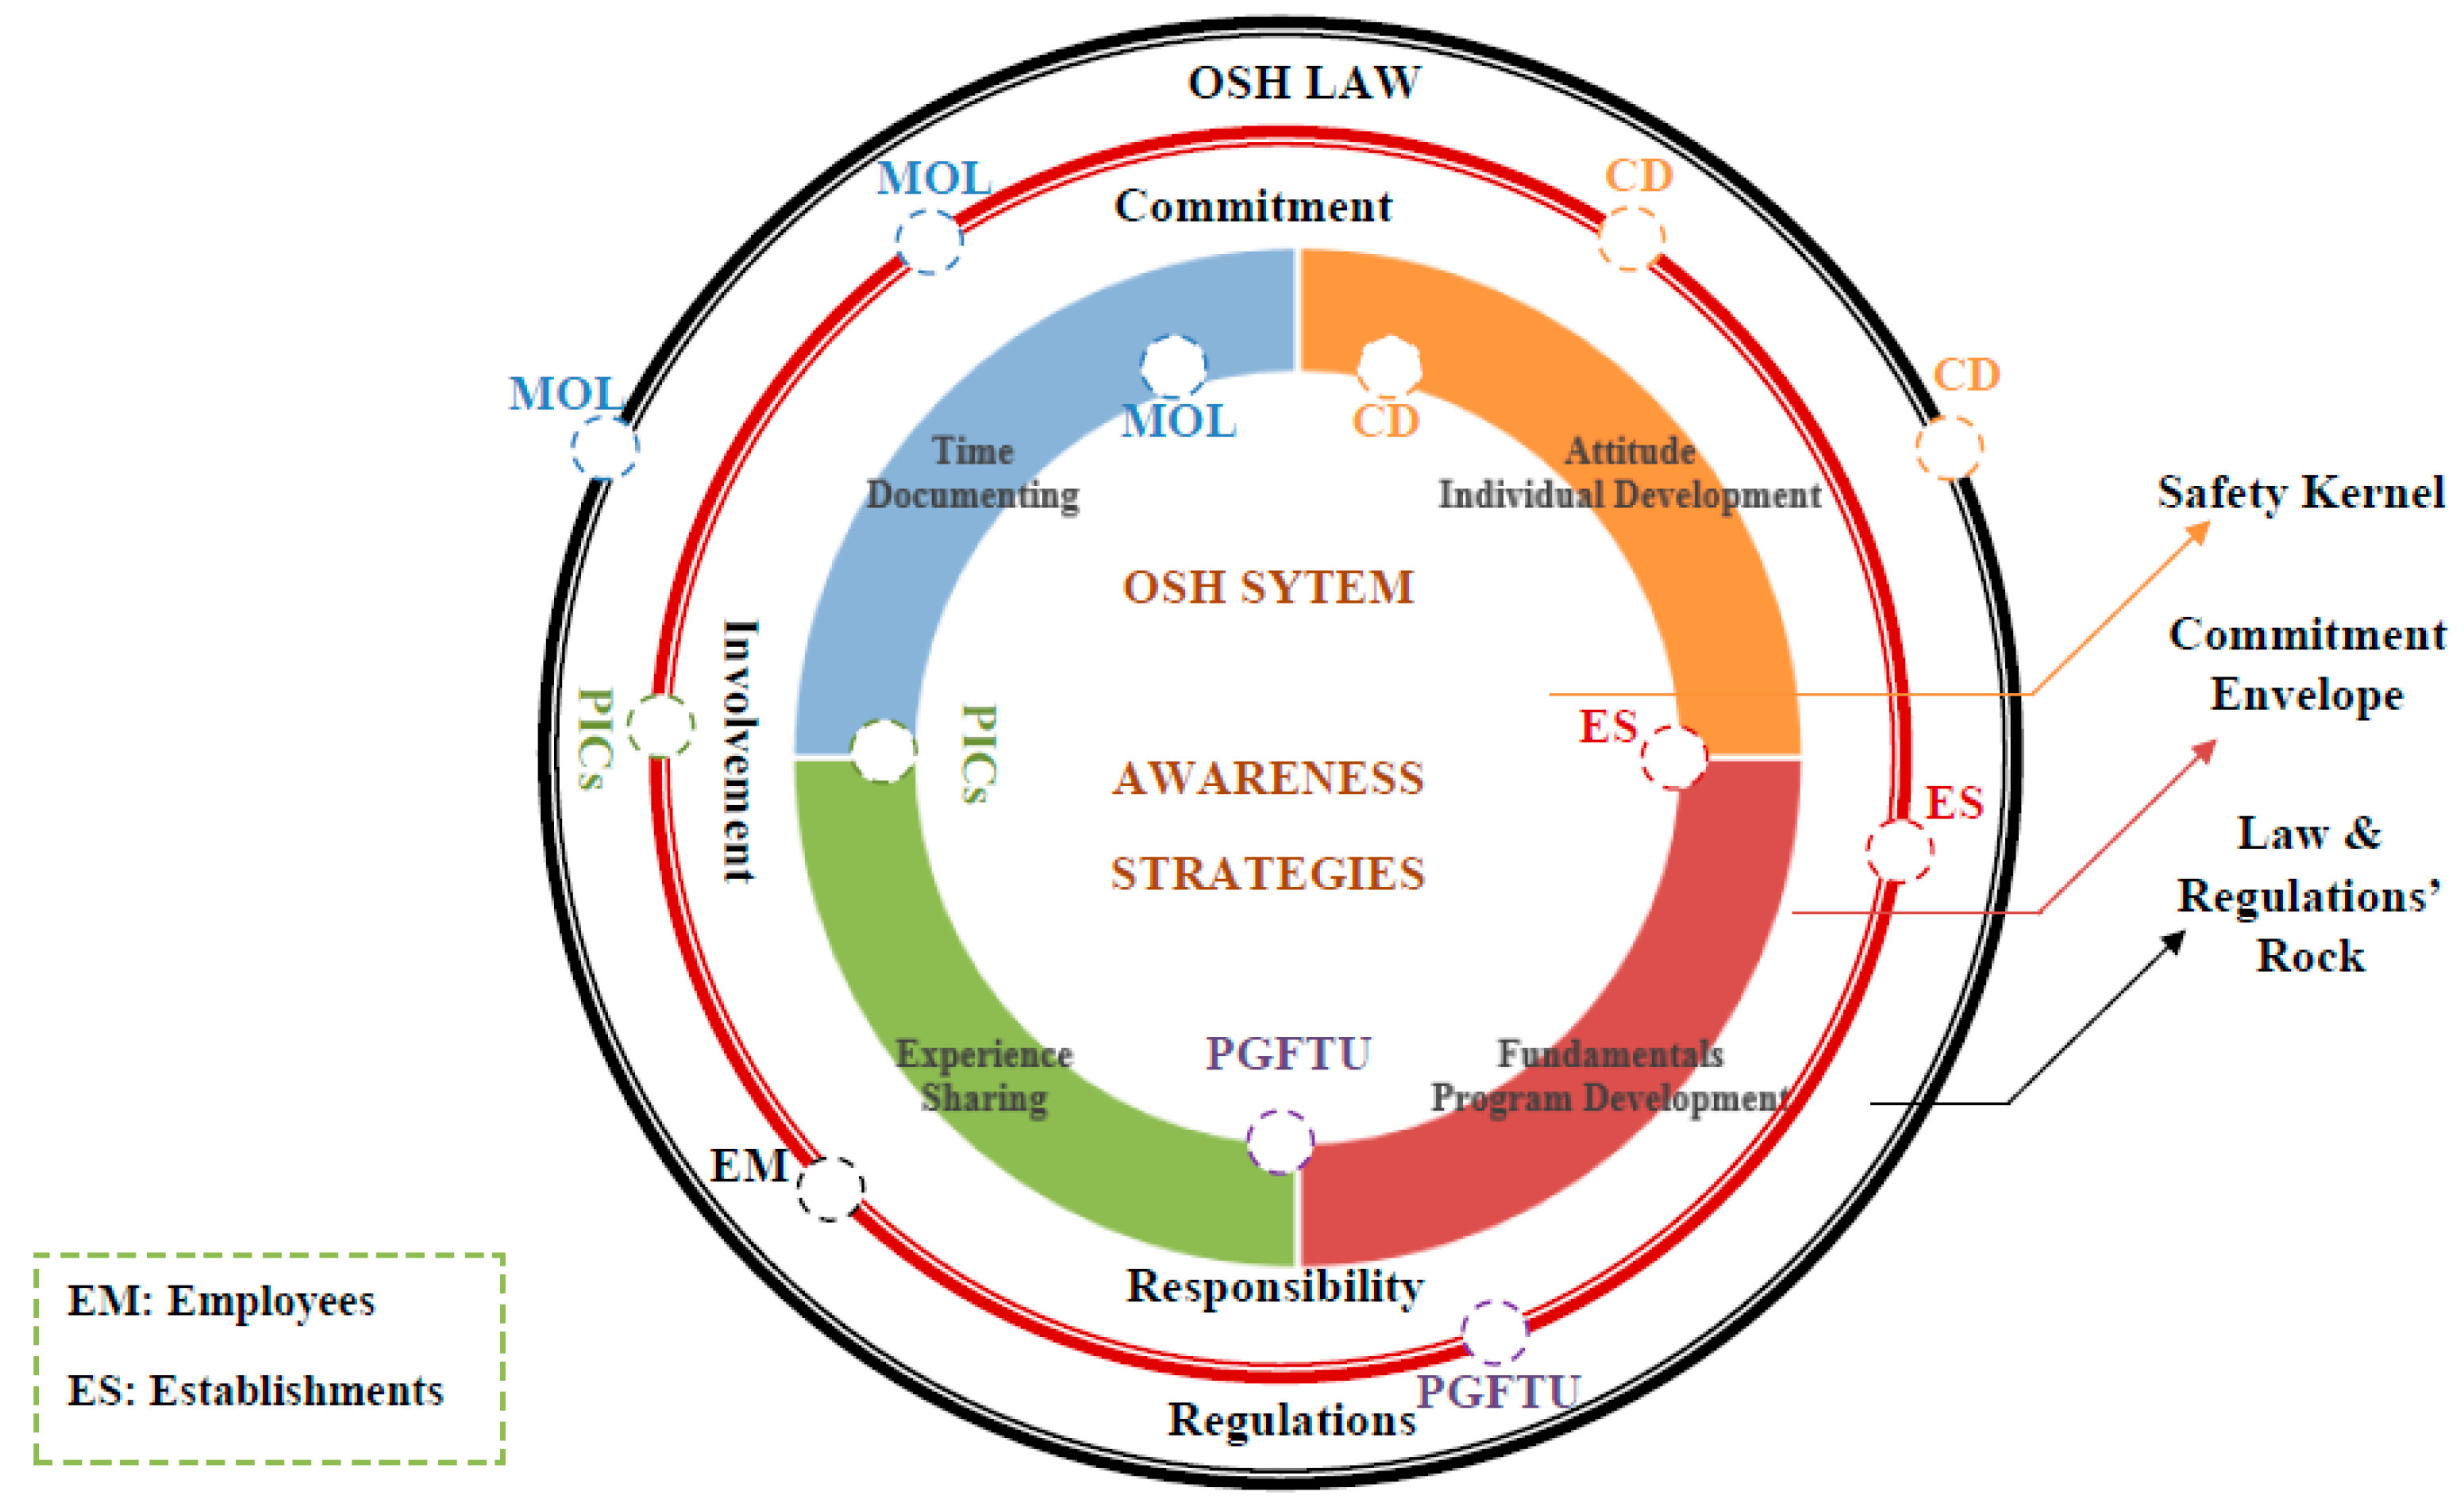
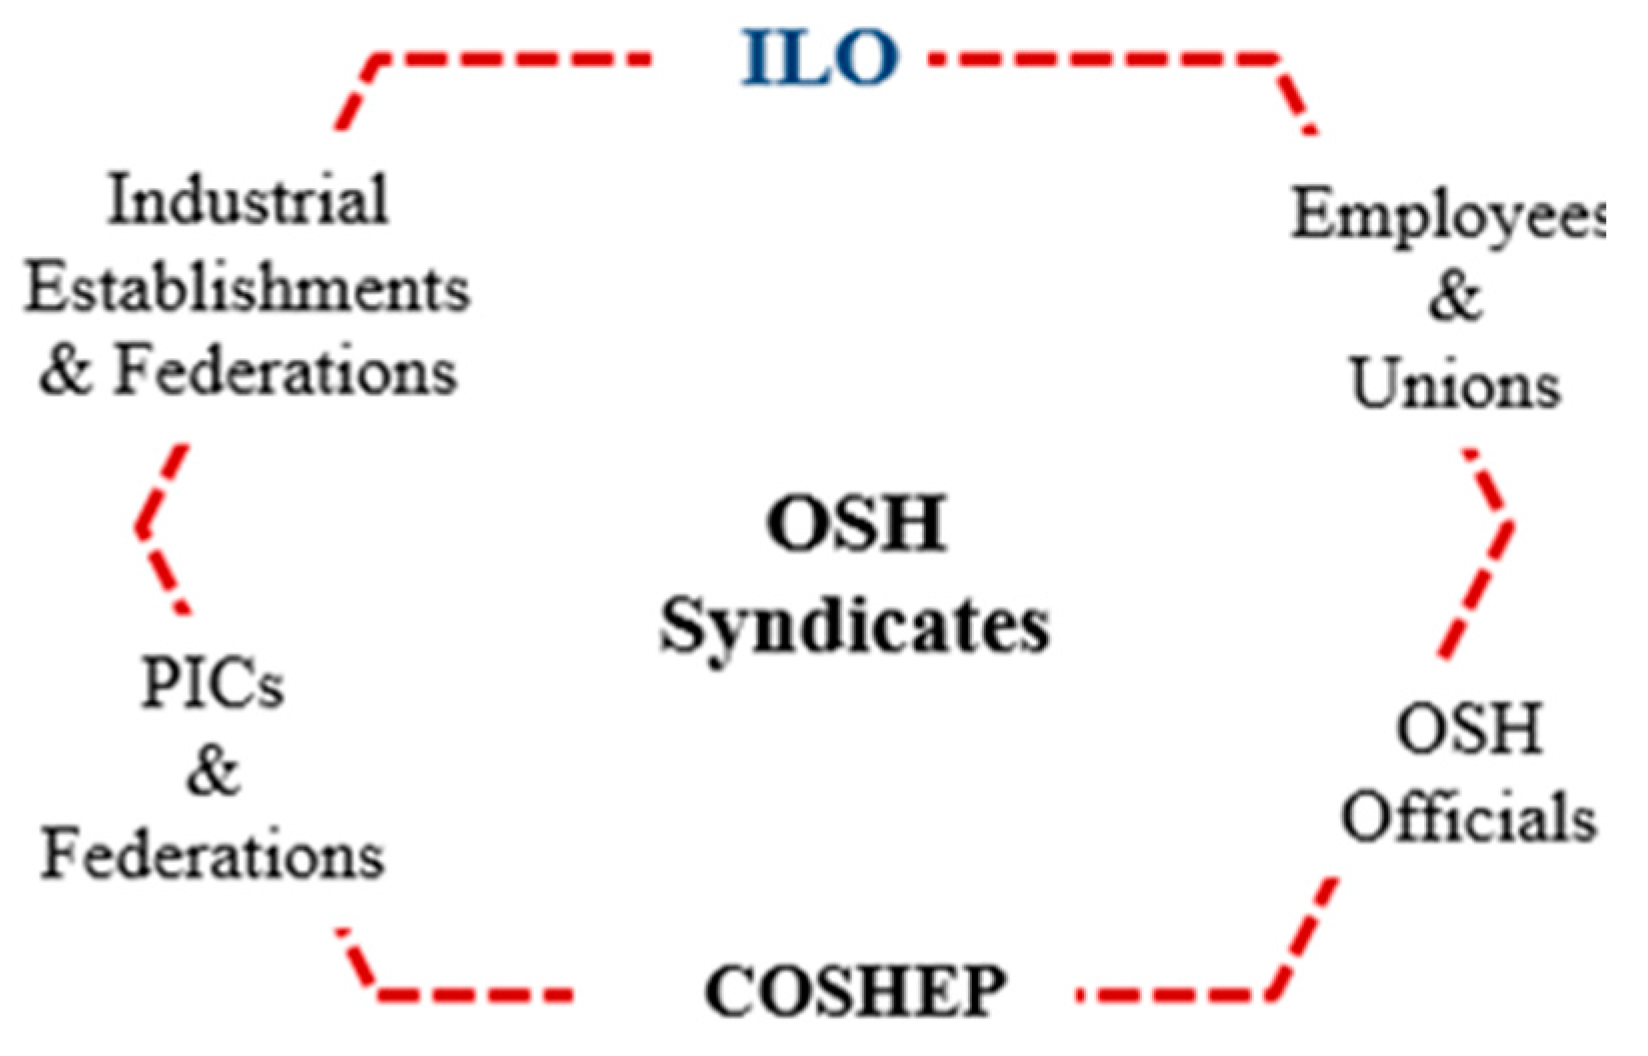
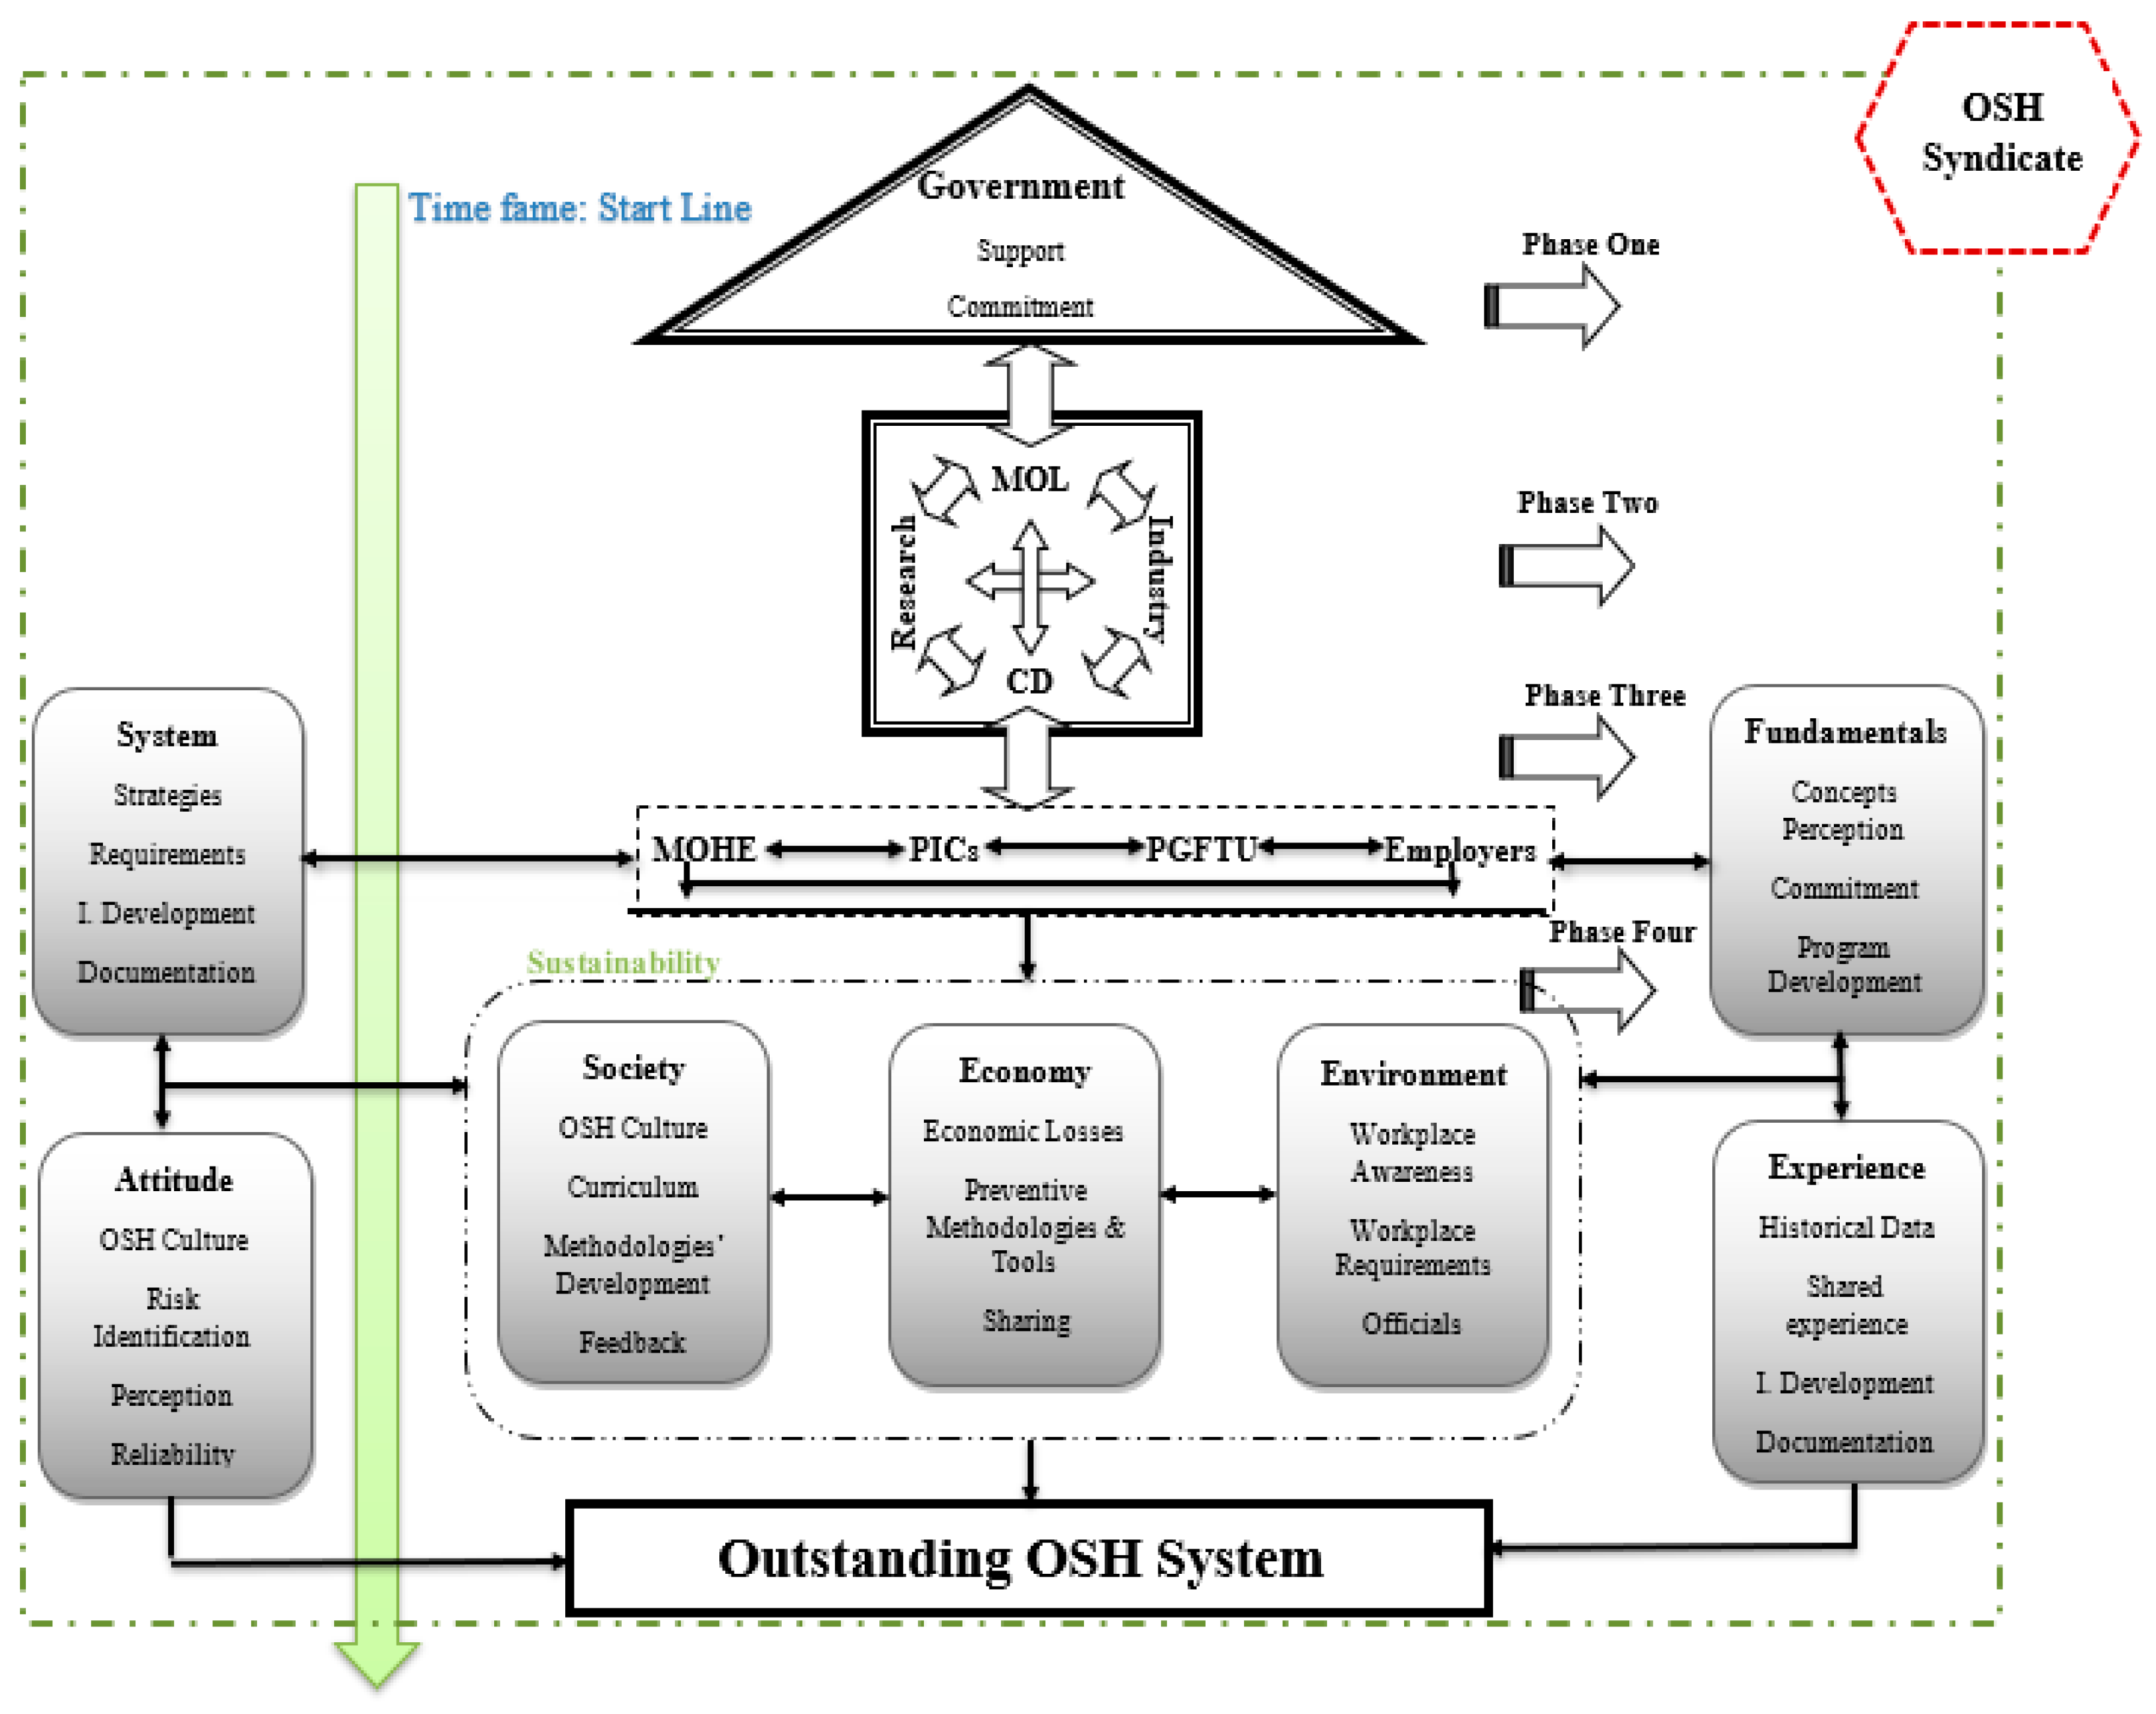
4. Discussion
- Successful application and enforcement of all the framework phases.
- Rigorous monitoring and following up on the framework development process away from any possible work obstacles that may result from issues like corruption, disruption, procrastination, indifference, or even any intentional and unintentional errors.
Author Contributions
Funding
Institutional Review Board Statement
Informed Consent Statement
Data Availability Statement
Acknowledgments
Conflicts of Interest
Appendix A. OSH Correlations
References
- Fidancı, İ.; Ozturk, O. General Overview on Occupational Health and Safety and Occupational Disease Subjects. J. Family Med. Health Care 2015, 1, 16–20. [Google Scholar] [CrossRef][Green Version]
- Takala, J.; Hämäläinen, P.; Nenonen, N.; Takahashi, K.; Chimed-Ochir, O.; Rantanen, J. Comparative Analysis of the Burden of Injury and Illness at Work in Selected Countries and Regions. Cent. Eur. J. Occup. Environ. Med. 2017, 23, 6–31. [Google Scholar]
- Rantenen, J. Research challenges arising from changes in work life. Scand. J. Work Environ. Health 1999, 25, 473–483. [Google Scholar] [CrossRef] [PubMed]
- Peckham, T.K.; Baker, M.G.; Camp, J.E.; Kaufman, J.D.; Seixas, N.S. Creating future for occupational health. Ann. Work Expo. Health 2017, 61, 3–15. [Google Scholar]
- Rommel, A.; Varnaccia, G.; Lahmann, N.; Kottner, J.; Kroll, L.E. Occupational Injuries in Germany: Population-Wide National Survey Data Emphasize the Importance of Work-Related Factors. PLoS ONE 2016, 11, e0148798. [Google Scholar] [CrossRef]
- Benach, J.; Vives, A.; Amable, M.; Vanroele, C.; Tarafa, G.; Muntaner, C. Precarious employment: Understanding an emerging social determinant of health. Ann. Rev. Public Health 2014, 35, 329–353. [Google Scholar] [CrossRef]
- Chen, P.Y.; Cooper, G.L. (Eds.) Work and well-being. In Well-Being: A Complete Reference Guide; John Wiley and Sons: West Sussex, UK, 2017; Volume 3. [Google Scholar]
- Hämäläinen, P. The Effect of Competitiveness on Occupational Safety. In Proceedings of the 2007 IEEE, Proceedings of theInternational Conference on Industrial Engineering and Engineering Management, Singapore, 2–4 December 2007. [Google Scholar] [CrossRef]
- Harrison, J.; Dawson, L. Occupational health: Meeting the challenges of the next 20 years. Saf. Health Work 2016, 7, 143–149. [Google Scholar] [CrossRef]
- Grzebieta, R.H. Welcome to Safety—A New Open Access Journal Helping Shape a Safer World. Safety 2015, 1, 1–6. [Google Scholar] [CrossRef]
- Watterson, A. Occupational Safety and Related Impacts on Health and the Environment. Int. J. Environ. Res. Public Health 2017, 13, 988. [Google Scholar] [CrossRef]
- Wang, B.; Wu, C.; Huang, L.; Zhang, L.; Kang, L.; Gao, K. Prevention and control of major accidents (MAs) and particularly serious accidents (PSAs) in the industrial domain in China: Current status, recent efforts and future prospects. Process Saf. Environ. Prot. 2018, 117, 254–266. [Google Scholar] [CrossRef]
- Yang, Y.; Reniers, G.; Chen, G.; Goerlandt, F. A bibliometric review of laboratory safety in universities. Saf. Sci. 2019, 120, 14–24. [Google Scholar] [CrossRef]
- McLellan, R.K. Work, Health, And Worker Well-Being: Roles and Opportunities for Employers. Health Aff. 2017, 36, 206–213. [Google Scholar] [CrossRef] [PubMed]
- Safety and Health Add Value. Available online: https://www.osha.gov/Publications/safety-health-addvalue.html (accessed on 12 August 2017).
- ILO. Plan Safe, Plan Healthy: Guidelines for Developing National Programmes on Occupational Safety and Health; International Labor Organization: Geneva, Switzerland, 2013. [Google Scholar]
- Cagno, E.; Micheli, G.J.L.; Perotti, S. Identification of OHS-related factors and interactions among those and OHS performances in SMEs. Saf. Sci. 2011, 49, 216–225. [Google Scholar] [CrossRef]
- Dekker, S.; Cilliers, P.; Hofmeyr, J.H. The complexity of failure: Implications of complexity theory for safety investigations. Saf. Sci. 2011, 49, 939–945. [Google Scholar] [CrossRef]
- O’Reilly, D.; Rosato, M. Worked to death? A census-based longitudinal study of the relationship between the numbers of hours spent working and mortality risk. Int. J. Epidemiol. 2013, 42, 1820–1830. [Google Scholar] [CrossRef] [PubMed]
- Karasek, R.; Theorell, T. Healthy Work: Stress, Productivity, and the Reconstruction of Working Life; Basic Books: New York, NY, USA, 1990. [Google Scholar]
- Aas, A. The human factors assessment and classification system (HFACS) for the oil & gas industry. In Proceedings of the International Petroleum Technology Conference, Kuala Lumpur, Malaysia, 3–5 December 2008. [Google Scholar]
- Peters, G.A.; Peters, B.J. Human Error: Causes and Control; CRC/Taylor & Francis: Boca Raton, FL, USA, 2006. [Google Scholar]
- Verma, S.; Chaudhari, S. Safety of Workers in Indian Mines: Study, Analysis, and Prediction. Saf. Health Work 2017, 8, 267–275. [Google Scholar] [CrossRef]
- Yanar, B.; Lay, M.; Smith, P. The Interplay Between Supervisor Safety Support and Occupational Health and Safety Vulnerability on Work Injury. Saf. Health Work 2019, 10, 172–179. [Google Scholar] [CrossRef]
- Zaki, G.R.; El-Marakby, F.A.; El-Nor, Y.H.D.; Nofal, F.H.; Zakaria, A.M. Occupational safety of different industrial sectors in Khartoum State, Sudan. Part 1: Safety performance evaluation. J. Egypt. Public Health Assoc. 2012, 87, 131–136. [Google Scholar] [CrossRef]
- Habib, R.R. Overview of the Occupational Safety & Health Situation in the Arab Region; International Labour Organization: Geneva, Switzerland.
- Zekri, M.K. Construction Safety and Health Performance in Dubai. Master’s Thesis, Heriot Watt University, Dubai, United Arab Emirates, 2013; pp. 1–84. [Google Scholar]
- Staff, T. Work-Related Deaths in Israel among Highest in West, Report Finds. 2016. Timesofisrael.com. Available online: https://www.timesofisrael.com/work-related-deaths-in-israel-among-highest-in-west-report-finds/ (accessed on 10 November 2017).
- Eldar, S. Israel’s construction SECTOR Deadly for Arab Workers. 2017. Al-Monitor. Available online: https://www.al-monitor.com/pulse/originals/2017/09/israel-palestine-construction-workers-accidents-human-rights.html (accessed on 10 November 2017).
- Stemn, E. Analysis of Injuries in the Ghanaian Mining Industry and Priority Areas for Research. Saf. Health Work 2019, 10, 151–165. [Google Scholar] [CrossRef]
- Al-Thani, H.; El-Menyar, A.; Consunji, R.; Mekkodathil, A.; Peralta, R.; Allen, K.A.; Hyder, A.A. Epidemiology of occupational injuries by nationality in Qatar: Evidence for focused occupational safety programmes. Injury 2015, 46, 1806–1813. [Google Scholar] [CrossRef]
- Government of Qatar. Qatar Labor Force Statistics. In Qatar Open Data Portal; Government of Qatar: Doha, Qatar, 2019. [Google Scholar]
- Consunji, R.; Mehmood, A.; Hirani, N.; El-Menyar, A.; Abeid, A.; Hyder, A.; Peralta, R. Occupational Safety andWork-Related Injury Control Effeorts in Qatar: Lessons Learned from a Rabidly Developing Economy. Int. J. Environ. Res. Public Health 2020, 17, 6906. [Google Scholar] [CrossRef] [PubMed]
- GFPTU. Annual Reports of Injuries and Work Accidents; The General Federation of Palestinian Trade Unions: Ramallah, Palestinian, 2016. [Google Scholar]
- PICS. Annual Reports of Injuries and Work Accidents; The Palestinian insurance companies: Ramallah, Palestine, 2016. [Google Scholar]
- MOL. Annual Report; MOL: Ramallah, Palestine, 2019. [Google Scholar]
- Atturk, L.; Abu-Arra, M. Work Injuries and Compensation in Palestine. In Ramallah: Center for Democracy and Workers Rights (DWRC); The Democracy and Workers’ Rights Center: Ramallah, Palestine, 2014. [Google Scholar]
- NOSHC. National description of the Occupational Safety and Health; National Occupational Safety and Health Committee (NOSHC): Ramallah, Palestine, 2015. [Google Scholar]
- The situation of workers of the occupied Arab territories. In International Labour Conference; 106th Session; International Labour Office: Geneva, Switzerland, 2017; pp. 1–54.
- MoL. Annual Report of Injuries and Work Accidents; Ministry of Labor: Ramallah, Palestinian, 2016. [Google Scholar]
- Al Habeel, W.; Aiesh, A. Evaluating Effectiveness of Occupational Safety and Health Measures in the Scientific Laboratories in the Palestinian Universities in Gaza Strip: A Field Study. J. Islam. Univ. Econo. Adm. Stud. 2012, 83–143. [Google Scholar]
- Mohammed, B. Relationship of Learning Organization to Promote Occupational Health and Safety in Medical Imaging Departments at Governmental Hospitals—Gaza strip; Gaza Strip: Al-Azhar University-Gaza, Gaza, Palestinian.
- Abu Zeiter, S. Safety and Occupational Health and Its Role in Human Development and Reducing Unemployment. Available online: http://www.m.ahewar.org/s.asp?aid=596687&r=0 (accessed on 4 November 2018).
- Al Moghny, O. The reality of occupational safety and health measures used in the manufacturing sector in the Gaza Strip; Gaza Strip: The Islamic University, Gaza, Palestinian.
- Salem, S. Occupational Health and Safety in Industrial Establishments in Palestine. Al-Quds Open Univ. Sci. J. 1–44.
- The Occupied Palestinian Territory: An Employment Diagonestic Study; International Labor Organization (ILO): Geneva, Switzerland, 2018.
- USAID; PFI. The Current Status of Industrial Sector in Palestine; CARANA; USAID: Ramallah, Palestine, 2009. [Google Scholar]
- PSBC. Economic Survey Series, 2015: Basic Results; Standard Bureau of Statistics: Ramallah, Palestinian, 2016. [Google Scholar]
- Saunders, M.; Lewis, P.; Thornhill, A. Research Methods for Business Students, 5th ed.; Pearson Education, Inc.: Boston, MA, USA, 2009. [Google Scholar]
- Thompson, S. Sampling., 3rd ed.; John Wiley & Sons, Inc.: New York, NY, USA, 2012. [Google Scholar]
- Jain, A.K.; Hausman, R.E. Stratified Multistage Sampling. Encycl. Stat. Sci. 2014. [Google Scholar] [CrossRef]
- Gupta, T.; Dubey, S. Field performance evaluation of a newly developed PM2. 5 sampler at IIT Kanpur. Sci. Total. Environ. 2011, 409, 3500–3507. [Google Scholar] [CrossRef]
- Braun, V.; Clarke, V. Using thematic analysis in psychology. Qual. Res. Psychol. 2006, 3, 77–101. [Google Scholar] [CrossRef]
- Crowl, D.; Louvar, J. Chemical Process Safety: Fundamentals with Applications, 2nd ed.; Prentice Hall PTR: Upper Saddle River, NJ, USA, 2002. [Google Scholar]
- Close, B. Analysis of the Safety Perfonnance Measurement System at Company XYZ. Master’s Thesis, University of Wisconsin-Stout, Menomonie, WI, USA, 2010. [Google Scholar]
- Chacko, N.; Gopinadhan, P. Integrated Safety Management System in a Construction Organization: A Feasibility Study. IRJET 2016, 3, 2759–2763. [Google Scholar]
- WSH. Workplace Safety and Health Report 2016. In National Statistics 2016; Workplace Safety and Health Institute (WSH): Singapore, 2016. [Google Scholar]
- Venkataraman, N. Safety Performance Factor. JOSE 2008, 14, 327–331. [Google Scholar] [CrossRef][Green Version]
- Aaltonen, M. Occupational injuries in the Finnish furniture industry. Scand. J. Work Environ. Health 1996, 22, 197–203. [Google Scholar] [CrossRef]
- Ceylan, H. Analysis of Occupational Accidents According to The Sectors in Turkey. GU J. Sci. 2012, 25, 909–918. [Google Scholar]
- Carrillo-Castrillo, J.A.; Guadix, J.; Rubio-Romero, J.C.; Onieva, L. Estimation of the relative risks of musculoskeletal injuries in the Andalusian manufacturing sector. Int. J. Ind. Ergon. 2016, 52, 69–77. [Google Scholar] [CrossRef]
- HSA. Summary of Workplace Injury, Illness and Fatality Statistics 2016–2017; The Health and Safety Authority: Dublin, Ireland, 2018. [Google Scholar]
- U.S. Bureau of Labour Statistics. Available online: https://www.bls.gov/web/osh/summ1_00.htm (accessed on 22 January 2019).
- HSE. Health and Safety in Manufacturing in Great Britain, 2014/2015; Health and Safety Executives: London, UK, 2015. [Google Scholar]
- Lagerstrom, E.; Magzamen, S.; Kines, P.; Brazile, W.; Rosecrance, J. Determinants of Safety Climate in the Professional Logging Industry. Safety 2019, 5, 35. [Google Scholar] [CrossRef]
- Jedynska, A.; Kuijpers, E.; Van den Berg, C.; Kruizinga, A.; Meima, M.; Spaan, S. Biological Agents and Work-Related Diseases: Results of a Literature Review, Expert Survey and Analysis of Monitoring Systems: European Risk Observatory Literature Review; The European Agency for Safety and Health at Work (EU-OSHA): Luxembourg, 2019. [Google Scholar] [CrossRef]
- Makin, A.; Winder, C. A new conceptual framework to improve the application of occupational health and safety management systems. Saf. Sci. 2008, 46, 935–948. [Google Scholar] [CrossRef]
- Sarsour, A.; Ayoub, A.; Shahrour, I. Rapid assessment of occupational health and safety measures for personnel handling healthcare waste in the Gaza Strip, Palestine. Int. J. Environ. Health 2014, 7, 156–170. [Google Scholar] [CrossRef]
- Kamar, I.; Che Ahmad, A. A Conceptual Framework of Safety and Health in Construction Management. MATEC Web Conf. EDP Sci. 2016, 66, 00107. [Google Scholar] [CrossRef]
- Campo, G.; Cegolon, L.; De Merich, D.; Fedeli, U.; Pellicci, M.; Heymann, W.; Mastrangelo, G. The Italian National Surveillance System for Occupational Injuries: Conceptual Framework and Fatal Outcomes, 2002–2016. Int. J. Environ. Res. Public Health 2020, 17, 7631. [Google Scholar] [CrossRef]


| All O.A | M.A | P.D | O.F | O.D | OWD | |
|---|---|---|---|---|---|---|
| 2009 | 444 | 270 | 46 | 9 | 1 | 105 |
| 2010 | 549 | 234 | 54 | 14 | 2 | 107 |
| 2011 | 399 | 175 | 31 | 13 | 3 | 96 |
| 2012 | 715 | 268 | 64 | 12 | NA | NA |
| 2013 | 752 | 269 | 20 | 20 | NA | NA |
| 2014 | 650 | 278 | 79 | 12 | 1 | 245 |
| 2015 | 664 | 260 | 35 | 21 | NA | 138 |
| 2016 | 682 | 233 | 20 | 15 | NA | NA |
| 2017 | 496 | 227 | 23 | 7 | NA | 320 |
| 2018 | 561 | 312 | 20 | NA | NA | 290 |
| Total | 5224 | 2122 | 368 | 119 | 7 | 862 |
| OSH Rate | Symbol | Definition | Reference |
|---|---|---|---|
| US-OSHA Rates (based on 200,000 h of worker exposure to a hazard) | |||
| Incident Rate | IR1 | Number of occupational injuries and/or illnesses or lost workdays per 100 full-time employees. | [54] |
| IR2 | |||
| Fatal Accident Rate | FAR | Number of fatalities based on 1000 employees working their entire lifetime or 108 working hours over total hours worked by all employees during the period covered | [54] |
| Lost Time Case Rate | LTC | Number of lost time cases × 200,000 over the number of employees’ labor hour worked days. | [55] |
| Severity Rate | SR | Total number of lost workdays by the total number of recordable incidents. | [57] |
| EU-OSHA Rates (based on 100,000 workers exposed to risk employees) | |||
| Fatality Rate | FR | Number of fatalities expected per person per year. | [56] |
| Workplace Injury Rate | IR | Number of workplace injuries of the total number of employees per 100,000 employed persons. | [57,58] |
| Accident Frequency Rate | AFR | Number of workplace accidents reported per number of human-hours worked × 1,000,000 | [57,58] |
| Accident Severity Rate | ASR | Number of reported human-days lost × 1,000,000/number of human-hours worked. | [57,58] |
| Occupational Disease Incidents Rate | ODIR | Number of workplace diseases of the total number of employees per 100,000 employed persons. | [57] |
| Severity Indicators | |||
| Safety Performance Factor | SPF | Number of working hours/days lost due to each occupational accident, regardless of its severity. | [58] |
| Frequency Severity Index | FSI | A combined formula for both AFR and ASR that gives a combined effect of accidents/injuries happened and the corresponding working days lost. | [56] |
| BHSR | 2018 | |
|---|---|---|
| Workplace | Employees | |
| Fire extinguishing means | 68.0% | 85.1% |
| First aid tools | 97.7% | 94.9% |
| Emergency exits | 82.8% | 77.6% |
| Awareness and guidance | 73.0% | 83.0% |
| Primary medical examinations | 32.4% | 33.5% |
| Periodic medical examinations | 31.4% | 25.8% |
| Reporting accidents | 85.3% | 90.4% * |
| Workers insurance | 95.1% | 92.9% |
| Employers | Employees | |
|---|---|---|
| Ministry of Labor | 29.5% | 25.1% |
| Ministry of Health | 13.0% | 17.7% |
| Civil Defense | 46.7% | 30.2% |
| Ministry of National Economy | 2.2% | 14.3% |
| Ministry of Environment | 1.4% | 12.7% |
| Others | 7.2% | 0.0% |
| 2009 | 201 0 | 2011 | 2012 | 2013 | 2014 | 2015 | 2016 | 2017 * | |
|---|---|---|---|---|---|---|---|---|---|
| MoL | 270 | 234 | 175 | 268 | 269 | 278 | 259 | 232 | 135 |
| PICs | NA | NA | +1900 | +2000 | NA | NA | 3500 | 3000 | NA |
| Industrial Sector | Fixed Employees | O. A | O. I | O. F | O. D | LWH (days) | Estimated Losses (US$) |
|---|---|---|---|---|---|---|---|
| Leather and Shoes Industries | 2445 | 33 | 31 | 0 | 8 | 555 | 10,045 |
| Plastic Industries | 6649 | 1387 | 583 | 1 | 3 | 1664 | 6600 |
| Paper and Cartoon Industries | 1989 | 184 | 186 | 0 | 3 | 521 | 49,150 |
| Chemical Industries | 1737 | 51 | 46 | 0 | 11 | 194 | 1850 |
| Wood and Furniture Industries | 2266 | 138 | 109 | 0 | 0 | 907 | 137,800 |
| Food and beverages Industries | 6669 | 376 | 262 | 2 | 26 | 2041 | 50,190 |
| Aluminium and Metallurgical Industries | 6273 | 941 | 896 | 1 | 1 | 3002 | 66,020 |
| Entire Industrial Sector | 28,028 | 3110 | 2113 | 4 | 52 | 8884 | 321,655 |
| Industrial Sector | IR1 | IR2 | FAR | LTC | SR |
|---|---|---|---|---|---|
| Leather and Shoes Industries | 1.5 | 20.3 | 0.0 | 1.4 | 13.2 |
| Plastic Industries | 18.8 | 21.1 | 6.4 | 8.0 | 1.2 |
| Paper and Cartoon Industries | 8.5 | 24.4 | 0.0 | 8.5 | 2.9 |
| Chemical Industries | 3.2 | 9.0 | 0.0 | 2.2 | 3.3 |
| Wood and Furniture Industries | 7.5 | 50.5 | 0.0 | 5.8 | 6.9 |
| Food and beverages Industries | 5.3 | 26.1 | 10.4 | 3.7 | 4.7 |
| Aluminium andMetallurgical Industries | 13.7 | 42.8 | 6.5 | 13.0 | 3.2 |
| Entire Industrial Sector | 10.3 | 28.1 | 5.4 | 7.1 | 2.8 |
| Industrial Sector | IR | FR | AFR | ASR | ODIR |
|---|---|---|---|---|---|
| Leather and Shoes Industries | 1271.9 | 0.0 | 6.1 | 101.5 | 320.9 |
| Plastic Industries | 8820.4 | 1.40 × 10⁻⁴ | 94.1 | 105.8 | 39.4 |
| Paper and Cartoon Industries | 9329.1 | 0.0 | 41.9 | 122.2 | 127.5 |
| Chemical Industries | 2646.0 | 0.0 | 13.2 | 44.9 | 572.2 |
| Wood and Furniture Industries | 6640.3 | 0.0 | 37.3 | 252.7 | 0.0 |
| Food and beverages Industries | 3799.3 | 2.30 × 10⁻⁴ | 24.9 | 130.3 | 348.4 |
| Aluminium andMetallurgical Industries | 14,418.8 | 1.43 × 10⁻⁴ | 68.3 | 214.0 | 14.3 |
| Average Entire Industrial Sector | 7656.0 | 1.18 × 10⁻⁴ | 50.6 | 140.4 | 169.9 |
Publisher’s Note: MDPI stays neutral with regard to jurisdictional claims in published maps and institutional affiliations. |
© 2021 by the authors. Licensee MDPI, Basel, Switzerland. This article is an open access article distributed under the terms and conditions of the Creative Commons Attribution (CC BY) license (http://creativecommons.org/licenses/by/4.0/).
Share and Cite
Tuhul, H.S.; El-Hamouz, A.; Hasan, A.R.; Jafar, H.A. Development of a Conceptual Framework for Occupational Safety and Health in Palestinian Manufacturing Industries. Int. J. Environ. Res. Public Health 2021, 18, 1338. https://doi.org/10.3390/ijerph18031338
Tuhul HS, El-Hamouz A, Hasan AR, Jafar HA. Development of a Conceptual Framework for Occupational Safety and Health in Palestinian Manufacturing Industries. International Journal of Environmental Research and Public Health. 2021; 18(3):1338. https://doi.org/10.3390/ijerph18031338
Chicago/Turabian StyleTuhul, Hanan S., Amer El-Hamouz, A. Rasem Hasan, and Hanan A. Jafar. 2021. "Development of a Conceptual Framework for Occupational Safety and Health in Palestinian Manufacturing Industries" International Journal of Environmental Research and Public Health 18, no. 3: 1338. https://doi.org/10.3390/ijerph18031338
APA StyleTuhul, H. S., El-Hamouz, A., Hasan, A. R., & Jafar, H. A. (2021). Development of a Conceptual Framework for Occupational Safety and Health in Palestinian Manufacturing Industries. International Journal of Environmental Research and Public Health, 18(3), 1338. https://doi.org/10.3390/ijerph18031338