
Health Behaviors of Austrian Secondary Level Pupils at a Glance: First Results of the From Science 2 School Study Focusing on Sports Linked to Mixed, Vegetarian, and Vegan Diets

 ,
,  ,
, 
 ,
,  and
and
Abstract
:1. Introduction
2. Materials and Methods
2.1. Study Protocol and Ethics Approval
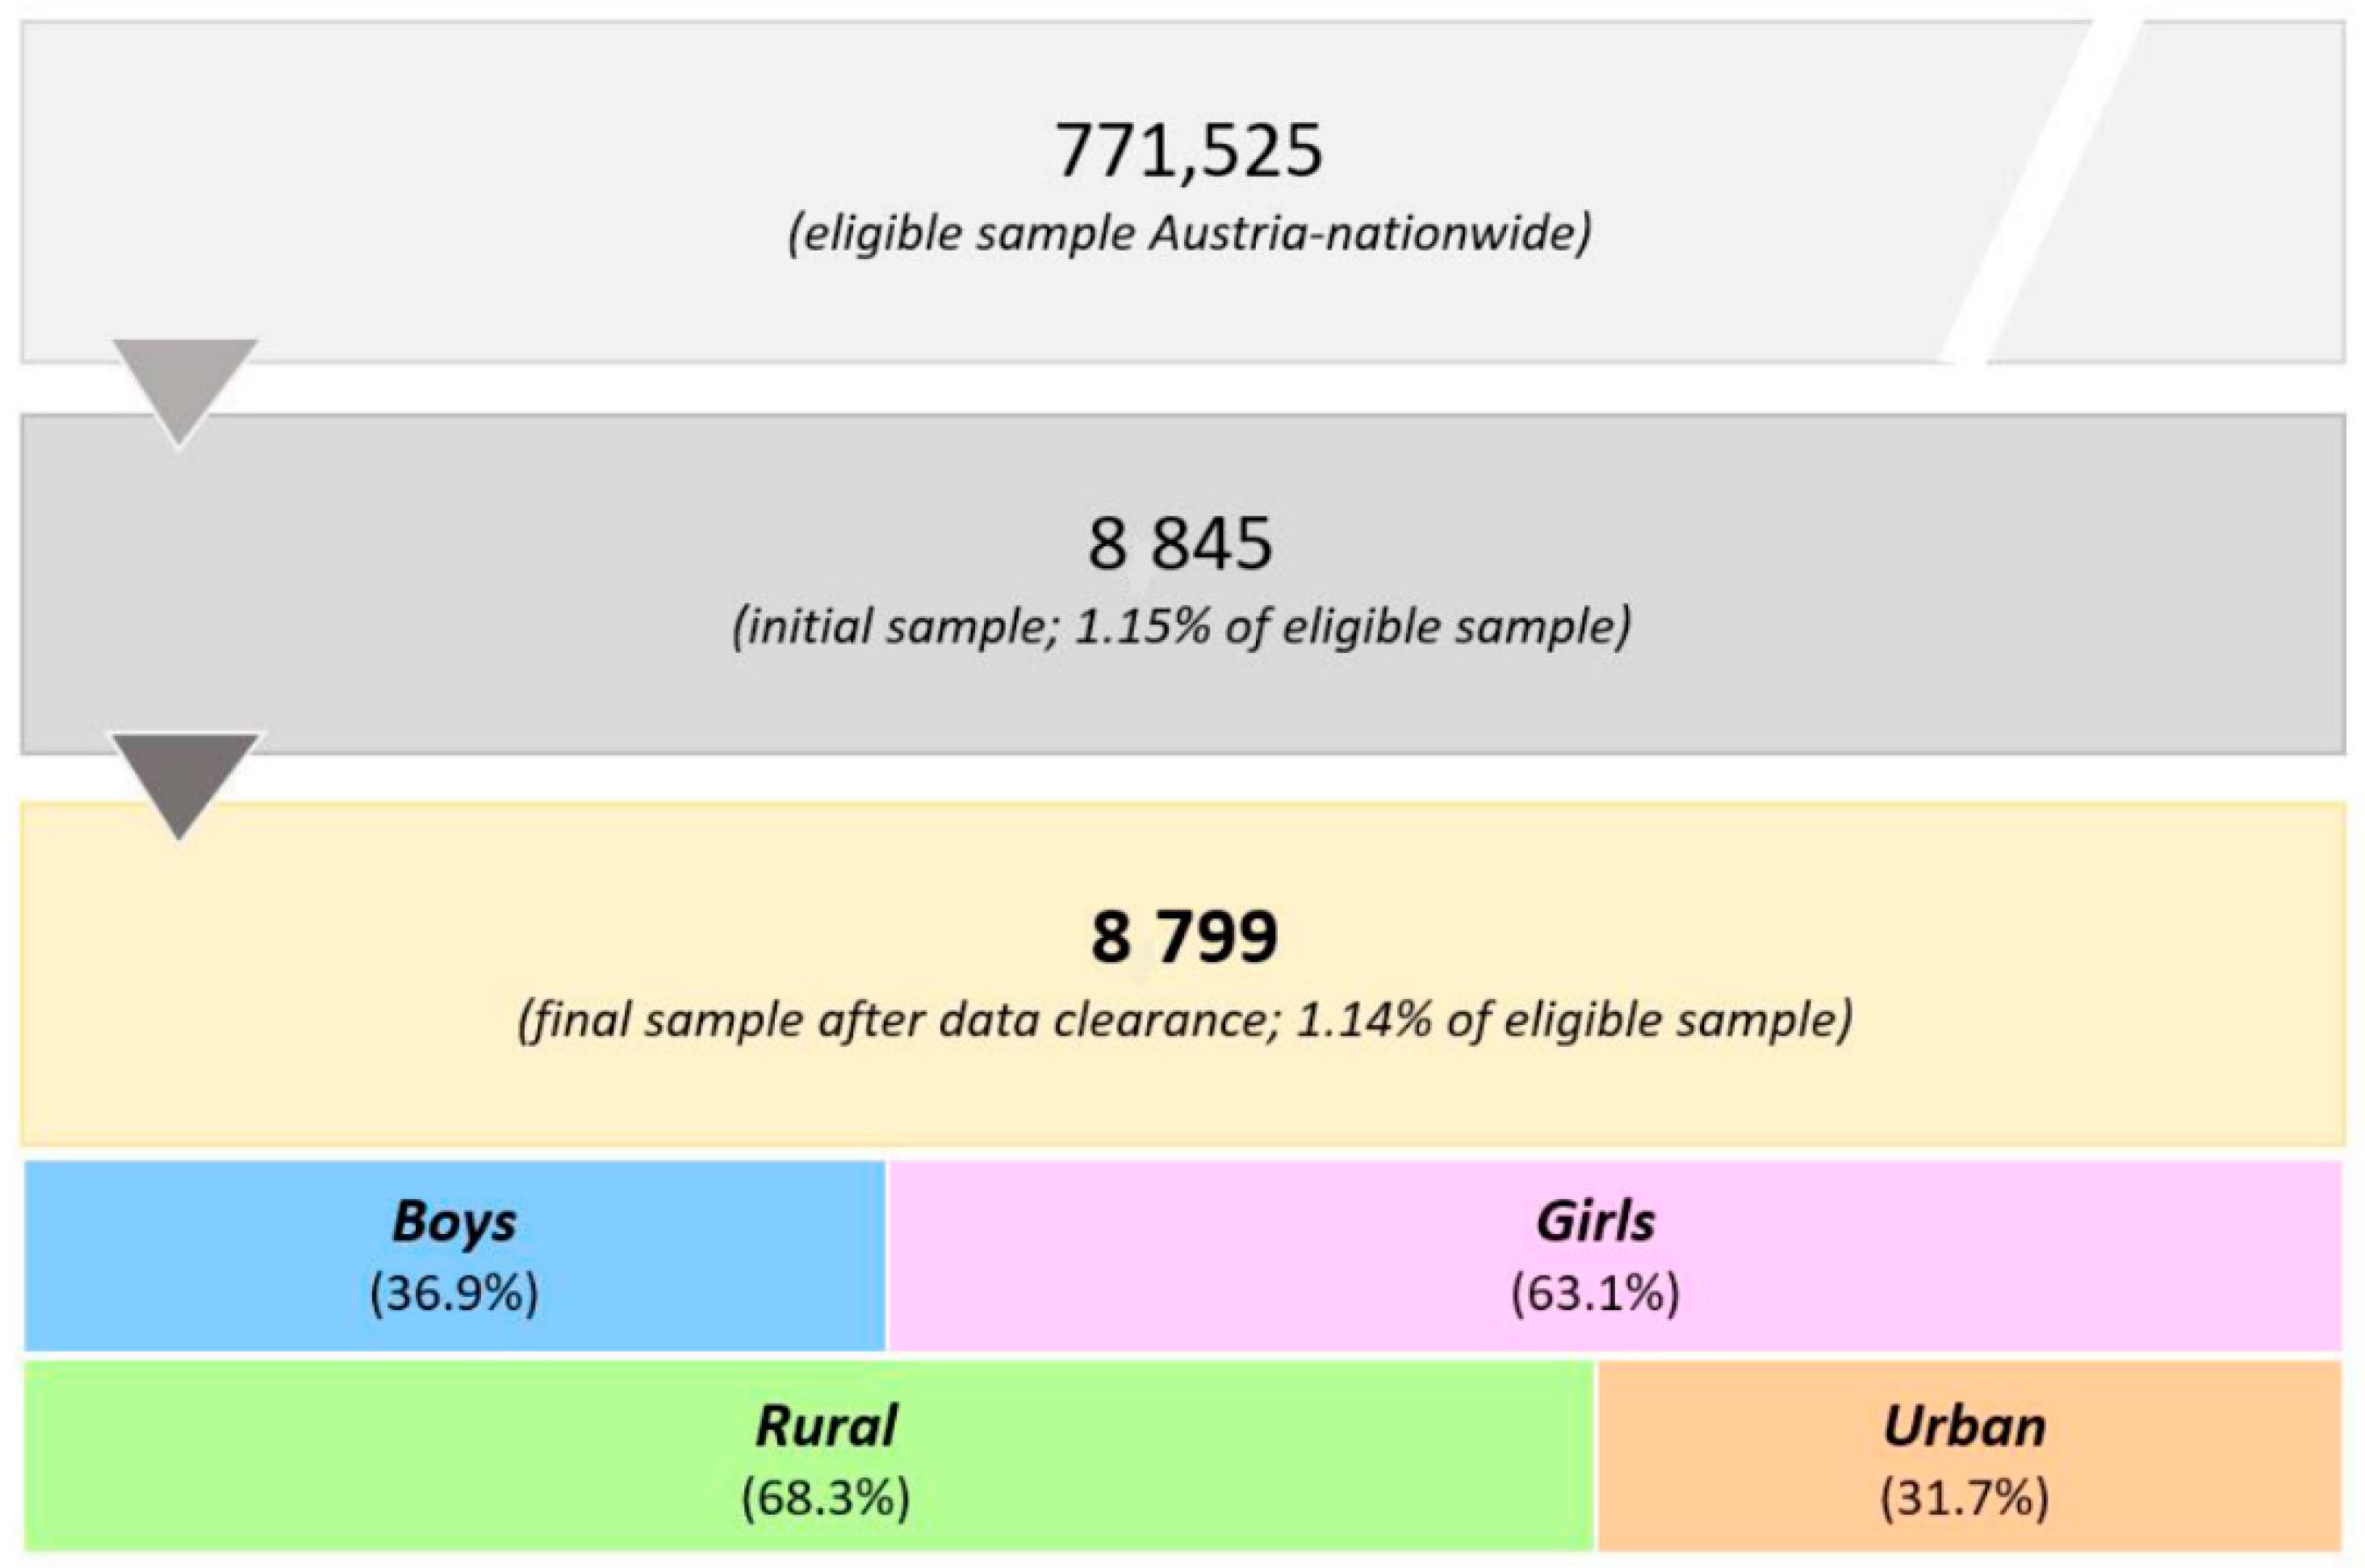
2.2. Participants
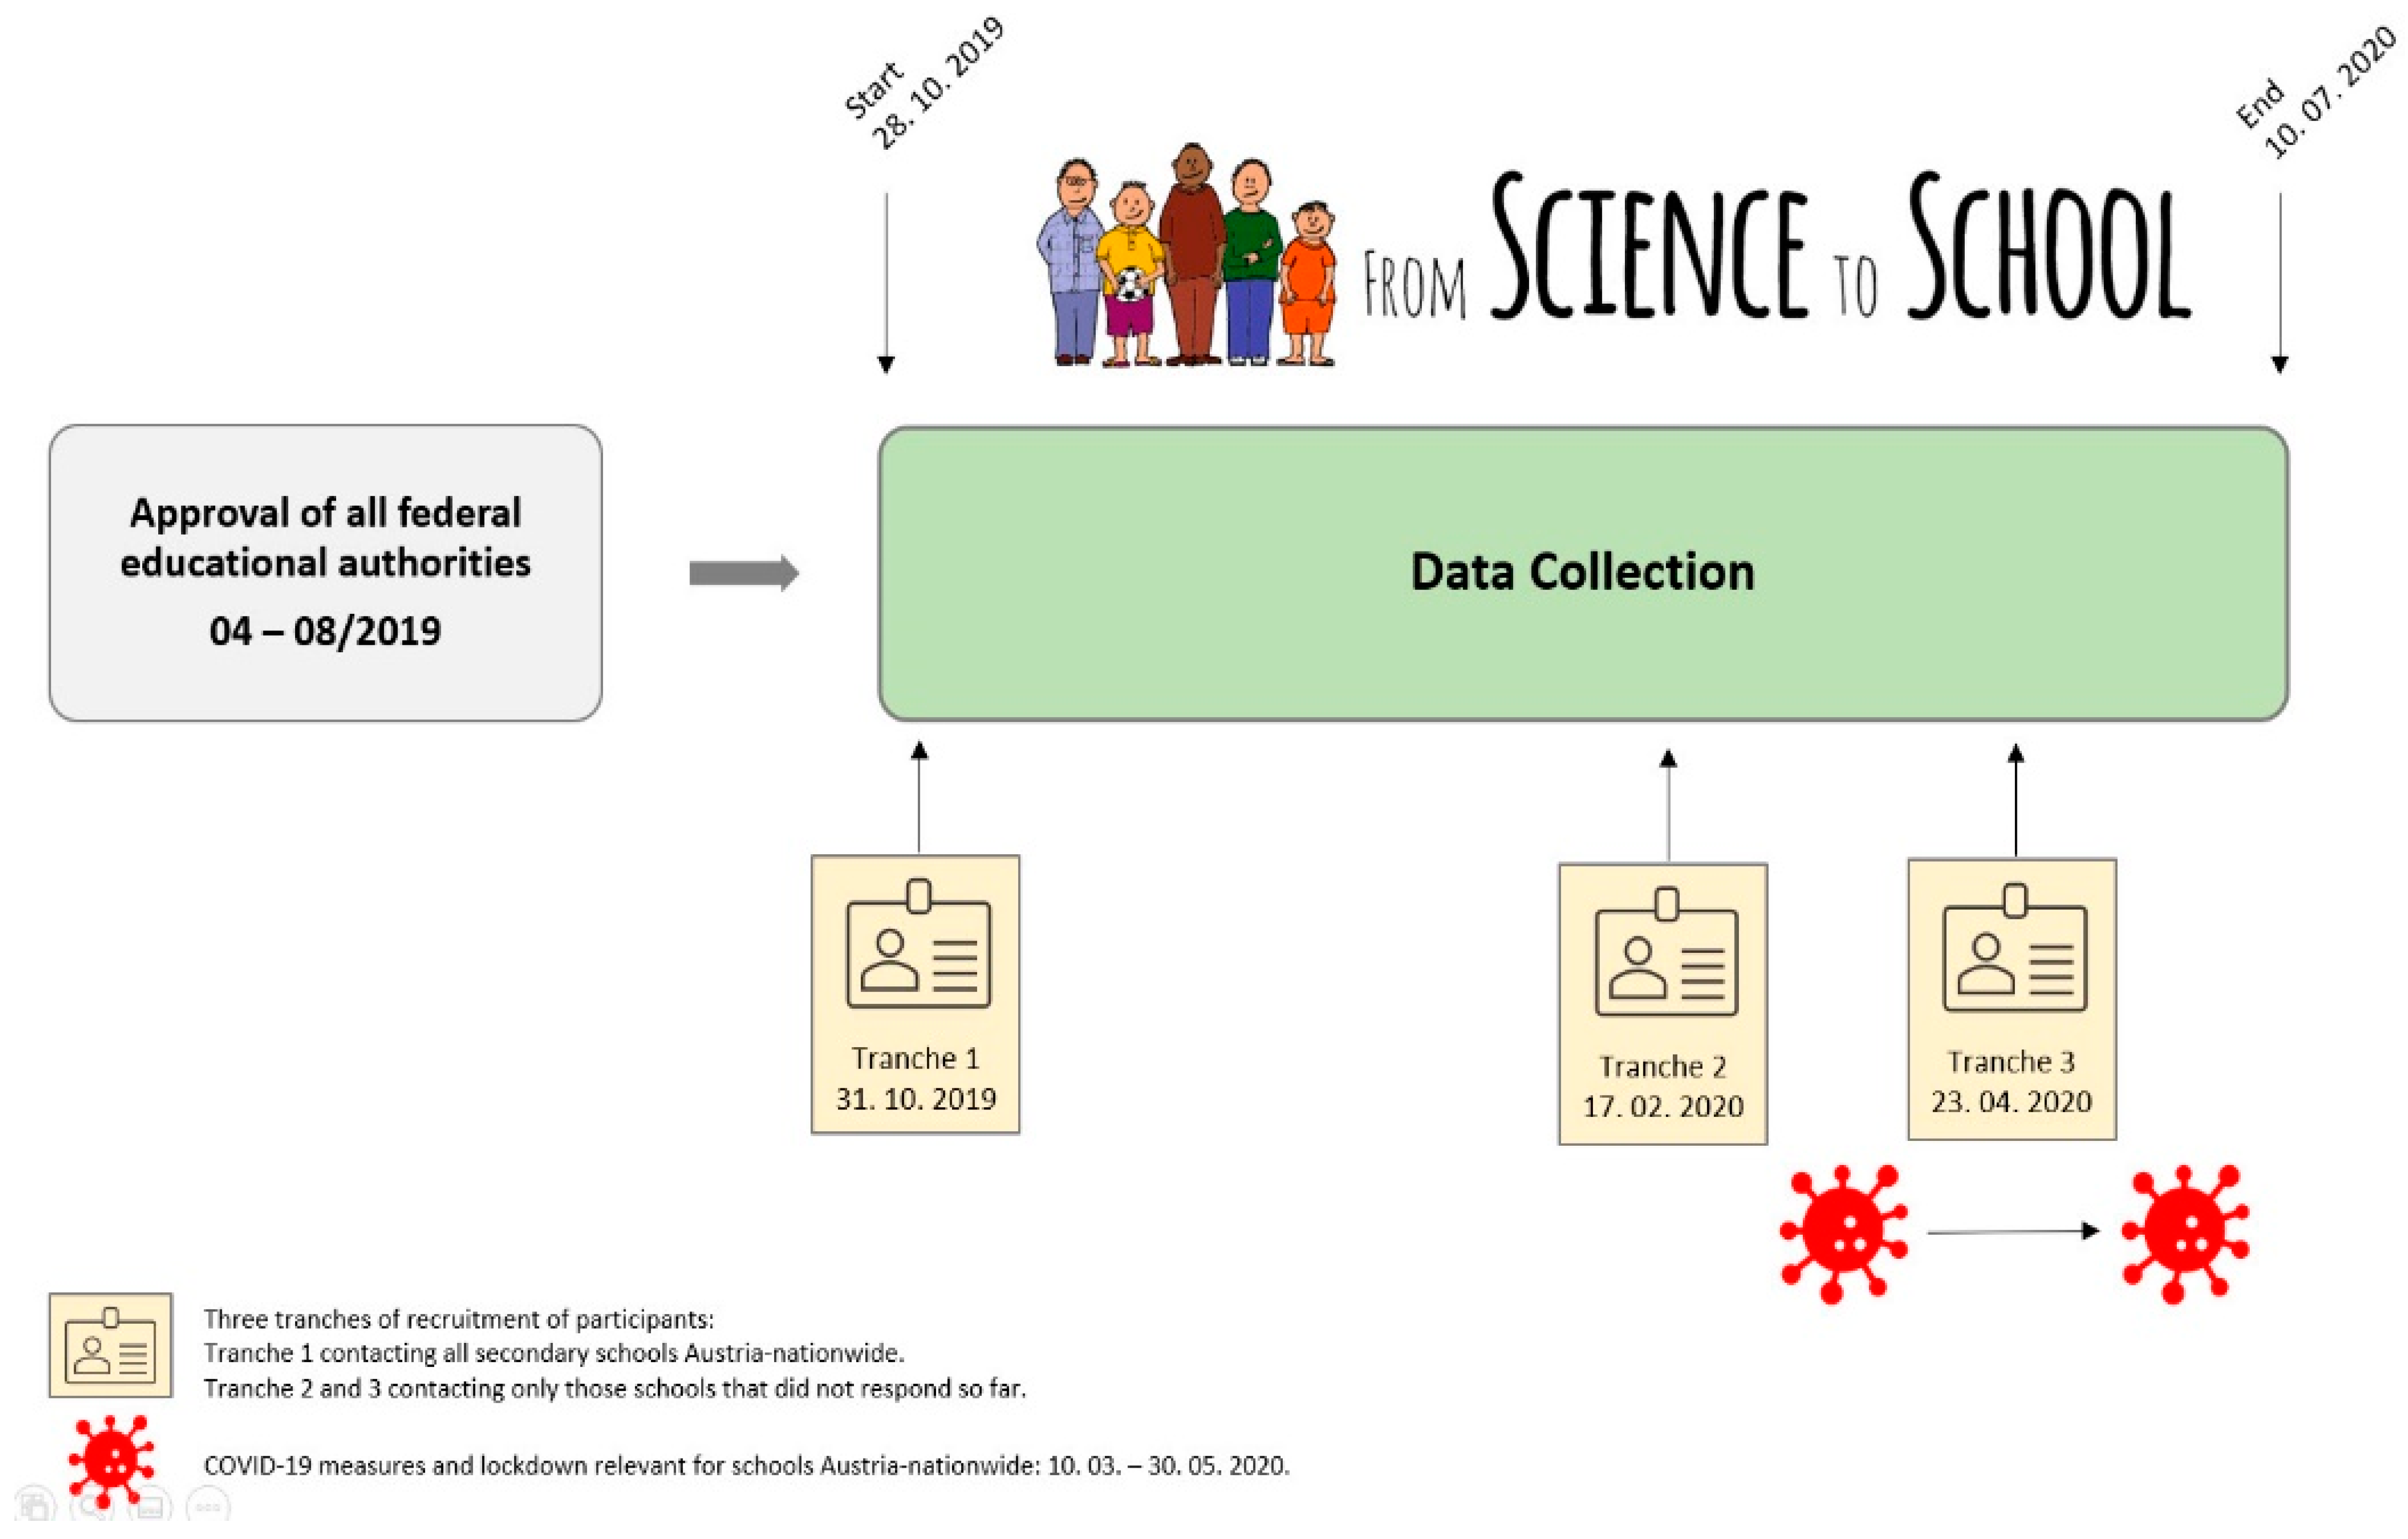
2.3. Procedures
2.4. Measures
2.5. Data Clearance
2.6. Statistical Analysis
3. Results
3.1. Anthropometric Characteristics
3.2. Sports Participation
3.3. Diet
3.4. Physical Activity and Diet
4. Discussion
- Justify the need for this dual approach to decision-makers, which should be the minimum recommendation according to the Austrian state mandate;
- motivate policy and decision-makers in the educational context (federal authorities, school principals and teachers, families) to reassess current health-related school offerings in order to build on or even create new programs, opportunities, and materials encompassing this dual approach for everyday school scenarios (cafeteria and catering, vending machines, interdisciplinary events, etc.);
- establish health-oriented action competence and sustainable action readiness regarding improvements to the current and long-term health status of school pupils (for pupils of all socioeconomic backgrounds).
5. Conclusions
Author Contributions
Funding
Institutional Review Board Statement
Informed Consent Statement
Data Availability Statement
Acknowledgments
Conflicts of Interest
Appendix A

| N | Age (Years) | Height (cm) | Body Weight (kg) | BMIPCT (kg/m2) | Overweight/ Obesity (%) | Underweight (%) | |
|---|---|---|---|---|---|---|---|
| Burgenland | 286 | 12.4 ± 1.2 | 159.4 ± 10.1 | 50.4 ± 12.5 | 56.4 ± 30.7 | 17.5 | 9.8 |
| Urban | 70 | 12.5 ±1.2 | 160.7 ± 8.3 | 53.4 ± 12.2 | 62.3 ± 28.3 | 22.9 | 4.3 |
| Rural | 216 | 12.4 ± 1.2 | 158.9 ± 10.5 | 49.5 ± 12.4 | 54.4 ± 31.3 | 15.7 | 11.6 |
| Carinthia | 269 | 12.5 ± 1.2 | 158.8 ± 11.1 | 49.3 ± 13.1 | 51.6 ± 31.9 | 14.5 | 14.5 |
| Urban | 139 | 12.5 ± 1.3 | 159.7 ± 10.6 | 50.2 ± 13.7 | 52.2 ± 31.9 | 16.5 | 13.7 |
| Rural | 130 | 12.5 ± 1.1 | 157.8 ± 11.7 | 48.2 ± 12.4 | 51.0 ± 32.1 | 12.3 | 15.4 |
| Lower Austria | 532 | 12.6 ± 1.4 | 158.8 ± 11.2 | 50.4 ± 13.9 | 55.0 ± 31.3 | 16.2 | 9.6 |
| Urban | 146 | 12.9 ± 1.5 | 158.6 ± 11.3 | 51.7 ± 14.8 | 56.4 ± 31.3 | 17.1 | 8.2 |
| Rural | 386 | 12.5 ± 1.3 | 158.8 ± 11.2 | 49.9 ± 13.5 | 54.5 ± 31.3 | 15.8 | 10.1 |
| Salzburg | 23 | 13.3 ± 1.3 | 168.0 ± 15.9 | 55.0 ± 12.9 | 52.3 ± 31.6 | 13.0 | 17.4 |
| Urban | 10 | 13.7 ± 0.8 | 166.1 ± 13.7 | 55.3 ± 15.8 | 50.7 ± 31.3 | 20.0 | 20.0 |
| Rural | 13 | 13.0 ± 1.6 | 169.5 ± 17.9 | 54.8 ± 10.9 | 53.6 ± 33.1 | 7.7 | 15.4 |
| Styria | 284 | 12.6 ± 1.1 | 160.3 ± 10.2 | 50.2 ± 12.6 | 51.9 ± 29.8 | 12.3 | 10.6 |
| Urban | 35 | 12.3 ± 1.5 | 156.3 ± 12.1 | 48.2 ± 13.4 | 54.5 ± 30.5 | 17.1 | 8.6 |
| Rural | 249 | 12.7 ± 1.0 | 160.9 ± 9.8 | 50.5 ± 12.5 | 51.5 ± 29.8 | 11.6 | 10.8 |
| Tyrol | 229 | 12.6 ± 1.4 | 158.7 ± 11.2 | 48.6 ± 13.7 | 49.2 ± 30.0 | 10.5 | 13.1 |
| Urban | 84 | 12.8 ± 1.5 | 158.8 ± 12.1 | 49.4 ± 15.3 | 48.3 ± 32.1 | 11.9 | 17.9 |
| Rural | 145 | 12.5 ± 1.3 | 158.7 ± 10.6 | 48.1 ± 12.7 | 49.8 ± 28.8 | 9.7 | 10.3 |
| Upper Austria | 473 | 12.4 ± 1.3 | 158.5 ± 9.9 | 47.7 ± 11.6 | 48.6 ± 30.2 | 11.2 | 14.0 |
| Urban | 69 | 13.2 ± 0.8 | 163.7 ± 7.7 | 53.7 ± 12.2 | 53.7 ± 30.7 | 17.4 | 13.0 |
| Rural | 404 | 12.3 ± 1.3 | 157.6 ± 10.0 | 46.6 ± 11.2 | 47.7 ± 30.1 | 10.1 | 14.1 |
| Vienna | 180 | 12.5 ± 1.3 | 159.5 ± 11.4 | 48.8 ± 14.8 | 47.6 ± 30.2 | 11.1 | 13.3 |
| Urban | 169 | 12.5 ± 1.2 | 159.3 ± 11.6 | 48.9 ± 15.1 | 48.5 ± 30.1 | 11.8 | 11.8 |
| Rural | 11 | 13.0 ± 1.0 | 162.0 ± 6.8 | 46.3 ± 8.5 | 33.7 ± 28.3 | N/A | 36.4 |
| Vorarlberg | 375 | 12.8 ± 1.4 | 159.7 ± 10.1 | 51.4 ± 13.1 | 55.6 ± 30.5 | 17.6 | 9.1 |
| Urban | 258 | 12.9 ± 1.4 | 160.2 ± 9.8 | 53.3 ± 13.3 | 60.0 ± 29.6 | 21.3 | 5.8 |
| Rural | 117 | 12.5 ± 1.3 | 158.4 ± 10.5 | 47.1 ± 11.6 | 45.9 ± 30.5 | 9.4 | 16.2 |
| N | Age (Years) | Height (cm) | Body Weight (kg) | BMIPCT (kg/m2) | Overweight/ Obesity (%) | Underweight (%) | |
|---|---|---|---|---|---|---|---|
| Burgenland | 1037 | 16.2 ± 1.5 | 170.5 ± 9.1 | 63.3 ± 13.9 | 49.5 ± 30.8 | 12.7 | 13.1 |
| Urban | 170 | 16.0 ± 1.5 | 170.7 ± 9.4 | 62.6 ± 14.2 | 48.5 ± 30.3 | 12.9 | 12.9 |
| Rural | 867 | 16.3 ± 1.5 | 170.5 ± 9.0 | 63.4 ± 13.9 | 49.7 ± 30.8 | 12.7 | 13.1 |
| Carinthia | 137 | 15.4 ± 1.6 | 170.7 ± 10.0 | 60.5 ± 13.0 | 47.7 ± 29.5 | 5.8 | 15.3 |
| Urban | 27 | 15.1 ± 1.2 | 166.1 ± 12.0 | 53.3 ± 9.8 | 36.5 ± 29.8 | N/A | 25.9 |
| Rural | 110 | 15.5 ± 1.7 | 171.8 ± 9.1 | 62.2 ± 13.1 | 50.5 ± 29.0 | 7.3 | 12.7 |
| Lower Austria | 736 | 16.4 ± 1.6 | 170.5 ± 9.0 | 64.3 ± 13.4 | 52.7 ± 30.6 | 13.6 | 10.3 |
| Urban | 143 | 16.4 ± 1.6 | 170.7 ± 9.2 | 63.2 ± 12.1 | 50.7 ± 29.4 | 10.5 | 10.5 |
| Rural | 593 | 16.4 ± 1.6 | 170.5 ± 9.0 | 64.6 ± 13.7 | 53.1 ± 30.9 | 14.3 | 10.3 |
| Salzburg | 684 | 16.2 ± 1.6 | 168.6 ± 7.9 | 60.6 ± 12.2 | 45.6 ± 30.0 | 9.4 | 13.9 |
| Urban | 107 | 16.8 ± 1.8 | 168.6 ± 7.8 | 60.1 ± 11.3 | 41.3 ± 30.6 | 8.4 | 19.6 |
| Rural | 577 | 16.0 ± 1.5 | 168.7 ± 7.9 | 60.7 ± 12.4 | 46.4 ± 29.4 | 9.5 | 12.8 |
| Styria | 611 | 16.1 ± 1.6 | 169.0 ± 8.3 | 61.6 ± 12.4 | 49.1 ± 30.6 | 11.3 | 13.7 |
| Urban | 180 | 15.8 ± 1.4 | 169.4 ± 8.3 | 61.2 ± 12.6 | 49.3 ± 29.8 | 10.0 | 11.7 |
| Rural | 431 | 16.2 ± 1.6 | 168.9 ± 8.3 | 61.7 ± 12.3 | 49.0 ± 31.0 | 11.8 | 14.6 |
| Tyrol | 1041 | 16.3 ± 1.6 | 168.6 ± 8.0 | 60.0 ± 11.2 | 44.0 ± 28.7 | 7.7 | 14.7 |
| Urban | 186 | 16.5 ± 1.6 | 168.7 ± 8.1 | 71.8 ± 11.9 | 48.4 ± 30.7 | 12.9 | 14.0 |
| Rural | 855 | 16.3 ± 1.6 | 168.5 ± 7.9 | 59.6 ± 11.0 | 43.0 ± 28.2 | 6.5 | 14.9 |
| Upper Austria | 836 | 16.5 ± 1.5 | 168.5 ± 8.3 | 61.3 ± 12.3 | 46.2 ± 29.6 | 9.3 | 12.1 |
| Urban | 233 | 16.4 ± 1.5 | 167.8 ± 7.6 | 61.6 ± 12.1 | 49.6 ± 30.1 | 12.0 | 11.2 |
| Rural | 603 | 16.6 ± 1.5 | 168.8 ± 8.5 | 61.2 ± 12.3 | 44.9 ± 29.3 | 8.3 | 12.4 |
| Vienna | 648 | 16.1 ± 1.6 | 172.5 ± 9.5 | 65.9 ± 14.9 | 55.7 ± 30.0 | 14.4 | 9.7 |
| Urban | 623 | 16.1 ± 1.6 | 172.6 ± 9.5 | 66.2 ± 15.1 | 56.1 ± 30.1 | 14.8 | 9.6 |
| Rural | 25 | 15.7 ± 1.4 | 169.2 ± 8.3 | 59.1 ± 8.4 | 45.1 ± 26.7 | 4.0 | 12.0 |
| Vorarlberg | 418 | 16.3 ± 1.6 | 170.2 ± 9.3 | 62.0 ± 13.9 | 47.9 ± 30.1 | 8.9 | 14.4 |
| Urban | 136 | 16.4 ± 1.7 | 169.7 ± 9.7 | 62.1 ± 15.2 | 48.8 ± 28.6 | 7.4 | 9.6 |
| Rural | 282 | 16.2 ± 1.6 | 170.4 ± 9.1 | 61.9 ± 13.2 | 47.4 ± 30.8 | 9.6 | 16.7 |
| N | Leisure Time Sports (%) | Club-Sports (%) | Days/Week with Sport (mean ± SD) | Daily Fruits (%) | Daily Veggies (%) | Fluid Intake > 2 L/Day (%) | Water Most Common Fluid (%) | Vegetarian/ Vegan (%) | Alcohol (%) | Smoking (%) | |
|---|---|---|---|---|---|---|---|---|---|---|---|
| Burgenland | 286 | 86.7 | 49.6 | 3.4 ± 2.1 | 75.5 | 59.8 | 21.7 | 71.0 | 24.1 | 13.3 | 8.0 |
| Urban | 70 | 81.4 | 47.4 | 3.1 ±2.1 | 68.6 | 64.3 | 20.0 | 70.0 | 24.3 | 15.7 | 10.0 |
| Rural | 216 | 88.4 | 50.3 | 3.6 ± 2.1 | 77.8 | 58.3 | 22.2 | 71.3 | 24.1 | 12.5 | 7.4 |
| Carinthia | 269 | 89.2 | 37.5 | 3.6 ± 2.1 | 78.4 | 56.1 | 20.8 | 67.3 | 28.3 | 6.3 | 4.1 |
| Urban | 139 | 90.6 | 39.7 | 3.4 ± 1.9 | 79.1 | 58.8 | 18.7 | 66.9 | 30.2 | 7.9 | 5.8 |
| Rural | 130 | 87.7 | 35.1 | 3.8 ± 2.3 | 77.7 | 53.8 | 23.1 | 67.7 | 26.2 | 4.6 | 2.3 |
| Lower Austria | 532 | 91.4 | 38.9 | 3.6 ± 2.0 | 73.9 | 59.2 | 23.7 | 63.5 | 23.5 | 8.6 | 3.4 |
| Urban | 146 | 86.3 | 36.5 | 3.3 ± 2.1 | 69.2 | 54.8 | 24.7 | 59.6 | 32.9 | 10.3 | 5.5 |
| Rural | 386 | 93.3 | 39.7 | 3.7 ± 1.9 | 75.6 | 60.9 | 23.3 | 65.0 | 19.9 | 8.0 | 2.6 |
| Salzburg | 23 | 95.7 | 59.1 | 3.3 ± 1.8 | 56.5 | 34.8 | 30.4 | 69.6 | 17.4 | 26.1 | 4.3 |
| Urban | 10 | 90.0 | 88.9 | 2.8 ± 1.9 | 70.0 | 30.0 | 20.0 | 70.0 | 20.0 | 20.0 | 0.0 |
| Rural | 13 | 100.0 | 38.5 | 3.8 ± 1.7 | 46.2 | 38.5 | 38,5 | 69.2 | 15.4 | 30.8 | 7.7 |
| Styria | 284 | 92.3 | 49.6 | 3.6 ± 2.0 | 75.0 | 59.9 | 18.7 | 61.6 | 18.3 | 7.0 | 3.5 |
| Urban | 35 | 94.3 | 54.5 | 3.6 ± 1.7 | 88.6 | 68.6 | 20.0 | 80.0 | 40.0 | 2.9 | 0.0 |
| Rural | 249 | 92.0 | 48.9 | 3.6 ± 2.1 | 73.1 | 58.6 | 18.5 | 59.0 | 15.3 | 7.6 | 4.0 |
| Tyrol | 229 | 93.0 | 54.9 | 3.7 ± 1.9 | 71.6 | 62.0 | 23.1 | 63.8 | 19.7 | 7.9 | 2.2 |
| Urban | 84 | 88.1 | 52.7 | 3.2 ± 1.9 | 71.4 | 71.4 | 27.4 | 65.5 | 28.6 | 8.3 | 3.6 |
| Rural | 145 | 95.9 | 56.1 | 3.9 ± 1.8 | 71.7 | 56.6 | 20.7 | 62.8 | 14.5 | 7.6 | 1.4 |
| Upper Austria | 473 | 93.4 | 53.4 | 3.7 ± 2.0 | 79.1 | 63.4 | 26.6 | 66.4 | 17.5 | 6.3 | 1.5 |
| Urban | 69 | 87.0 | 51.7 | 3.2 ± 2.1 | 75.3 | 58.0 | 27.5 | 65.2 | 17.4 | 5.8 | 1.4 |
| Rural | 404 | 94.6 | 53.7 | 3.8 ± 2.0 | 79.7 | 64.4 | 26.5 | 66.6 | 17.6 | 6.4 | 1.5 |
| Vienna | 180 | 91.1 | 47.6 | 3.4 ± 2.0 | 72.2 | 73.3 | 20.6 | 85.6 | 15.0 | 4.4 | 1.1 |
| Urban | 169 | 92.9 | 47.8 | 3.4 ± 1.9 | 72.2 | 72.8 | 21.3 | 85.8 | 16.0 | 4.1 | 0.6 |
| Rural | 11 | 63.6 | 42.9 | 2.9 ± 2.9 | 72.7 | 81.8 | 9.1 | 81.8 | N/A | 9.1 | 9.1 |
| Vorarlberg | 375 | 83.5 | 62.3 | 3.0 ± 2.1 | 73.1 | 63.7 | 22.9 | 72.0 | 25.6 | 10.9 | 4.5 |
| Urban | 258 | 81.0 | 55.5 | 2.9 ± 2.1 | 70.9 | 64.3 | 20.5 | 70.9 | 29.1 | 12.0 | 6.2 |
| Rural | 117 | 88.9 | 76.0 | 3.3 ± 2.0 | 77.8 | 62.4 | 28.2 | 74.4 | 17.9 | 8.5 | 0.9 |
| N | Leisure Time Sports (%) | Club-Sports (%) | Days/Week with Sport (Mean ± SD) | Daily Fruits (%) | Daily Veggies (%) | Fluid Intake >2 L/day (%) | Water Most Common Fluid (%) | Vegetarian/ Vegan (%) | Alcohol (%) | Smoking (%) | |
|---|---|---|---|---|---|---|---|---|---|---|---|
| Burgenland | 1037 | 74.5 | 42.8 | 2.5 ± 2.0 | 60.7 | 60.8 | 24.2 | 77.4 | 13.4 | 71.2 | 15.7 |
| Urban | 170 | 76.5 | 43.8 | 2.6 ± 2.0 | 65.9 | 58.8 | 27.6 | 77.6 | 16.5 | 65.3 | 14.1 |
| Rural | 867 | 74.2 | 42.6 | 2.5 ± 2.0 | 59.6 | 61.1 | 23.5 | 77.4 | 12.8 | 72.3 | 16.0 |
| Carinthia | 137 | 81.0 | 33.3 | 3.0 ± 2.0 | 62.0 | 56.2 | 27.0 | 65.0 | 12.4 | 51.1 | 14.6 |
| Urban | 27 | 77.8 | 47.6 | 3.1 ± 2.1 | 66.7 | 74.1 | 18.5 | 59.3 | 18.5 | 48.1 | 7.4 |
| Rural | 110 | 81.8 | 30.0 | 2.9 ± 2.0 | 60.9 | 51.8 | 29.1 | 66.4 | 10.9 | 51.8 | 16.4 |
| Lower Austria | 736 | 73.9 | 36.8 | 2.4 ± 2.0 | 55.3 | 61.4 | 25.4 | 73.8 | 11.4 | 68.1 | 14.5 |
| Urban | 143 | 72.0 | 37.9 | 2.7 ± 2.2 | 58.0 | 62.9 | 23.1 | 77.6 | 14.7 | 55.2 | 16.8 |
| Rural | 593 | 74.4 | 36.6 | 2.3 ± 1.9 | 54.6 | 61.0 | 26.0 | 72.8 | 10.6 | 71.2 | 14.0 |
| Salzburg | 684 | 80.8 | 35.4 | 2.4 ± 1.8 | 63.9 | 63.5 | 21.8 | 77.0 | 12.1 | 66.2 | 12.4 |
| Urban | 107 | 80.4 | 38.4 | 2.4 ± 1.9 | 58.9 | 68.2 | 22.4 | 78.5 | 17.8 | 50.3 | 16.8 |
| Rural | 577 | 80.9 | 34.9 | 2.4 ± 1.8 | 64.8 | 62.6 | 21.7 | 76.8 | 11.1 | 68.8 | 11.6 |
| Styria | 611 | 79.7 | 41.9 | 2.7 ± 2.0 | 62.0 | 64.5 | 22.7 | 69.4 | 15.5 | 60.7 | 10.5 |
| Urban | 180 | 76.1 | 40.9 | 2.7 ± 2.1 | 67.2 | 63.3 | 26.1 | 76.1 | 18.9 | 45.0 | 13.9 |
| Rural | 431 | 81.2 | 42.3 | 2.7 ± 2.0 | 59.9 | 65.0 | 21.3 | 66.6 | 14.2 | 67.3 | 9.0 |
| Tyrol | 1041 | 86.6 | 40.8 | 2.9 ± 1.9 | 70.5 | 70.5 | 19.1 | 76.0 | 11.6 | 66.4 | 9.2 |
| Urban | 186 | 88.7 | 36.4 | 2.8 ± 1.7 | 68.3 | 71.5 | 18.8 | 74.7 | 11.8 | 50.5 | 12.9 |
| Rural | 855 | 86.2 | 41.8 | 3.0 ± 1.9 | 71.0 | 70.3 | 19.2 | 76.3 | 11.6 | 69.8 | 8.4 |
| Upper Austria | 836 | 79.2 | 34.7 | 2.3 ± 1.8 | 63.2 | 70.3 | 20.9 | 73.8 | 14.2 | 69.3 | 9.8 |
| Urban | 233 | 76.0 | 32.8 | 2.4 ± 1.9 | 55.4 | 64.8 | 19.3 | 71.2 | 17.6 | 50.2 | 11.6 |
| Rural | 603 | 80.4 | 35.5 | 2.2 ± 1.8 | 66.2 | 72.5 | 21.6 | 74.8 | 12.9 | 76.6 | 9.1 |
| Vienna | 648 | 77.2 | 35.6 | 2.5 ± 1.9 | 55.9 | 62.5 | 23.9 | 75.0 | 11.7 | 36.6 | 10.6 |
| Urban | 623 | 77.0 | 35.8 | 2.4 ± 1.9 | 56.5 | 62.1 | 23.9 | 75.3 | 11.4 | 37.1 | 10.6 |
| Rural | 25 | 80.0 | 30.0 | 3.0 ± 2.4 | 40.0 | 72.0 | 24.0 | 68.0 | 20.0 | 24.0 | 12.0 |
| Vorarlberg | 418 | 79.2 | 50.8 | 2.8 ± 2.0 | 62.2 | 67.5 | 25.1 | 80.4 | 16.0 | 62.0 | 8.4 |
| Urban | 136 | 77.9 | 55.7 | 2.7 ± 2.0 | 57.4 | 69.1 | 27.9 | 77.2 | 15.4 | 61.0 | 8.8 |
| Rural | 282 | 79.8 | 48.4 | 2.8 ± 2.1 | 64.5 | 66.7 | 23.8 | 81.9 | 16.3 | 62.4 | 8.2 |
References
- Wirnitzer, K.C.; Drenowatz, C. An integrative approach in addressing today’s global health crisis. In International Research & Knowledge Exchange for Addressing Today’s Global Health Paradox, 1st ed.; Wirnitzer, K., Drenowatz, C., Kirschner, W., Tanous, D., Rosemann, T., Eds.; Event Abstracts. Editorial Main; Frontiers in Public Health: Lausanne, Switzerland, 2020; pp. 14–22. [Google Scholar]
- Wirnitzer, K.C.; Drenowatz, C. Improving Child & Adolescent Health for better Public Health—Fiction or within the scope of possibility? The perspective of a lifestyle-centered approach for Addressing Today’s Global Health Paradox. In International Research & Knowledge Exchange for Addressing Today’s Global Health Paradox, 1st ed.; Wirnitzer, K., Drenowatz, C., Kirschner, W., Tanous, D., Rosemann, T., Eds.; Editorial Meeting 2; Frontiers in Public Health: Lausanne, Switzerland, 2020; pp. 45–47. [Google Scholar] [CrossRef]
- Wang, Q.; Zhang, H.; Rizzo, J.A.; Fang, H. The effect of childhood health status on adult health in China. Int. J. Environ. Res. Public Health 2018, 15, 212. [Google Scholar] [CrossRef] [PubMed] [Green Version]
- Dong, B.; Zou, Z.Y.; Song, Y.; Hu, P.J.; Luo, D.M.; Wen, B.; Gao, D.; Wang, X.J.; Yang, Z.G.; Ma, Y.H.; et al. Adolescent health and Healthy China 2030: A review. J. Adolesc. Health 2020, 67, S24–S31. [Google Scholar] [CrossRef] [PubMed]
- American Psychological Association (APA). Available online: https://www.apa.org/topics/child-development/healthy-eating (accessed on 27 July 2021).
- Rush, E.; Coppinger, T. Improving health through diet and exercise in children. Eur. J. Clin. Nutr. 2018, 72, 1251–1254. [Google Scholar] [CrossRef]
- Baumgartner, L.; Wederruss, H.; Oberhoffer-Fritz, R.; Schulz, T. Vascular structure and function in children and adolescents: What impact do physical activity, health-related physical fitness, and exercise have? Front. Pediatr. 2020, 8, 103. [Google Scholar] [CrossRef]
- Wick, K.; Kriemler, S.; Granacher, U. Effects of a strength-dominated exercise program on physical fitness and cognitive performance in preschool children. J. Strength Cond. Res. 2021, 35, 983–990. [Google Scholar] [CrossRef]
- Mnich, C.; Weyland, S.; Jekauc, D.; Schipperijn, J. Psychosocial and physiological health outcomes of green exercise in children and adolescents—A systematic review. Int. J. Environ. Res. Public Health 2019, 16, 4266. [Google Scholar] [CrossRef] [PubMed] [Green Version]
- Christiansen, L.; Beck, M.M.; Bilenberg, N.; Wienecke, J.; Astrup, A.; Lundbye-Jensen, J. Effects of exercise and cognitive performance in children and adolescents with ADHD: Potential mechanisms and evidence-based recommendations. J. Clin. Med. 2019, 8, 841. [Google Scholar] [CrossRef] [Green Version]
- Fruhauf, A.; Niedermeier, M.; Sevecke, K.; Haid-Stecher, N.; Albertini, C.; Richter, K.; Schipflinger, S.; Kopp, M. Affective responses to climbing exercises in children and adolescents during in-patient treatment for mental health disorders a pilot study on acute effects of different exercise interventions. Psychiatry Res. 2020, 291, 113245. [Google Scholar] [CrossRef]
- Badura, P.; Madarasova Geckova, A.; Sigmundova, D.; Sigmund, E.; van Dijk, J.; Reijneveld, S.A. Can organized leisure-time activities buffer the negative outcomes of unstructured activities for adolescents’ health? Int. J. Public Health 2018, 63, 743–751. [Google Scholar] [CrossRef] [Green Version]
- Krustrup, P.; Dvorak, J.; Bangsbo, J. Small-sided football and leisure-time sport clubs improves physical fitness, health profile, well-being and learning in children. Br. J. Sports Med. 2016, 50, 1166–1167. [Google Scholar] [CrossRef] [PubMed] [Green Version]
- Zuckerman, S.L.; Yengo-Khan, A.M.; Brett, B.L.; Kuhn, A.W.; Wolfson, D.I.; Kerr, Z.Y. Benefits of team sport participation versus concerns of chronic traumatic encephalopathy: Prioritizing health of our youth. Concussion 2020, 5, CNC75. [Google Scholar] [CrossRef] [PubMed]
- Berntsson, L.T.; Ringsberg, K.C. Health and relationships with leisure time activities in Swedish children aged 2-17 years. Scand. J. Caring Sci. 2014, 28, 552–563. [Google Scholar] [CrossRef] [PubMed]
- Ekblom-Bak, E.; Ekblom, O.; Andersson, G.; Wallin, P.; Ekblom, B. Physical education and leisure time physical activity in youth are both important for adulthood activity, physical performance, and health. J. Phys. Act. Health 2018, 15, 661–670. [Google Scholar] [CrossRef]
- Fredriksson, I.; Geidne, S.; Eriksson, C. Leisure-time youth centres as health-promoting settings: Experiences from multicultural neighbourhoods in Sweden. Scand. J. Public Health 2018, 46, 72–79. [Google Scholar] [CrossRef] [Green Version]
- Delgado-Floody, P.; Caamano-Navarrete, F.; Bustos-Barahona, R.; Gonzalez-Rivera, J.; Jerez-Mayorga, D. The social and psychological health of children is associated with Mediterranean diet adherence items, cardiorespiratory fitness, and lifestyle. Nutr. Hosp. 2021, 38, 954–960. [Google Scholar] [CrossRef] [PubMed]
- Academy of Nutrition and Dietetics (AND). Available online: https://www.eatright.org/food/nutrition/vegetarian-and-special-diets/feeding-vegetarian-and-vegan-infants-and-toddlers (accessed on 27 July 2021).
- Melina, V.; Craig, W.; Levin, S. Position of the Academy of Nutrition and Dietetics: Vegetarian diets. J. Acad. Nutr. Diet. 2016, 116, 1970–1980. [Google Scholar] [CrossRef]
- Physicians Committee for Responsible Medicine (PCRM). Available online: https://www.pcrm.org/good-nutrition/plant-based-diets (accessed on 21 September 2021).
- Eker, S.; Garcia, D.; Valin, H.; van Ruijven, B. Using social media audience data to analyses the drivers of low-carbon diets. Environ. Res. Lett. 2021, 16, 4001. [Google Scholar] [CrossRef]
- Alexy, U.; Fischer, M.; Weder, S.; Längler, A.; Michalsen, A.; Keller, M. Food group intake of children and adolescents (6–18 years) on a vegetarian, vegan, or omnivore diet: Results of the VeChi Youth Study. Br. J. Nutr. 2021, 1–26. [Google Scholar] [CrossRef]
- Peretti, N.; Darmaun, D.; Chouraqui, J.P.; Bocquet, A.; Briend, A.; Feillet, F.; Frelut, M.L.; Guimber, D.; Hankard, R.; Lapillonne, A.; et al. Vegetarian diet in children and adolescents: A health benefit? Arch. Pediatr. 2020, 27, 173–175. [Google Scholar] [CrossRef]
- Sdona, E.; Ekstrom, S.; Andersson, N.; Hallberg, J.; Rautiainen, S.; Håkansson, N.; Wolk, A.; Kull, I.; Melén, E.; Bergström, A. Fruit, vegetable and dietary antioxidant intake in school age, respiratory health up to young adulthood. Clin. Exp. Allergy 2021, 1–11. [Google Scholar] [CrossRef]
- Kenney, E.L.; Long, M.W.; Cradock, A.L.; Gortmaker, S.L. Prevalence of inadequate hydration among US children and disparities by gender and race/ethnicity: National health and nutrition examination survey, 2009–2012. Am. J. Public Health 2015, 105, 113–118. [Google Scholar] [CrossRef]
- Moral-Garcia, J.E.; Agraso-Lopez, A.D.; Ramos-Morcillo, A.J.; Jimenez, A.; Jimenez-Eguizabal, A. The influence of physical activity, diet, weight status and substance abuse on students’ self-perceived health. Int. J. Environ. Res. Public Health 2020, 17, 1387. [Google Scholar] [CrossRef] [Green Version]
- Motamed-Gorji, N.; Heshmat, R.; Qorbani, M.; Motlagh, M.E.; Soltani, A.; Shafiee, G.; Asayesh, H.; Ardalan, G.; Matin, N.; Mahdavi Gorabi, A.; et al. Is the association of weight disorders with perceived health status and life satisfaction independent of physical activity in children and adolescents? The CASPIAN-IV Study. J. Trop. Pediatr. 2019, 65, 249–263. [Google Scholar] [CrossRef]
- McCrorie, P.; Mitchell, R.; Macdonald, L.; Jones, A.; Coombes, E.; Schipperijn, J.; Ellaway, A. The relationship between living in urban and rural areas of Scotland and children’s physical activity and sedentary levels: A country-wide cross-sectional analysis. BMC Public Health 2020, 20, 304. [Google Scholar] [CrossRef] [PubMed]
- Ramuth, H.; Schutz, Y.; Joonas, N.; Dulloo, A.G. Total energy expenditure assessed by doubly labeled water technique and estimates of physical activity in Mauritanian children: Analysis by gender and ethnicity. Eur. J. Clin. Nutr. 2020, 74, 445–453. [Google Scholar] [CrossRef] [Green Version]
- Wirnitzer, K.; Tanous, D.R.; Motevalli, M.; Göbel, G.; Wirnitzer, G.; Ruedl, G.; Kirschner, W. Health behavior with a special focus on the prevalence of omnivorous, vegetarian and vegan diets linked to sports and physical exercise among Austrian pupils, teachers and principals of secondary level I and II—From Science 2 School Study Protocol. Front. Public Health 2021. under review. [Google Scholar]
- Kromeyer-Hauschild, K.; Wabitsch, M.; Kunze, D.; Geller, F.; Geiß, H.C.; Hesse, V.; von Hippel, A.; Jaeger, U.; Johnsen, D.; Korte, W.; et al. Perzentile für den Body-mass-Index für das Kindes-und Jugendalter unter Heranziehung verschiedener deutscher Stichproben. Monatsschr Kinderheilkd 2001, 149, 807–818. [Google Scholar] [CrossRef] [Green Version]
- Word Health Organization (WHO). Available online: http://www.euro.who.int/en/health-topics/disease-prevention/nutrition/a-healthy-lifestyle/body-mass-index-bmi (accessed on 29 September 2021).
- Word Health Organization (WHO). Available online: http://www.who.int/gho/ncd/risk_factors/bmi_text/en/ (accessed on 21 April 2020).
- GBD 2017 Diet Collaborators. Health effects of dietary risks in 195 countries, 1990–2017: A systematic analysis for the Global Burden of Disease Study 2017. Lancet 2019, 393, 1958–1972. [Google Scholar] [CrossRef] [Green Version]
- Blair, S.N. Physical inactivity: The biggest public health problem of the 21st century. Br. J. Sports Med. 2009, 43, 1–2. [Google Scholar] [PubMed]
- Booth, F.W.; Roberts, C.K.; Laye, M.J. Lack of exercise is a major cause of chronic diseases. Compr. Physiol. 2012, 2, 1143–1211. [Google Scholar] [CrossRef] [Green Version]
- Euractiv Special Report. Available online: https://www.euractiv.com/section/agriculture-food/news/eu-at-tipping-point-in-reversing-current-nutritional-trends-report-highlights/ (accessed on 27 July 2021).
- Euractiv Special Report. Available online: https://www.euractiv.com/section/health-consumers/news/obesity-must-not-become-a-new-normal-meps-warn/ (accessed on 27 July 2021).
- Guthold, R.; Stevens, G.A.; Riley, L.M.; Bull, F.C. Worldwide trends in insufficient physical activity from 2001 to 2016: A pooled analysis of 358 population-based surveys with 1.9 million participants. Lancet Glob. Health 2018, 6, e1077–e1086. [Google Scholar] [CrossRef] [Green Version]
- Guthold, R.; Stevens, G.A.; Riley, L.M.; Bull, F.C. Global trends in insufficient physical activity among adolescents: A pooled analysis of 298 population-based surveys with 1.6 million participants. Lancet Child Adolesc. Health 2020, 4, 23–35. [Google Scholar] [CrossRef]
- Lee, I.M.; Shiroma, E.J.; Lobelo, F.; Puska, P.; Blair, S.N.; Katzmarzyk, P.T.; Lancet Physical Activity Series Working Group. Effect of physical inactivity on major non-communicable diseases worldwide: An analysis of burden of disease and life expectancy. Lancet 2012, 380, 219–229. [Google Scholar] [CrossRef] [Green Version]
- Felder-Puig, R.; Teutsch, F.; Ramelow, D.; Maier, G. Health and Health Behavior of Austrian Schoolchildren. Results of the WHO-HBSC-Survey 2018 (Gesundheit und Gesundheitsverhalten von Österreichischen Schülerinnen und Schülern. Ergebnisse des WHO-HBSC-Survey 2018). Bundesministerium für Arbeit, Soziales, Gesundheit und Konsumentenschutz (eds.), Wien. 2019. Available online: https://www.sozialministerium.at/cms/site/attachments/8/8/2/CH4154/CMS1562043067885/2018_hbsc-bericht_mit_alternativtexten_final.pdf (accessed on 17 January 2020).
- The World Health Organization—Regional Office for Europe. Available online: https://www.euro.who.int/en/publications/abstracts/spotlight-on-adolescent-health-and-well-being.-findings-fromthe-20172018-health-behaviour-in-school-aged-children-hbsc-survey-in-europe-and-canada.-international-report.-volume-1.-key-findings (accessed on 3 December 2020).
- The World Health Organization—Regional Office for Europe. Available online: https://www.euro.who.int/en/publications/abstracts/spotlight-on-adolescent-health-and-well-being.-findings-fromthe-20172018-health-behaviour-in-school-aged-children-hbsc-survey-in-europe-and-canada.-international-report.-volume-2.-key-data (accessed on 3 December 2020).
- Bentham, J.; Di Cesare, M.; Bilano, V.; Bixby, H.; Zhou, B.; Stevens, G.A.; Riley, L.A.; Taddei, C.; Hajifathalian, K.; Lu, Y.; et al. Worldwide trends in body-mass index, underweight, overweight, and obesity from 1975 to 2016: A pooled analysis of 2416 population-based measurement studies in 128.9 million children, adolescents, and adults. Lancet 2017, 390, 2627–2642. [Google Scholar] [CrossRef] [Green Version]
- Griebler, R.; Winkler, P.; Bengough, T. Österreichischer Kinder- und Jugendgesundheitsbericht; Bundesministerium für Gesundheit: Wien, Austria, 2016. [Google Scholar]
- United Nations Educational, Scientific and Cultural Organization. Available online: https://www.unesco.de/sites/default/files/2018-08/unesco_education_for_sustainable_development_goals.pdf (accessed on 3 December 2020).
- United Nations—Sustainable Development Goals. Available online: https://sustainabledevelopment.un.org/post2015/transformingourworld; (accessed on 3 December 2020).
- United Nations—Sustainable Development Goals. Available online: https://www.undp.org/content/dam/undp/library/corporate/brochure/SDGs_Booklet_Web_En.pdf (accessed on 3 December 2020).
- The World Health Organization. Available online: http://www.who.int/gho/publications/world_health_statistics/2016/en/ (accessed on 12 September 2017).
- World Health Organization (WHO). Available online: https://www.euro.who.int/en/health-topics/disease-prevention/nutrition/data-and-statistics (accessed on 29 September 2021).
- World Health Organization (WHO). Available online: https://www.euro.who.int/en/health-topics/disease-prevention/nutrition/data-and-statistics/infographic-9-global-targets-for-noncommunicable-diseases-for-2025 (accessed on 29 September 2021).
- Kleszczewska, D.; Dzielska, A.; Nalecz, H.; Mazur, J. Physical activity, BMI and body weight perception among 15-year-old boys and girls in Poland in the light of international comparisons. Dev. Period Med. 2017, 21, 235–247. [Google Scholar] [PubMed]
- Carayanni, V.; Vlachopapadopoulou, E.; Koutsouki, D.; Bogdanis, G.C.; Psaltopoulou, T.; Manios, Y.; Karachaliou, F.; Hatzakis, A.; Michalacos, S. Effects of nutrition, and physical activity habits and perceptions of body mass index (BMI) in children aged 12–15 years: A cross-sectional study comparing boys and girls. Children 2021, 8, 277. [Google Scholar] [CrossRef] [PubMed]
- Lisowski, P.; Kantanista, A.; Bronikowski, M. Are there any differences between first grade boys and girls in physical fitness, physical activity, BMI, and sedentary behavior? Results of HCSC study. Int. J. Environ. Res. Public Health 2020, 17, 1109. [Google Scholar] [CrossRef] [Green Version]
- Kantanista, A.; Osinski, W.; Borowiec, J.; Tomczak, M.; Krol-Zielinska, M. Body image, BMI, and physical activity in girls and boys aged 14–16 years. Body Image 2015, 15, 40–43. [Google Scholar] [CrossRef]
- Nevill, A.M.; Reuter, C.P.; Brand, C.; Gaya, A.R.; Mota, J.; Renner, J.; Duncan, M.J. BMI fails to reflect the developmental changes in body fatness between boys and girls during adolescence. Int. J. Environ. Res. Public Health 2021, 18, 7833. [Google Scholar] [CrossRef]
- Motevalli, M.; Drenowatz, C.; Tanous, D.R.; Khan, N.A.; Wirnitzer, K. Management of Childhood Obesity—Time to Shift from Generalized to Personalized Intervention Strategies. Nutrients 2021, 13, 1200. [Google Scholar] [CrossRef]
- Zhou, S.; Ye, B.; Fu, P.; Li, S.; Yuan, P.; Yang, L.; Zhan, X.; Chao, F.; Zhang, S.; Wang, M.Q.; et al. Double burden of malnutrition: Examining the growth profile and coexistence of undernutrition, overweight, and obesity among school-aged children and adolescents in urban and rural counties in Henan province, China. J. Obes. 2020, 2020, 2962138. [Google Scholar] [CrossRef] [Green Version]
- Sharma, B.; Indushekar, K.R.; Gupta Saraf, B.; Sardana, D.; Sheoran, N.; Mavi, S. Are dental caries and overweight/obesity interrelated? A cross-sectional study in rural and urban preschool children. JISPPD 2019, 37, 224–231. [Google Scholar] [CrossRef]
- Thapa, R.; Dahl, C.; Phyo Aung, W.; Bjertness, E. Urban-rural differences in overweight and obesity among 25–64 years old Myanmar residents: A cross-sectional, nationwide survey. BMJ Open 2021, 11, e042561. [Google Scholar] [CrossRef]
- McCormack, L.; Martin, S.; McGlade, C.; Meendering, J.; Foster, J.; Miller, A. Differences in overweight/obesity among youth in a Midwest state by rural-urban continuum codes. South Dakota Med. 2019, 72, 419–423. [Google Scholar]
- Hilpert, M.; Brockmeier, K.; Dordel, S.; Koch, B.; Weiß, V.; Ferrari, N.; Tokarski, W.; Graf, C. Sociocultural influence on obesity and lifestyle in children: A study of daily activities, leisure time behavior, motor skills, and eight status. Obes. Facts 2017, 10, 168–178. [Google Scholar] [CrossRef] [PubMed]
- Maier, I.B.; Ozel, Y.; Wagnerberger, S.; Bischoff, S.C.; Bergheim, I. Dietary patterns and leisure time activity of overweight and normal weight children in Germany: Sex-specific differences. Nutr. J. 2013, 12, 14. [Google Scholar] [CrossRef] [PubMed] [Green Version]
- Godakanda, I.; Abeysena, C.; Lokubalasooriya, A. Sedentary behavior during leisure time, physical activity and dietary habits as risk factors of overweight among school children aged 14-15 years: Case control study. BMC Res. Notes 2018, 11, 186. [Google Scholar] [CrossRef] [PubMed] [Green Version]
- Learmonth, Y.C.; Hebert, J.J.; Fairchild, T.J.; Moller, N.C.; Klakk, H.; Wedderkopp, N. Physical education and leisure time sport reduce overweight and obesity: A number needed to treat analysis. Int. J. Obes. 2019, 43, 2076–2084. [Google Scholar] [CrossRef]
- Brytek-Matera, A. Interaction between vegetarian versus omnivorous diet and unhealthy eating patterns (orthorexia nervosa, cognitive restraint) and body mass index in adults. Nutrients 2020, 12, 646. [Google Scholar] [CrossRef] [Green Version]
- Leitzmann, C.; Keller, M. Vegetarische und Vegane Ernährung. 4., Vollständig Überarbeitete und Erweiterte Auflage; UTB: Stuttgart, Germany, 2020. [Google Scholar]
- Wirnitzer, K.; Boldt, P.; Lechleitner, C.; Wirnitzer, G.; Leitzmann, C.; Rosemann, T.; Knechtle, B. Health status of female and male vegetarian and vegan endurance runners compared to omnivores—Results from the NURMI Study (Step 2). Nutrients 2018, 11, 29. [Google Scholar] [CrossRef] [Green Version]
- Slmoski, A. Vegetarian and Mediterranean diets effective for weight loss. JAMA 2018, 319, 1649. [Google Scholar] [CrossRef] [PubMed]
- Sofi, F.; Dinu, M.; Pagliai, G.; Cesari, F.; Gori, A.M.; Sereni, A.; Becatti, M.; Fiorillo, C.; Marcucci, R.; Casini, A. Low-calorie vegetarian versus Mediterranean diets for reducing body weight and improving cardiovascular risk profile: CARDIVEG study. Circulation 2018, 137, 1103–1113. [Google Scholar] [CrossRef]
- Garousi, N.; Tamizifar, B.; Pourmasoumi, M.; Feizi, A.; Askari, G.; Clark, C.; Entezari, M.H. Effects of lacto-ovo-vegetarian diet vs. standard weight-loss diet on obese and overweight adults with non-alcoholic fatty liver disease: A randomized clinical trial. Arch. Physiol. Biochem. 2021, 1–9. [Google Scholar] [CrossRef]
- Yang, B.; Han, K.; Kim, S.H.; Lee, D.H.; Park, S.H.; Yoo, J.E.; Shin, D.W.; Choi, H.; Lee, H. Being Underweight Increases the Risk of Non-Cystic Fibrosis Bronchiectasis in the Young Population: A Nationwide Population-Based Study. Nutrients 2021, 13, 3206. [Google Scholar] [CrossRef]
- Ye, P.; Pang, R.; Li, L.; Li, H.R.; Liu, S.L.; Zhao, L. Both Underweight and Obesity Are Associated With an Increased Risk of Coronavirus Disease 2019 (COVID-19) Severity. Front. Nutr. 2021, 8, 649422. [Google Scholar] [CrossRef]
- Fernandez-Iglesias, R.; Alvarez-Pereira, S.; Tardon, A.; Fernandez-Garcia, B.; Iglesias-Gutierrez, E. Adherence to the Mediterranean diet in a school population in the principality of Asturias: Relationship with physical activity and body weight. Nutrients 2021, 13, 1507. [Google Scholar] [CrossRef] [PubMed]
- STATISTA. Länder mit dem Höchsten Anteil von Vegetariern an der Bevölkerung Weltweit. Available online: https://de.statista.com/statistik/daten/studie/261627/umfrage/anteil-von-vegetariern-und-veganern-an-der-bevoelkerung-ausgewaehlter-laender-weltweit/ (accessed on 11 January 2018).
- Triconsult & Meinungsraum.at. Available online: https://www.ots.at/presseaussendung/OTS_20180416_OTS0075/einladung-pk-studienpraesentation-sind-vegetarier-und-veganer-die-besseren-konsumenten (accessed on 6 May 2018).
- Wirnitzer, K. Vegan diet in sports and exercise—Health benefits and advantages to athletes and physically active people: A narrative review. Int. J. Sports Exerc. Med. 2020, 6, 165. [Google Scholar] [CrossRef]
- Mitri, R.N.; Boulos, C.; Ziade, F. Mediterranean diet adherence amongst adolescents in north Lebanon: The role of skipping meals, meals with the family, physical activity and physical well-being. Br. J. Nutr. 2021, 1–8. [Google Scholar] [CrossRef]
- Beaulieu, K.; Hopkins, M.; Gibbons, C.; Oustric, P.; Caudwell, P.; Blundell, J.; Finlayson, G. Exercise training reduces reward for high-fat food in adults with overweight/obesity. Med. Sci. Sports Exerc. 2020, 52, 900–908. [Google Scholar] [CrossRef] [Green Version]
- Joo, J.; Williamson, S.A.; Vazquez, A.I.; Fernandez, J.R.; Bray, M.S. The influence of 15-week exercise training on dietary patterns among young adults. Int. J. Obes. 2019, 43, 1681–1690. [Google Scholar] [CrossRef] [PubMed]
- Beaulieu, K.; Hopkins, M.; Blundell, J.; Finlayson, G. Homeostatic and non-homeostatic appetite control along the spectrum of physical activity levels: An updated perspective. Physiol. Behav. 2017, 192, 23–29. [Google Scholar] [CrossRef] [PubMed]
- Lehrplan AHS Unterstufe (Sekundarstufe I). 2021. Available online: https://www.bmbwf.gv.at/Themen/schule/schulpraxis/lp/lp_ahs.html (accessed on 3 September 2021).
- Lehrplan AHS Unterstufe (Sekundarstufe I). 2021. Available online: https://www.ris.bka.gv.at/GeltendeFassung.wxe?Abfrage=Bundesnormen&Gesetzesnummer=10008568 (accessed on 3 September 2021).
- Lehrplan AHS Oberstufe (Sekundarstufe II). 2018. Available online: https://www.bmbwf.gv.at/Themen/schule/schulpraxis/lp/lp_ahs.html (accessed on 3 September 2021).
- Lehrplan AHS Oberstufe (Sekundarstufe II). 2018. Available online: https://www.ris.bka.gv.at/GeltendeFassung.wxe?Abfrage=Bundesnormen&Gesetzesnummer=10008568&FassungVom=2018-09-01 (accessed on 3 September 2021).
- Lehrplan der Neuen Mittelschule. 2018. Available online: https://www.ris.bka.gv.at/Dokumente/Bundesnormen/NOR40199276/NOR40199276.pdf (accessed on 1 June 2020).
- Wirnitzer, K.C. Nachhaltig Gesund—Vegane Ernährung in Bewegung und Sport. Available online: https://uni.science2.school/wp-content/uploads/2021/11/WirnitzerKC_Vegan-Sport_final-online_full-version_FachZS-BUS_4Nov2021.pdf (accessed on 3 September 2021).
- Harrington, D.M.; Staiano, A.E.; Broyles, S.T.; Gupta, A.K.; Katzmarzyk, P.T. BMI percentiles for the identification of abdominal obesity and metabolic risk in children and adolescents: Evidence in support of the CDC 95th percentile. Eur. J. Clin. Nutr. 2013, 67, 218–222. [Google Scholar] [CrossRef] [PubMed]
- Center of Disease Control and Prevention. Body Mass Index: Considerations for Practitioners. 2021. Available online: https://www.cdc.gov/obesity/downloads/bmiforpactitioners.pdf (accessed on 12 November 2021).
| Total (N) | Male N (%) | Female N (%) | Secondary Level I N (%) | Secondary Level II N (%) | ||
|---|---|---|---|---|---|---|
| 8799 | 3249 (36.9) | 5550 (63.1) | 2651 (30.1) | 6148 (69.9) | ||
| Living Environment | ||||||
| Urban | 2785 | 1171 (42.0) | 1614 (58.0) | 980 (35.2) | 1805 (64.8) | |
| Rural | 6014 | 2078 (34.6) | 3936 (65.4) | 1671 (27.8) | 4343 (72.2) | |
| Nationality | ||||||
| Austrian | 7746 | 2849 (36.8) | 4897 (63.2) | 2341 (30.2) | 5405 (69.8) | |
| Other | 1053 | 400 (38.0) | 653 (62.0) | 310 (29.4) | 743 (70.6) | |
| School Type | ||||||
| Middle School | 2183 | 1096 (50.2) | 1087 (49.8) | X | ||
| Academic School (AHS, Sec. I) | 393 | 206 (52.4) | 187 (47.6) | X | ||
| Prevocational School | 236 | 135 (57.2) | 101 (42.8) | X | ||
| Vocational School | 45 | 17 (37.8) | 28 (62.2) | X | ||
| Secondary Technical & Vocational School (BMS, 4 yrs) | 1047 | 414 (39.5) | 633 (60.5) | X | ||
| Academic School (AHS, Sec. II) | 826 | 278 (33.7) | 548 (66.3) | X | ||
| Secondary Technical & Vocational School (BHS, 5 yrs) | 3777 | 977 (25.9) | 2800 (74.1) | X | ||
| Other | 292 | 126 (43.2) | 166 (56.8) | 75 (25.7) | 217 (74.3) | |
| Total | Male | Female | Secondary Level I | Secondary Level II | |
|---|---|---|---|---|---|
| Age (years) 1,2,3,4 | 15.1 ± 2.3 | 14.7 ± 2.3 | 15.4 ± 2.2 | 12.6 ± 1.3 | 16.3 ± 1.6 |
| Urban | 15.0 ± 2.2 | 14.8 ± 2.2 | 15.1 ± 2.2 | 12.7 ± 1.3 | 16.2 ± 1.6 |
| Rural | 15.2 ± 2.3 | 14.6 ± 2.3 | 15.5 ± 2.2 | 12.4 ± 1.3 | 16.3 ± 1.6 |
| Body Weight (kg) 1,2,4,5 | 58.5 ± 14.3 | 62.4 ± 17.3 | 56.2 ± 11.6 | 49.7 ± 13.1 | 62.2 ± 13.1 |
| Urban | 59.0 ± 15.0 | 63.7 ± 17.3 | 55.7 ± 11.9 | 51.4 ± 14.0 | 63.2 ± 13.8 |
| Rural | 58.2 ± 14.0 | 61.6 ± 17.2 | 56.4 ± 11.5 | 48.7 ± 12.4 | 61.8 ± 12.8 |
| Height (cm) 3,5 | 166.6 ± 10.5 | 170.6 ± 13.0 | 164.2 ± 7.9 | 159.2 ± 10.7 | 169.8 ± 8.7 |
| Urban | 166.7 ± 10.9 | 171.2 ± 12.6 | 163.4 ± 8.1 | 159.8 ± 10.7 | 170.4 ± 9.1 |
| Rural | 166.5 ± 10.4 | 170.3 ± 13.2 | 164.5 ± 7.8 | 158.8 ± 10.7 | 169.5 ± 8.6 |
| BMIPCT 1,2,3,4,5 | 49.7 ± 30.4 | 57.3 ± 29.2 | 45.2 ± 30.2 | 52.4 ± 30.8 | 48.5 ± 30.2 |
| Urban | 52.3 ± 30.5 | 59.4 ± 29.2 | 47.1 ± 30.5 | 54.8 ± 30.8 | 50.9 ± 30.3 |
| Rural | 48.5 ± 30.3 | 56.1 ± 29.2 | 44.5 ± 30.1 | 51.0 ± 30.7 | 47.5 ± 30.1 |
| Underweight (%) 1 | 12.4 | 7.4 | 15.4 | 11.5 | 12.8 |
| Urban | 11.1 | 6.3 | 14.6 | 10.0 | 11.7 |
| Rural | 13.1 | 8.0 | 15.8 | 12.4 | 13.3 |
| Normal Weight (%) | 75.8 | 77.1 | 75.0 | 74.3 | 76.4 |
| Urban | 75.0 | 76.3 | 74.1 | 72.8 | 76.2 |
| Rural | 76.1 | 77.6 | 75.3 | 75.2 | 76.5 |
| Overweight (%) 1,5 | 7.1 | 9.2 | 5.9 | 8.7 | 6.4 |
| Urban | 8.3 | 10.3 | 6.8 | 9.3 | 7.7 |
| Rural | 6.6 | 8.6 | 5.5 | 8.4 | 5.9 |
| Obese (%) 1,3,4 | 4.7 | 6.2 | 3.8 | 5.5 | 4.3 |
| Urban | 5.6 | 7.1 | 4.6 | 8.0 | 4.4 |
| Rural | 4.2 | 5.8 | 3.4 | 4.0 | 4.3 |
| Leisure-Time Sports N (%) | Club Sports N (%) | Sport Days/Week Mean ± SD | |
|---|---|---|---|
| Total Sample | 7253 (82.4) | 3083 (42.5) | 2.9 ± 2.0 |
| Male | 2787 (85.8) | 1448 (52.0) | 3.3 ± 2.1 |
| Female | 4466 (80.5) | 1635 (36.6) | 2.6 ± 1.9 |
| Age Groups | |||
| 10–12 years | 1149 (92.7) | 592 (51.5) | 3.7 ± 2.0 |
| 13–14 years | 1778 (86.9) | 811 (45.6) | 3.2 ± 2.0 |
| 15–16 years | 2435 (79.7) | 1022 (42.0) | 2.6 ± 2.0 |
| 17–19 years | 1891 (76.9) | 658 (34.8) | 2.4 ± 1.9 |
| Living Environment | |||
| Urban | 2256 (81.0) | 1302 (42.3) | 2.8 ± 2.0 |
| Rural | 4997 (83.1) | 2868 (42.6) | 2.9 ± 2.0 |
| Nationality | |||
| Austria | 6456 (83.3) | 2820 (43.7) | 2.9 ± 2.0 |
| Other | 797 (75.7) | 263 (33.0) | 2.6 ± 2.0 |
| Leisure-Time Sports | Club Sports | |||
|---|---|---|---|---|
| Yes | No | Yes | No | |
| Age (years) 1,2 | 15.0 ± 2.3 | 15.8 ± 2.0 | 14.7 ± 2.3 | 15.2 ± 2.3 |
| Height (cm) 1 | 166.3 ± 10.8 | 167.9 ± 9.3 | 166.5 ± 11.3 | 166.2 ± 10.4 |
| Body Weight (kg) 1,2 | 57.8 ± 14.0 | 61.5 ± 15.2 | 56.9 ± 13.8 | 58.5 ± 14.1 |
| BMI Percentile | 49.5 ± 30.0 | 50.6 ± 32.2 | 48.9 ± 28.8 | 49.9 ± 30.9 |
| BMI Subgroups (%) | ||||
| Underweight 1 | 12.0 | 14.5 | 11.5 | 12.4 |
| Normalweight 1,2 | 77.1 | 69.5 | 80.1 | 74.9 |
| Overweight 1,2 | 6.8 | 8.6 | 5.4 | 7.8 |
| Obese 1,2 | 4.1 | 7.4 | 3.0 | 4.9 |
| Mixed Diet N (%) | Vegetarian N (%) | Vegan N (%) | |
|---|---|---|---|
| Total Sample | 7421 (84.3) | 745 (8.5) | 633 (7.2) |
| Male | 2827 (87.0) | 148 (4.6) | 274 (8.4) |
| Female | 4594 (82.8) | 597 (10.7) | 359 (6.5) |
| Age Groups | |||
| 10–12 years | 931 (75.1) | 101 (8.2) | 207 (16.7) |
| 13–14 years | 1723 (84.2) | 137 (6.7) | 187 (9.1) |
| 15–16 years | 2626 (86.0) | 276 (9.0) | 152 (5.0) |
| 17–19 years | 2141 (87.1) | 231 (9.4) | 87 (3.5) |
| Living Environment | |||
| Urban | 2262 (81.2) | 244 (8.8) | 279 (10.0) |
| Rural | 5159 (85.8) | 501 (8.3) | 354 (5.9) |
| Nationality | |||
| Austria | 6583 (85.0) | 660 (8.5) | 503 (6.5) |
| Other | 838 (79.6) | 85 (8.1) | 130 (12.3) |
| Mixed Diet | Vegetarian | Vegan | |
|---|---|---|---|
| Age (years) 2,3 | 15.2 ± 2.2 | 15.4 ± 2.3 | 13.8 ± 2.4 |
| Height (cm) 1,2,3 | 167.1 ± 10.4 | 165.6 ± 9.0 | 162.0 ± 12.4 |
| Body Weight (kg) 1,2,3 | 59.1 ± 14.4 | 56.6 ± 12.2 | 53.5 ± 14.8 |
| BMI Percentile 1,3 | 50.0 ± 30.3 | 44.5 ± 30.1 | 51.6 ± 31.7 |
| BMI Subgroups [n (%)] | |||
| Underweight 1,2 | 884 (11.9) | 116 (15.6) | 95 (15.0) |
| Normal Weight 2 | 5650 (76.1) | 561 (75.3) | 456 (72.0) |
| Overweight | 525 (7.1) | 49 (6.6) | 51 (8.1) |
| Obese 1,3 | 362 (4.9) | 19 (2.6) | 31 (4.9) |
| Leisure-Time Sports | Club Sports | Sport Days/Week | |||||
|---|---|---|---|---|---|---|---|
| Yes | No | Yes | No | None | 1–3 Days | 4–7 Days | |
| Daily Fruit 1,2,3 | 69.9 | 47.8 | 72.6 | 67.9 | 47.8 | 65.8 | 75.2 |
| Daily vegetable 1,3 | 66.1 | 53.5 | 65.0 | 67.0 | 53.5 | 64.6 | 75.2 |
| Fluid Intake (>2 L/day) 1,2,3 | 24.0 | 16.8 | 26.7 | 22.1 | 16.8 | 18.4 | 31.3 |
| Most common drink | |||||||
| Water 1,3 | 74.3 | 66.0 | 73.2 | 75.2 | 66.0 | 73.5 | 75.5 |
| Diluting Juice 3 | 9.0 | 9.5 | 9.7 | 8.5 | 9.5 | 9.9 | 8.0 |
| Softdrink 1,3 | 3.9 | 8.3 | 4.1 | 3.8 | 8.3 | 3.5 | 4.5 |
| Alcohol 1,3 | 45.6 | 53.0 | 44.5 | 46.3 | 53.0 | 49.3 | 40.7 |
| Smoking 1,2,3 | 7.6 | 17.3 | 6.6 | 8.2 | 17.3 | 7.8 | 7.2 |
| Mixed Diet | Vegetarian | Vegan | |
|---|---|---|---|
| Leisure-time sports participation 2 | 82.0 | 83.6 | 86.4 |
| Club sports participation | 42.5 | 41.9 | 43.5 |
| Fluid Intake (>2 L/day) | 23.0 | 18.9 | 24.2 |
| Most common drink | |||
| Water 1,2,3 | 72.8 | 80.8 | 64.1 |
| Diluting juice 1,2 | 9.9 | 3.8 | 6.0 |
| Softdrink 1,3 | 4.8 | 2.7 | 6.5 |
| Alcohol 2,3 | 48.8 | 46.3 | 25.3 |
| Smoking | 9.1 | 9.0 | 10.9 |
Publisher’s Note: MDPI stays neutral with regard to jurisdictional claims in published maps and institutional affiliations. |
© 2021 by the authors. Licensee MDPI, Basel, Switzerland. This article is an open access article distributed under the terms and conditions of the Creative Commons Attribution (CC BY) license (https://creativecommons.org/licenses/by/4.0/).
Share and Cite
Wirnitzer, K.C.; Drenowatz, C.; Cocca, A.; Tanous, D.R.; Motevalli, M.; Wirnitzer, G.; Schätzer, M.; Ruedl, G.; Kirschner, W. Health Behaviors of Austrian Secondary Level Pupils at a Glance: First Results of the From Science 2 School Study Focusing on Sports Linked to Mixed, Vegetarian, and Vegan Diets. Int. J. Environ. Res. Public Health 2021, 18, 12782. https://doi.org/10.3390/ijerph182312782
Wirnitzer KC, Drenowatz C, Cocca A, Tanous DR, Motevalli M, Wirnitzer G, Schätzer M, Ruedl G, Kirschner W. Health Behaviors of Austrian Secondary Level Pupils at a Glance: First Results of the From Science 2 School Study Focusing on Sports Linked to Mixed, Vegetarian, and Vegan Diets. International Journal of Environmental Research and Public Health. 2021; 18(23):12782. https://doi.org/10.3390/ijerph182312782
Chicago/Turabian StyleWirnitzer, Katharina C., Clemens Drenowatz, Armando Cocca, Derrick R. Tanous, Mohamad Motevalli, Gerold Wirnitzer, Manuel Schätzer, Gerhard Ruedl, and Werner Kirschner. 2021. "Health Behaviors of Austrian Secondary Level Pupils at a Glance: First Results of the From Science 2 School Study Focusing on Sports Linked to Mixed, Vegetarian, and Vegan Diets" International Journal of Environmental Research and Public Health 18, no. 23: 12782. https://doi.org/10.3390/ijerph182312782
APA StyleWirnitzer, K. C., Drenowatz, C., Cocca, A., Tanous, D. R., Motevalli, M., Wirnitzer, G., Schätzer, M., Ruedl, G., & Kirschner, W. (2021). Health Behaviors of Austrian Secondary Level Pupils at a Glance: First Results of the From Science 2 School Study Focusing on Sports Linked to Mixed, Vegetarian, and Vegan Diets. International Journal of Environmental Research and Public Health, 18(23), 12782. https://doi.org/10.3390/ijerph182312782