
Associations between State-Level Obesity Rates, Engagement with Food Brands on Social Media, and Hashtag Usage


Abstract
:1. Introduction
2. Methods
2.1. Data
2.2. Hashtag Coding
2.3. Statistical Analysis
3. Results
3.1. Followers of Brands and Obesity Rate by State
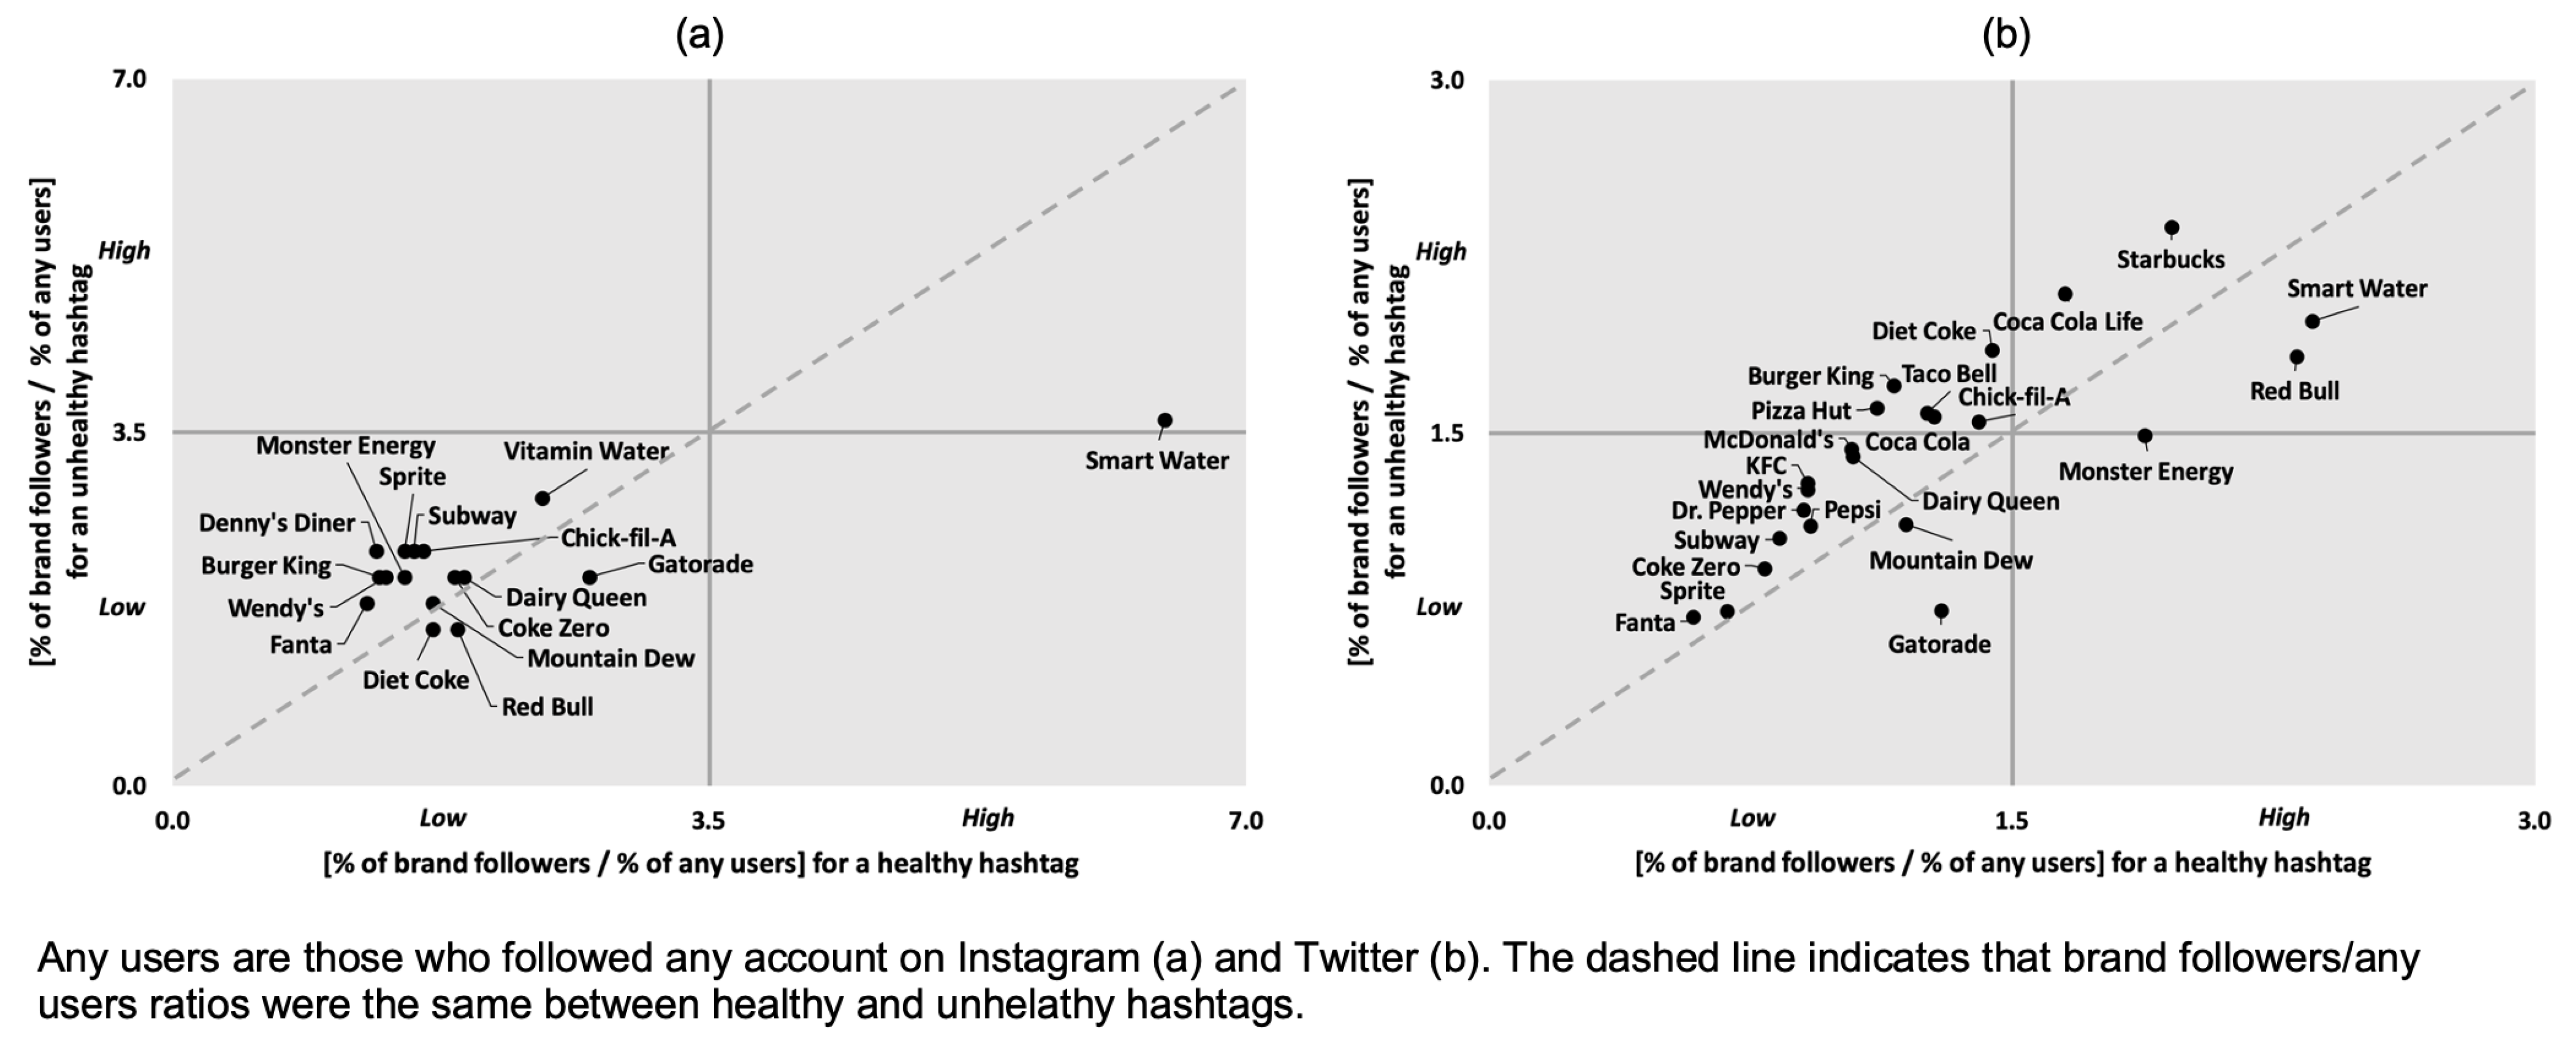
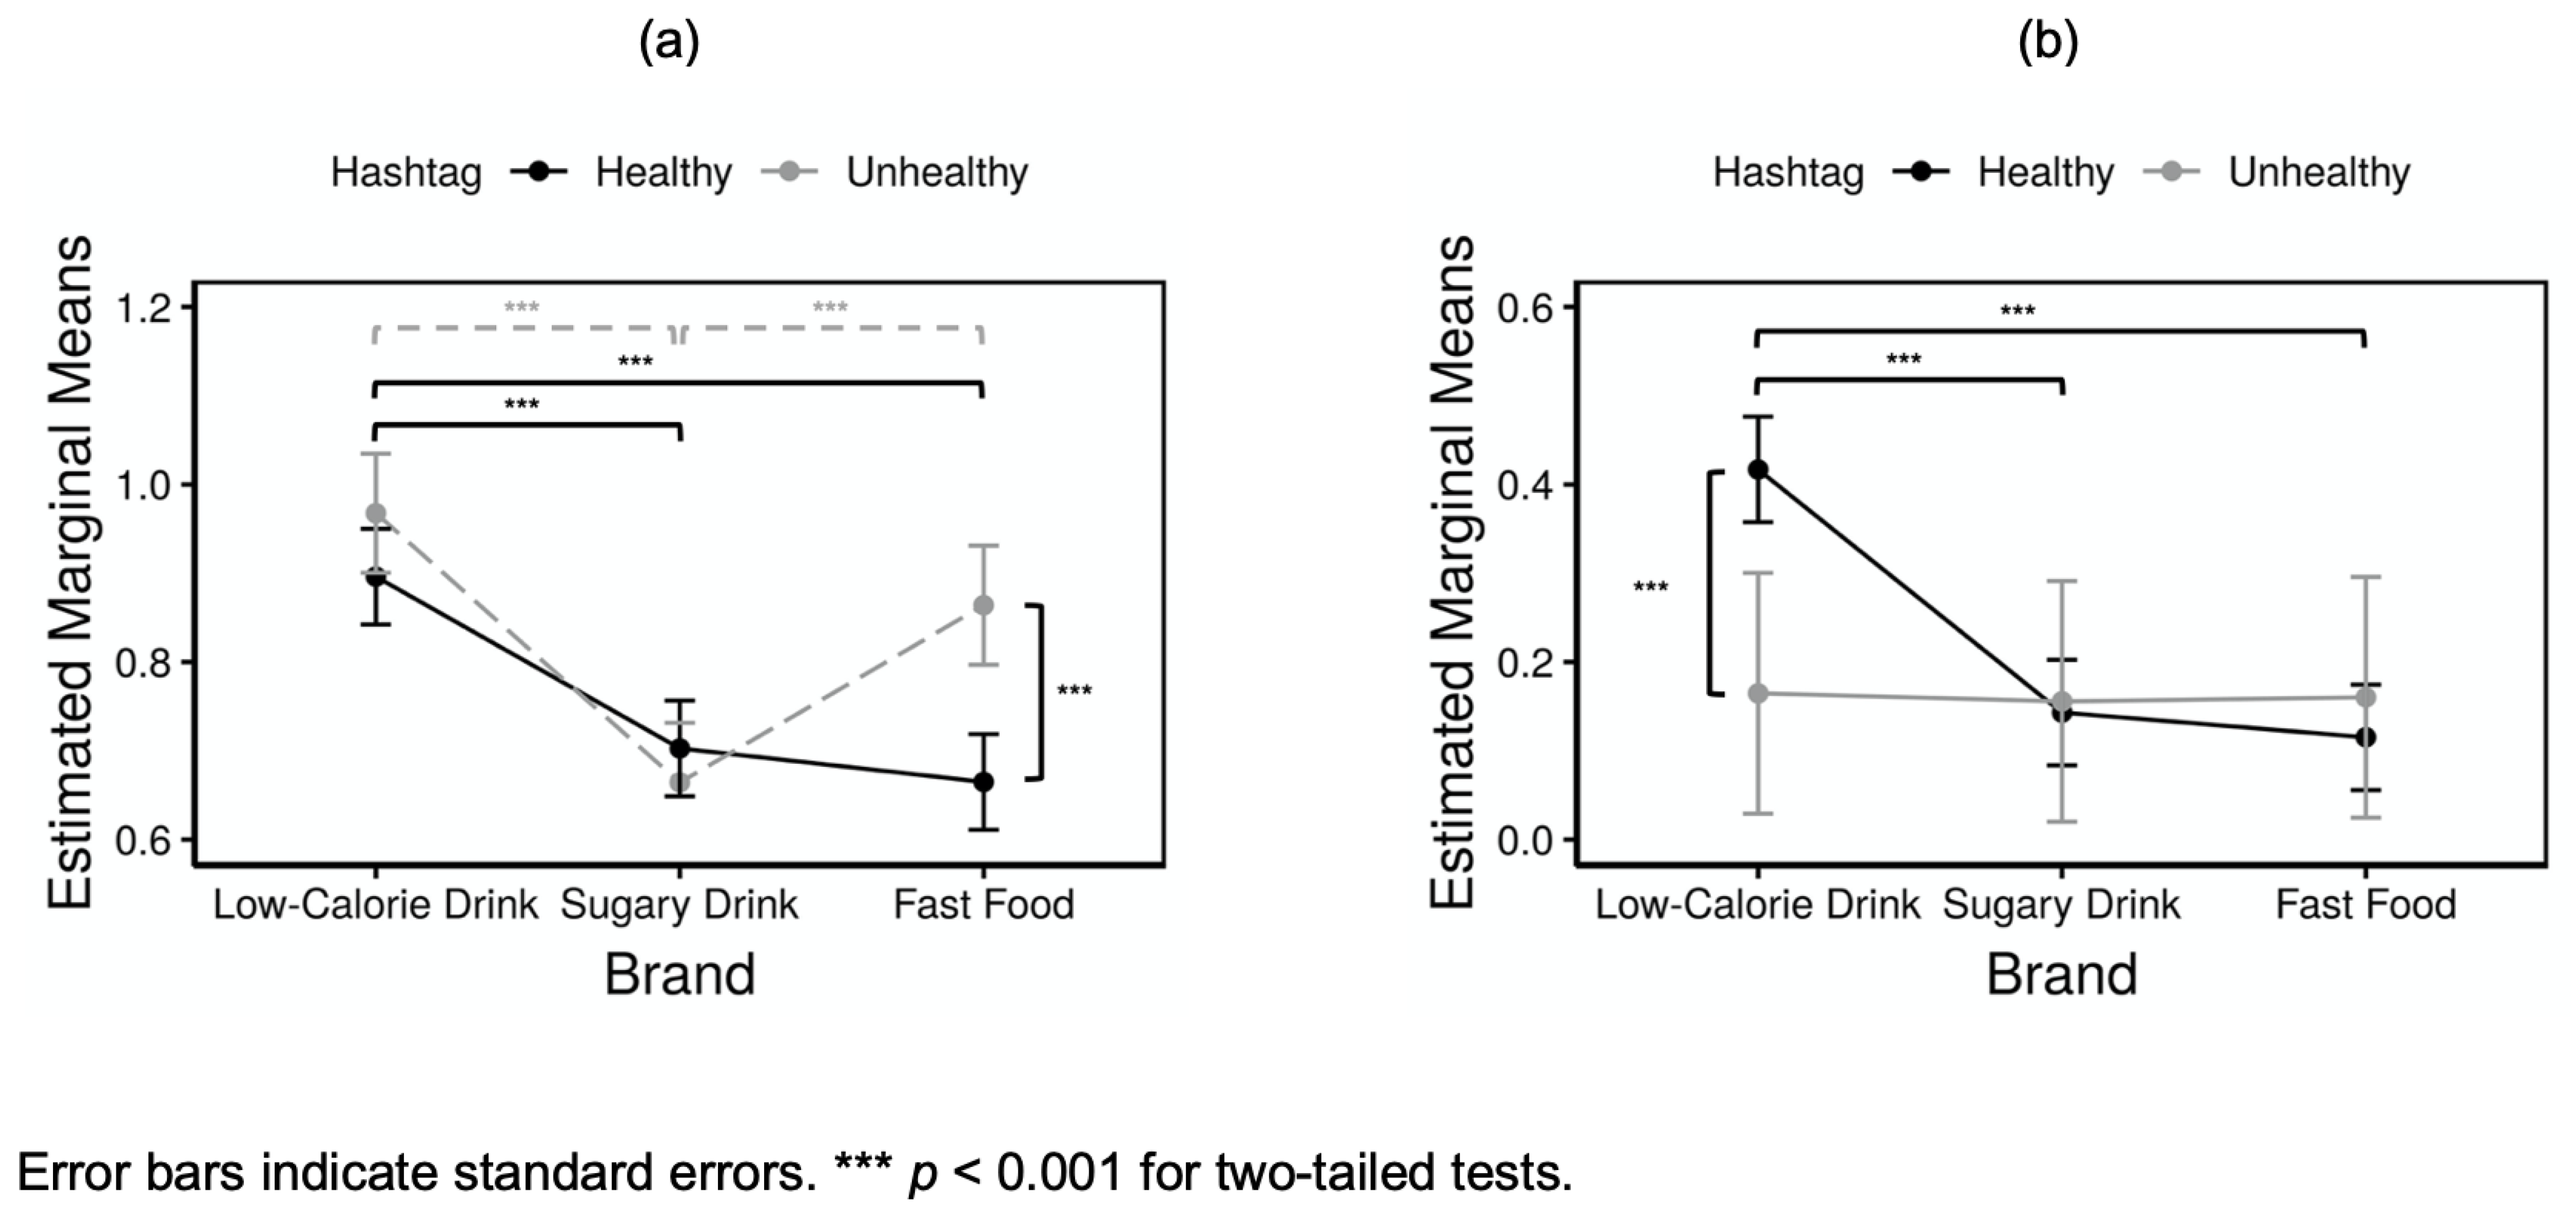
3.2. Followers of Brands and Their Hashtag Usage
4. Discussion
5. Conclusions
Supplementary Materials
Author Contributions
Funding
Institutional Review Board Statement
Informed Consent Statement
Data Availability Statement
Conflicts of Interest
References
- CDC. Adult Obesity Facts. Published 7 June 2021. Available online: https://www.cdc.gov/obesity/data/adult.html (accessed on 30 June 2021).
- Childhood Obesity Facts. Published 5 April 2021. Available online: https://www.cdc.gov/obesity/data/childhood.html (accessed on 30 June 2021).
- Kahn, S.E.; Hull, R.L.; Utzschneider, K.M. Mechanisms linking obesity to insulin resistance and type 2 diabetes. Nature 2006, 444, 840–846. [Google Scholar] [CrossRef]
- Van Gaal, L.F.; Mertens, I.L.; De Block, C.E. Mechanisms linking obesity with cardiovascular disease. Nature 2006, 444, 875–880. [Google Scholar] [CrossRef] [PubMed]
- Biener, A.; Cawley, J.; Meyerhoefer, C. The High and Rising Costs of Obesity to the US Health Care System. J. Gen. Intern. Med. 2017, 32 (Suppl. 1), 6–8. [Google Scholar] [CrossRef] [PubMed] [Green Version]
- Davis, B.; Carpenter, C. Proximity of fast-food restaurants to schools and adolescent obesity. Am. J. Public Health 2009, 99, 505–551. [Google Scholar] [CrossRef] [PubMed]
- Moore, L.V.; Diez Roux, A.V.; Nettleton, J.A.; Jacobs, D.R., Jr. Associations of the Local Food Environment with Diet Quality—A Comparison of Assessments based on Surveys and Geographic Information Systems: The Multi-Ethnic Study of Atherosclerosis. Am. J. Epidemiol. 2008, 167, 917. [Google Scholar] [CrossRef] [Green Version]
- Drewnowski, A.; Aggarwal, A.; Hurvitz, P.M.; Monsivais, P.; Moudon, A.V. Obesity and supermarket access: Proximity or price? Am. J. Public Health 2012, 102, e74–e80. [Google Scholar] [CrossRef] [PubMed]
- Jilcott, S.B.; Keyserling, T.; Crawford, T.; McGuirt, J.T.; Ammerman, A.S. Examining Associations among Obesity and Per Capita Farmers’ Markets, Grocery Stores/Supermarkets, and Supercenters in US Counties. J. Am. Diet. Assoc. 2011, 111, 567–572. [Google Scholar] [CrossRef]
- Creatore, M.I.; Glazier, R.H.; Moineddin, R.; Fazli, G.S.; Johns, A.; Gozdyra, P.; Matheson, F.I.; Kaufman-Shriqui, V.; Rosella, L.C.; Manuel, D.G.; et al. Association of Neighborhood Walkability with Change in Overweight, Obesity, and Diabetes. JAMA 2016, 315, 2211–2220. [Google Scholar] [CrossRef] [Green Version]
- Casagrande, S.S.; Gittelsohn, J.; Zonderman, A.B.; Evans, M.K.; Gary-Webb, T.L. Association of walkability with obesity in Baltimore City, Maryland. Am. J. Public Health 2011, 101 (Suppl. 1), S318–S324. [Google Scholar] [CrossRef] [PubMed]
- Rundle, A.; Neckerman, K.M.; Freeman, L.; Lovasi, G.S.; Purciel, M.; Quinn, J.; Richards, C.; Sircar, N.; Weiss, C. Neighborhood food environment and walkability predict obesity in New York City. Environ. Health Perspect. 2009, 117, 442–444. [Google Scholar] [CrossRef]
- Yancey, A.K.; Cole, B.L.; Brown, R.; Williams, J.D.; Hillier, A.; Kline, R.S.; Ashe, M.; Grier, S.A.; Backman, D.; McCarthy, W.J. A Cross-Sectional Prevalence Study of Ethnically Targeted and General Audience Outdoor Obesity-Related Advertising. Milbank Q. 2009, 87, 155–184. [Google Scholar] [CrossRef] [PubMed] [Green Version]
- Bragg, M.A.; Pageot, Y.K.; Amico, A.; Miller, A.N.; Gasbarre, A.; Rummo, P.E.; Elbel, B. Fast food, beverage, and snack brands on social media in the United States: An examination of marketing techniques utilized in 2000 brand posts. Pediatr. Obes. 2020, 15, e12606. [Google Scholar] [CrossRef] [PubMed]
- Rummo, P.E.; Cassidy, O.; Wells, I.; Coffino, J.A.; Bragg, M.A. Examining the Relationship between Youth-Targeted Food Marketing Expenditures and the Demographics of Social Media Followers. Int J. Environ. Res. Public Health 2020, 17, 1631. [Google Scholar] [CrossRef] [Green Version]
- Fleming-Milici, F.; Harris, J.L. Adolescents’ engagement with unhealthy food and beverage brands on social media. Appetite 2020, 146, 104501. [Google Scholar] [CrossRef]
- Bragg, M.; Lutfeali, S.; Greene, T.; Osterman, J.; Dalton, M. How Food Marketing on Instagram Shapes Adolescents’ Food Preferences: Online Randomized Trial. J. Med. Internet Res. 2021, 23, e28689. [Google Scholar] [CrossRef]
- Lutfeali, S.; Ward, T.; Greene, T.; Arshonsky, J.; Seixas, A.; Dalton, M.; Bragg, M.A. Understanding the Extent of Adolescents’ Willingness to Engage with Food and Beverage Companies’ Instagram Accounts. J. Med. Internet Res. Public Health Surveill. 2020, 6, e20336. [Google Scholar] [CrossRef]
- Laestadius, L.I.; Wahl, M.M. Mobilizing social media users to become advertisers: Corporate hashtag campaigns as a public health concern. Digit. Health 2017, 3, 2055207617710802. [Google Scholar] [CrossRef] [Green Version]
- Lapinski, M.K.; Rimal, R.N. An Explication of Social Norms. Commun. Theory 2005, 15, 127–147. [Google Scholar] [CrossRef]
- Schultz, P.W.; Nolan, J.M.; Cialdini, R.B.; Goldstein, N.J.; Griskevicius, V. The constructive, destructive, and reconstructive power of social norms. Psychol. Sci. 2007, 18, 429–434. [Google Scholar] [CrossRef] [Green Version]
- Cialdini, R.B.; Kallgren, C.A.; Reno, R.R. A Focus Theory of Normative Conduct: A Theoretical Refinement and Reevaluation of the Role of Norms in Human Behavior. In Advances in Experimental Social Psychology; Zanna, M.P., Ed.; Academic Press: Cambridge, MA, USA, 1991; Volume 24, pp. 201–234. [Google Scholar]
- Lakon, C.M.; Hipp, J.R.; Wang, C.; Butts, C.T.; Jose, R. Simulating Dynamic Network Models and Adolescent Smoking: The Impact of Varying Peer Influence and Peer Selection. Am. J. Public Health 2015, 105, 2438–2448. [Google Scholar] [CrossRef] [PubMed]
- Lakon, C.M.; Valente, T.W. Social integration in friendship networks: The synergy of network structure and peer influence in relation to cigarette smoking among high risk adolescents. Soc. Sci. Med. 2012, 74, 1407–1417. [Google Scholar] [CrossRef] [Green Version]
- Brechwald, W.A.; Prinstein, M.J. Beyond Homophily: A Decade of Advances in Understanding Peer Influence Processes. J. Res. Adolesc. 2011, 21, 166–179. [Google Scholar] [CrossRef] [Green Version]
- Sherman, L.E.; Payton, A.A.; Hernandez, L.M.; Greenfield, P.M.; Dapretto, M. The Power of the Like in Adolescence: Effects of Peer Influence on Neural and Behavioral Responses to Social Media. Psychol. Sci. 2016, 27, 1027–1035. [Google Scholar] [CrossRef] [PubMed]
- Anderson, L.; McCabe, D.B. A Coconstructed World: Adolescent Self-Socialization on the Internet. J. Public Policy Mark. 2012, 31, 240–253. [Google Scholar] [CrossRef] [Green Version]
- Hudson, S.; Huang, L.; Roth, M.S.; Madden, T.J. The influence of social media interactions on consumer–brand relationships: A three-country study of brand perceptions and marketing behaviors. Int. J. Res. Mark. 2016, 33, 27–41. [Google Scholar] [CrossRef]
- CDC. Adult Obesity Prevalence Maps. Published 31 March 2021. Available online: https://www.cdc.gov/obesity/data/prevalence-maps.html (accessed on 30 June 2021).
- Freelon, D.G. ReCal: Intercoder Reliability Calculation as a Web Service. Int. J. Internet Sci. 2010, 5, 20–33. [Google Scholar]
- Freeman, B.; Kelly, B.; Baur, L.; Chapman, K.; Chapman, S.; Gill, T.; King, L. Digital junk: Food and beverage marketing on Facebook. Am. J. Public Health 2014, 104, e56–e64. [Google Scholar] [CrossRef]
- Swinburn, B.A.; Sacks, G.; Hall, K.D.; McPherson, K.; Finegood, D.T.; Moodie, M.L.; Gortmaker, S.L. The global obesity pandemic: Shaped by global drivers and local environments. Lancet 2011, 378, 804–814. [Google Scholar] [CrossRef]
- Wadden, T.A.; Brownell, K.D.; Foster, G.D. Obesity: Responding to the global epidemic. J. Consult. Clin. Psychol. 2002, 70, 510–525. [Google Scholar] [CrossRef]
- Cobb, L.K.; Appel, L.J.; Franco, M.; Jones-Smith, J.C.; Nur, A.; Anderson, C.A.M. Erratum: The relationship of the local food environment with obesity: A systematic review of methods, study quality, and results. Obesity 2015, 23, 2517–2519. [Google Scholar] [CrossRef]
- Jia, P.; Luo, M.; Li, Y.; Zheng, J.-S.; Xiao, Q.; Luo, J. Fast-food restaurant, unhealthy eating, and childhood obesity: A systematic review and meta-analysis. Obes Rev. 2021, 22 (Suppl. 1), e12944. [Google Scholar] [CrossRef] [Green Version]
- Lesser, L.I.; Zimmerman, F.J.; Cohen, D.A. Outdoor advertising, obesity, and soda consumption: A cross-sectional study. BMC Public Health 2013, 13, 20. [Google Scholar] [CrossRef] [Green Version]
- Boswell, R.G.; Kober, H. Food cue reactivity and craving predict eating and weight gain: A meta-analytic review. Obes Rev. 2016, 17, 159–177. [Google Scholar] [CrossRef] [PubMed]
- Boyland, E.J.; Nolan, S.; Kelly, B.; Tudur-Smith, C.; Jones, A.; Halford, J.C.; Robinson, E. Advertising as a cue to consume: A systematic review and meta-analysis of the effects of acute exposure to unhealthy food and nonalcoholic beverage advertising on intake in children and adults. Am. J. Clin. Nutr. 2016, 103, 519–533. [Google Scholar] [CrossRef] [PubMed]
- Cavazos-Rehg, P.A.; Krauss, M.; Fisher, S.L.; Salyer, P.; Grucza, R.A.; Bierut, L.J. Twitter Chatter About Marijuana. J. Adolesc. Health 2015, 56, 139–145. [Google Scholar] [CrossRef] [PubMed] [Green Version]
- Cavazos-Rehg, P.; Krauss, M.; Grucza, R.; Bierut, L. Characterizing the followers and tweets of a marijuana-focused Twitter handle. J. Med. Internet Res. 2014, 16, e157. [Google Scholar] [CrossRef]
- Cavazos-Rehg, P.A.; Krauss, M.J.; Sowles, S.; Connolly, S.; Rosas, C.; Bharadwaj, M.; Bierut, L.J. A content analysis of depression-related Tweets. Comput. Hum. Behav. 2016, 54, 351–357. [Google Scholar] [CrossRef] [PubMed] [Green Version]
- Sacks, G.; Looi, E.S.Y. The Advertising Policies of Major Social Media Platforms Overlook the Imperative to Restrict the Exposure of Children and Adolescents to the Promotion of Unhealthy Foods and Beverages. Int. J. Environ. Res. Public Health 2020, 17, 4172. [Google Scholar] [CrossRef]

| Obesity Rates | |||||||||||||||
|---|---|---|---|---|---|---|---|---|---|---|---|---|---|---|---|
| Low-Calorie Drink Brands (n = 4) | Sugary Drink Brands (n = 9) | Fast-Food Brands (n = 10) | Any | Low-Calorie Drink Brands (n = 4) | Sugary Drink Brands (n = 7) | Fast-Food Brands (n = 6) | Any | ||||||||
| n | % | n | % | n | % | % | n | % | n | % | n | % | % | % | |
| Mississippi | 298 | 0.95 | 6585 | 0.64 | 10,228 | 0.88 | 0.41 | 1260 | 0.97 | 2890 | 0.77 | 13,324 | 0.97 | 0.41 | 39.5 |
| West Virginia | 138 | 0.48 | 4694 | 0.41 | 7449 | 0.51 | 0.18 | 841 | 0.70 | 2978 | 0.67 | 9257 | 0.72 | 0.16 | 39.5 |
| Arkansas | 322 | 0.77 | 7977 | 0.78 | 13,386 | 1.02 | 0.44 | 1073 | 0.73 | 3079 | 0.76 | 12,304 | 0.97 | 0.40 | 37.1 |
| Louisiana | 539 | 1.30 | 11,163 | 1.28 | 18,037 | 1.43 | 0.88 | 1296 | 1.70 | 4406 | 1.13 | 17,158 | 1.28 | 0.68 | 36.8 |
| Kentucky | 412 | 1.40 | 11,748 | 1.16 | 18,687 | 1.41 | 0.59 | 1725 | 1.58 | 6199 | 1.46 | 21,934 | 1.72 | 0.58 | 36.6 |
| Alabama | 628 | 2.05 | 15,414 | 1.66 | 27,007 | 2.00 | 1.20 | 2907 | 2.30 | 7022 | 1.70 | 25,579 | 2.00 | 1.37 | 36.2 |
| Iowa | 207 | 0.68 | 8291 | 0.72 | 13,247 | 0.69 | 0.37 | 997 | 0.83 | 4993 | 1.04 | 13,337 | 1.03 | 0.35 | 35.3 |
| North Dakota | 85 | 0.17 | 1718 | 0.14 | 2575 | 0.13 | 0.04 | 213 | 0.28 | 994 | 0.21 | 2192 | 0.20 | 0.03 | 35.1 |
| Missouri | 554 | 1.63 | 18,582 | 1.80 | 32,173 | 2.18 | 1.30 | 2234 | 2.28 | 9445 | 2.17 | 29,021 | 2.38 | 1.33 | 35.0 |
| Oklahoma | 298 | 0.80 | 11,763 | 1.13 | 18,191 | 1.14 | 0.67 | 979 | 0.98 | 4980 | 1.10 | 15,054 | 1.22 | 0.59 | 34.8 |
| Texas | 2464 | 7.50 | 94,086 | 9.23 | 145,352 | 9.34 | 7.40 | 7502 | 7.65 | 34,994 | 7.96 | 124,858 | 10.15 | 6.52 | 34.8 |
| Kansas | 180 | 0.65 | 7542 | 0.69 | 11,758 | 0.72 | 0.37 | 824 | 0.73 | 4072 | 0.87 | 10,973 | 0.87 | 0.40 | 34.4 |
| Tennessee | 769 | 2.15 | 22,320 | 2.09 | 38,069 | 2.48 | 1.35 | 2861 | 2.75 | 9445 | 2.30 | 36,334 | 2.87 | 1.35 | 34.4 |
| South Carolina | 589 | 1.78 | 15,936 | 1.54 | 24,847 | 1.70 | 1.04 | 1795 | 1.55 | 6856 | 1.61 | 22,814 | 1.78 | 0.95 | 34.3 |
| Indiana | 613 | 1.45 | 18,593 | 1.70 | 33,068 | 2.13 | 1.26 | 2727 | 2.28 | 10,097 | 2.34 | 30,941 | 2.50 | 1.37 | 34.1 |
| Nebraska | 205 | 0.47 | 5808 | 0.48 | 6503 | 0.41 | 0.28 | 638 | 1.18 | 3095 | 0.64 | 7791 | 0.62 | 0.34 | 34.1 |
| Ohio | 1192 | 3.38 | 40,711 | 3.88 | 64,599 | 4.46 | 2.57 | 4838 | 4.50 | 21,615 | 4.89 | 66,161 | 5.17 | 2.55 | 34.0 |
| DC | 444 | 1.25 | 7298 | 0.83 | 13,143 | 0.83 | 0.74 | 1023 | 1.13 | 2942 | 0.74 | 9956 | 0.83 | 1.07 | 33.5 |
| Michigan | 863 | 2.50 | 29,865 | 2.68 | 40,186 | 2.67 | 1.95 | 3226 | 2.80 | 15,104 | 3.37 | 41,043 | 3.17 | 2.09 | 33.0 |
| North Carolina | 863 | 2.68 | 28,501 | 2.72 | 41,768 | 2.78 | 1.79 | 3135 | 2.83 | 12,268 | 2.93 | 39,496 | 3.18 | 1.66 | 33.0 |
| Georgia | 2033 | 8.80 | 36,895 | 4.11 | 64,622 | 4.51 | 2.63 | 4617 | 5.03 | 14,229 | 3.59 | 53,018 | 4.33 | 2.60 | 32.5 |
| New Mexico | 112 | 0.27 | 4299 | 0.33 | 4715 | 0.29 | 0.28 | 252 | 0.38 | 1763 | 0.39 | 4138 | 0.33 | 0.22 | 32.3 |
| Wisconsin | 450 | 1.40 | 17,309 | 1.70 | 25,047 | 1.54 | 0.83 | 1920 | 1.53 | 8440 | 1.86 | 18,824 | 1.57 | 0.94 | 32.0 |
| Illinois | 1318 | 3.90 | 37,753 | 3.63 | 62,506 | 3.97 | 3.17 | 4395 | 4.18 | 19,107 | 4.59 | 52,640 | 4.20 | 3.32 | 31.8 |
| Maryland | 419 | 1.18 | 13,757 | 1.33 | 21,491 | 1.51 | 1.12 | 1377 | 1.20 | 5861 | 1.43 | 18,954 | 1.55 | 1.04 | 30.9 |
| Pennsylvania | 1305 | 3.55 | 41,349 | 3.84 | 62,667 | 4.34 | 3.11 | 4141 | 4.33 | 19,969 | 4.60 | 56,490 | 4.58 | 2.80 | 30.9 |
| Florida | 1968 | 6.58 | 73,767 | 6.40 | 107,993 | 6.89 | 6.74 | 6091 | 5.58 | 24,176 | 5.56 | 74,199 | 6.00 | 5.72 | 30.7 |
| Maine | 59 | 0.20 | 3193 | 0.28 | 4618 | 0.25 | 0.24 | 543 | 0.40 | 1853 | 0.39 | 4034 | 0.35 | 0.31 | 30.4 |
| Virginia | 670 | 1.78 | 22,200 | 2.20 | 37,890 | 2.38 | 2.04 | 2151 | 2.58 | 9834 | 2.23 | 31,300 | 2.48 | 1.87 | 30.4 |
| Minnesota | 534 | 1.48 | 19,059 | 1.41 | 21,664 | 1.29 | 0.88 | 1765 | 1.88 | 8706 | 1.74 | 19,481 | 1.72 | 0.95 | 30.1 |
| South Dakota | 69 | 0.17 | 1968 | 0.14 | 2804 | 0.15 | 0.06 | 351 | 0.27 | 1088 | 0.23 | 2310 | 0.22 | 0.04 | 30.1 |
| Oregon | 227 | 0.70 | 14,009 | 1.01 | 14,626 | 0.84 | 0.80 | 1194 | 0.83 | 4280 | 0.97 | 9399 | 0.80 | 0.68 | 29.9 |
| New Hampshire | 87 | 0.20 | 3313 | 0.27 | 2838 | 0.19 | 0.11 | 446 | 0.33 | 1415 | 0.27 | 3188 | 0.27 | 0.10 | 29.6 |
| Alaska | 42 | 0.10 | 2257 | 0.14 | 1493 | 0.08 | 0.08 | 188 | 0.17 | 763 | 0.16 | 1485 | 0.13 | 0.10 | 29.5 |
| Arizona | 501 | 1.38 | 23,629 | 1.87 | 25,303 | 1.48 | 1.44 | 1870 | 1.50 | 7928 | 1.66 | 18,401 | 1.53 | 1.33 | 29.5 |
| Nevada | 279 | 0.83 | 13,736 | 1.06 | 14,534 | 0.92 | 1.05 | 1175 | 0.87 | 5859 | 1.16 | 11,583 | 0.93 | 1.09 | 29.5 |
| Wyoming | 14 | 0.10 | 1015 | 0.09 | 1239 | 0.12 | 0.01 | 78 | 0.23 | 722 | 0.14 | 1005 | 0.08 | 0.00 | 29.0 |
| Washington | 386 | 1.13 | 24,409 | 1.79 | 34,609 | 1.56 | 1.56 | 1801 | 1.33 | 7317 | 1.54 | 17,475 | 1.45 | 1.40 | 28.7 |
| Idaho | 71 | 0.23 | 4015 | 0.24 | 3095 | 0.19 | 0.14 | 353 | 0.30 | 1541 | 0.30 | 2963 | 0.23 | 0.19 | 28.4 |
| Utah | 747 | 1.57 | 19,438 | 1.20 | 9033 | 0.66 | 0.80 | 1002 | 0.80 | 4713 | 0.89 | 8375 | 0.63 | 0.65 | 27.8 |
| Rhode Island | 131 | 0.38 | 3880 | 0.34 | 5801 | 0.39 | 0.29 | 526 | 0.43 | 1572 | 0.37 | 4578 | 0.35 | 0.19 | 27.7 |
| New York State | 3441 | 11.08 | 71,614 | 7.01 | 102,088 | 6.61 | 8.00 | 7821 | 9.05 | 30,662 | 7.27 | 78,280 | 6.13 | 8.53 | 27.6 |
| Vermont | 41 | 0.15 | 1910 | 0.14 | 1355 | 0.06 | 0.03 | 122 | 0.07 | 924 | 0.14 | 1056 | 0.08 | 0.00 | 27.5 |
| Connecticut | 330 | 0.83 | 14,120 | 1.21 | 19,412 | 1.26 | 0.96 | 1105 | 1.08 | 4291 | 1.04 | 11,328 | 0.93 | 0.71 | 27.4 |
| Montana | 54 | 0.20 | 4381 | 0.28 | 2727 | 0.21 | 0.17 | 227 | 0.17 | 1484 | 0.29 | 2413 | 0.18 | 0.17 | 26.9 |
| California | 4171 | 12.83 | 202,417 | 15.73 | 235,967 | 13.09 | 18.49 | 11,169 | 12.48 | 59,213 | 12.04 | 122,183 | 9.85 | 17.50 | 25.8 |
| Massachusetts | 736 | 2.20 | 22,101 | 1.81 | 29,916 | 1.85 | 2.00 | 2253 | 2.38 | 10,186 | 2.19 | 23,520 | 1.82 | 1.79 | 25.7 |
| New Jersey | 770 | 2.35 | 27,580 | 2.43 | 36,144 | 2.47 | 2.23 | 2129 | 2.23 | 8954 | 2.14 | 24,926 | 1.90 | 1.72 | 25.7 |
| Hawaii | 103 | 0.33 | 5265 | 0.39 | 6051 | 0.39 | 0.35 | 312 | 0.23 | 1405 | 0.26 | 3034 | 0.22 | 0.31 | 24.9 |
| Delaware | 75 | 0.17 | 2476 | 0.22 | 3088 | 0.22 | 0.14 | 257 | 0.20 | 873 | 0.20 | 2744 | 0.20 | 0.10 | 24.7 |
| Colorado | 363 | 1.18 | 29,740 | 1.79 | 23,108 | 1.30 | 1.32 | 1093 | 1.25 | 9067 | 1.69 | 16,405 | 1.32 | 1.34 | 23.0 |
| Total Followers | Followers Who Used a Healthy Hashtag (n = 79) | Followers Who Used an Unhealthy Hashtag (n = 51) | Total Followers | Followers Who Used a Healthy Hashtag (n = 57) | Followers Who Used an Unhealthy Hashtag (n = 11) | |||||
|---|---|---|---|---|---|---|---|---|---|---|
| n | n | % | n | % | n | n | % | n | % | |
| Low-Calorie Drink Brands | ||||||||||
| Coca Cola Life | 6049 | 58 | 0.96 | 70 | 1.16 | - | - | - | - | - |
| Coke Zero | 98,742 | 457 | 0.46 | 507 | 0.51 | 253,914 | 404 | 0.16 | 149 | 0.07 |
| Dasani Water | - | - | - | - | - | 14,327 | 125 | 0.87 | 11 | 0.07 |
| Diet Coke | 79,181 | 658 | 0.84 | 808 | 1.03 | 305,944 | 428 | 0.15 | 197 | 0.05 |
| Smart Water | 48,841 | 672 | 1.37 | 531 | 1.10 | 5493 | 30 | 0.56 | 7 | 0.13 |
| Subtotal | 232,813 | 1845 | - | 1916 | - | 579,678 | 988 | - | 364 | - |
| Sugary Drink Brands | ||||||||||
| Coca Cola | 2,592,532 | 19,340 | 0.74 | 22,667 | 0.87 | - | - | - | - | - |
| Dr. Pepper | 536,521 | 2816 | 0.52 | 3473 | 0.65 | - | - | - | - | - |
| Fanta | 517,501 | 1746 | 0.34 | 2074 | 0.40 | 157,722 | 178 | 0.11 | 101 | 0.06 |
| Gatorade | 1,167,065 | 8716 | 0.75 | 4872 | 0.41 | 331,396 | 772 | 0.23 | 250 | 0.07 |
| Monster Energy | 5,027,096 | 55,012 | 1.09 | 41,896 | 0.83 | 3,198,430 | 4168 | 0.13 | 2337 | 0.07 |
| Mountain Dew | 425,378 | 2948 | 0.69 | 2618 | 0.62 | 564,512 | 805 | 0.15 | 466 | 0.06 |
| Pepsi | 1,438,122 | 7758 | 0.54 | 8788 | 0.61 | - | - | - | - | - |
| Red Bull | 10,293,957 | 138,618 | 1.35 | 103,051 | 1.01 | 2,101,969 | 3326 | 0.16 | 1485 | 0.05 |
| Sprite | 869,636 | 3436 | 0.40 | 3613 | 0.41 | 284,233 | 376 | 0.13 | 224 | 0.08 |
| Vitamin Water | - | - | - | - | - | 161,000 | 331 | 0.21 | 159 | 0.10 |
| Subtotal | 2,2867,808 | 240,389 | - | 193,052 | - | 6,799,262 | 9955 | - | 5022 | - |
| Fast-Food Brands | ||||||||||
| Burger King | 1,623,786 | 10,981 | 0.68 | 15,235 | 0.94 | 1,713,262 | 2062 | 0.12 | 1422 | 0.07 |
| Chick-fil-A | 1,256,639 | 10,272 | 0.82 | 10,829 | 0.86 | 958,494 | 1362 | 0.14 | 706 | 0.08 |
| Dairy Queen | 473,337 | 2857 | 0.61 | 3664 | 0.78 | 477,430 | 788 | 0.16 | 347 | 0.07 |
| Denny’s Diner | - | - | - | - | - | 520,034 | 629 | 0.11 | 396 | 0.08 |
| KFC | 1,357,038 | 7206 | 0.53 | 9632 | 0.71 | - | - | - | - | - |
| McDonald’s | 3,342,259 | 20,098 | 0.61 | 26,514 | 0.79 | - | - | - | - | - |
| Pizza Hut | 1,527,842 | 9894 | 0.65 | 13,577 | 0.89 | - | - | - | - | - |
| Starbucks | 17,425,064 | 198,844 | 1.14 | 229,017 | 1.32 | - | - | - | - | - |
| Subway | 1,030,818 | 5022 | 0.48 | 5992 | 0.58 | 2,361,855 | 3129 | 0.14 | 1838 | 0.08 |
| Taco Bell | 1,274,017 | 9241 | 0.73 | 11,234 | 0.88 | - | - | - | - | - |
| Wendy’s | 834,654 | 4424 | 0.53 | 5800 | 0.70 | 3,000,678 | 3530 | 0.12 | 2273 | 0.07 |
| Subtotal | 30,145,454 | 278,839 | - | 331,493 | - | 9,031,753 | 11,500 | - | 6982 | - |
| Any | - | - | 0.58 | - | 0.55 | - | - | 0.09 | - | 0.04 |
Publisher’s Note: MDPI stays neutral with regard to jurisdictional claims in published maps and institutional affiliations. |
© 2021 by the authors. Licensee MDPI, Basel, Switzerland. This article is an open access article distributed under the terms and conditions of the Creative Commons Attribution (CC BY) license (https://creativecommons.org/licenses/by/4.0/).
Share and Cite
Gu, Y.; Coffino, J.; Boswell, R.; Hall, Z.; Bragg, M.A. Associations between State-Level Obesity Rates, Engagement with Food Brands on Social Media, and Hashtag Usage. Int. J. Environ. Res. Public Health 2021, 18, 12785. https://doi.org/10.3390/ijerph182312785
Gu Y, Coffino J, Boswell R, Hall Z, Bragg MA. Associations between State-Level Obesity Rates, Engagement with Food Brands on Social Media, and Hashtag Usage. International Journal of Environmental Research and Public Health. 2021; 18(23):12785. https://doi.org/10.3390/ijerph182312785
Chicago/Turabian StyleGu, Yuanqi, Jaime Coffino, Rebecca Boswell, Zora Hall, and Marie A. Bragg. 2021. "Associations between State-Level Obesity Rates, Engagement with Food Brands on Social Media, and Hashtag Usage" International Journal of Environmental Research and Public Health 18, no. 23: 12785. https://doi.org/10.3390/ijerph182312785
APA StyleGu, Y., Coffino, J., Boswell, R., Hall, Z., & Bragg, M. A. (2021). Associations between State-Level Obesity Rates, Engagement with Food Brands on Social Media, and Hashtag Usage. International Journal of Environmental Research and Public Health, 18(23), 12785. https://doi.org/10.3390/ijerph182312785