
BMI Fails to Reflect the Developmental Changes in Body Fatness between Boys and Girls during Adolescence

 ,
, 
 ,
,  , ,
, , 
Abstract
1. Introduction
2. Materials and Methods
Statistical Methods
3. Results
4. Discussion
5. Conclusions
Author Contributions
Funding
Institutional Review Board Statement
Informed Consent Statement
Data Availability Statement
Conflicts of Interest
References
- WHO. Obesity and Overweight; World Health Organization: Geneva, Switzerland, 2020. [Google Scholar]
- Motevalli, M.; Drenowatz, C.; Tanous, D.R.; Khan, N.A.; Wirnitzer, K. Management of Childhood Obesity—Time to Shift from Generalized to Personalized Intervention Strategies. Nutrients 2021, 134, 1200. [Google Scholar] [CrossRef] [PubMed]
- Nevill, A.M.; Metsios, G.S. The need to redefine age- and gender-specific overweight and obese body mass index cutoff points. Nutr. Diabetes 2015, 511, e186. [Google Scholar] [CrossRef] [PubMed][Green Version]
- Rothman, K.J. BMI-related errors in the measurement of obesity. Int. J. Obes. 2008, 32 (Suppl. S3), S56–S59. [Google Scholar] [CrossRef] [PubMed]
- Nevill, A.M.; Stavropoulos-Kalinoglou, A.; Metsios, G.S.; Koutedakis, Y.; Holder, R.L.; Kitas, G.D.; Mohammed, M.A. Inverted BMI rather than BMI is a better proxy for percentage of body fat. Ann. Hum. Biol. 2011, 38, 681–684. [Google Scholar] [CrossRef] [PubMed]
- Siervogel, R.M.; Demerath, E.W.; Schubert, C.; Remsberg, K.E.; Chumlea, W.C.; Sun, S.; Czerwinski, S.A.; Towne, B. Puberty and body composition. Horm. Res. 2003, 60 (Suppl. S1), 36–45. [Google Scholar] [CrossRef] [PubMed]
- Vanderwall, C.; Randall Clark, R.; Eickhoff, J.; Carrel, A.L. BMI is a poor predictor of adiposity in young overweight and obese children. BMC Pediatrics 2017, 17, 135. [Google Scholar] [CrossRef]
- Katzmarzyk, P.T.; Barreira, T.V.; Broyles, S.T.; Chaput, J.P.; Fogelholm, M.; Hu, G.; Kuriyan, R.; Kurpad, A.; Lambert, E.V.; Maher, C.; et al. Association between body mass index and body fat in 9-11-year-old children from countries spanning a range of human development. Int. J. Obes. 2015, 5 (Suppl. S2), S43–S46. [Google Scholar] [CrossRef] [PubMed][Green Version]
- Widhalm, K.; Schönegger, K. BMI: Does it really reflect body fat mass? J. Pediatrics 1999, 134, 522. [Google Scholar] [CrossRef]
- Slaughter, M.H.; Lohman, T.G.; Boileau, R.A.; Horswill, C.A.; Stillman, R.J.; Van Loan, M.D.; Bemben, D.A. Skinfold equations for estimation of body fatness in children and youth. Hum. Biol. 1988, 605, 709–723. [Google Scholar]
- Janz, K.F.; Nielsen, D.H.; Cassady, S.L.; Cook, J.S.; Wu, Y.T.; Hansen, J.R. Cross-validation of the Slaughter skinfold equations for children and adolescents. Med. Sci. Sports Exerc. 1995, 25, 1070–1076. [Google Scholar] [CrossRef]
- Duarte, M.O.; Ruelas, Y.F.; López-Alcarz, F.; Toro-Equihua, M.; Sánchez-Ramírez, C.A. Correlation between percentage of body fat measured by the Slaughter equation and bio impedance analysis technique in Mexican schoolchildren. Nutr. Hosp. 2014, 29, 88–93. [Google Scholar]
- Freedman, D.S.; Horlick, M.; Berenson, G.S. A comparison of the Slaughter skinfold-thickness equations and BMI in predicting body fatness and cardiovascular disease risk factor levels in children. Am. J. Clin. Nutr. 2013, 98, 1417–1424. [Google Scholar] [CrossRef] [PubMed]
- Hoffman, D.J.; Toro-Ramos, T.; Sawaya, A.L.; Roberts, S.B.; Rondo, P. Estimating total body fat using a skinfold prediction equation in Brazilian children. Ann. Hum. Biol. 2012, 39, 156–160. [Google Scholar] [CrossRef] [PubMed]
- Duncan, M.; Martins, C.; Silva, G.; Marques, E.; Mota, J.; Aires, L. Inverted BMI rather than BMI is a better predictor of DEXA determined body fatness in children. Eur. J. Clin. Nutr. 2014, 68, 638–640. [Google Scholar] [CrossRef] [PubMed]
- Malina, R.M.; Bouchard, C.; Bar-Or, O. Growth, Maturation and Physical Activity; Human Kinetics: Champaign, IL, USA, 2003. [Google Scholar]
- Nevill, A.M.; Holder, R.L. Body mass index: A measure of fatness or leanness? Br. J. Nutr. 1995, 73, 507–516. [Google Scholar] [CrossRef] [PubMed]
- He, F.; Guan, P.; Liu, Q.; Crabtree, D.; Peng, L.; Wang, H. The relationship between obesity and body compositions with respect to the timing of puberty in Chongqing adolescents: A cross-sectional study. BMC Public Health 2017, 17, 664. [Google Scholar] [CrossRef] [PubMed]


| Sex | Age | N | Stature | SD | Mass | SD | BMI | SD | %Fat | SD |
|---|---|---|---|---|---|---|---|---|---|---|
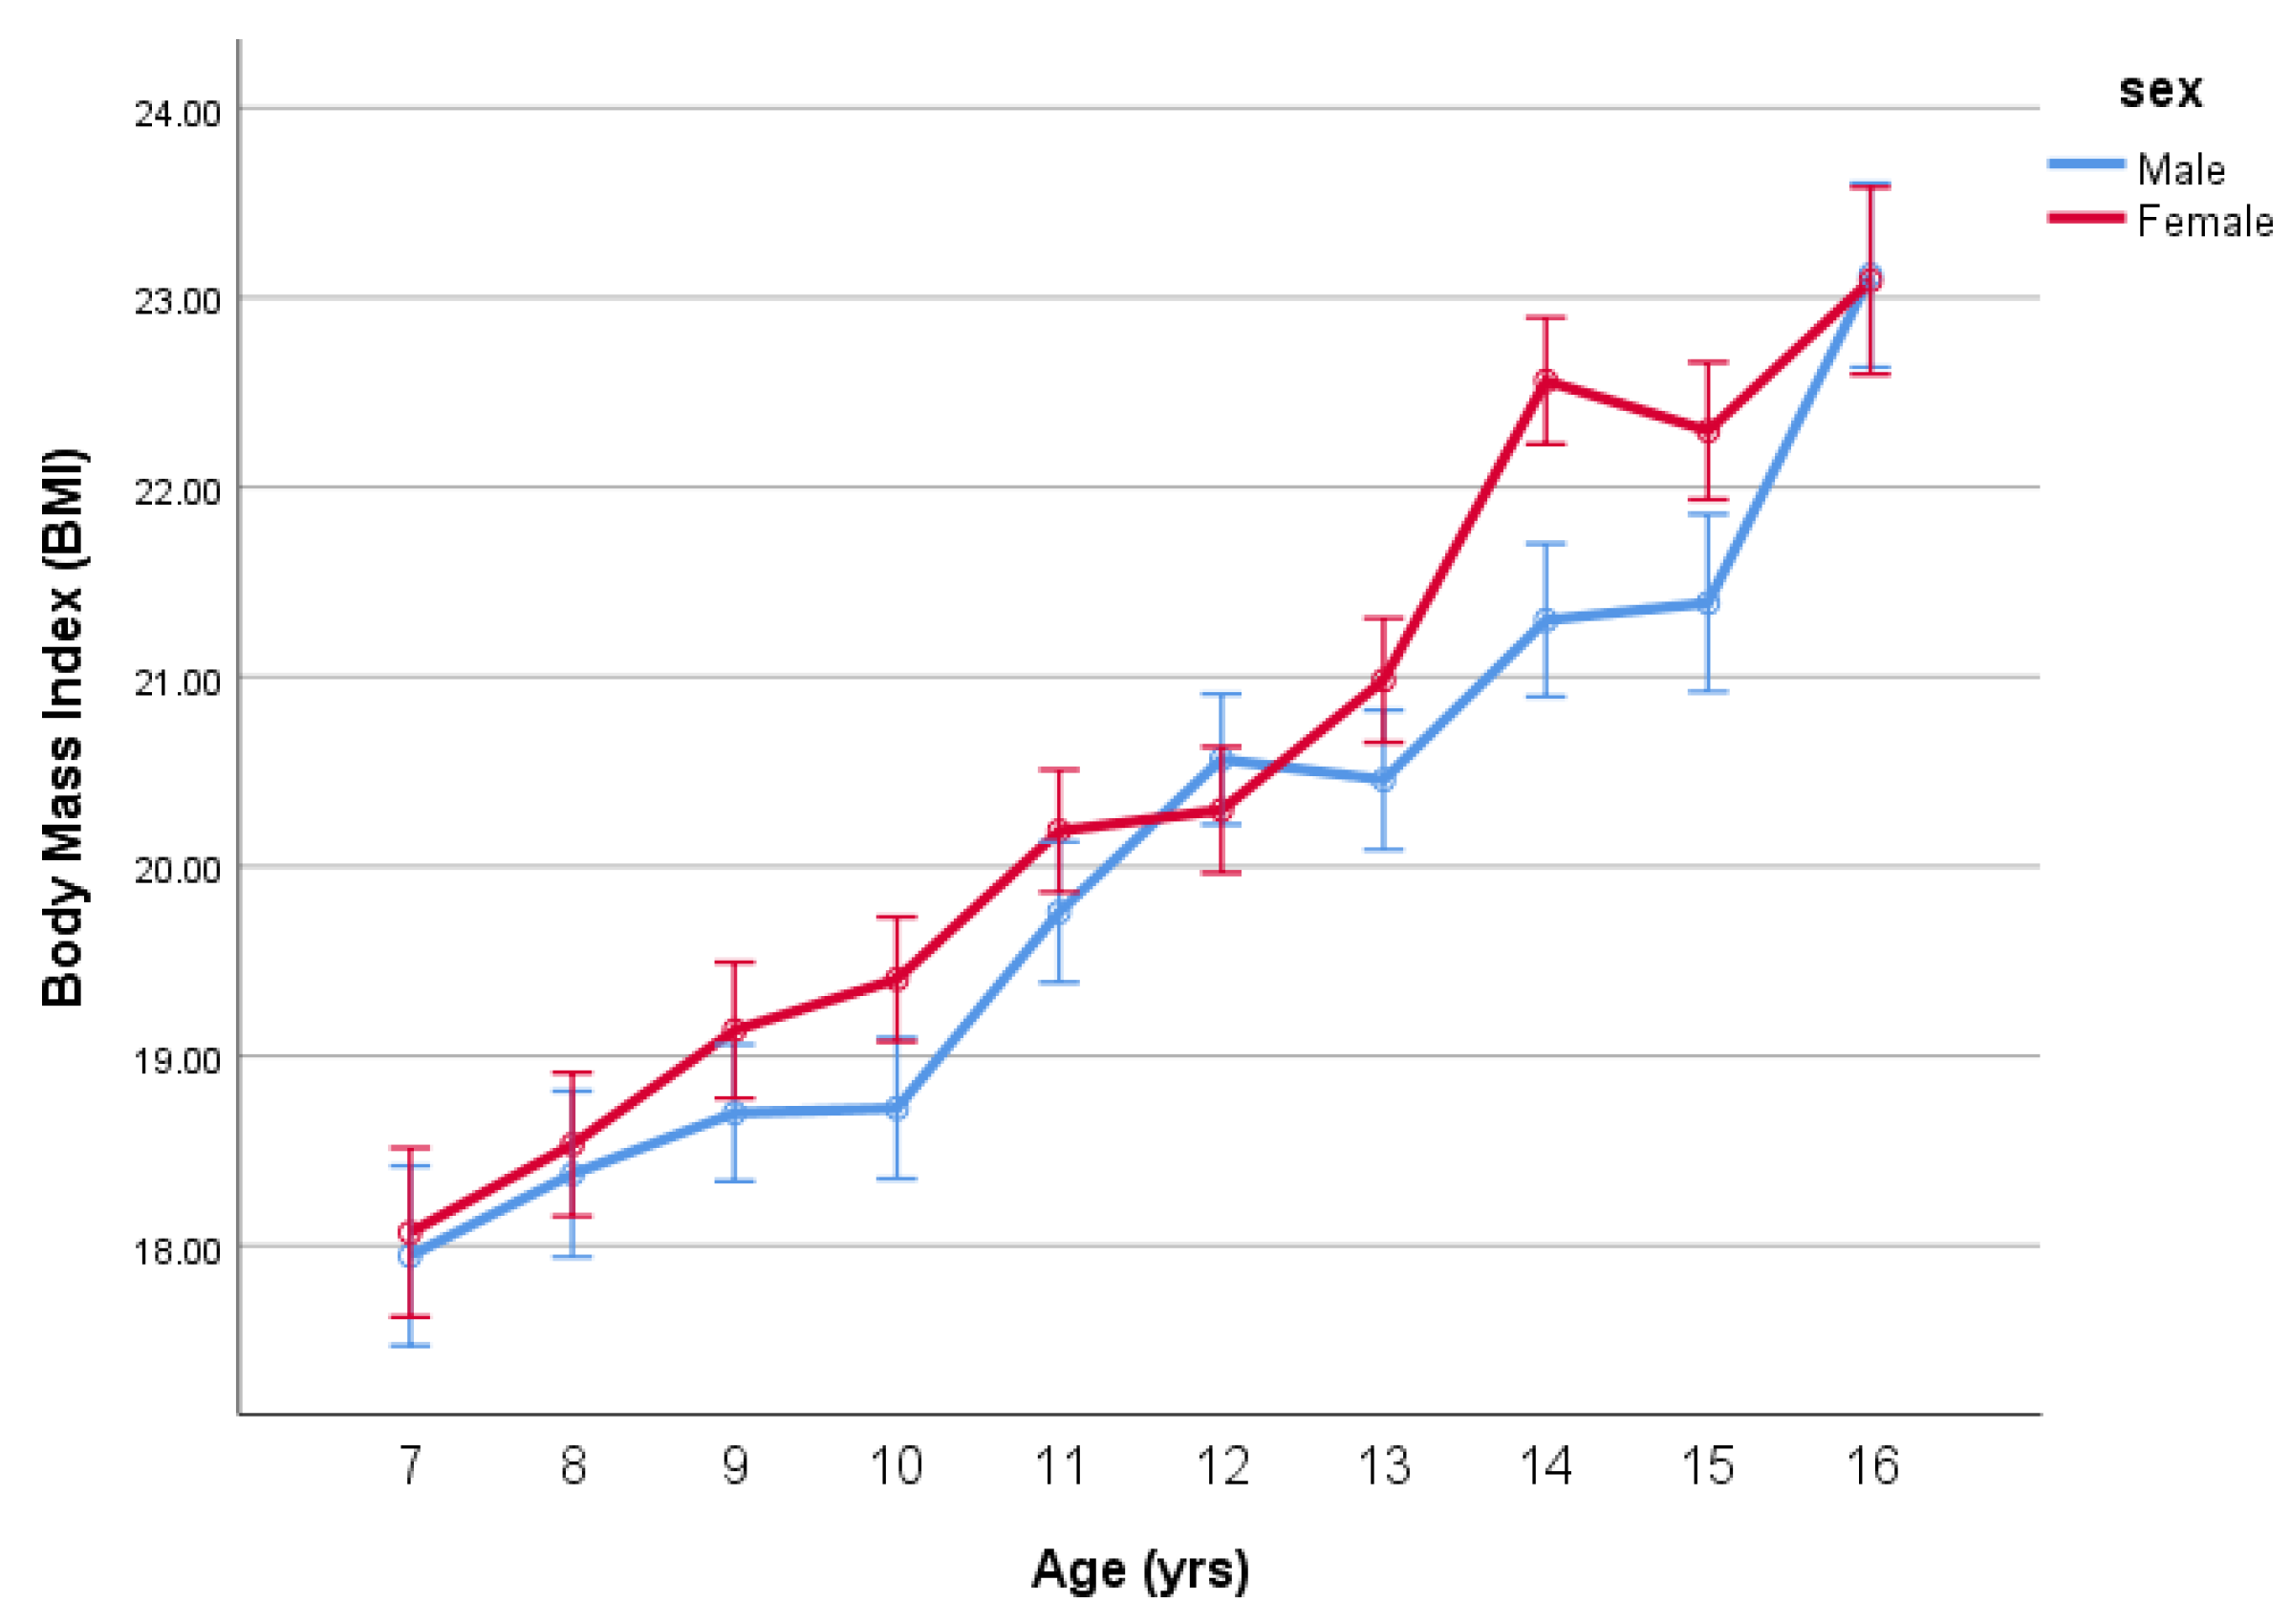
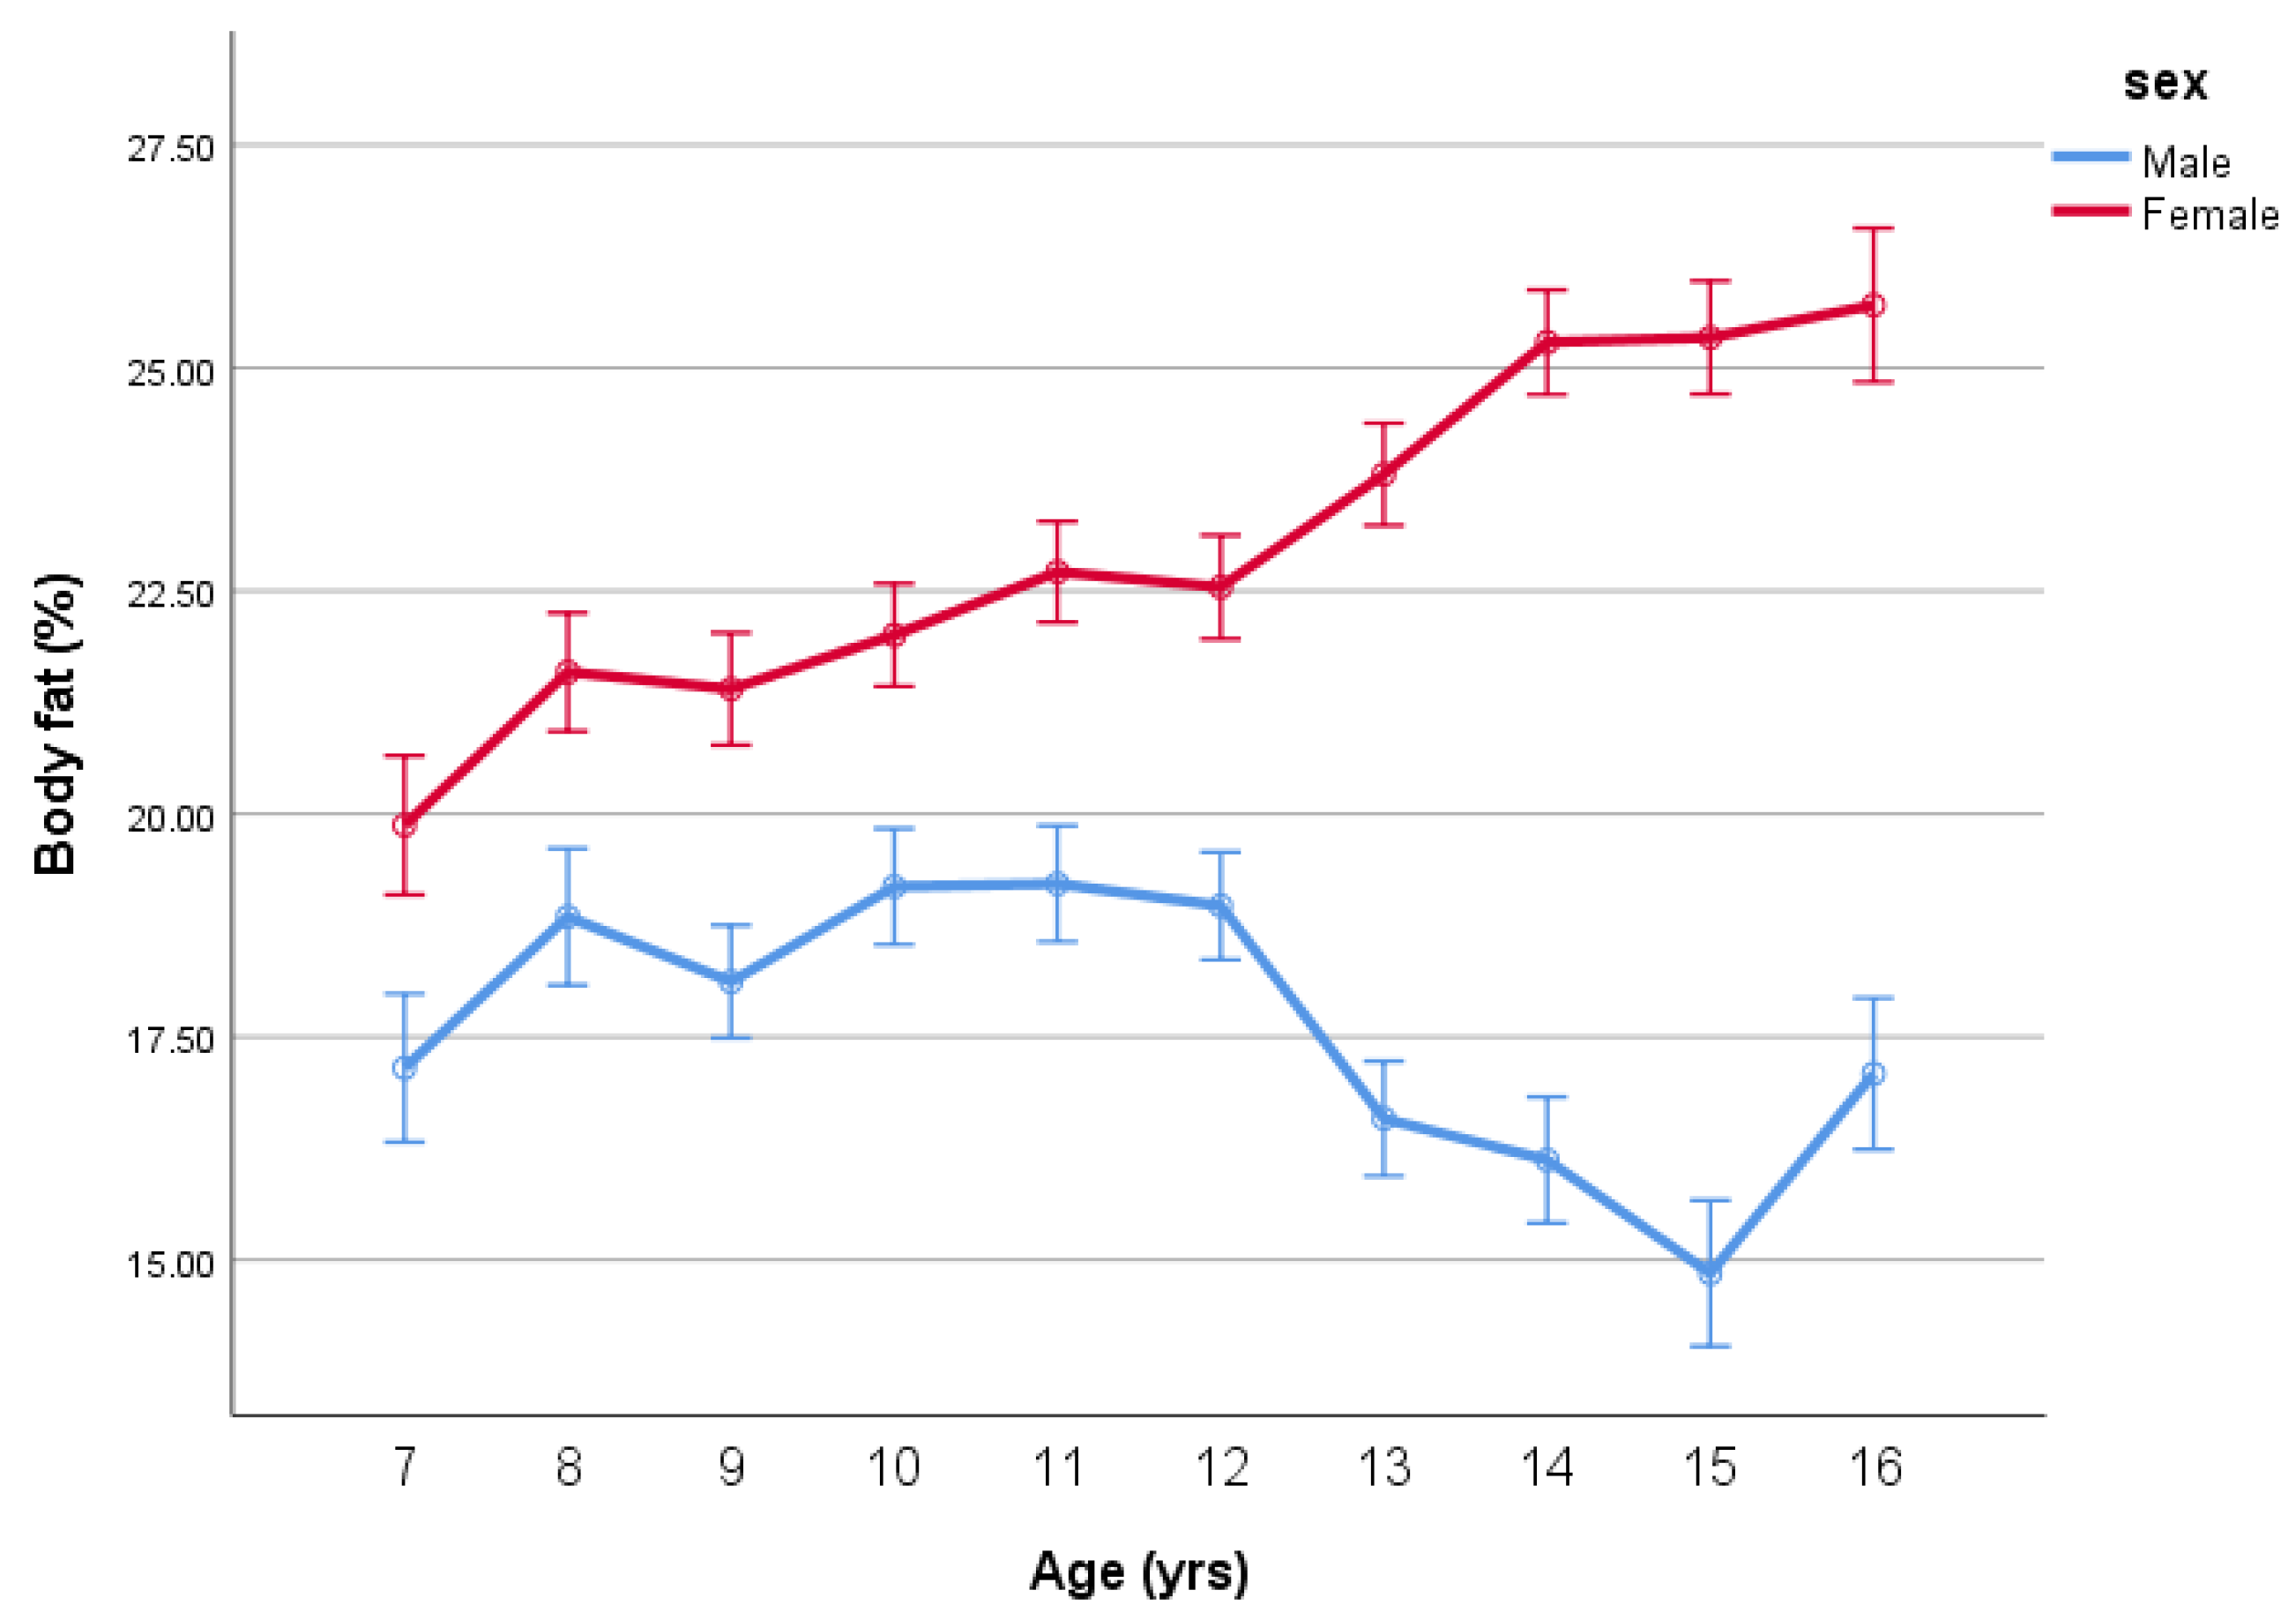
| Male | 7 | 68 | 1.29 | 0.06 | 30.08 | 7.16 | 17.95 | 3.29 | 17.15 | 7.64 |
| 8 | 80 | 1.33 | 0.07 | 32.72 | 7.29 | 18.38 | 2.86 | 18.85 | 6.73 | |
| 9 | 118 | 1.37 | 0.07 | 35.41 | 8.52 | 18.70 | 3.74 | 18.12 | 7.33 | |
| 10 | 111 | 1.42 | 0.07 | 38.03 | 8.82 | 18.72 | 3.10 | 19.19 | 8.01 | |
| 11 | 111 | 1.47 | 0.08 | 43.27 | 10.34 | 19.76 | 3.44 | 19.22 | 8.00 | |
| 12 | 129 | 1.54 | 0.09 | 49.31 | 12.12 | 20.57 | 4.09 | 18.97 | 7.95 | |
| 13 | 113 | 1.60 | 0.10 | 53.05 | 15.87 | 20.46 | 4.48 | 16.58 | 8.20 | |
| 14 | 94 | 1.67 | 0.10 | 59.93 | 14.46 | 21.30 | 4.10 | 16.12 | 7.05 | |
| 15 | 70 | 1.71 | 0.09 | 62.66 | 13.43 | 21.39 | 3.84 | 14.85 | 7.30 | |
| 16 | 65 | 1.73 | 0.08 | 69.13 | 14.83 | 23.12 | 4.08 | 17.09 | 7.01 | |
| Total | 959 | 1.51 | 0.16 | 46.65 | 16.50 | 19.95 | 3.99 | 17.79 | 7.70 | |
| Female | 7 | 77 | 1.27 | 0.07 | 29.26 | 7.97 | 18.07 | 3.45 | 19.87 | 6.70 |
| 8 | 107 | 1.32 | 0.08 | 32.61 | 8.57 | 18.53 | 3.39 | 21.59 | 6.50 | |
| 9 | 119 | 1.38 | 0.07 | 36.87 | 9.44 | 19.14 | 3.73 | 21.40 | 6.45 | |
| 10 | 142 | 1.44 | 0.07 | 40.29 | 10.40 | 19.40 | 4.25 | 22.00 | 6.49 | |
| 11 | 147 | 1.49 | 0.08 | 45.46 | 11.57 | 20.19 | 4.01 | 22.71 | 6.13 | |
| 12 | 139 | 1.53 | 0.08 | 48.06 | 11.43 | 20.30 | 3.98 | 22.54 | 6.11 | |
| 13 | 143 | 1.58 | 0.07 | 52.31 | 10.26 | 20.98 | 3.70 | 23.81 | 5.69 | |
| 14 | 137 | 1.61 | 0.07 | 58.12 | 13.44 | 22.56 | 5.12 | 25.29 | 6.07 | |
| 15 | 117 | 1.60 | 0.07 | 57.10 | 9.38 | 22.30 | 3.83 | 25.34 | 5.49 | |
| 16 | 63 | 1.62 | 0.07 | 60.32 | 12.05 | 23.09 | 4.34 | 25.70 | 6.47 | |
| Total | 1191 | 1.49 | 0.13 | 46.30 | 14.31 | 20.45 | 4.29 | 23.03 | 6.38 |
| Age | BMI Male | BMI Female | Difference between Male and Female |
|---|---|---|---|
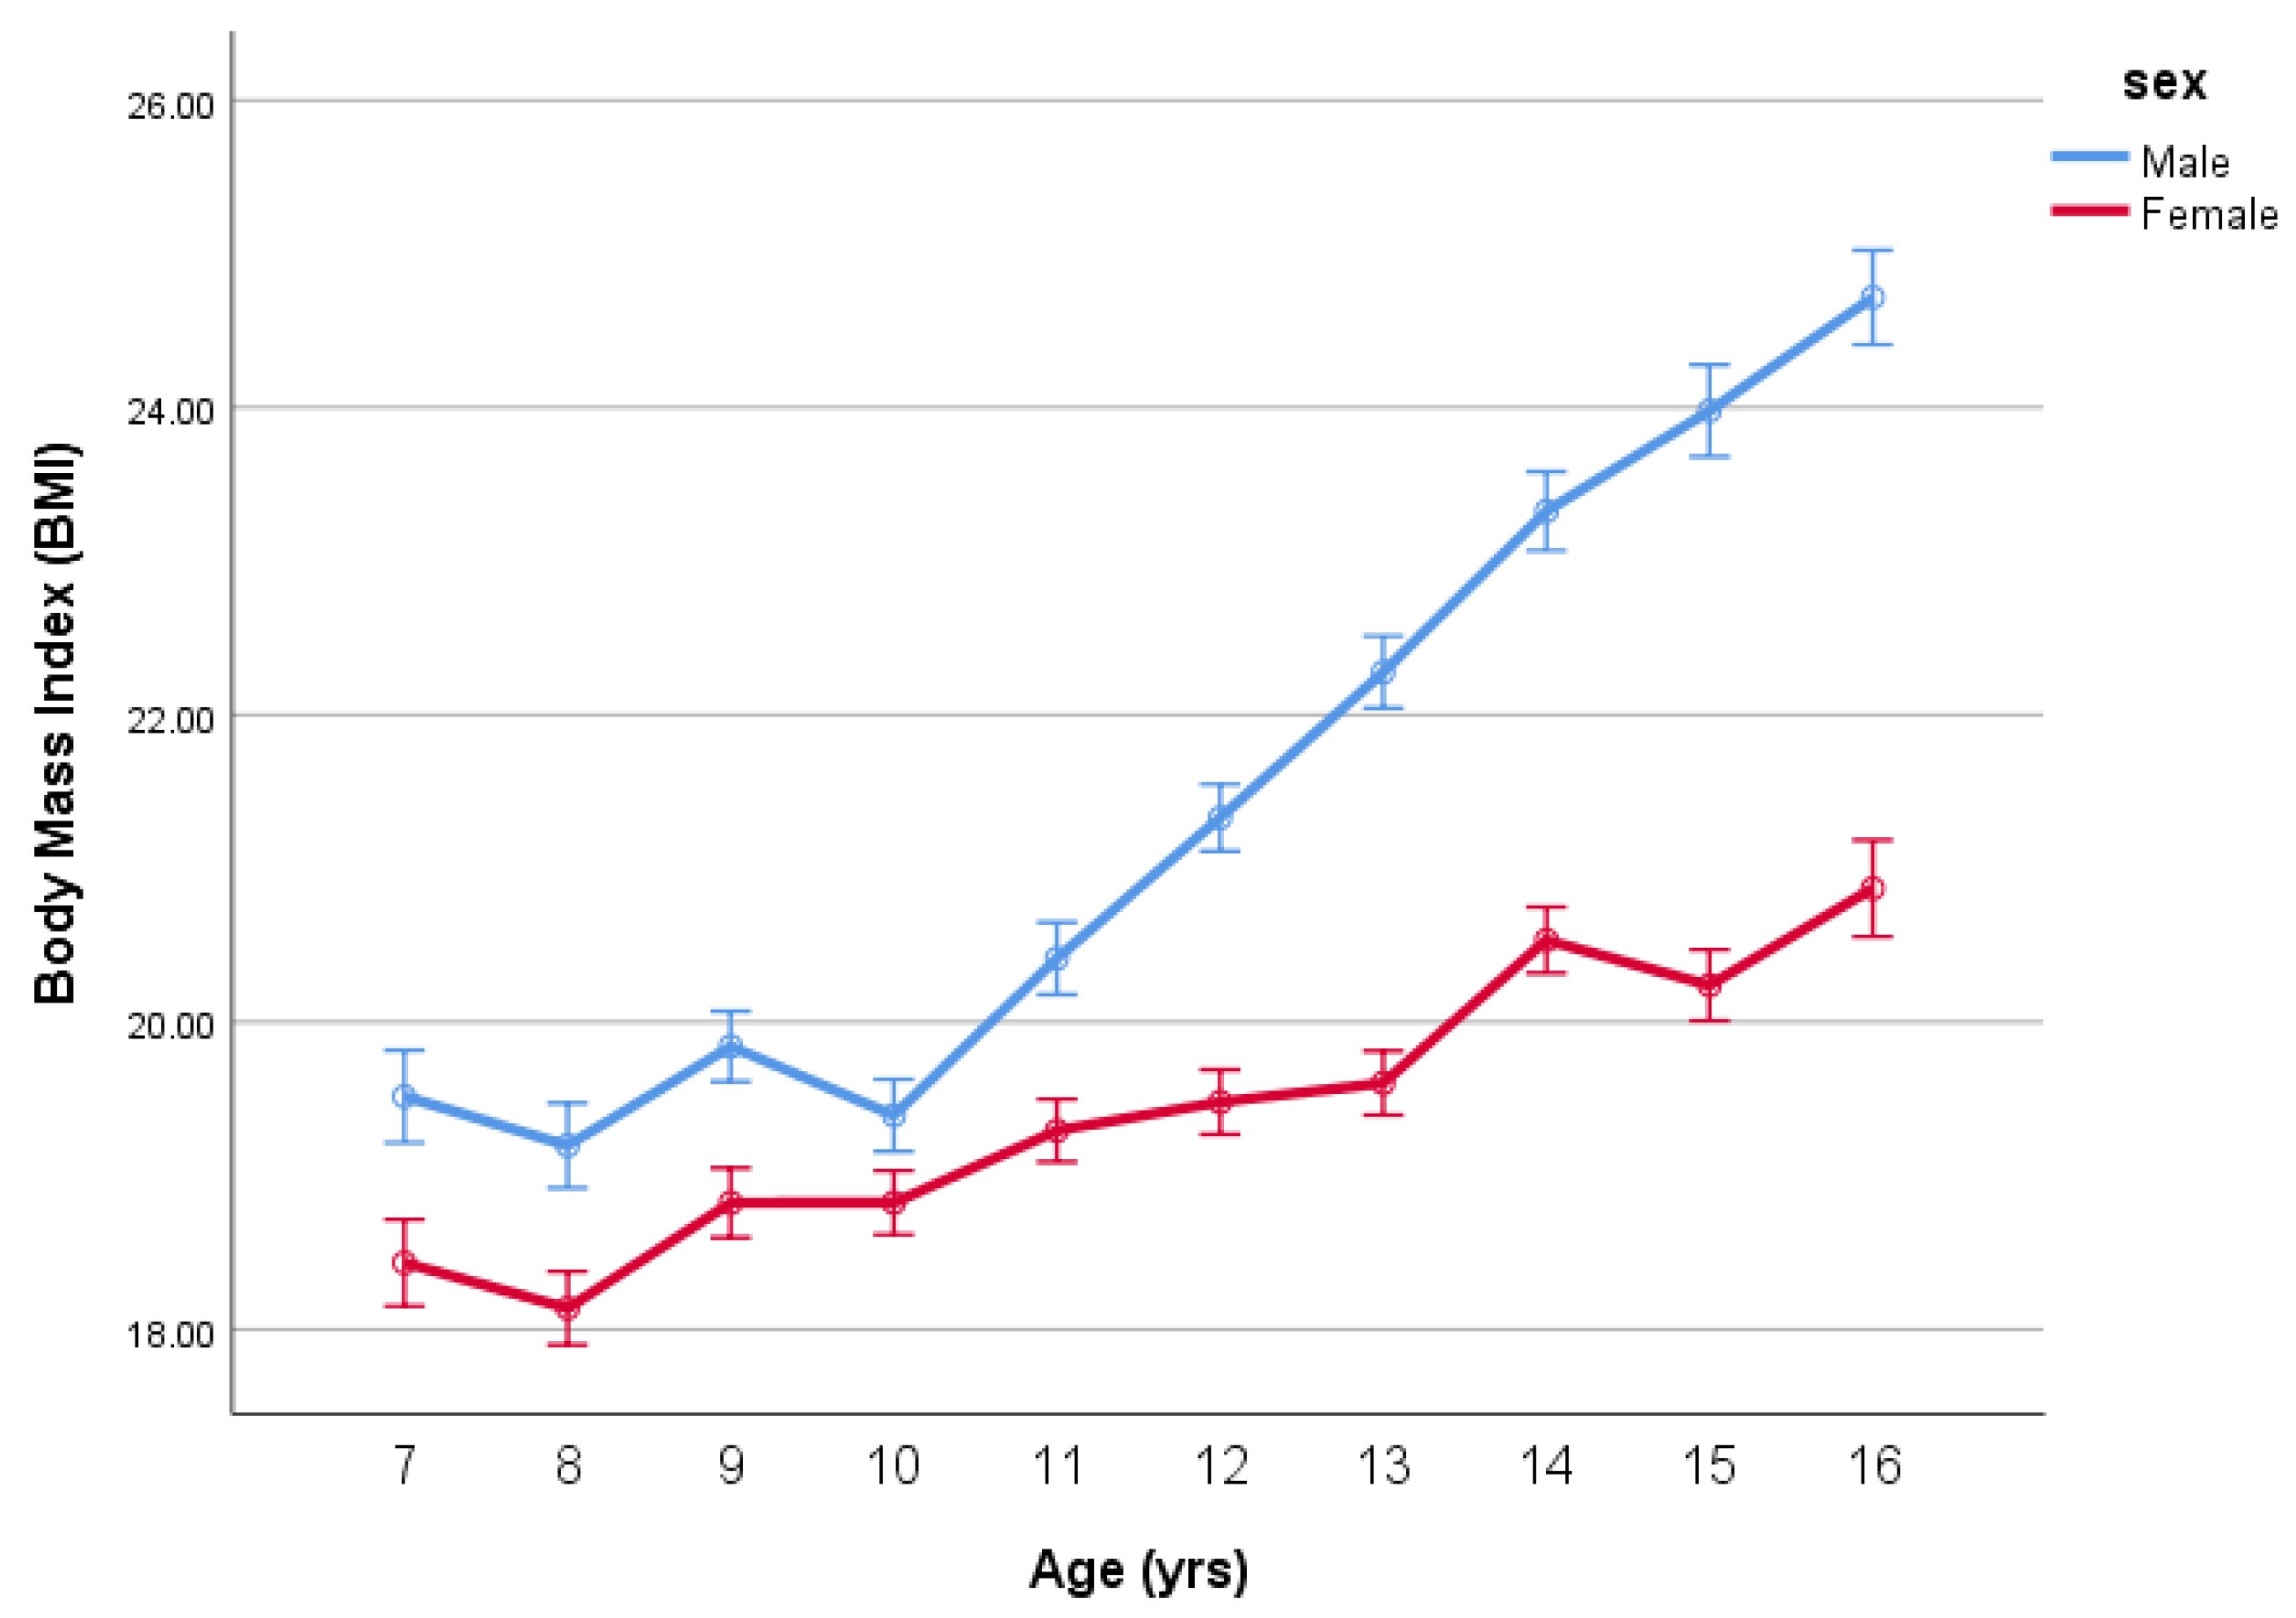
| 7 | 19.5 | 18.4 | 1.1 |
| 8 | 19.2 | 18.1 | 1.1 |
| 9 | 19.8 | 18.8 | 1.0 |
| 10 | 19.4 | 18.8 | 0.6 |
| 11 | 20.4 | 19.3 | 1.1 |
| 12 | 21.3 | 19.5 | 1.9 |
| 13 | 22.3 | 19.6 | 2.7 |
| 14 | 23.3 | 20.5 | 2.8 |
| 15 | 24.0 | 20.2 | 3.7 |
| 16 | 24.7 | 20.9 | 3.8 |
| Tests of Normality | ||||||
|---|---|---|---|---|---|---|
| Kolmogorov–Smirnov a | Shapiro–Wilk | |||||
| Statistic | df | Sig. | Statistic | df | Sig. | |
| Residual for BMI | 0.048 | 2149 | 0.000 | 0.959 | 2149 | 0.000 |
| Residual for iBMI | 0.018 | 2149 | 0.086 | 0.997 | 2149 | 0.001 |
| Age | iBMI | BMI | ||||||||
|---|---|---|---|---|---|---|---|---|---|---|
| Male | SEE | Female | SEE | Diff | Male | SEE | Female | SEE | Diff | |
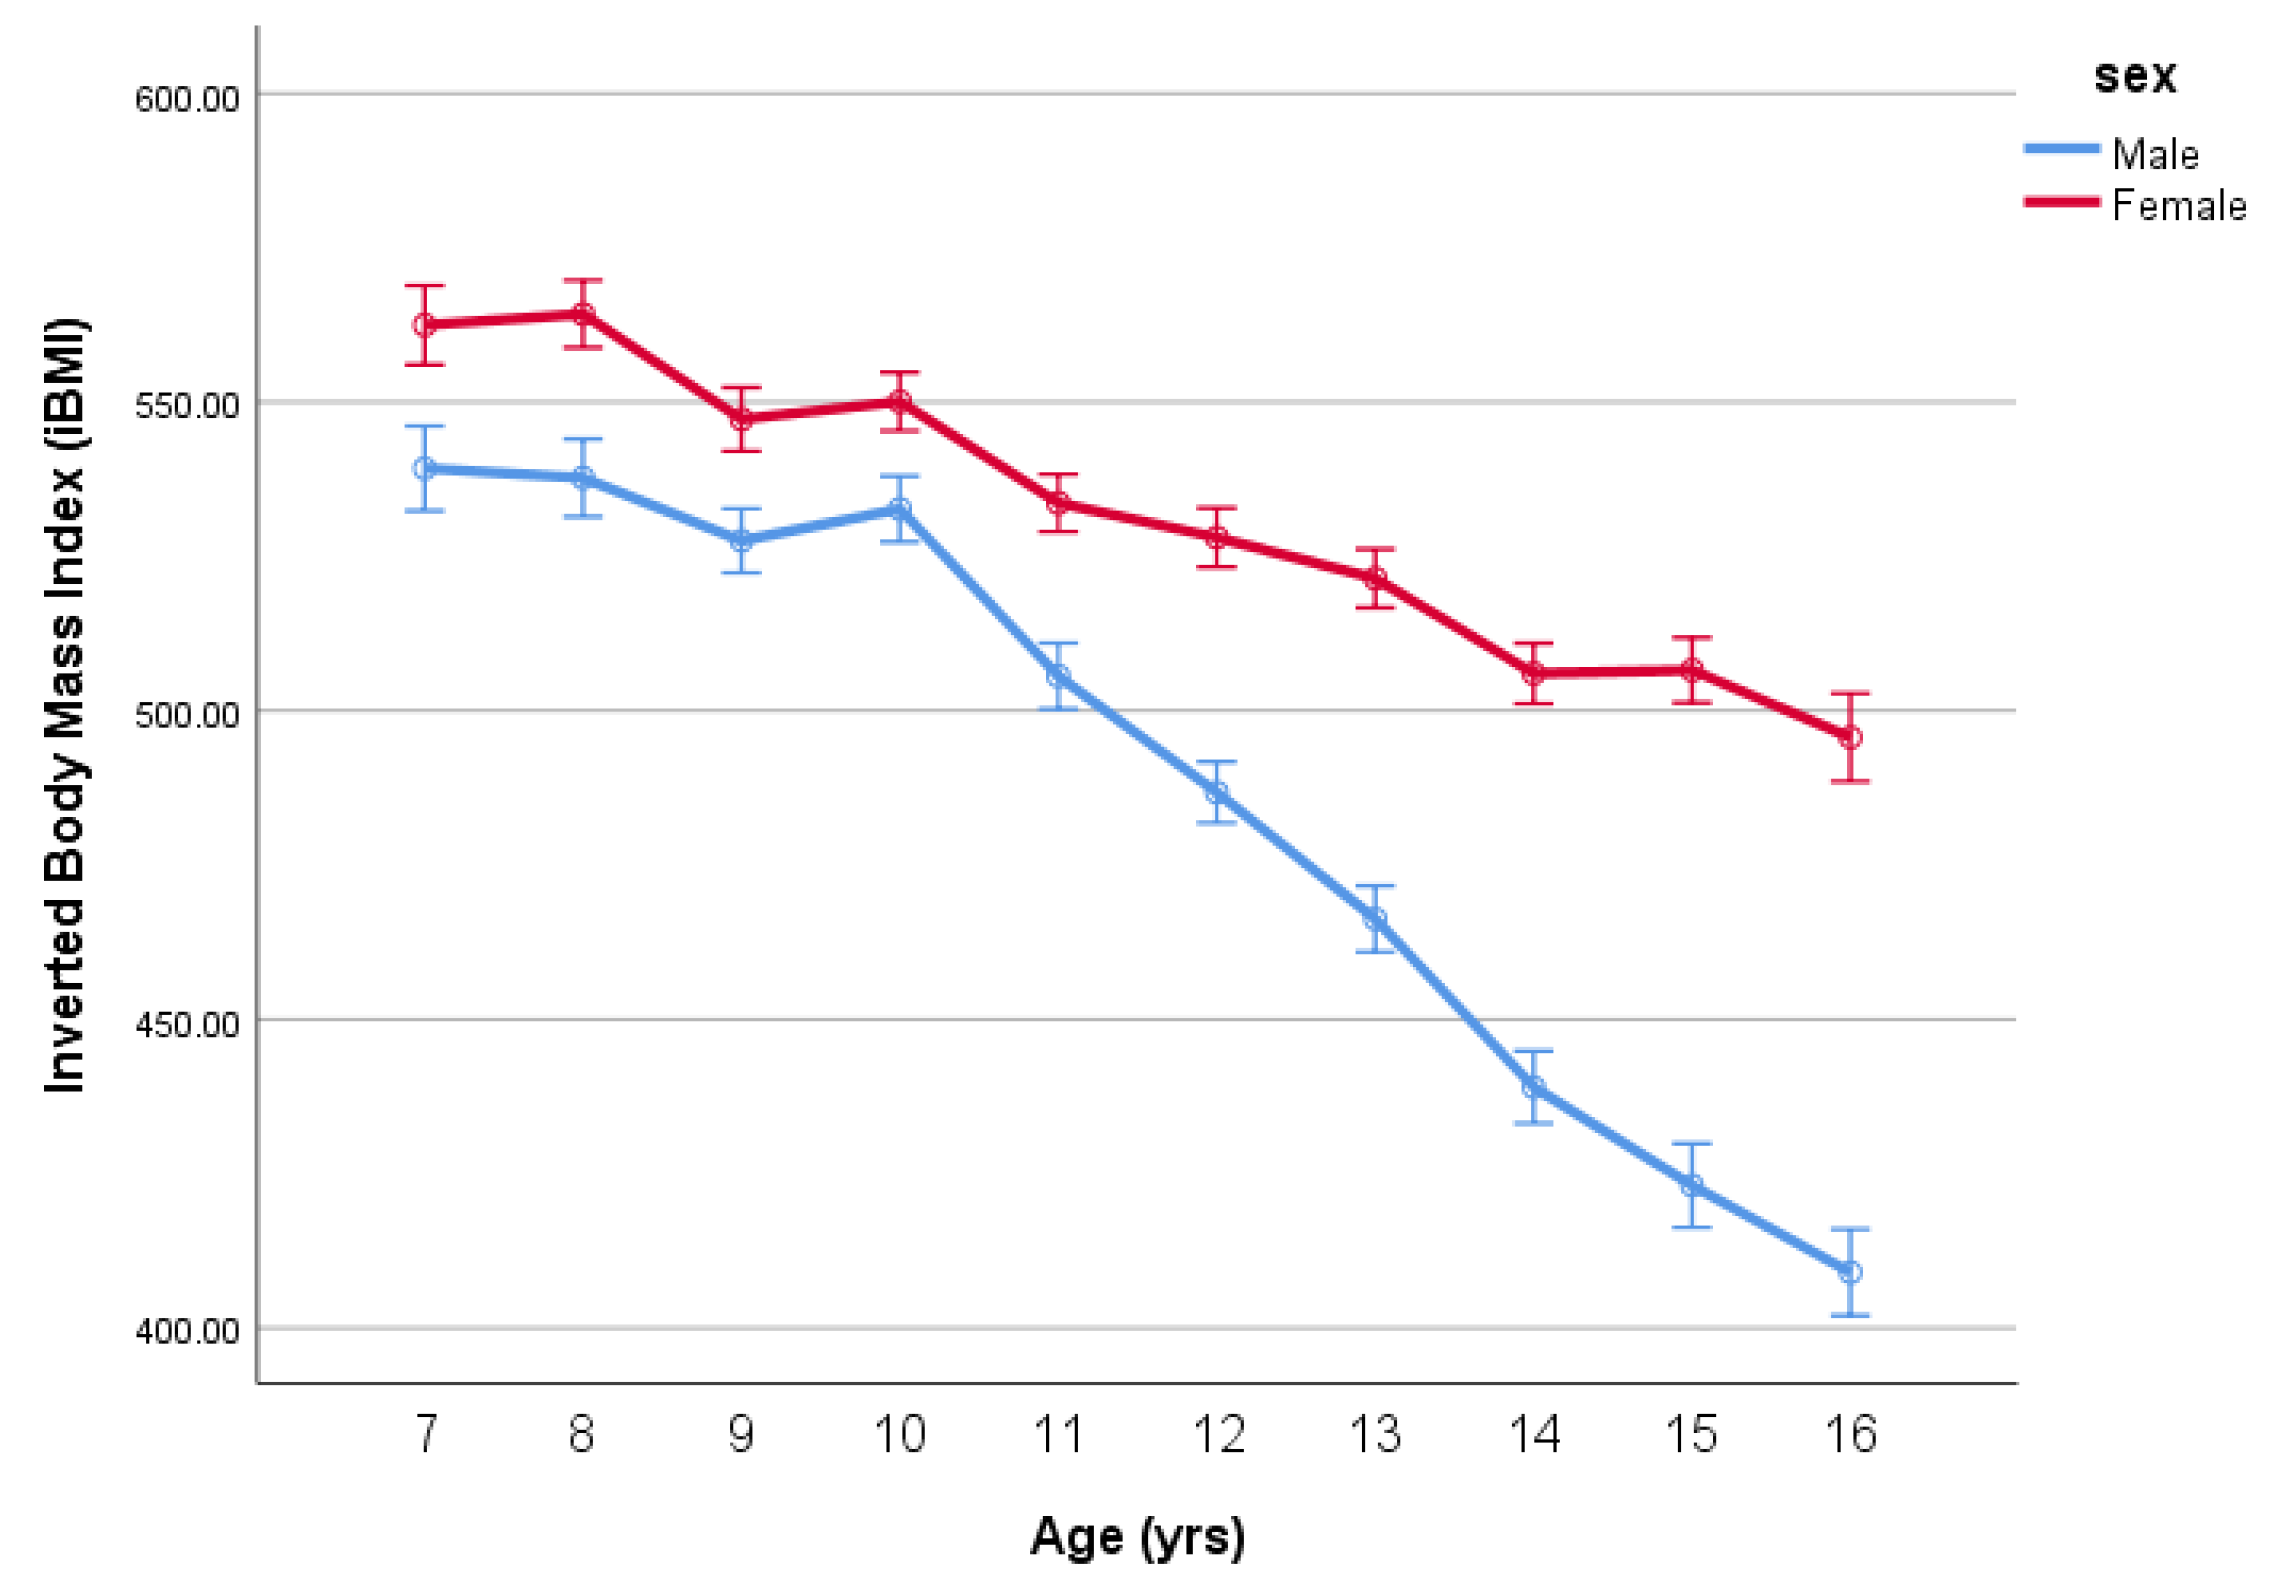
| 7 | 539.2 | 6.9 | 562.5 | 6.4 | 23.2 | 18.5 | 0.30 | 17.8 | 0.28 | 0.8 |
| 8 | 537.7 | 6.3 | 564.3 | 5.4 | 26.6 | 18.6 | 0.28 | 17.7 | 0.24 | 0.9 |
| 9 | 527.5 | 5.2 | 547.2 | 5.2 | 19.7 | 19.0 | 0.23 | 18.3 | 0.23 | 0.7 |
| 10 | 532.7 | 5.3 | 550.1 | 4.7 | 17.4 | 18.8 | 0.23 | 18.2 | 0.21 | 0.6 |
| 11 | 505.6 | 5.3 | 533.6 | 4.7 | 28.0 | 19.8 | 0.23 | 18.7 | 0.20 | 1.0 |
| 12 | 486.8 | 5.0 | 528.1 | 4.8 | 41.3 | 20.5 | 0.22 | 18.9 | 0.21 | 1.6 |
| 13 | 466.3 | 5.3 | 521.4 | 4.7 | 55.2 | 21.4 | 0.23 | 19.2 | 0.21 | 2.3 |
| 14 | 439.0 | 5.9 | 506.0 | 4.9 | 67.0 | 22.8 | 0.26 | 19.8 | 0.21 | 3.0 |
| 15 | 423.1 | 6.8 | 506.6 | 5.3 | 83.5 | 23.6 | 0.30 | 19.7 | 0.23 | 3.9 |
| 16 | 409.0 | 7.0 | 495.7 | 7.1 | 86.7 | 24.4 | 0.31 | 20.2 | 0.31 | 4.3 |
Publisher’s Note: MDPI stays neutral with regard to jurisdictional claims in published maps and institutional affiliations. |
© 2021 by the authors. Licensee MDPI, Basel, Switzerland. This article is an open access article distributed under the terms and conditions of the Creative Commons Attribution (CC BY) license (https://creativecommons.org/licenses/by/4.0/).
Share and Cite
Nevill, A.M.; Reuter, C.P.; Brand, C.; Gaya, A.R.; Mota, J.; Renner, J.D.P.; Duncan, M.J. BMI Fails to Reflect the Developmental Changes in Body Fatness between Boys and Girls during Adolescence. Int. J. Environ. Res. Public Health 2021, 18, 7833. https://doi.org/10.3390/ijerph18157833
Nevill AM, Reuter CP, Brand C, Gaya AR, Mota J, Renner JDP, Duncan MJ. BMI Fails to Reflect the Developmental Changes in Body Fatness between Boys and Girls during Adolescence. International Journal of Environmental Research and Public Health. 2021; 18(15):7833. https://doi.org/10.3390/ijerph18157833
Chicago/Turabian StyleNevill, Alan M., Cézane Priscila Reuter, Caroline Brand, Anelise Reis Gaya, Jorge Mota, Jane Dagmar Pollo Renner, and Michael J. Duncan. 2021. "BMI Fails to Reflect the Developmental Changes in Body Fatness between Boys and Girls during Adolescence" International Journal of Environmental Research and Public Health 18, no. 15: 7833. https://doi.org/10.3390/ijerph18157833
APA StyleNevill, A. M., Reuter, C. P., Brand, C., Gaya, A. R., Mota, J., Renner, J. D. P., & Duncan, M. J. (2021). BMI Fails to Reflect the Developmental Changes in Body Fatness between Boys and Girls during Adolescence. International Journal of Environmental Research and Public Health, 18(15), 7833. https://doi.org/10.3390/ijerph18157833