
Coupling Coordination Relationship and Driving Mechanism between Urbanization and Ecosystem Service Value in Large Regions: A Case Study of Urban Agglomeration in Yellow River Basin, China

Abstract
:1. Introduction
2. Materials and Methods
2.1. Study Area
2.2. Data Sources
2.3. Study Methods
2.3.1. Ecosystem Service Assessment
2.3.2. Establishment of Urbanization Index System
2.3.3. Variable Selection of Driving Factors
2.3.4. Data Standardization and Index Empowerment
xmj = (max(xmj) − xmj)/(max(xmj) − min(xmj)) (−)
2.3.5. Coupling and Coordination Model
Tit = (αλE + βλU)1/2
2.3.6. Spatial Correlation Model
2.3.7. Geographical Detector Method
2.3.8. Ordinary Least Squares (OLS)
2.3.9. GWR Model
3. Results
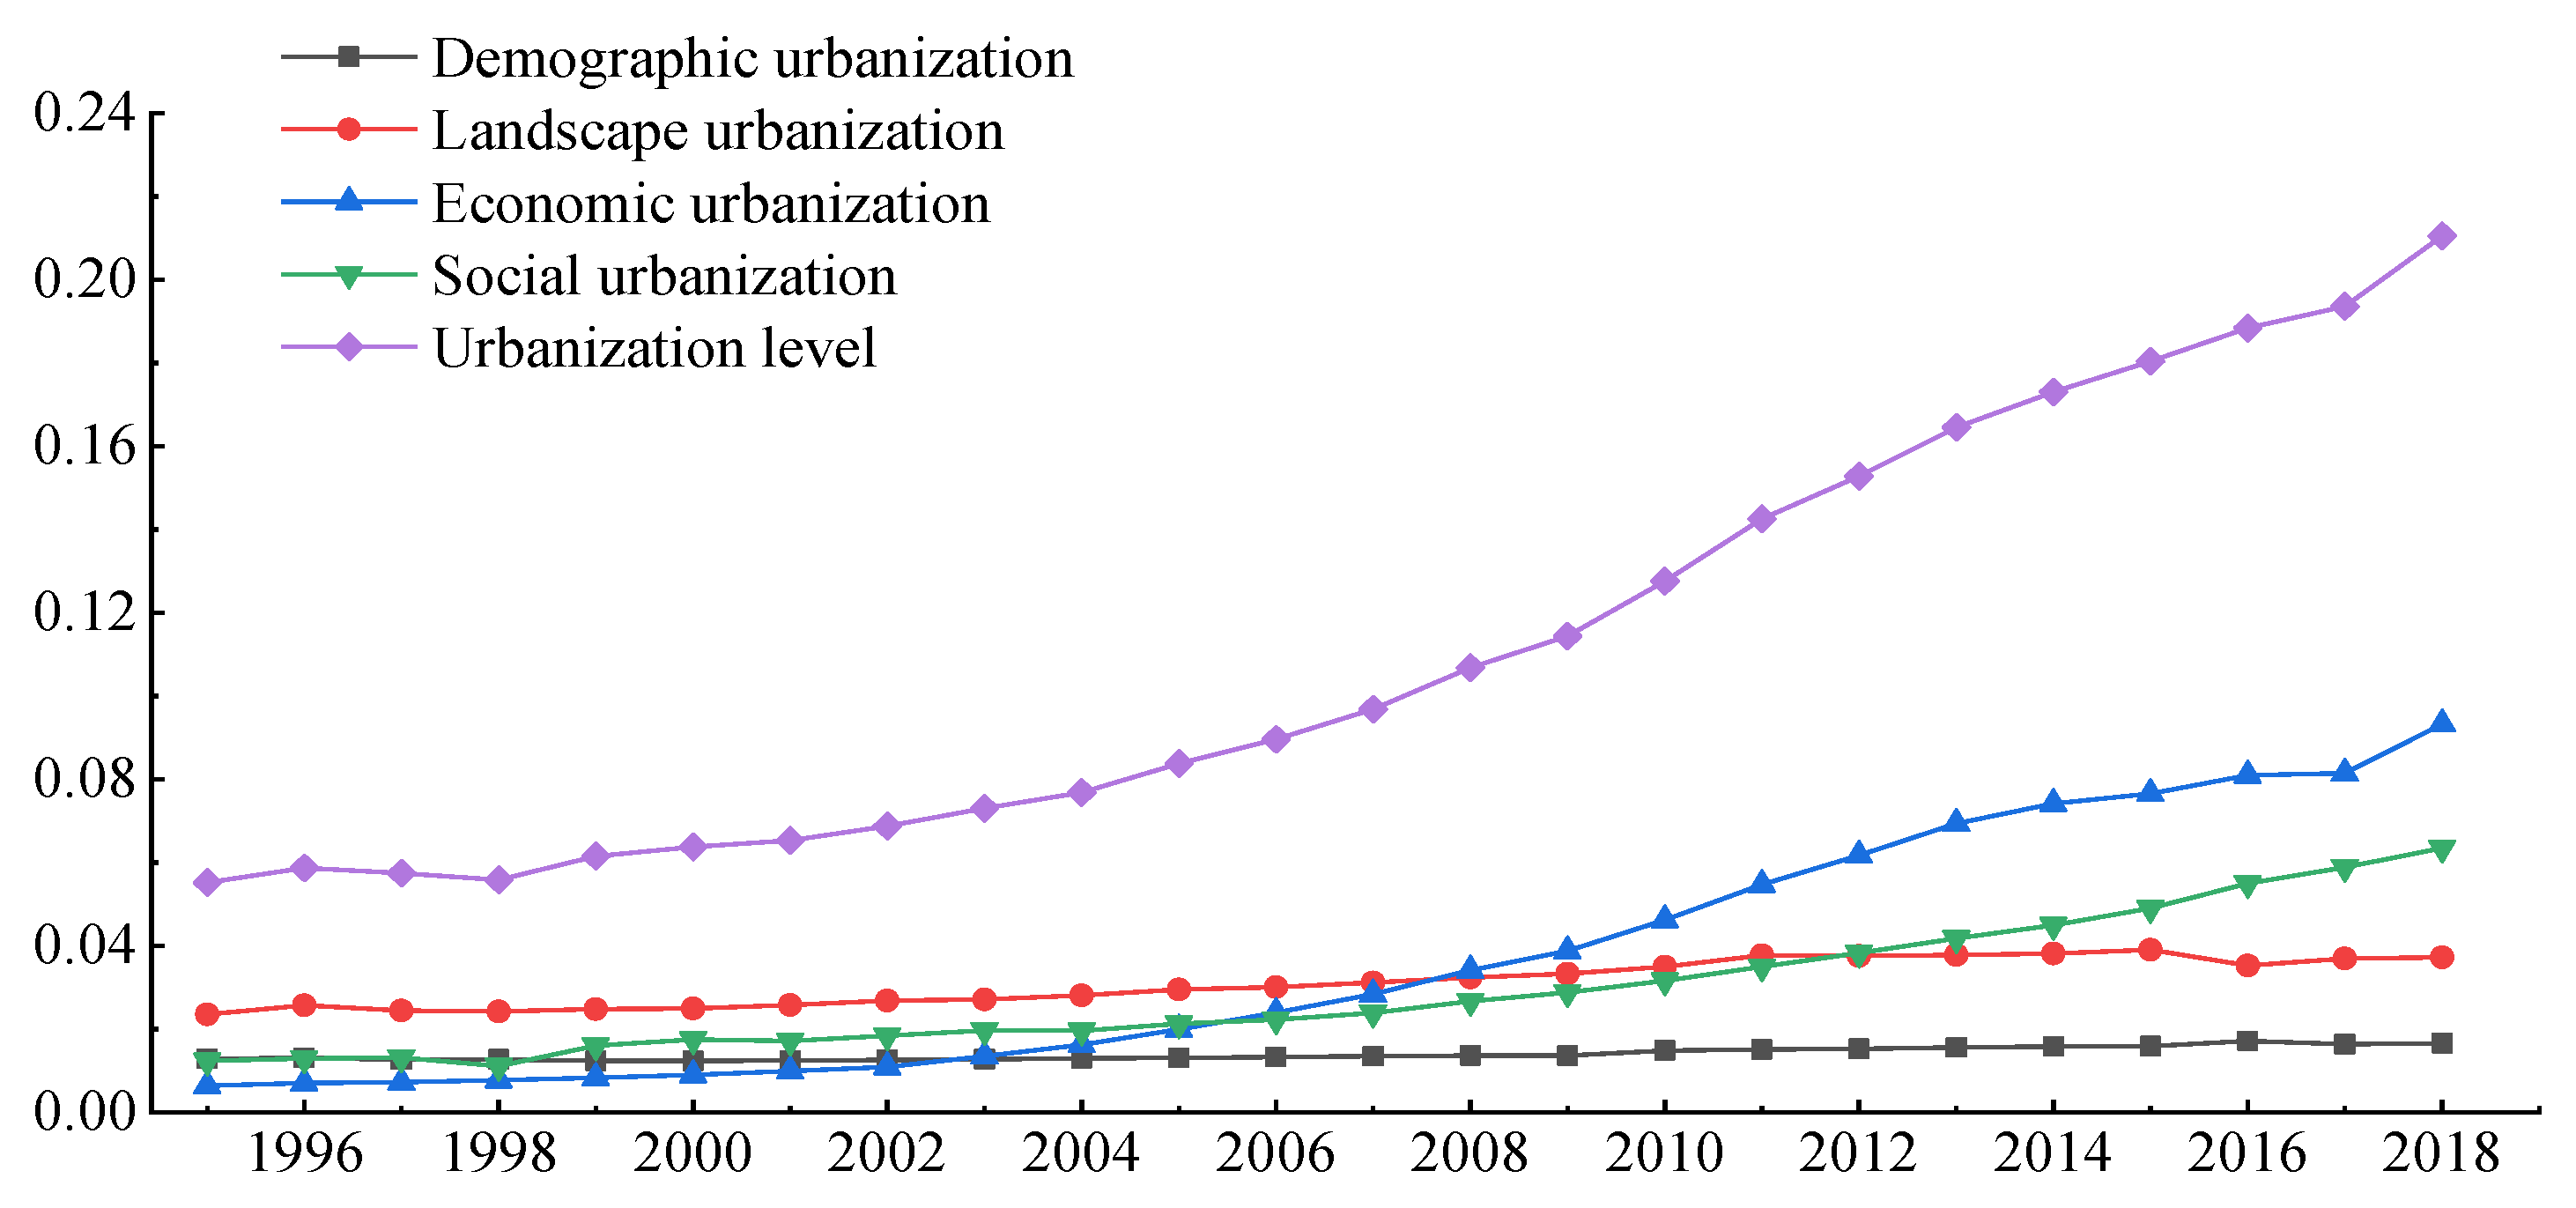
3.1. Urbanization
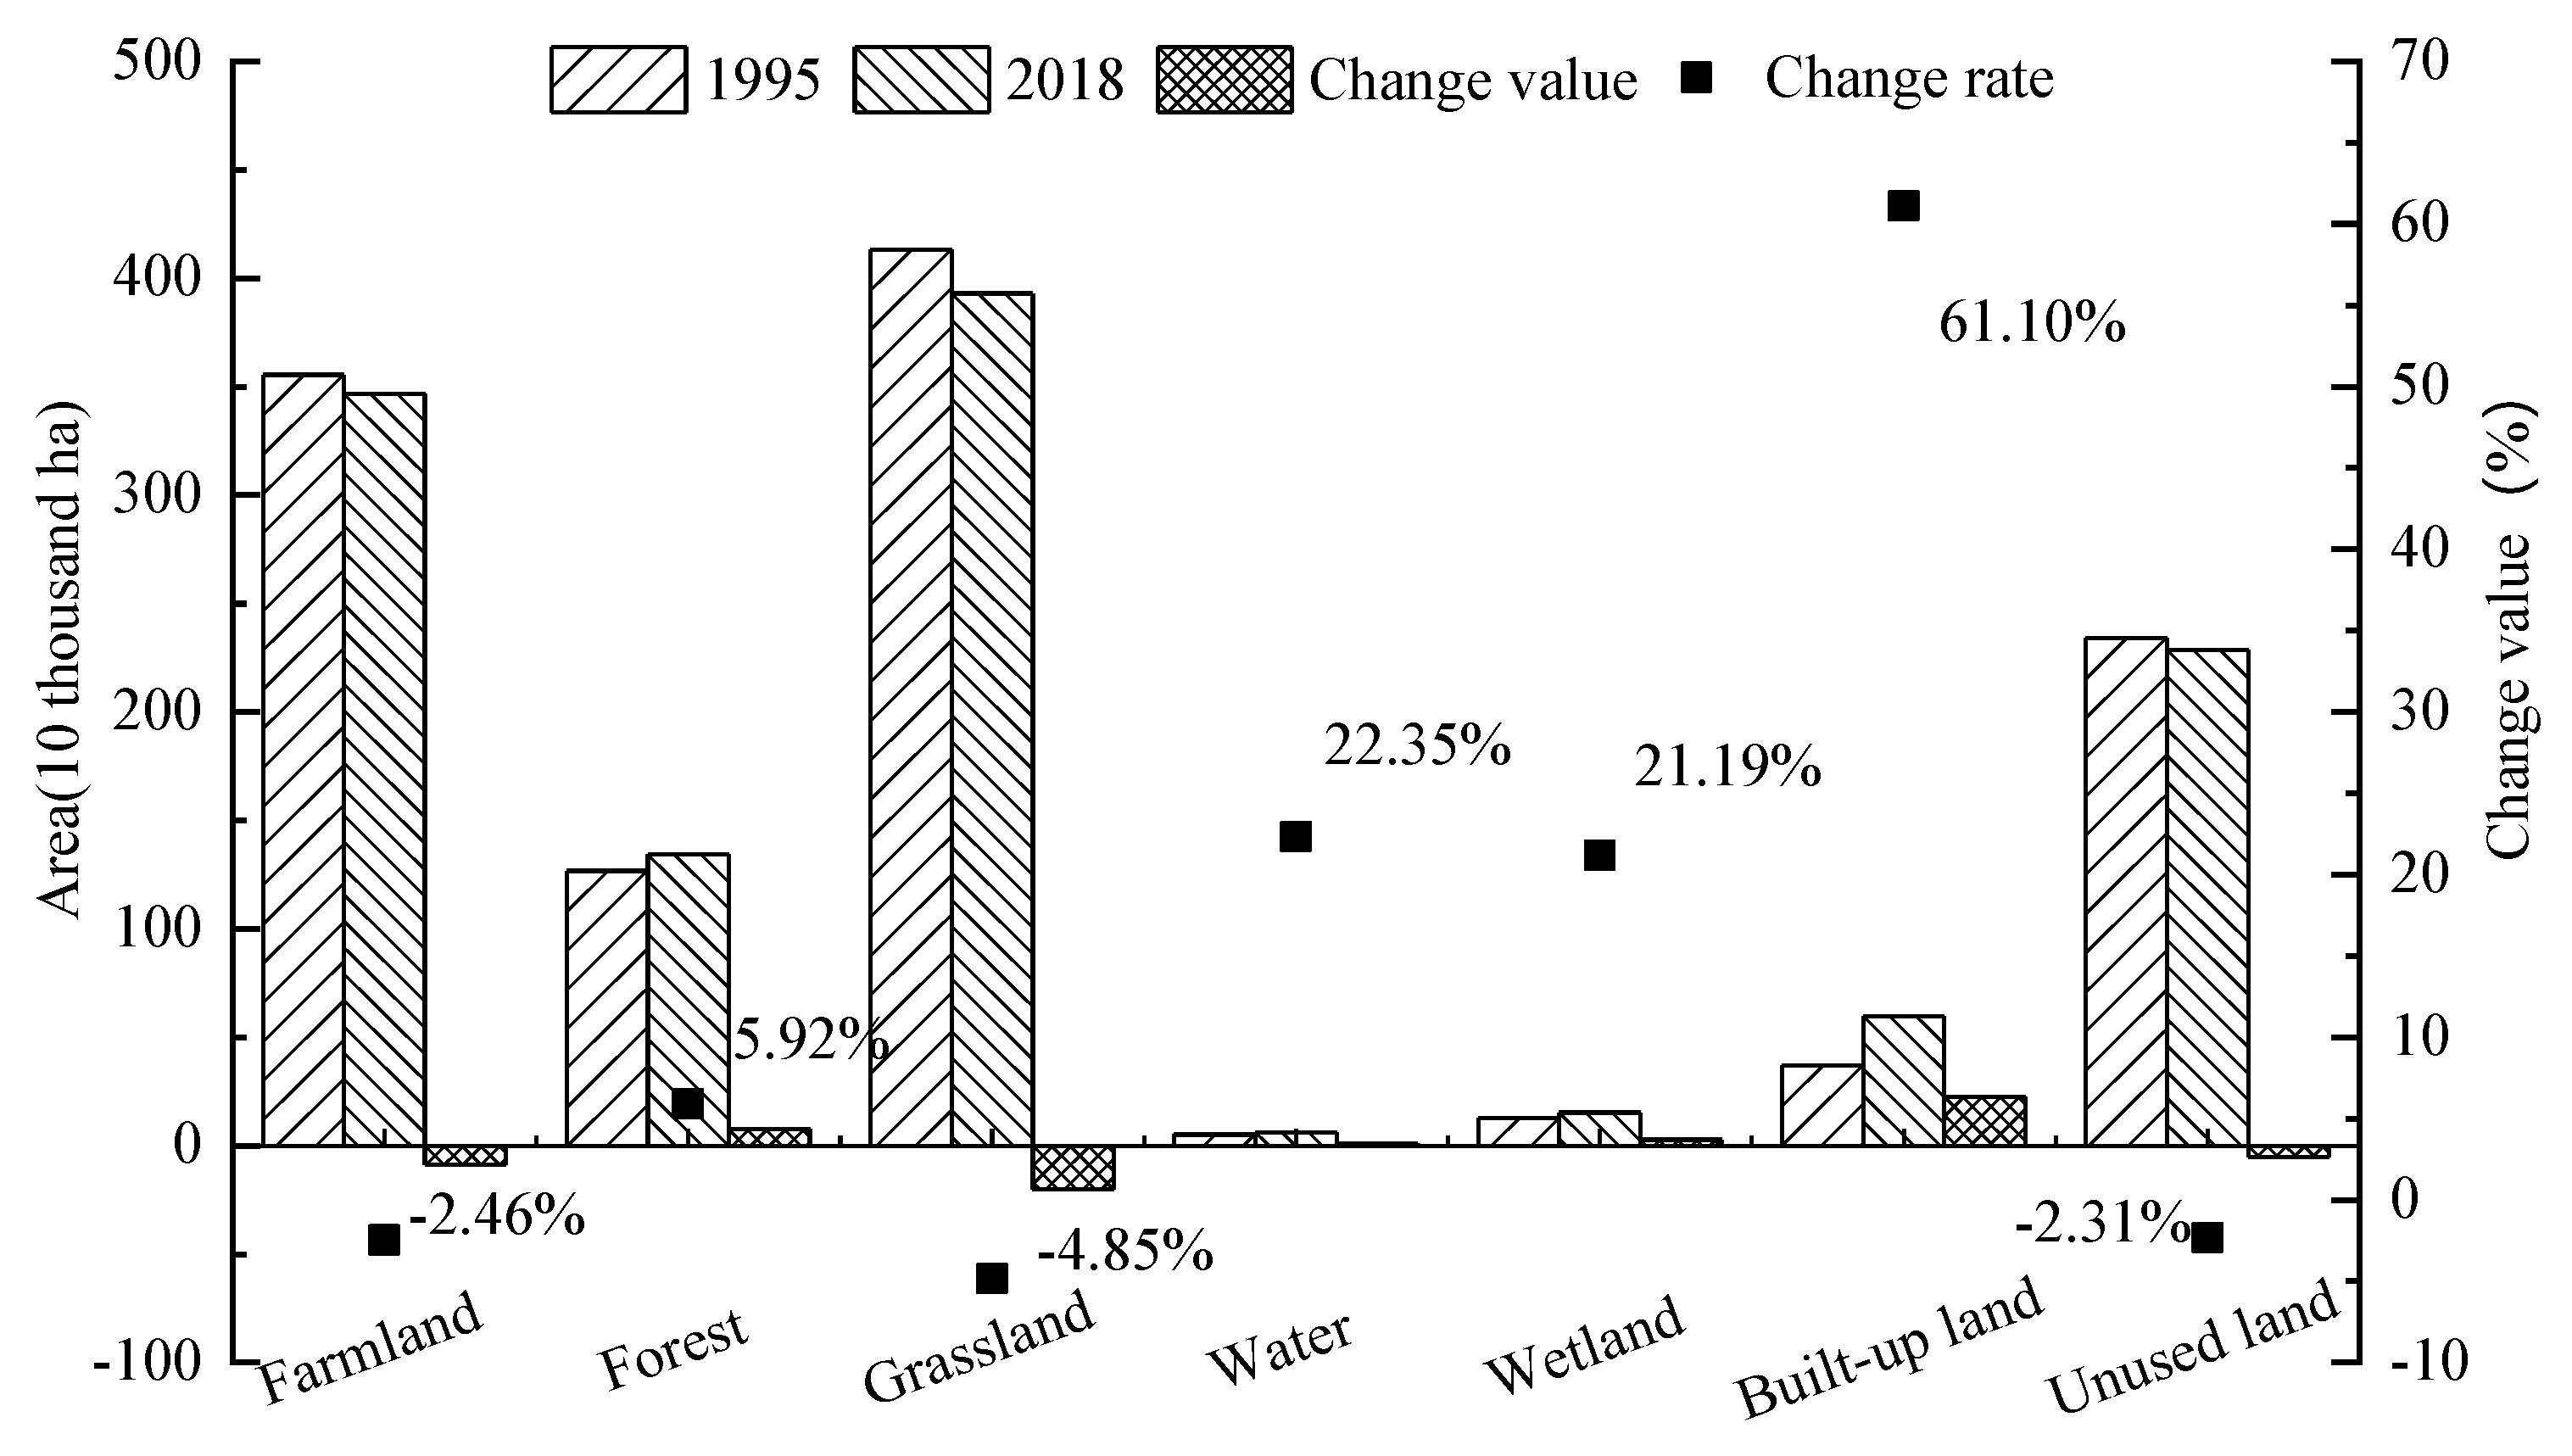
3.2. Land Use Changes in the Yellow River Basin
3.3. ESV Changes in the Yellow River Basin
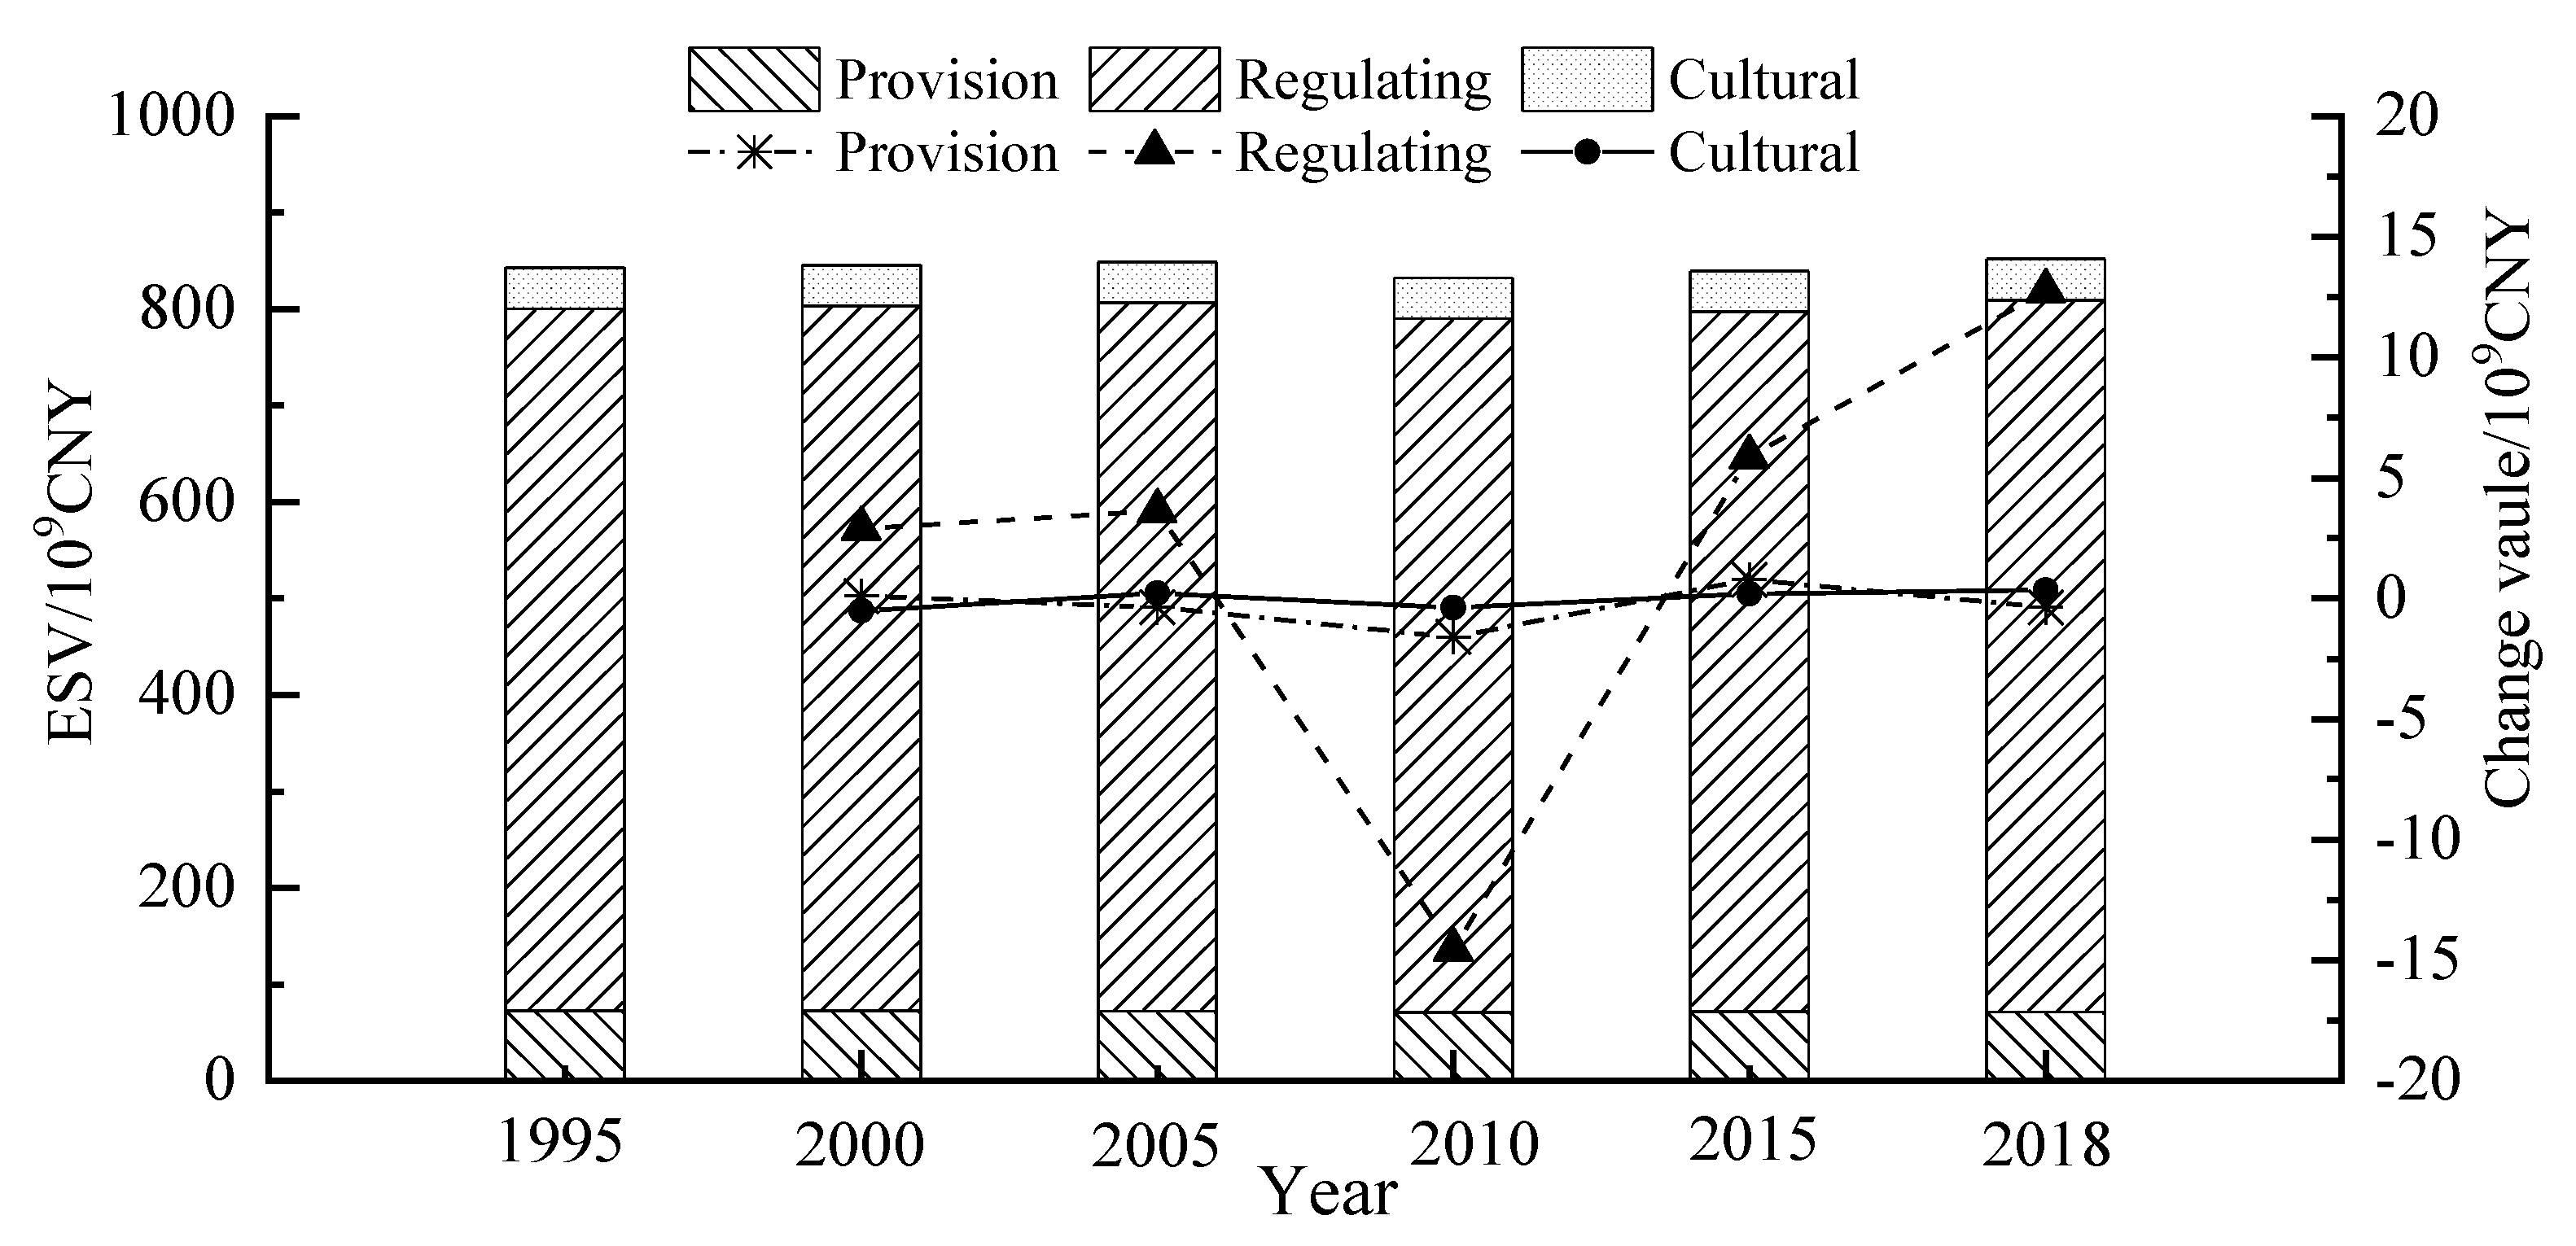
3.3.1. ESV Changes Based on Time Scale
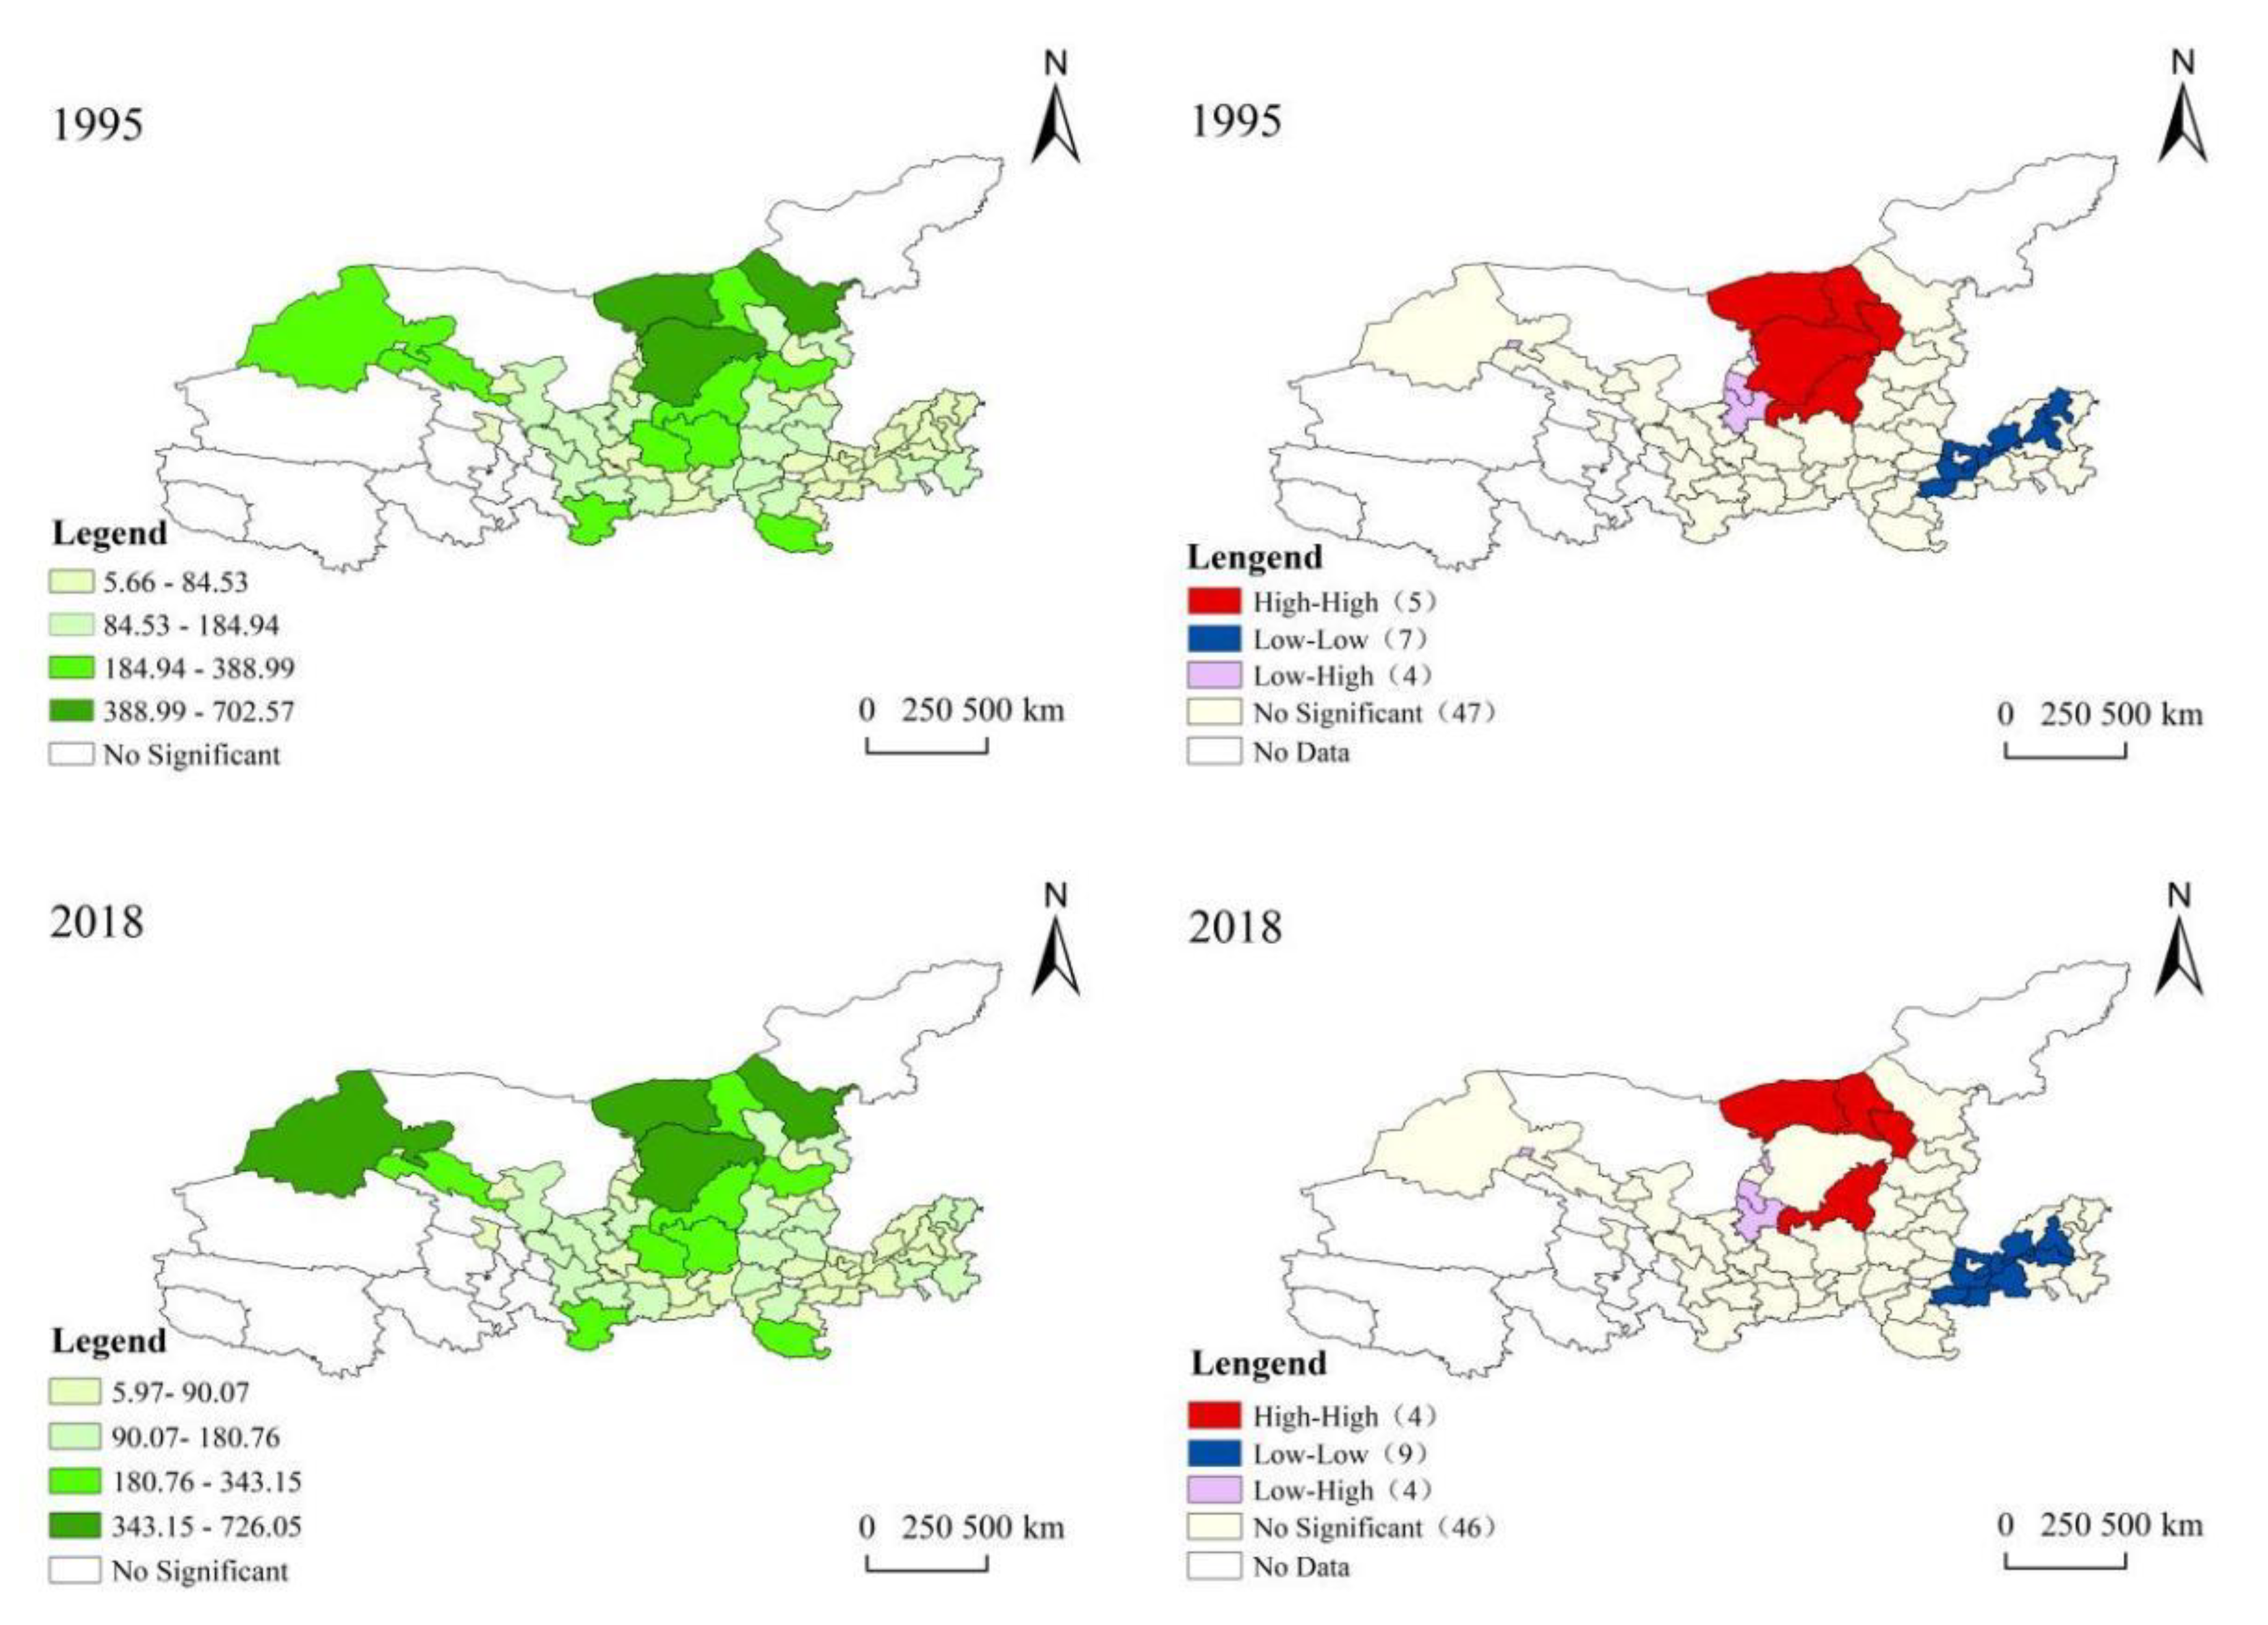
3.3.2. ESV Changes on the Spatial Scale
3.4. Coupling and Coordination Relationship between Urbanization and ESs in the Yellow River Basin
3.4.1. The Overall Situation of the Coupling and Coordination Degree of Cities in the Yellow River Basin
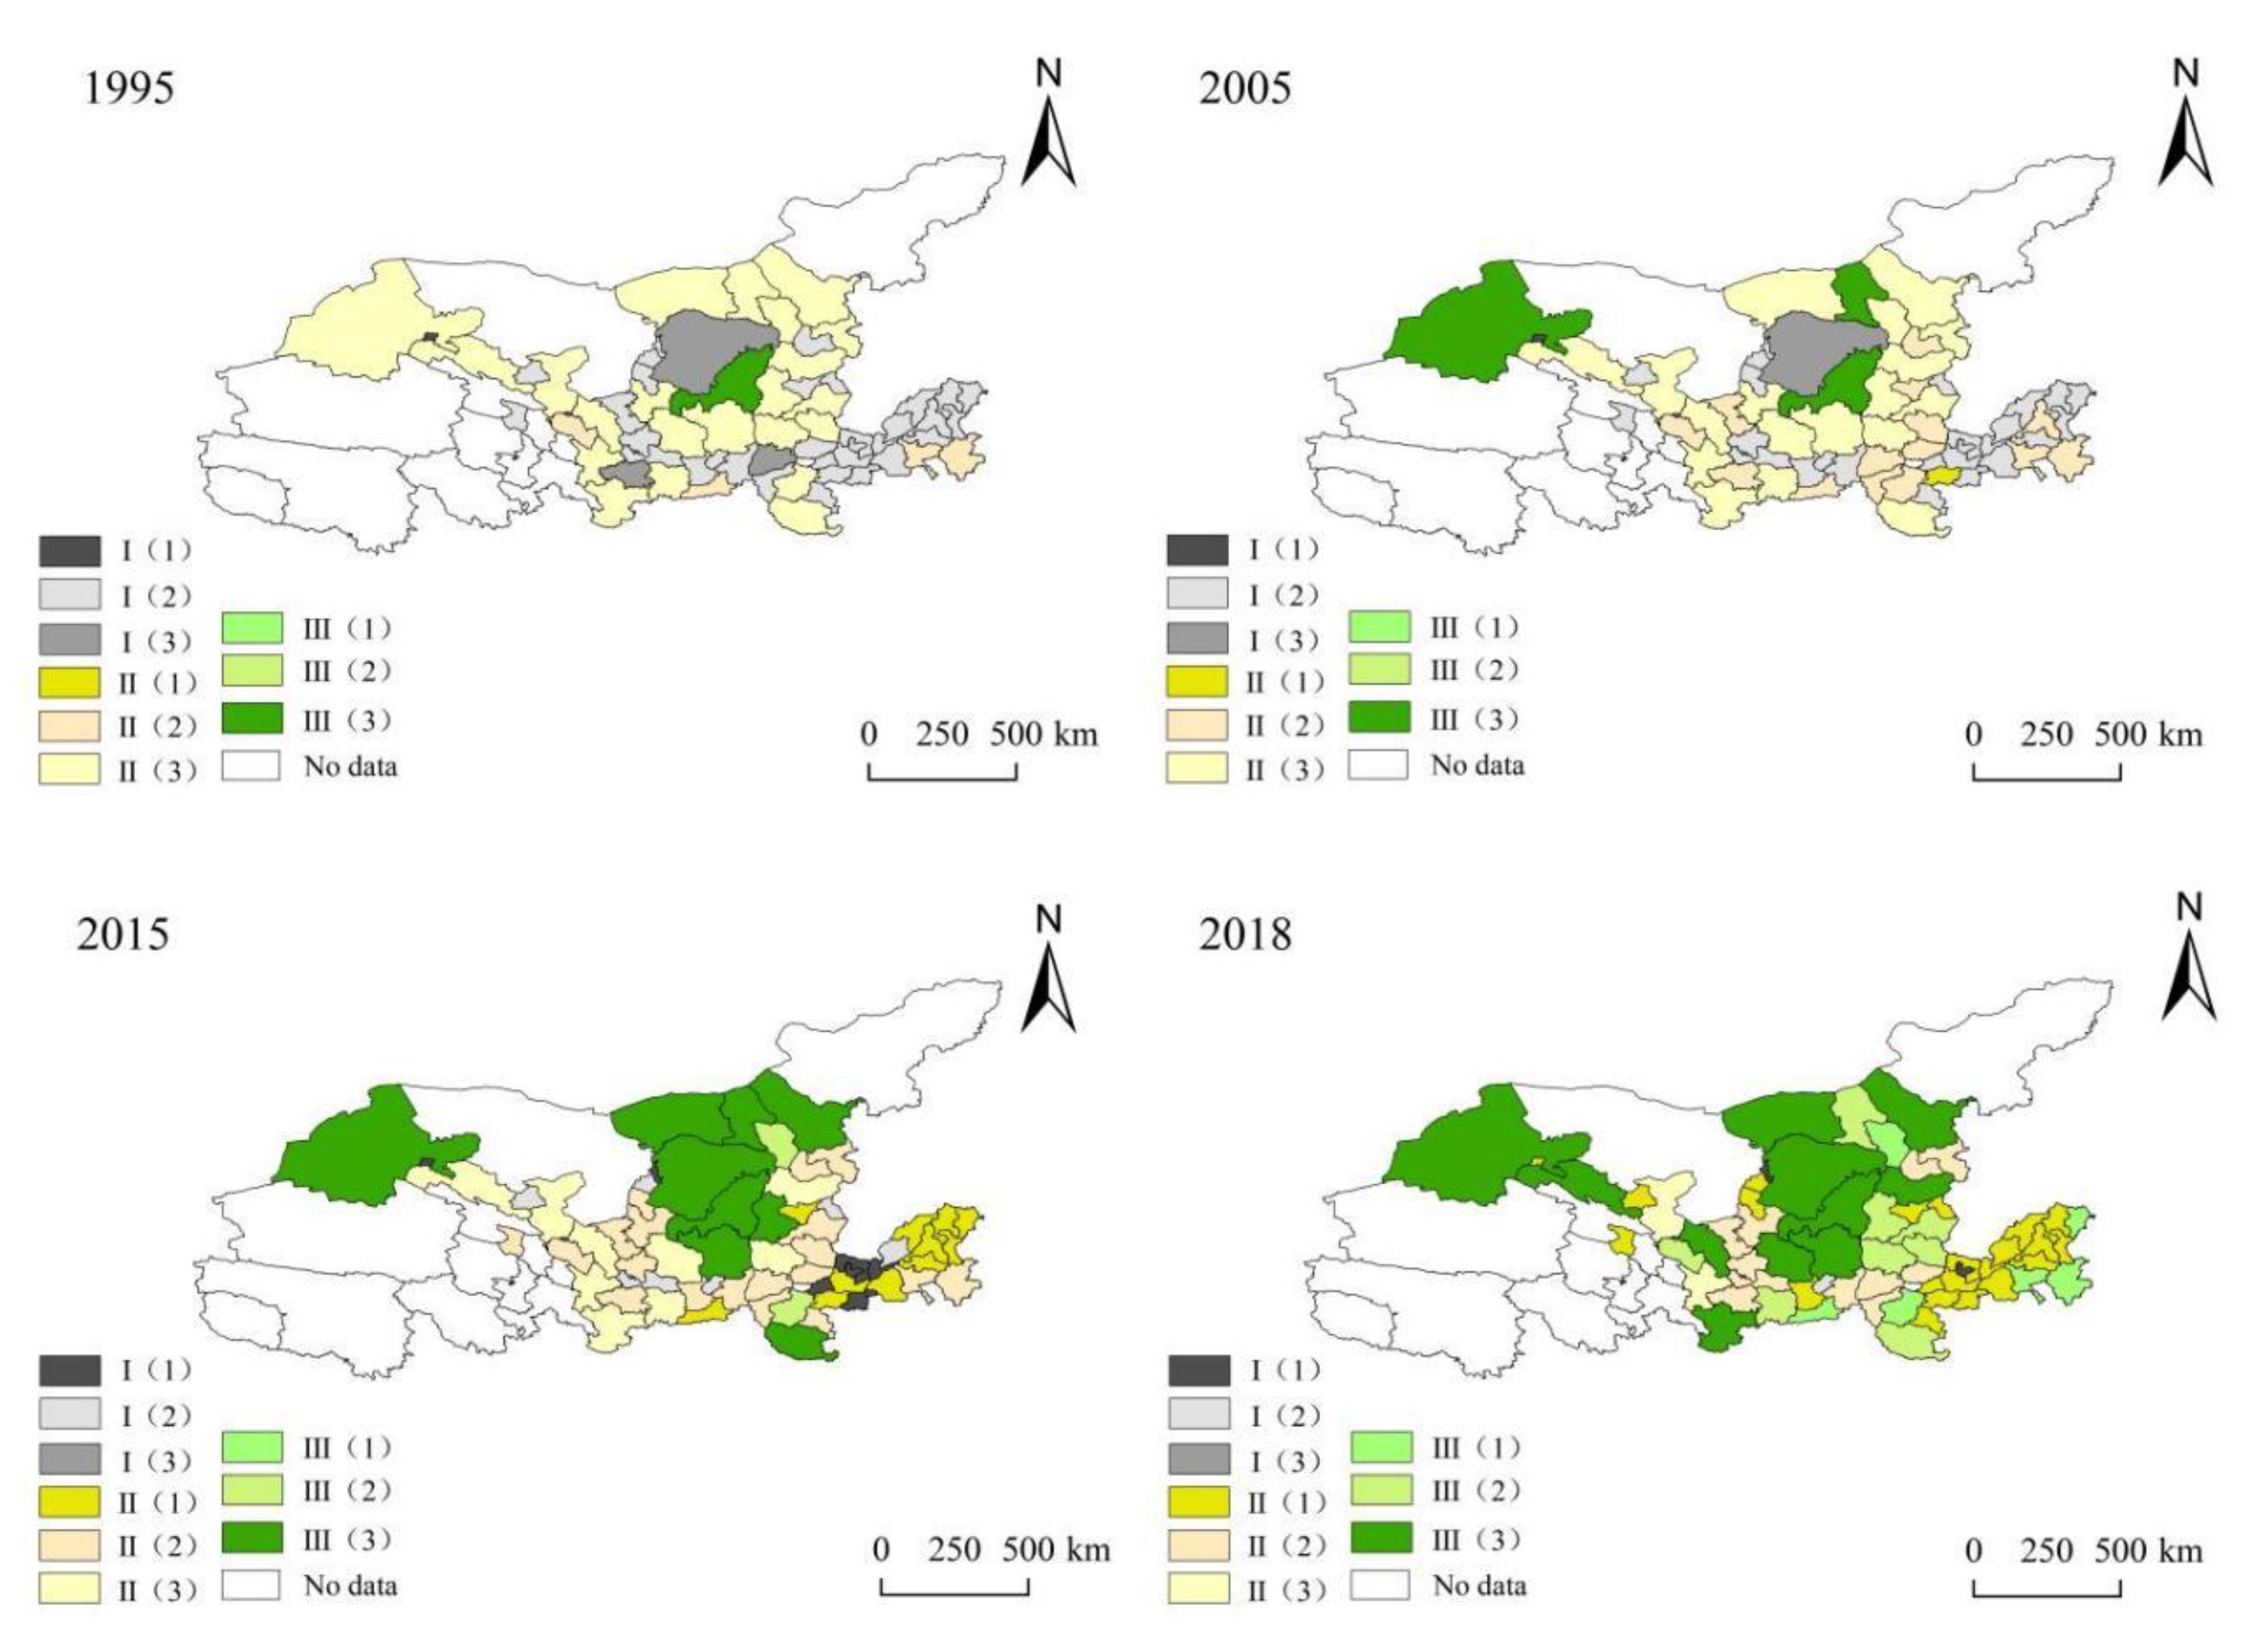
3.4.2. Spatio-Temporal Heterogeneity of Coupling and Coordination Degree of Cities in the Yellow River
3.5. Factors Influencing the Degree of Coupling and Coordination between ESs and Urbanization
3.5.1. Identification of Dominant Variables of Driving Factors
3.5.2. Comparison of Influencing Factors Based on OLS-GWR Model
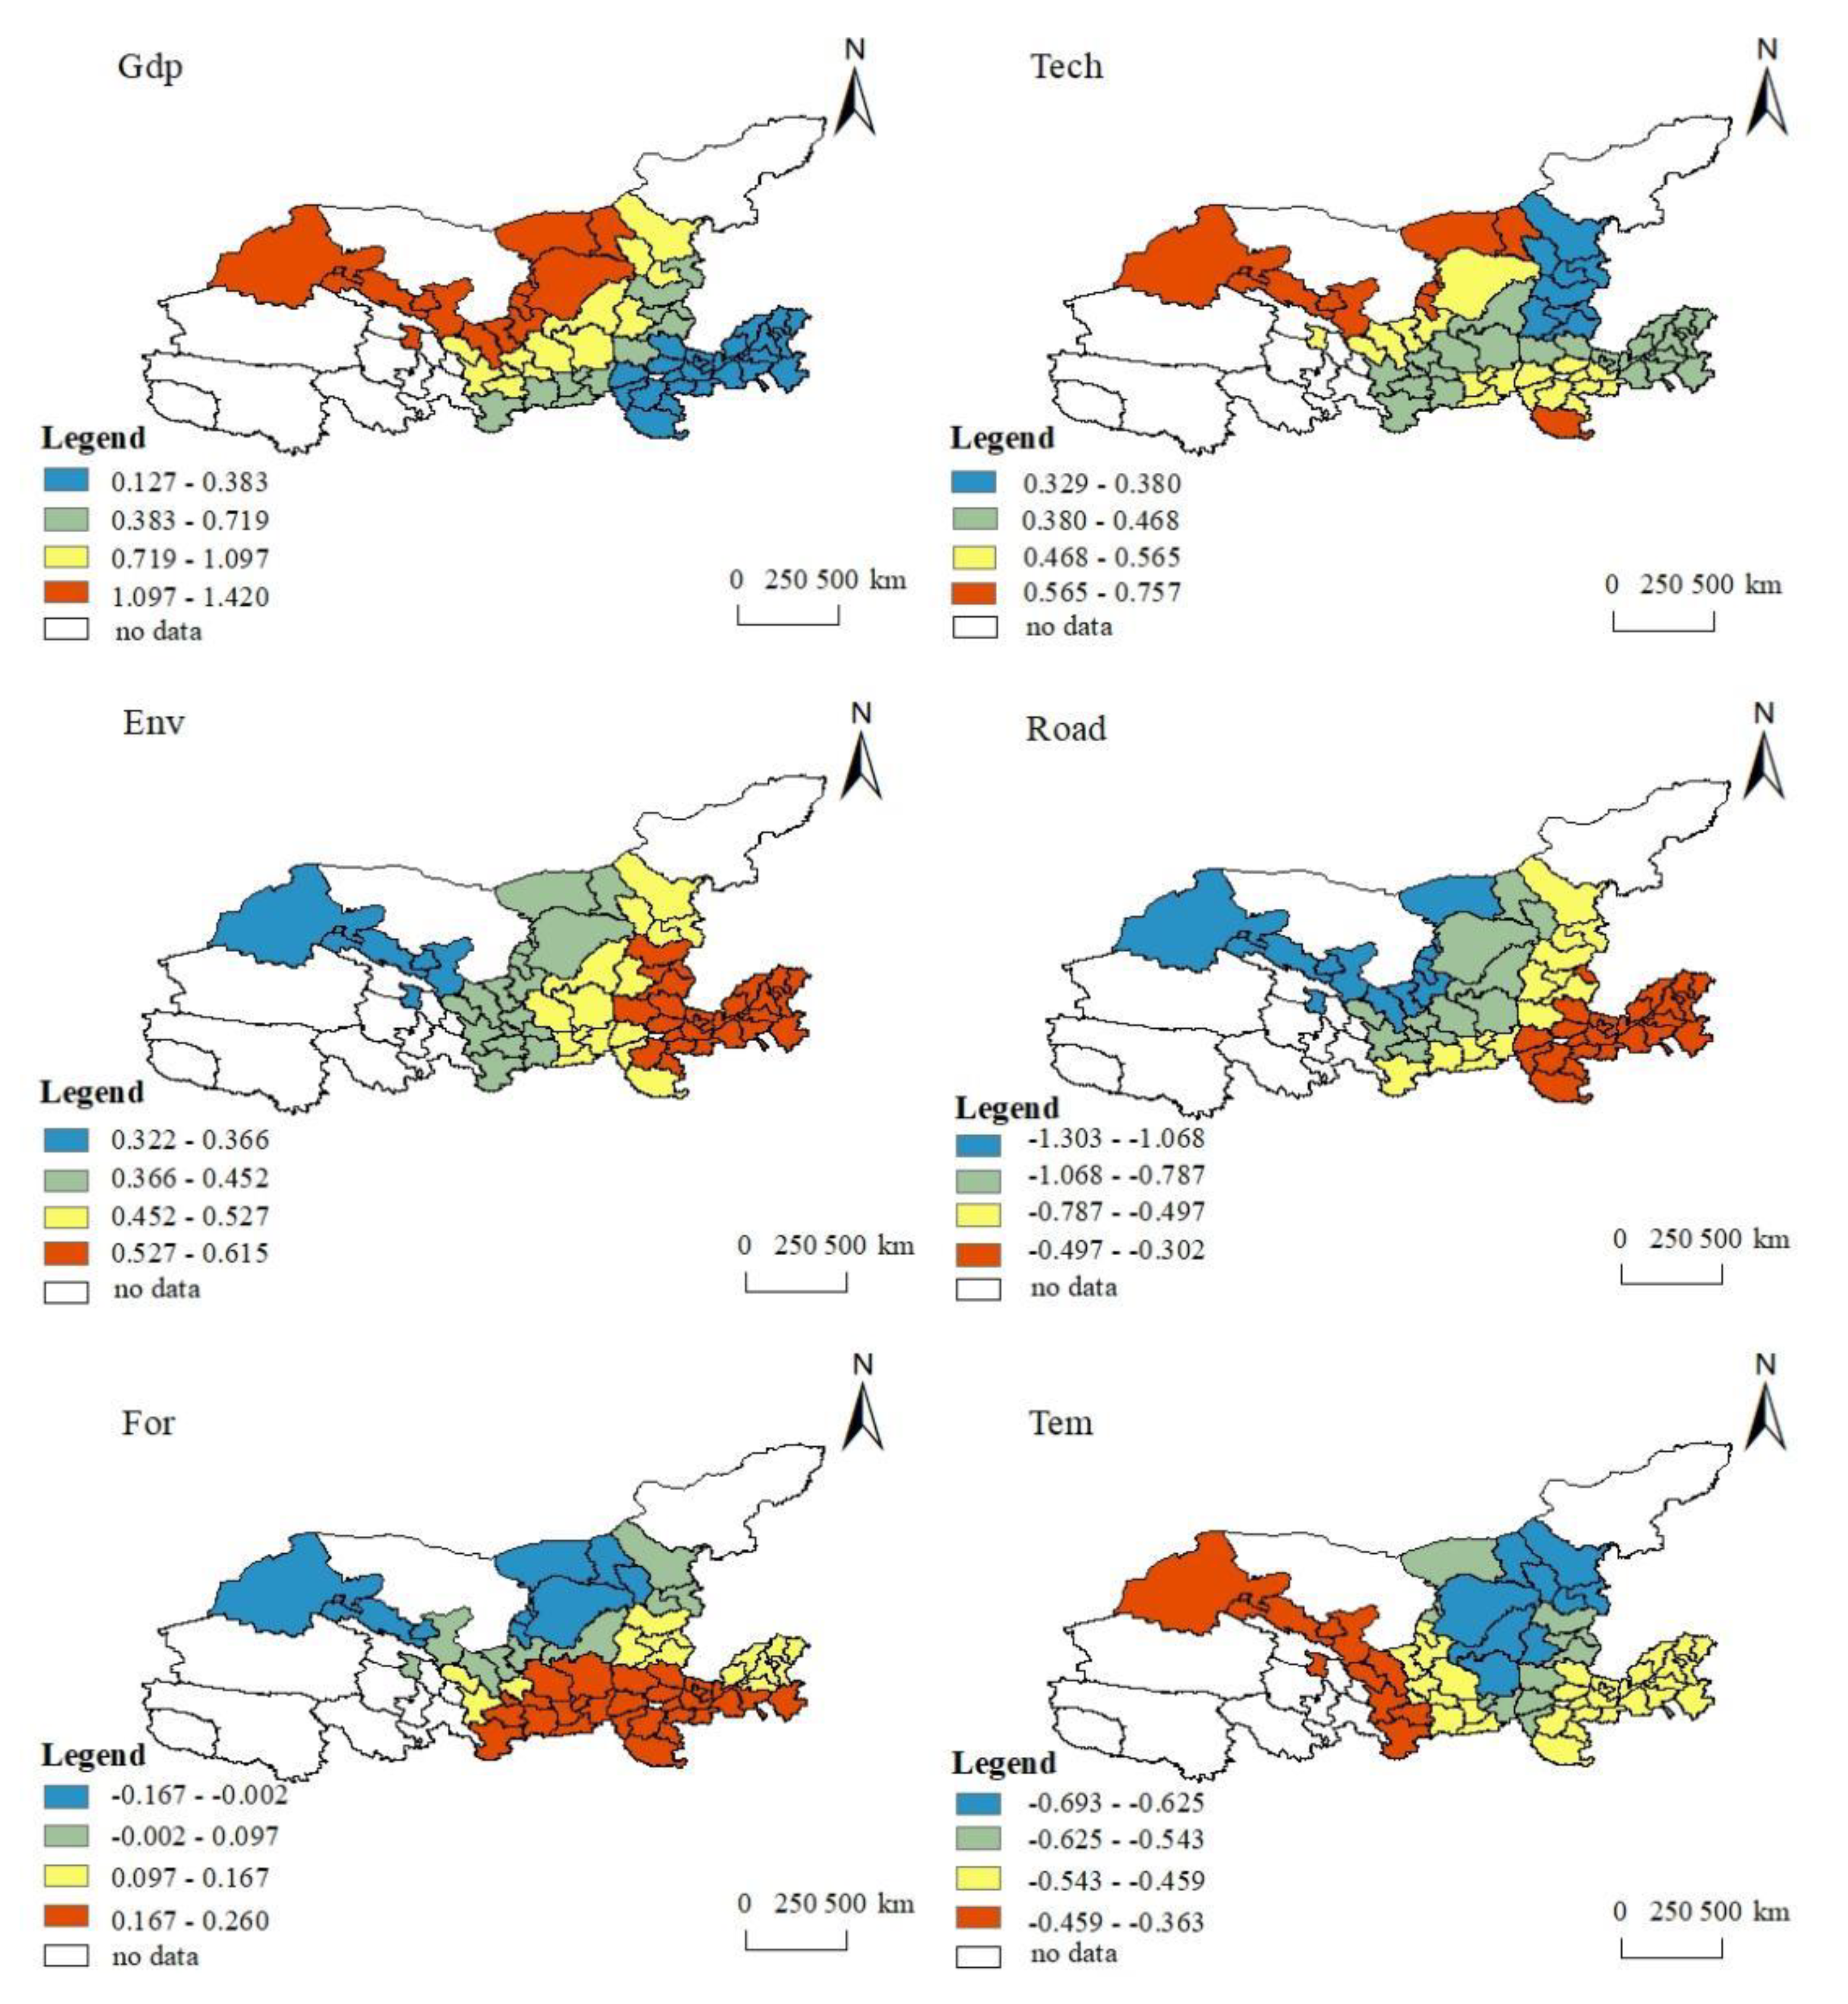
3.5.3. The Spatial Differentiation Characteristics of the Influencing Factors of Coupling Coordination Degree
4. Discussion
4.1. Changes in Urbanization, Land Use and ESV
4.2. The State of Coupling and Coordination between Urbanization and ESV
4.3. Key Factors of Coupling Mechanism
4.4. Limitations and Implications
5. Conclusions
- From 1995 to 2018, the urbanization level of the urban agglomerations in the Yellow River Basin was continuously improved, and the development characteristics changed from the initial urbanization stage to an intermediate stage characterized by social urbanization and economic development. During this period, the ESV of the Yellow River Basin was greatly improved, mainly due to the overall increase in the value of forests, water and wetlands, which offset the expansion of construction land and the decrease in ESV of farmland and grassland. Overall, regulation services occupied a dominant position. Although the spatial distribution of regional values in the Yellow River Basin did not change significantly in the study period, the spatial distribution pattern was obvious, due to differences in the land-use structure and geographic regions.
- From 1995 to 2018, the degree of coupling and coordination improved significantly. Mildly coupled coordination gradually increased, severe imbalance types tended to disappear and coupling subtypes developed from lagging urbanization to ESV backward and synchronized types. However, overall, there was still a low-level coupling and coordination process, and there were obvious regional differences, showing the emergence of boundaries between physical geographical conditions and administrative divisions. Especially in the lower reaches of Henan, Shandong, other regions and most of the resource-based cities in Central China, the degree of coupling was significantly lower. Therefore, we should be guided by high-quality coordination, divide functional areas for different levels of coordination and implement different strategies.
- In addition, factors such as economic growth, technological development, environmental regulations and the proportion of forest land had positive and belt-like alienation characteristics for the coupling and coordination of the two, and infrastructure and temperature showed negative driving characteristics. Therefore, the Yellow River Basin should uphold the characteristics of basin integrity and differentiation, comprehensively coordinate various driving factors, create regional coordinated planning and coordinated governance, and promote the high-quality development of the coordinated relationship between urbanization and ESV.
Author Contributions
Funding
Institutional Review Board Statement
Informed Consent Statement
Data Availability Statement
Conflicts of Interest
References
- Daily, G.C. Nature’s Services: Societal Dependence on Natural Ecosystems; Island Press: Washington, DC, USA, 1997; pp. 49–68. [Google Scholar]
- Costanza, R.; Arge, R.; de Groot, R.; Farber, S.; Grasso, M.; Hannon, B.; Limburg, K.; Naeem, S.; O’Neill, R.V.; Paruelo, J.; et al. The value of the world’s ecosystem services and natural capital. Nature 1997, 387, 253–260. [Google Scholar] [CrossRef]
- MEA Millennium Ecosystem Assessment. People and Ecosystems: A Framework for Assessment and Action; Island Press: Washington, DC, USA, 2003. [Google Scholar]
- MEA Millennium Ecosystem Assessment. Ecosystems and Human Well-Being: Current State and Trends; Island Press: Washington, DC, USA, 2005; p. 137. [Google Scholar]
- Ellis, E.C.; Ramankutty, N. Putting people in the map: Anthropogenic biomes of the world. Front. Ecol. Environ. 2008, 6, 439–447. [Google Scholar] [CrossRef] [Green Version]
- IBPES: Secretariat of the Convention on Biological Diversity (2020) Global Biodiversity Outlook 5. Montreal. Available online: https://www.cbd.int/gbo5 (accessed on 8 July 2021).
- Ostrom, E. A general framework for analyzing sustainability of social-ecological systems. Science 2009, 325, 419–422. [Google Scholar] [CrossRef] [PubMed]
- Chen, W.X.; Zeng, J.; Zhong, M.X.; Pan, S.P. Coupling Analysis of Ecosystem Services Value and Economic Development in the Yangtze River Economic Belt: A Case Study in Hunan Province, China. Remote Sens. 2021, 13, 1552. [Google Scholar] [CrossRef]
- Song, W.; Deng, X.Z. Land-use/land-cover change and ecosystem service provision in China. Sci. Total Environ. 2017, 576, 705–719. [Google Scholar] [CrossRef] [PubMed]
- de Groot, R.S.; Alkemade, R.; Braat, L.; Hein, L.; Willemen, L. Challenges in integrating the concept of ecosystem services and values in landscape planning, management and decision making. Ecol. Complex. 2009, 7, 260–272. [Google Scholar] [CrossRef]
- Fisher, B.; Turner, R.K.; Morling, P. Defining and classifying ecosystem services for decision making. Ecol. Econ. 2008, 68, 643–653. [Google Scholar] [CrossRef] [Green Version]
- Kremen, C. Managing ecosystem services: What do we need to know about their ecology? Ecol. Lett. 2005, 8, 468–479. [Google Scholar] [CrossRef] [PubMed]
- Xie, G.D.; Zhen, L.; LU, C.X.; Xiao, Y.; Chen, C. Expert Knowledge Based Valuation Method of Ecosystem Services in China. J. Nat. Resour. 2008, 23, 911–919. [Google Scholar] [CrossRef]
- Li, Y.F.; Zhan, J.Y.; Liu, Y.; Zhang, F.; Zhang, M.L. Response of ecosystem services to land use and cover change: A case study in Chengdu City. Resour. Conserv. Recycl. 2018, 132, 291–300. [Google Scholar] [CrossRef]
- Wang, Y.H.; Dai, E.F.; Yin, L.; Ma, L. Land use/land cover change and the effects on ecosystem services in the Hengduan Mountain region, China. Ecosyst. Serv. 2018, 34, 55–67. [Google Scholar] [CrossRef]
- Ouyang, Z.Y.; Zheng, H.; Xiao, Y.; Polasky, S.; Daily, G.C. Improvements in ecosystem services from investments in natural capital. Science 2016, 352, 1455–1459. [Google Scholar] [CrossRef] [PubMed]
- Capriolo, A.; Boschetto, R.G.; Mascolo, R.A.; Balbi, S.; Villa, F. Biophysical and economic assessment of four ecosystem services for natural capital accounting in Italy. Ecosyst. Serv. 2020, 46, 101207. [Google Scholar] [CrossRef]
- Zhang, H.J.; Gao, Y.; Hua, Y.W.; Zhang, Y.; Liu, K. Assessing and mapping recreationists’ perceived social values for ecosystem services in the Qinling Mountains, China. Ecosyst. Serv. 2019, 39, 101006. [Google Scholar] [CrossRef]
- Bagstad, K.J.; Semmens, D.J.; Waage, S.; Winthrop, R. A comparative assessment of decision-support tools for ecosystem services quantification and valuation. Ecosyst. Serv. 2013, 5, 27–39. [Google Scholar] [CrossRef]
- Braat, L.C.; de Groot, R. The ecosystem services agenda: Bridging the worlds of natural science and economics, conservation and development, and public and private policy. Ecosyst. Serv. 2012, 1, 4–15. [Google Scholar] [CrossRef] [Green Version]
- Long, H.L.; Liu, Y.Q.; Hou, X.G.; Li, T.T.; Li, Y.R. Effects of land use transitions due to rapid urbanization on ecosystem services: Implications for urban planning in the new developing area of China. Habitat Int. 2014, 44, 536–544. [Google Scholar] [CrossRef]
- Zare, M.; Panagopoulos, T.; Loures, L. Simulating the impacts of future land use change on soil erosion in the Kasilian watershed, Iran. Land Use Policy 2017, 67, 558–572. [Google Scholar] [CrossRef]
- Baral, H.; Keenan, R.J.; Sharma, S.K.; Stork, N.E.; Kasel, S. Economic evaluation of ecosystem goods and services under different landscape management scenarios. Land Use Policy 2014, 39, 54–64. [Google Scholar] [CrossRef]
- Schmidt, J.P.; Moore, R.; Alber, M. Integrating ecosystem services and local government finances into land use planning: A case study from coastal Georgia. Landsc. Urban Plan. 2014, 122, 56–67. [Google Scholar] [CrossRef]
- Zhou, D.Y.; Tian, Y.Y.; Jiang, G.H. Spatio-temporal investigation of the interactive relationship between urbanization and ecosystem services: Case study of the Jingjinji urban agglomeration, China. Ecol. Indic. 2018, 95, 152–164. [Google Scholar] [CrossRef]
- Grimm, N.B.; Faeth, S.H.; Golubiewski, N.E.; Redman, C.L.; Wu, J.G.; Bai, X.M.; Briggs, J.M. Global change and the ecology of cities. Science 2008, 319, 756–760. [Google Scholar] [CrossRef] [PubMed] [Green Version]
- Tian, Y.Y.; Zhou, D.Y.; Jiang, G.H. Conflict or Coordination? Multiscale assessment of the spatio-temporal coupling relationship between urbanization and ecosystem services: The case of the Jingjinji Region, China. Ecol. Indic. 2020, 117. [Google Scholar] [CrossRef]
- Andrade-Núñez, M.J.; Aide, T.M. The Socio-Economic and Environmental Variables Associated with Hotspots of Infrastructure Expansion in South America. Remote Sens. 2020, 12, 116. [Google Scholar] [CrossRef] [Green Version]
- Ai, J.Y.; Feng, L.; Dong, X.W.; Zhu, X.D.; Li, Y.F. Exploring coupling coordination between urbanization and ecosystem quality (1985–2010): A case study from Lianyungang city, China. Front. Earth Sci. 2016, 10, 527–545. [Google Scholar] [CrossRef]
- Liu, M.; Xu, Y.Y.; Hu, Y.M.; Li, C.L.; Sun, F.Y.; Chen, T. A Century of the Evolution of the Urban Area in Shenyang, China. PLoS ONE 2014, 9, e098847. [Google Scholar] [CrossRef] [PubMed]
- Du, L.S.; Liu, H.Y.; Xu, J.; Zhang, F.C.; Li, J.S. Review of bidirectional effects of urbanization and ecosystem services. Ecol. Sci. 2017, 36, 233–240. [Google Scholar] [CrossRef]
- Yushanjiang, A.; Zhang, F.; Yu, H.Y.; Kung, H.-t. Quantifying the spatial correlations between landscape pattern and ecosystem service value: A case study in Ebinur Lake Basin, Xinjiang, China. Ecol. Eng. 2018, 113, 94–104. [Google Scholar] [CrossRef]
- Breuste, J.; Qureshi, S.; Li, J.X. Applied urban ecology for sustainable urban environment. Urban Ecosyst. 2013, 16, 675–680. [Google Scholar] [CrossRef]
- Messerli, B.; Grosjean, M.; Hofer, T.; Núñez, L.; Pfister, C. From nature-dominated to human-dominated environmental changes. Quat. Sci. Rev. 2000, 19, 459–479. [Google Scholar] [CrossRef]
- Yuan, Y.J.; Chen, D.X.; Wu, S.H.; Mo, L.J.; Tong, G.J.; Yan, D.H. Urban sprawl decreases the value of ecosystem services and intensifies the supply scarcity of ecosystem services in China. Sci. Total Environ. 2019, 697, 134170. [Google Scholar] [CrossRef] [PubMed]
- Liu, W.; Zhan, J.Y.; Zhao, F.; Yan, H.M.; Zhang, F.; Wei, X.Q. Impacts of urbanization-induced land-use changes on ecosystem services: A case study of the Pearl River Delta Metropolitan Region, China. Ecol. Indic. 2019, 98, 228–238. [Google Scholar] [CrossRef]
- Zhang, Y.S.; Lu, X.; Liu, B.Y.; Wu, D.T.; Fu, G.; Zhao, Y.T.; Sun, P.L. Spatial relationships between ecosystem services and socioecological drivers across a large-scale region: A case study in the Yellow River Basin. Sci. Total Environ. 2021, 766, 142480. [Google Scholar] [CrossRef] [PubMed]
- Peng, J.; Tian, L.; Liu, Y.X.; Zhao, M.Y.; Hu, Y.N.; Wu, J.S. Ecosystem services response to urbanization in metropolitan areas: Thresholds identification. Sci. Total Environ. 2017, 607–608, 706–714. [Google Scholar] [CrossRef]
- Vieira, T.A.; Panagopoulos, T. Urban Forestry in Brazilian Anazonia. Sustainability 2020, 12, 3235. [Google Scholar] [CrossRef] [Green Version]
- Avtar, R.; Tripathi, S.; Aggarwal, A.K.; Kumar, P. Population–Urbanization-Energy Nexus: A Review. Resources 2019, 8, 136. [Google Scholar] [CrossRef] [Green Version]
- Luo, Y.; Sun, W.Z.; Yang, K.; Zhao, L. China urbanization process induced vegetation degradation and improvement in recent 20 years. Cities 2021, 114, 103207. [Google Scholar] [CrossRef]
- Fang, C.L.; Yu, D.L. Urban agglomeration: An evolving concept of an emerging phenomenon. Landsc. Urban Plan. 2017, 162, 126–136. [Google Scholar] [CrossRef]
- Fang, C.L. Important progress and future direction of studies on China’s urban agglomerations. J. Geogr. Sci. 2015, 25, 1003–1024. [Google Scholar] [CrossRef] [Green Version]
- Shen, Y.; Zhang, L.P.; Fang, X.; Ji, H.Y.; Li, X.; Zhao, Z.W. Spatiotemporal patterns of recent PM2.5 concentrations over typical urban agglomerations in China. Sci. Total Environ. 2019, 655, 13–26. [Google Scholar] [CrossRef]
- Liu, G.Y.; Yang, Q.; Huang, J.Y. The Change Characteristics and Influence Factors of Ecosystem Services Valuation of the Yellow River Basin from 2000 to 2015. Chin. J. Environ. Manag. 2020, 12, 90–97. [Google Scholar] [CrossRef]
- Zhou, D.; Xu, J.C.; Lin, Z.L. Conflict or coordination? Assessing land use multi-functionalization using production-living-ecology analysis. Sci. Total Environ. 2017, 577, 136–147. [Google Scholar] [CrossRef]
- Li, J.S.; Sun, W.; Li, M.Y.; Meng, L.L. Coupling coordination degree of production, living and ecological spaces and its influencing factors in the Yellow River Basin. J. Clean. Prod. 2021, 298, 126803. [Google Scholar] [CrossRef]
- Song, Y.Y.; Xue, D.Q.; Xia, S.Y.; Mi, W.B. Change characteristics and formation mechanism of the territorial spatial pattern in the Yellow River Basin from 1980 to 2018, China. Geogr. Res. 2021, 40, 1445–1463. [Google Scholar] [CrossRef]
- Xie, G.D.; Xiao, Y.; Zhen, L.; Lu, C.X. Study on ecosystem services value of food production in China. Chin. J. Eco-Agric. 2005, 13, 10–13. [Google Scholar] [CrossRef]
- Xie, G.D.; Zhang, C.X.; Zhang, L.M.; Chen, W.H.; Li, S.M. Improvement of the Evaluation Method for Ecosystem Service Value Based on Per Unit Area. J. Nat. Resour. 2015, 30, 1243–1254. [Google Scholar] [CrossRef]
- Xu, Z.H.; Wei, H.J.; Fan, W.G.; Wang, X.C.; Huang, B.L.; Lu, N.C.; Ren, J.H.; Dong, X.B. Energy modeling simulation of changes in ecosystem services before and after the implementation of a Grain- for-Green Program on the Loess Plateau: A case study of the Zhifanggou valley in Ansai county, Shaanxi province, China. Ecosyst. Serv. 2018, 31, 32–43. [Google Scholar] [CrossRef]
- Geng, T.W.; Chen, H.; Zhang, H.; Shi, Q.Q.; Liu, D. Spatiotemporal evolution of land ecosystem service value and its influencing factors in Shaanxi province based on GWR. J. Nat. Resour. 2020, 35, 1714–1727. [Google Scholar] [CrossRef]
- Zheng, J.J.; Shao, X.F.; Liu, W.; Kong, J.; Zuo, G.S. The impact of the pilot program on industrial structure upgrading in low-carbon cities. J. Clean. Prod. 2021, 290. [Google Scholar] [CrossRef]
- Zhao, X.; Sun, B.W. The influence of Chinese environmental regulation on corporation innovation and competitiveness. J. Clean. Prod. 2016, 112, 1528–1536. [Google Scholar] [CrossRef]
- Tang, L.; Li, J.P.; Yu, L.A.; Qin, D.H. Quantitative evaluation methodology for system coordination development based on distance coordination degree model. Syst. Eng. Theory Pract. 2010, 30, 594–602. [Google Scholar] [CrossRef]
- Liu, H.; Fang, C.; Zhang, X.; Wang, Z.; Bao, C.; Li, F. The effect of natural and anthropogenic factors on haze pollution in Chinese cities: A spatial econometrics approach. J. Clean. Prod. 2017, 165, 323–333. [Google Scholar] [CrossRef]
- Hua, D.; Hao, X.M. Spatiotemporal change and drivers analysis of desertification in the arid region of northwest China based on Geographic Detector. Environ. Chall. 2021, 4, 100082. [Google Scholar] [CrossRef]
- Kashki, A.; Karami, M.; Zandi, R.; Roki, Z. Evaluation of the effect of geographical parameters on the formation of the land surface temperature by applying OLS and GWR, A case study Shiraz City, Iran. Urban Clim. 2021, 37, 100832. [Google Scholar] [CrossRef]
- Fotheringham, A.S.; Charlton, M.; Brunsdon, C. The geography of parameter space: An investigation of spatial nonstationarity. Int. J. Geogr. Inf. Syst. 1996, 10, 605–627. [Google Scholar] [CrossRef]
- Zhao, J.J.; Liu, Y.; Zhu, Y.K.; Qin, S.L.; Wang, Y.H.; Miao, C.H. Spatiotemporal differentiation and influencing factors of the coupling and coordinated development of new urbanization and ecological environment in the Yellow River Basin. Resour. Sci. 2020, 42, 159–171. [Google Scholar] [CrossRef]
- Brunsdon, C.; Fotheringham, A.S.; Charlton, M.E. A method for exploring spatial nonstationarity. Geogr. Anal. 1996, 28, 281–298. [Google Scholar] [CrossRef]
- Zhang, B.F.; Miao, C.H. Spatiotemporal changes and driving forces of land use in the Yellow River Basin. Resour. Sci. 2020, 42, 460–473. [Google Scholar] [CrossRef]
- Gao, J.X.; Wang, Y.C.; Hou, P.; Wan, H.W.; Zhang, W.G. Temporal and spatial variation characteristics of land surface water area in the Yellow River basin in recent 20 years. J. Hydraul. Eng. 2020, 51, 1157–1164. [Google Scholar] [CrossRef]
- He, Z.H.; Zhu, Y.F.; Qiu, Y.L.; Xu, L.H. Effects of human intervention on the composition and diversity of plant community in Ziwuling area. J. Northwest For. Univ. 2017, 32, 87–95. [Google Scholar]
- Yang, R.; Cao, Y. Rewilding: New ideas for ecological protection and restoration projects of mountains-riversforests-farmlands-lakes-grasslands. Acta Ecol. Sin. 2019, 39, 8763–8770. [Google Scholar]
- Tammi, I.; Mustajärvi, K.; Rasinmäki, J. Integrating spatial valuation of ecosystem services into regional planning and development. Ecosyst. Serv. 2016, 26, 329–344. [Google Scholar] [CrossRef] [Green Version]
- Kremen, Claire. Reframing the land-sparing/land-sharing debate for biodiversity conservation. Ann. N. Y. Acad. Sci. 2015, 1355, 52–76. [Google Scholar] [CrossRef]
- Hendershot, J.N.; Smith, J.R.; Anderson, C.B.; Letten, A.D.; Frishkoff, L.O.; Zook, J.R.; Fukami, T.; Daily, G.C. Intensive farming drives long-term shifts in avian community composition. Nature 2020, 579, 393–396. [Google Scholar] [CrossRef] [PubMed]
- Wan, L.L.; Ye, X.Y.; Lee, J.; Lu, X.Q.; Zheng, L.; Wu, K.Y. Effects of urbanization on ecosystem service values in a mineral resource-based city. Habitat Int. 2015, 46, 54–63. [Google Scholar] [CrossRef]
- Li, H.; Lo, K.; Zhang, P.Y. Population Shrinkage in Resource-dependent Cities in China: Processes, Patterns and Drivers. Chin. Geogr. Sci. 2020, 30, 1–15. [Google Scholar] [CrossRef] [Green Version]
- Xing, L.; Zhu, Y.M.; Wang, J.P. Spatial spillover effects of urbanization on ecosystem services value in Chinese cities. Ecol. Indic. 2021, 121, 107028. [Google Scholar] [CrossRef]
- Ji, W.; Liu, H.J.; Gao, J.X.; Ma, H.; Song, T.; Gao, Y.N.; Feng, C.Y. Spatial-Temporal Variations of Ecological Quality in the Yellow River Basin. Res. Environ. Sci. 2021, 34, 1700–1709. [Google Scholar] [CrossRef]
- Dallimer, M.; Tang, Z.Y.; Bibby, P.R.; Brindley, P.; Gaston, K.J.; Davies, Z.G. Temporal changes in greenspace in a highly urbanized region. Biol. Lett. 2011, 7, 763–766. [Google Scholar] [CrossRef]
- Zhou, D.C.; Zhao, S.Q.; Liu, S.G.; Zhang, L.X. Spatiotemporal trends of terrestrial vegetation activity along the urban development intensity gradient in China’s 32 major cities. Sci. Total Environ. 2014, 488–489, 136–145. [Google Scholar] [CrossRef]
- Nichiforel, L.; Duduman, G.; Scriban, R.E.; Popa, B.; Barnoaiea, I.; Drăgoi, M. Forest ecosystem services in Romania: Orchestrating regulatory and voluntary planning documents. Ecosyst. Serv. 2021, 49, 101276. [Google Scholar] [CrossRef]
- Du, H.Y.; Cai, W.B.; Xu, Y.Q.; Wang, Z.B.; Wang, Y.Y.; Cai, Y.L. Quantifying the cool island effects of urban green spaces using remote sensing data. Urban For. Urban Green. 2017, 27, 24–31. [Google Scholar] [CrossRef]
- Brondizio, E.S.; Settele, J.; Díaz, S.; Ngo, H.T. IPBES: Global Assessment Report on Biodiversity and Ecosystem Services of the Intergovernmental Science-Policy Platform on Biodiversity and Ecosystem Services; IPBES Secretariat: Bonn, Germany, 2019; Available online: https://ipbes.net/global-assessment (accessed on 8 July 2021).
- Sayer, J.; Terry Sunderland, T.; Ghazoul, J.; Pfund, J.L.; Sheil, D.; Meijaard, E.; Venter, M.; Boedhihartono, A.K.; Day, M.; Garcia, C.; et al. Ten principles for a landscape approach to reconciling agriculture, conservation, and other competing land uses. Proc. Natl. Acad. Sci. USA 2013, 110, 8349–8356. [Google Scholar] [CrossRef] [Green Version]
- Zhao, S.Q.; Liu, S.G.; Zhou, D.C. Prevalent vegetation growth enhancement in urban environment. Proc. Natl. Acad. Sci. USA 2016, 113, 6313–6318. [Google Scholar] [CrossRef] [PubMed] [Green Version]
- Zhong, Q.Y.; Ma, J.; Zhao, B.; Wang, X.X.; Zong, J.M.; Xiao, X.M. Assessing spatial- temporal dynamics of urban expansion, vegetation greenness and photosynthesis in megacity Shanghai, China during 2000–2016. Remote Sens. Environ. 2019, 233, 111374. [Google Scholar] [CrossRef]
- Xiao, X.D.; Dong, L.; Yan, H.N.; Yang, N.; Xiong, Y.M. The influence of the spatial characteristics of urban green space on the urban heat island effect in Suzhou Industrial Park. Sustain. Cities Soc. 2018, 40, 428–439. [Google Scholar] [CrossRef]
- Grossi, G.; Trunova, O. Are UN SDGs useful for capturing multiple values of smart city? Cities 2021, 114, 103193. [Google Scholar] [CrossRef]
- Xiong, Y.; Zhang, F.M.; Gong, C.A.; Luo, P. Spatial-temporal Evolvement of Ecosystem Service Value in Hunan Province Based on LUCC. Resour. Environ. Yangtze Basin 2018, 27, 1397–1408. [Google Scholar] [CrossRef]
- Hu, Z.Y.; Wang, S.J.; Bai, X.Y.; Luo, G.J.; Li, Q.; Wu, L.H.; Yang, Y.J.; Tian, S.Q.; Li, C.J.; Deng, Y.H. Changes in ecosystem service values in karst areas of China. Agric. Ecosyst. Environ. 2020, 301, 107026. [Google Scholar] [CrossRef]


| First-Grade Indicator | Weight | Basic Grade Indicator | Unit | Weight |
|---|---|---|---|---|
| Demographic urbanization | 0.114 | Population density | persons/km2 | 0.046 |
| Urban population density | persons/km2 | 0.047 | ||
| Percentage of non-agricultural population | (%) | 0.021 | ||
| Landscape urbanization | 0.251 | Percentage of built-up areas in the total land area | % | 0.070 |
| Number of urban areas per 10,000 people | km2 | 0.079 | ||
| Paved road area per capita | m2 | 0.037 | ||
| Green area per capita | m2/person | 0.052 | ||
| Green coverage rate of built-up area | % | 0.013 | ||
| Economic urbanization | 0.398 | GDP per capita | CNY | 0.064 |
| The proportion of secondary and tertiary industries in GDP | % | 0.005 | ||
| Gross industrial output value above designated size | 104 CNY | 0.108 | ||
| Total fixed asset investment | 104 CNY | 0.092 | ||
| Local financial revenue per capita | CNY | 0.085 | ||
| Average salary of employees | CNY | 0.043 | ||
| Social urbanization | 0.273 | Total retail sales of consumer goods per capita | CNY | 0.075 |
| Number of primary and middle school students | 104 persons | 0.038 | ||
| Public library collections per capita | volume | 0.032 | ||
| Beds in health care industry per 10,000 people | bed | 0.015 | ||
| Internet users per 10,000 people | persons | 0.077 |
| Variables | Symbol | Variable Description | Unit | |
|---|---|---|---|---|
| Economic factors | Economic Growth | GDP | GDP Growth Rate | % |
| Industrial structure | Ind | The industrial structure upgrade is obtained by the weighted square: Ind = Sn × n, 1 ≤ n ≤ 3, where n represents the proportion of the n-th industrial output value. In terms of economic meaning, the closer the value of Ind is to 1, the lower the level of the industrial structure of the place, and the closer the value of Ind is to 3, the higher the level of industrial structure of the place [53]. | ||
| Educational investment | Edu | Education expenditure as a proportion of fiscal expenditure | % | |
| Government capacity | Gov | Regional fiscal expenditure as a percentage of GDP | % | |
| Social factors | Environmental regulation | Env | The entropy method is used to combine industrial wastewater discharge compliance rate, SO2 removal rate and solid waste comprehensive utilization rate into one indicator to indicate the strength of environmental regulations [54]. Env = ∑ij = Gij × Wij Wij refers to the weight of index j in city i, Gij represents the standardized value of index j in city i, Env is the environmental regulation in city i, which is the sum of all the indicators’ regulation indexes. | |
| Technological innovation | Tech | Number of granted technology patents | pieces | |
| Infrastructure | Road | Actual urban road area at the end of the year | 104 km2 | |
| Total population | Pop | The total population of the city at the end of the year | 104 person | |
| Natural factors | Temperature | Tem | The annual average temperature | ℃ |
| Precipitation | Pre | Average annual precipitation | mm | |
| Terrain relief | Ter | Altitude difference between the highest and lowest points | m | |
| Percentage of woodland | For | Woodland land type area as a proportion of total area | % |
| Coupling Coordination Type | Coordinated Development | Contrast Relationship | Subtype |
|---|---|---|---|
| Severe imbalance (I) | 0 < D ≤ 0.3 | λU − λE > 0.1 | Severely maladjusted ESV hysteresis type (1) |
| |λE − λU| ≤ 0.1 | Severely maladjusted synchronous type (2) | ||
| λE − λU > 0.1 | Severely unbalanced urbanization lagging type (3) | ||
| Mild maladjustment (II) | 0.3 < D ≤ 0.4 | λU − λE > 0.1 | Mild dysregulation ESV hysteresis type (1) |
| |λE − λU| ≤ 0.1 | Mild imbalance and co-loss type (2) | ||
| λE − λU > 0.1 | Mild imbalance and lagging urbanization (3) | ||
| Mild coupling coordination (III) | 0.4 < D ≤ 0.7 | λU − λE > 0.1 | Slightly coupled coordinated ESV hysteresis type (1) |
| |λE − λU| ≤ 0.1 | Lightly coupled, coordinated and synchronized type (2) | ||
| λE − λU > 0.1 | Slightly coupled and coordinated urbanization lagging type (3) | ||
| High-quality coupling and coordination (IV) | D > 0.7 | λU − λE > 0.1 | High-quality coupling and coordination ESV hysteresis type (1) |
| |λE − λU| ≤ 0.1 | High-quality coupling, coordination and synchronization (2) | ||
| λE − λU > 0.1 | High-quality coupling and coordinated urbanization lagging type (3) |
| ESV (CNY 109) | Change Value (109 CNY)/Change Rate (%) | |||||||
|---|---|---|---|---|---|---|---|---|
| Year | 1995 | 2005 | 2015 | 2018 | 1995/2005 | 2005/2015 | 2015/18 | 1995/2018 |
| Farmland | 150.52 | 151.07 | 148.96 | 146.82 | 0.55/0.35 | −2.11/−1.40 | −2.14/−1.44 | −3.70/−2.46 |
| Forestland | 152.38 | 160.95 | 161.18 | 161.39 | 8.58/5.63 | 0.22/0.14 | 0.22/0.13 | 9.02/5.92 |
| Grassland | 418.55 | 403.81 | 398.43 | 398.25 | −14.74/−3.52 | −5.38/−1.33 | −0.18/−0.05 | −20.31/−4.85 |
| Water bodies | 13.87 | 13.41 | 15.67 | 16.97 | −0.46/−3.30 | 2.25/16.79 | 1.31/8.33 | 3.10/22.35 |
| Wetland | 99.87 | 111.95 | 107.33 | 121.04 | 12.08/12.10 | −4.62/−4.13 | 13.71/12.77 | 21.16/21.19 |
| unused land | 7.95 | 7.94 | 7.91 | 7.76 | −0.01/−0.13 | −0.02/−0.26 | −0.15/−1.92 | −0.18/−2.31 |
| Total | 843.14 | 849.13 | 839.48 | 852.23 | 5.99/0.17 | −9.66/−1.14 | 12.75/1.52 | 9.09/1.08 |
| Full Sample | Upstream and Midstream | Downstream | ||||
|---|---|---|---|---|---|---|
| Year | Dit | Basic Type | Dit | Basic Type | Dit | Basic Type |
| 1995 | 0.287 | Severely unbalanced urbanization lagging type | 0.302 | Mild imbalance and lagging urbanization | 0.250 | Severely maladjusted synchronous type |
| 2000 | 0.293 | Severely unbalanced urbanization lagging type | 0.306 | Mild imbalance and lagging urbanization | 0.263 | Severely maladjusted synchronous type |
| 2005 | 0.311 | Mild imbalance and co-loss type | 0.322 | Mild imbalance and lagging urbanization | 0.283 | Severely maladjusted synchronous type |
| 2010 | 0.342 | Mild imbalance and co-loss type | 0.352 | Mild imbalance and lagging urbanization | 0.318 | Mild imbalance and co-loss type |
| 2015 | 0.350 | Mild imbalance and co-loss type | 0.359 | Mild imbalance and lagging urbanization | 0.328 | Mild dysregulation ESV hysteresis type |
| 2018 | 0.386 | Mild imbalance and co-loss type | 0.396 | Mild imbalance and co-loss type | 0.361 | Mild dysregulation ESV hysteresis type |
| Impact Factors | GDP | Ind | Gov | Edu | Tech | Env | Road | Pop | Pre | Tem | Ter | For |
|---|---|---|---|---|---|---|---|---|---|---|---|---|
| q value | 0.677 | 0.320 | 0.170 | 0.139 | 0.578 | 0.625 | 0.678 | 0.435 | 0.185 | 0.517 | 0.051 | 0.459 |
| p value | 0.000 | 0.000 | 0.013 | 0.035 | 0.000 | 0.000 | 0.000 | 0.000 | 0.024 | 0.000 | 0.368 | 0.000 |
| Year | 1995 | 2000 | 2005 | 2010 | 2015 | 2018 |
|---|---|---|---|---|---|---|
| Moran’s I | 0.310 *** | 0.253 *** | 0.261 *** | 0.237 *** | 0.216 *** | 0.186 *** |
| Z-score | 3.937 | 3.324 | 3.359 | 3.106 | 2.859 | 2.510 |
| OLS Model | GWR Model | ||||||||
|---|---|---|---|---|---|---|---|---|---|
| Coefficient | t Value | p Value | VIF | Mean | Std | Min | Med | Max | |
| GDP | 0.496 | 1.839 | 0.066 | 1.068 | 0.710 | 0.411 | 0.127 | 0.634 | 1.420 |
| Tech | 0.485 | 2.587 | 0.010 | 2.923 | 0.491 | 0.099 | 0.329 | 0.458 | 0.757 |
| Env | 0.478 | 4.783 | 0.000 | 2.300 | 0.496 | 0.086 | 0.322 | 0.512 | 0.615 |
| Road | −0.538 | −2.737 | 0.006 | 2.320 | −0.683 | 0.339 | −1.303 | −0.569 | −0.302 |
| For | 0.191 | 2.112 | 0.035 | 1.119 | 0.126 | 0.101 | −0.167 | 0.155 | 0.260 |
| Tem | −0.518 | −4.563 | 0.000 | 1.595 | −0.521 | 0.082 | −0.693 | −0.520 | −0.363 |
| R2 | 0.574 | 0.841 | |||||||
| Adj. R2 | 0.528 | 0.773 | |||||||
| AICc | 143.766 | 151.628 | |||||||
Publisher’s Note: MDPI stays neutral with regard to jurisdictional claims in published maps and institutional affiliations. |
© 2021 by the authors. Licensee MDPI, Basel, Switzerland. This article is an open access article distributed under the terms and conditions of the Creative Commons Attribution (CC BY) license (https://creativecommons.org/licenses/by/4.0/).
Share and Cite
Zhang, K.; Liu, T.; Feng, R.; Zhang, Z.; Liu, K. Coupling Coordination Relationship and Driving Mechanism between Urbanization and Ecosystem Service Value in Large Regions: A Case Study of Urban Agglomeration in Yellow River Basin, China. Int. J. Environ. Res. Public Health 2021, 18, 7836. https://doi.org/10.3390/ijerph18157836
Zhang K, Liu T, Feng R, Zhang Z, Liu K. Coupling Coordination Relationship and Driving Mechanism between Urbanization and Ecosystem Service Value in Large Regions: A Case Study of Urban Agglomeration in Yellow River Basin, China. International Journal of Environmental Research and Public Health. 2021; 18(15):7836. https://doi.org/10.3390/ijerph18157836
Chicago/Turabian StyleZhang, Kaili, Tan Liu, Rongrong Feng, Zhicheng Zhang, and Kang Liu. 2021. "Coupling Coordination Relationship and Driving Mechanism between Urbanization and Ecosystem Service Value in Large Regions: A Case Study of Urban Agglomeration in Yellow River Basin, China" International Journal of Environmental Research and Public Health 18, no. 15: 7836. https://doi.org/10.3390/ijerph18157836
APA StyleZhang, K., Liu, T., Feng, R., Zhang, Z., & Liu, K. (2021). Coupling Coordination Relationship and Driving Mechanism between Urbanization and Ecosystem Service Value in Large Regions: A Case Study of Urban Agglomeration in Yellow River Basin, China. International Journal of Environmental Research and Public Health, 18(15), 7836. https://doi.org/10.3390/ijerph18157836