
Spatio-Temporal Analysis of Influenza-Like Illness and Prediction of Incidence in High-Risk Regions in the United States from 2011 to 2020

Abstract
:1. Introduction
2. Materials and Methods
2.1. Data Resources
2.2. Spatiotemporal Cluster Analysis
2.3. Time-Series Analysis
2.4. Statistical Analysis
3. Results
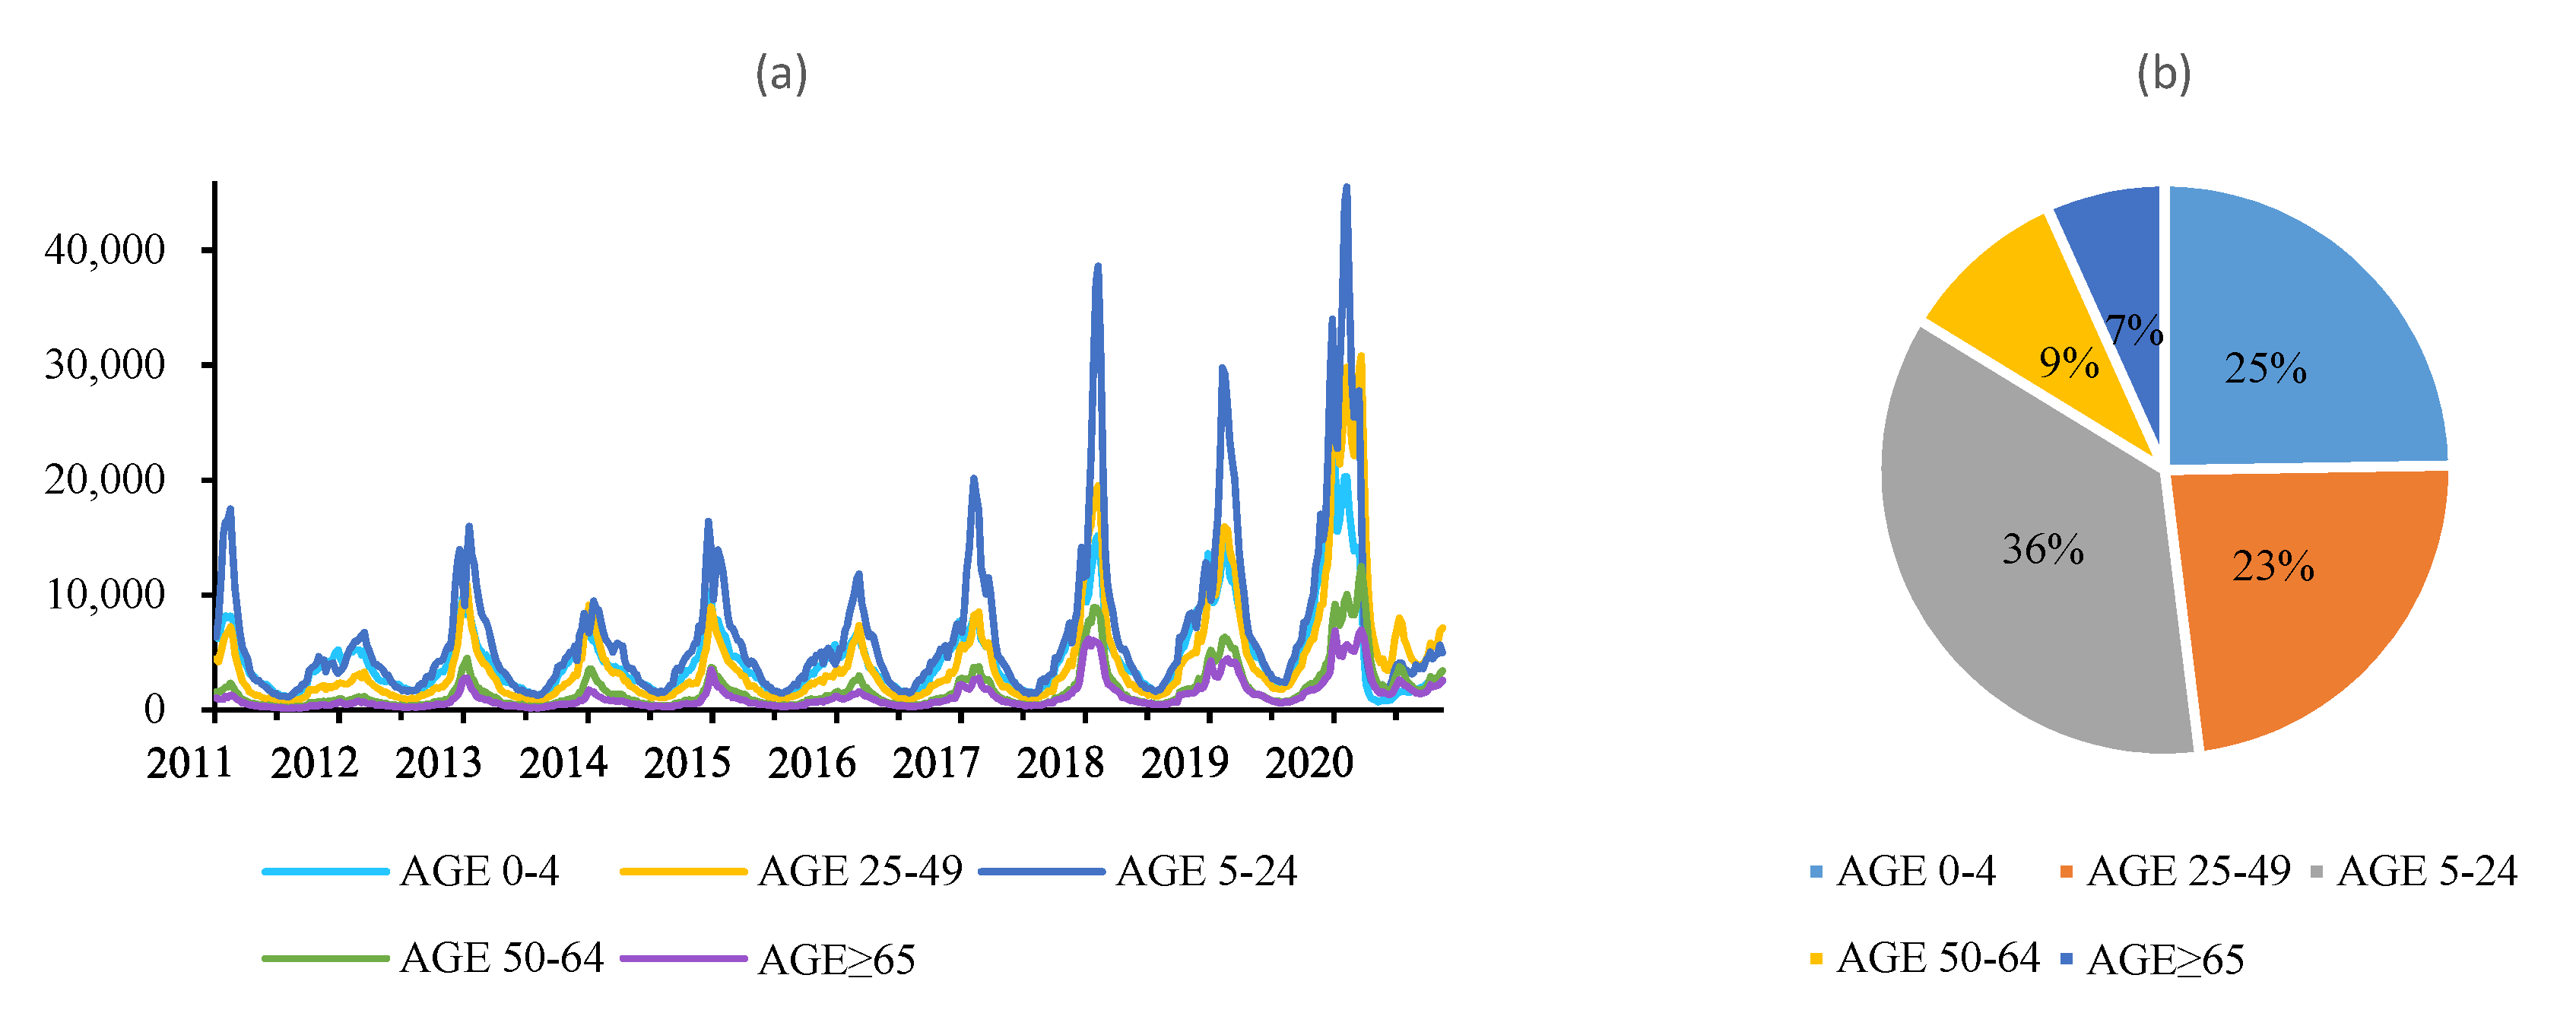
3.1. Epidemiological Analysis
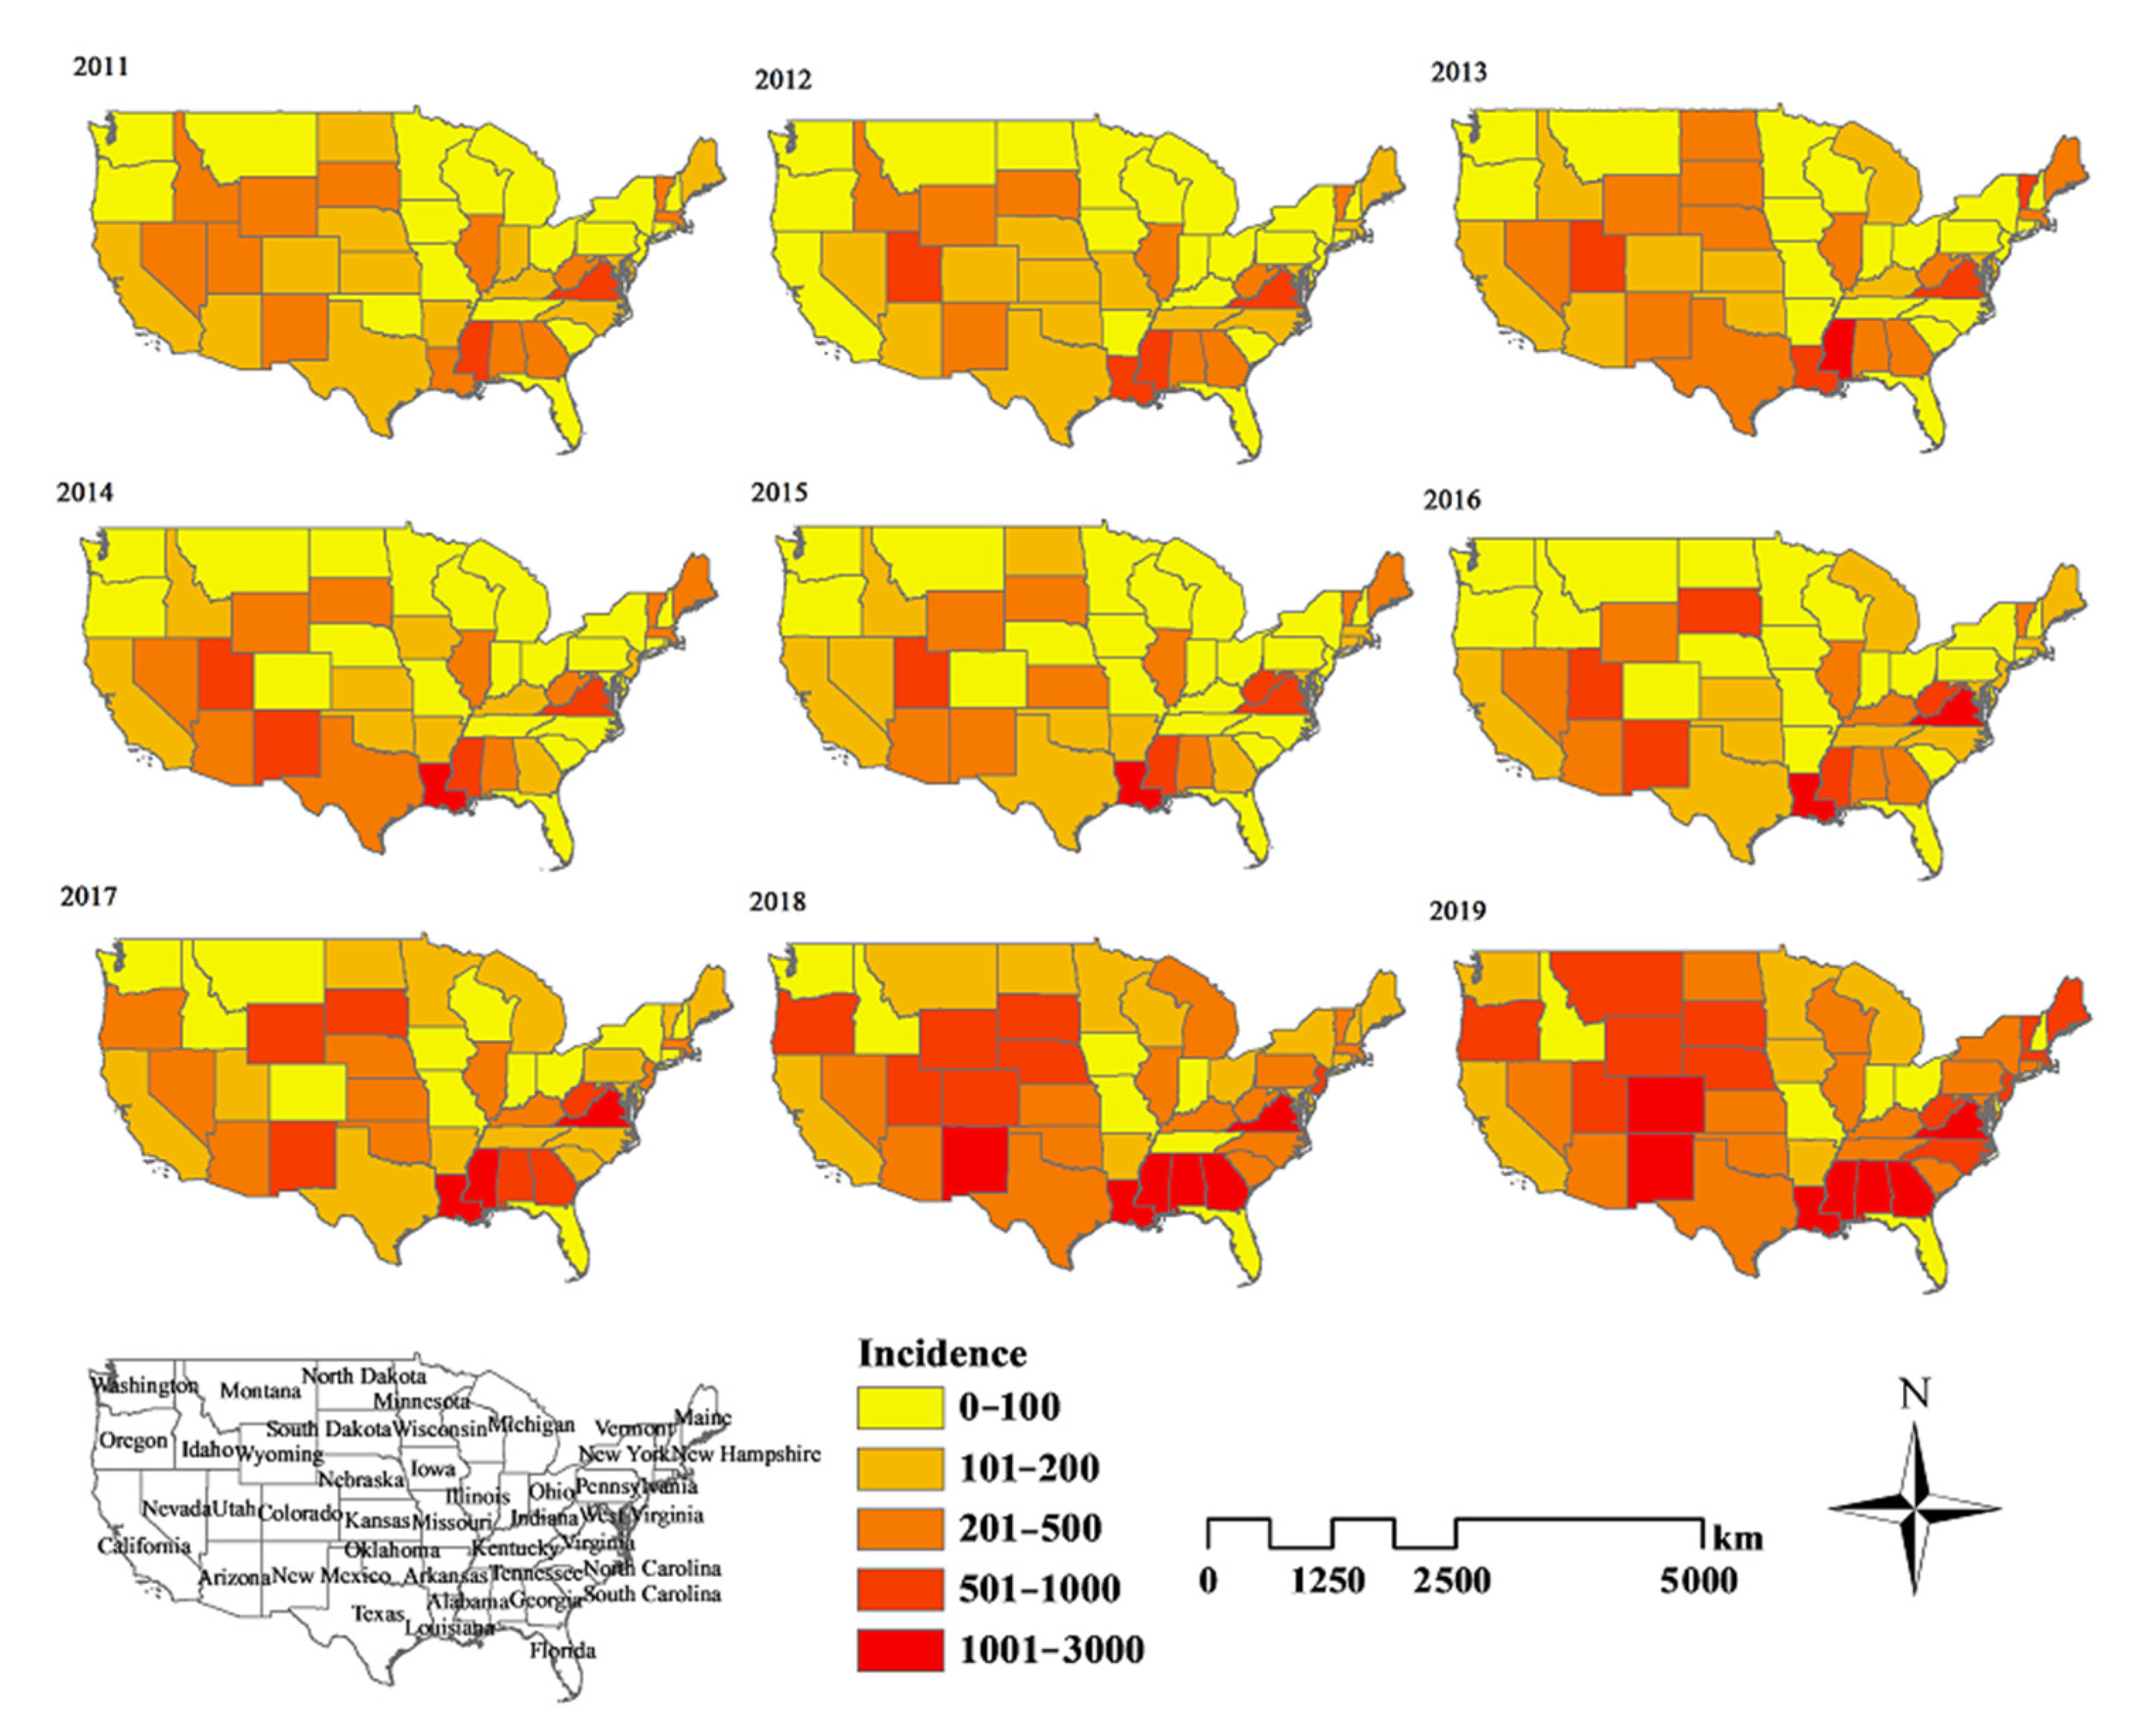
3.2. Spatiotemporal Analysis
3.2.1. Global Spatial Autocorrelation
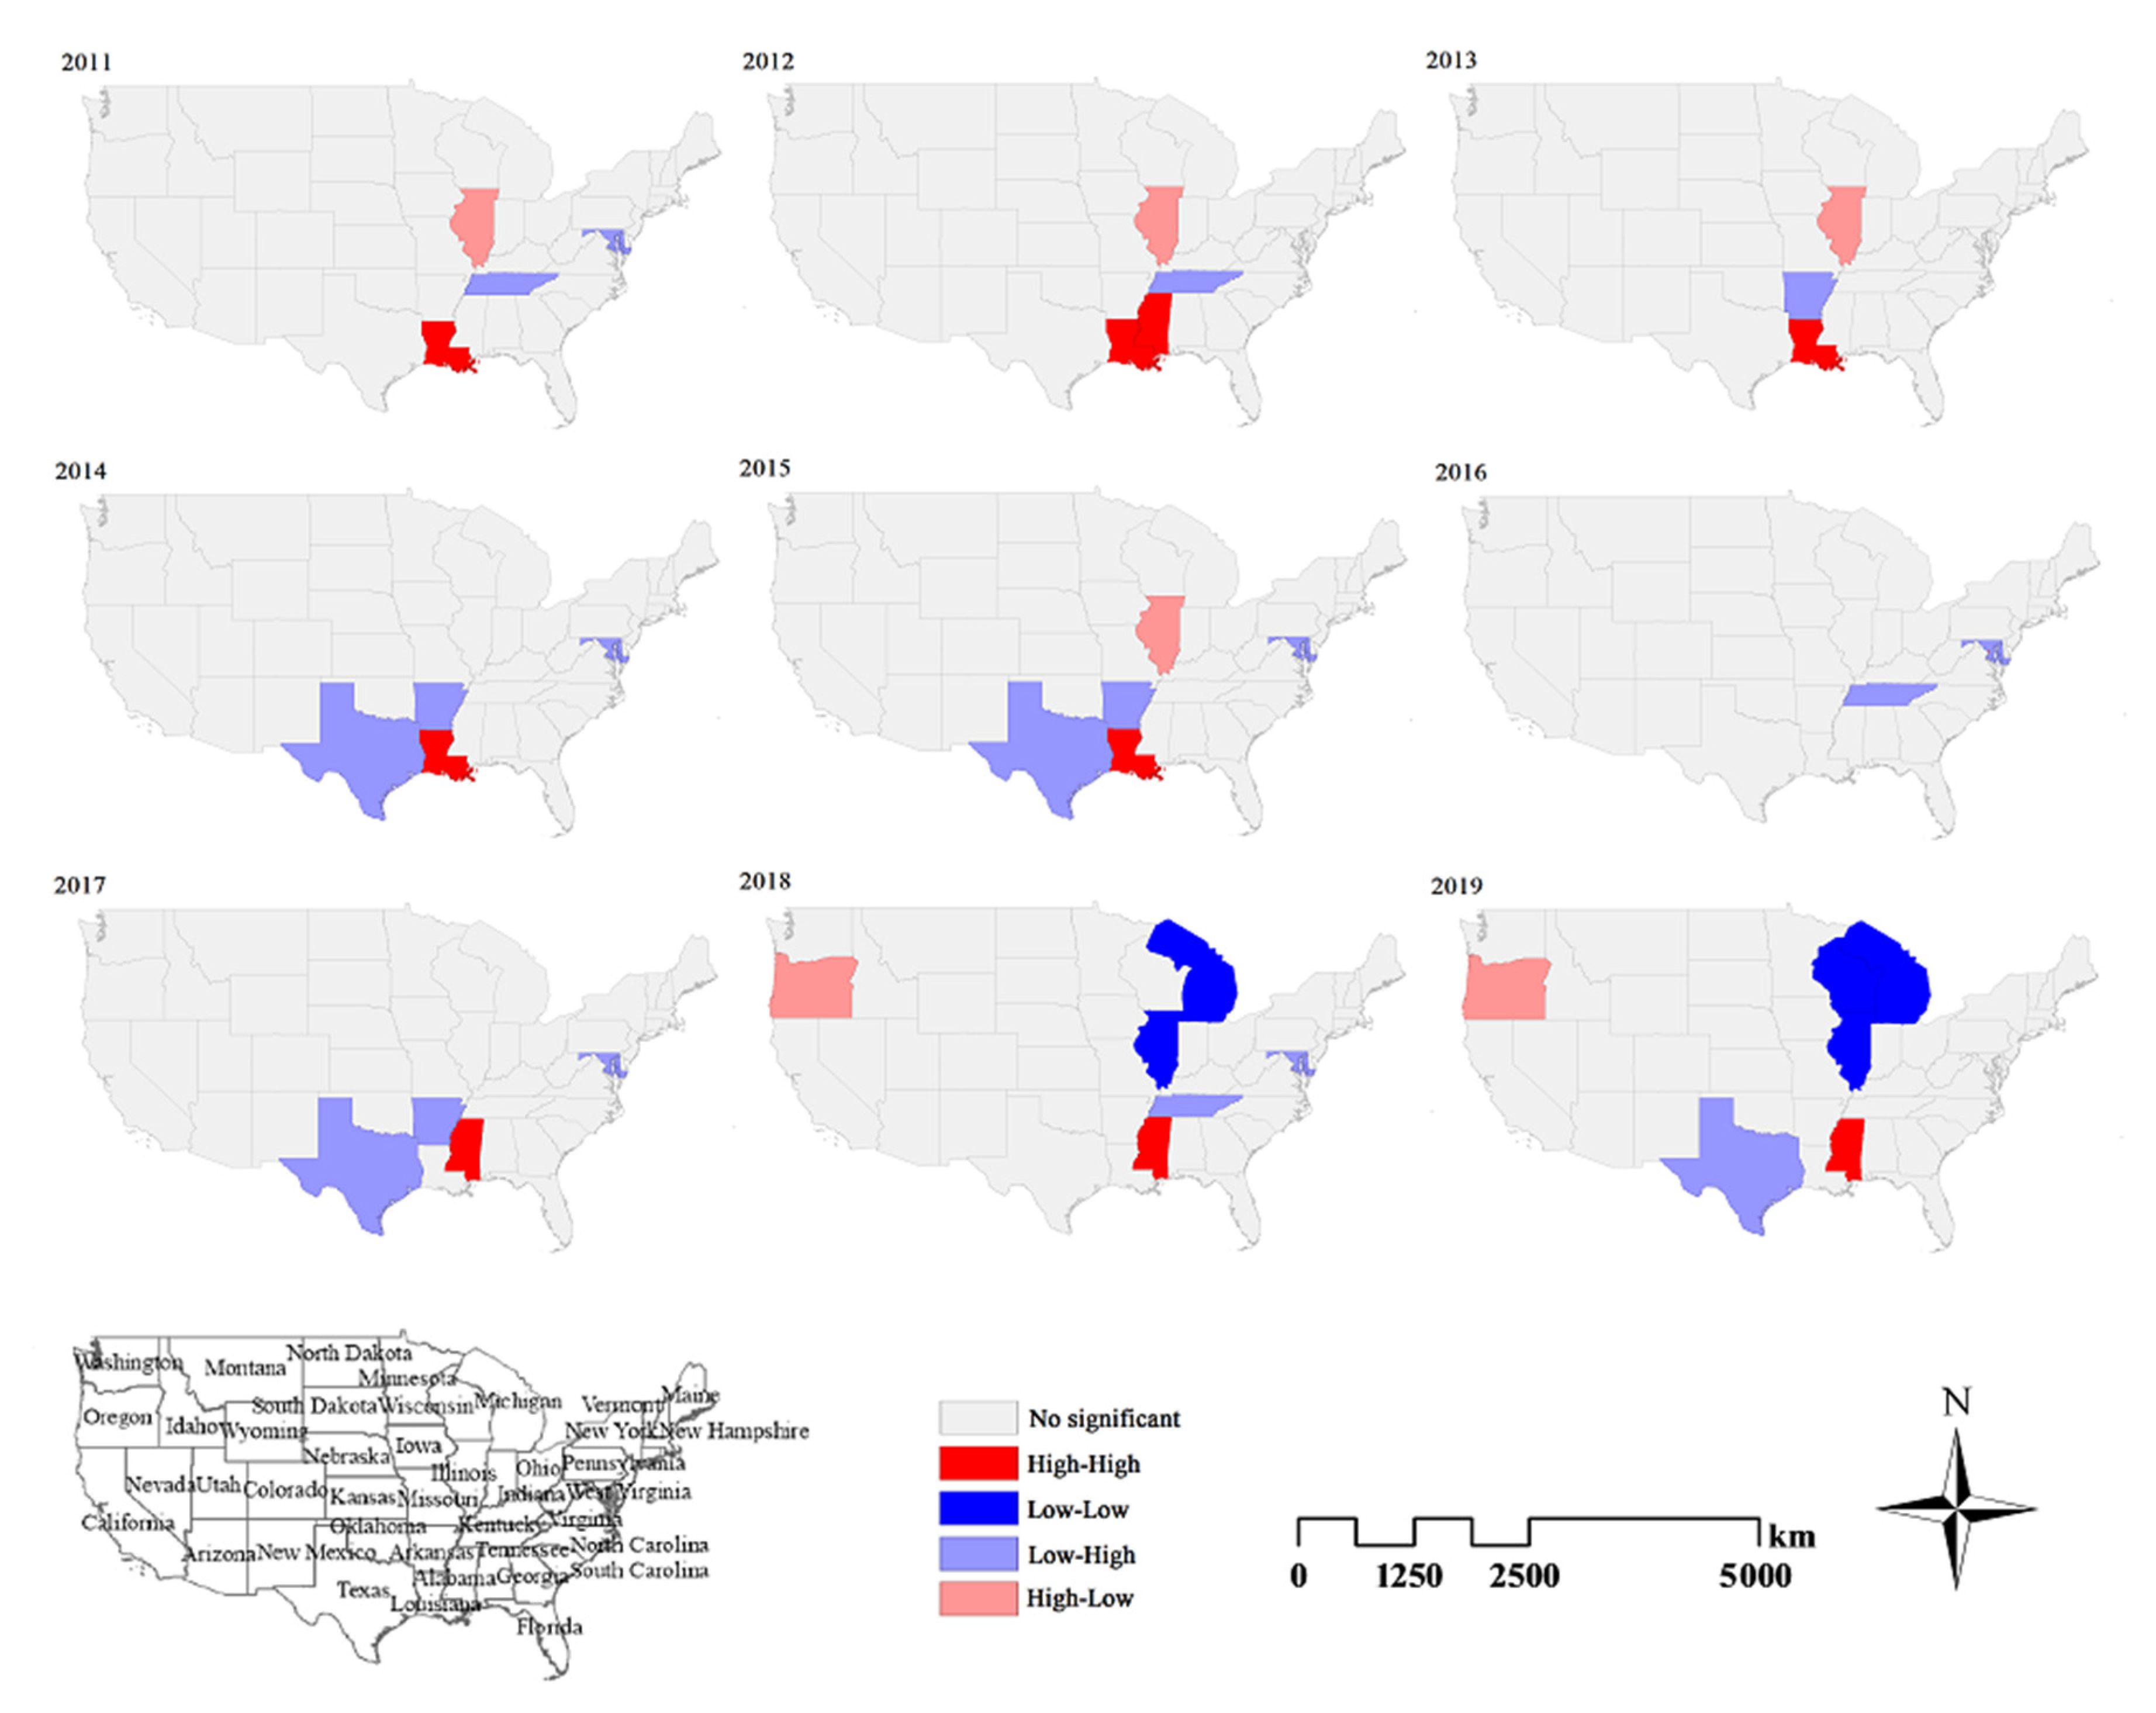
3.2.2. Local Spatial Autocorrelation
3.2.3. Spatiotemporal Cluster Analysis
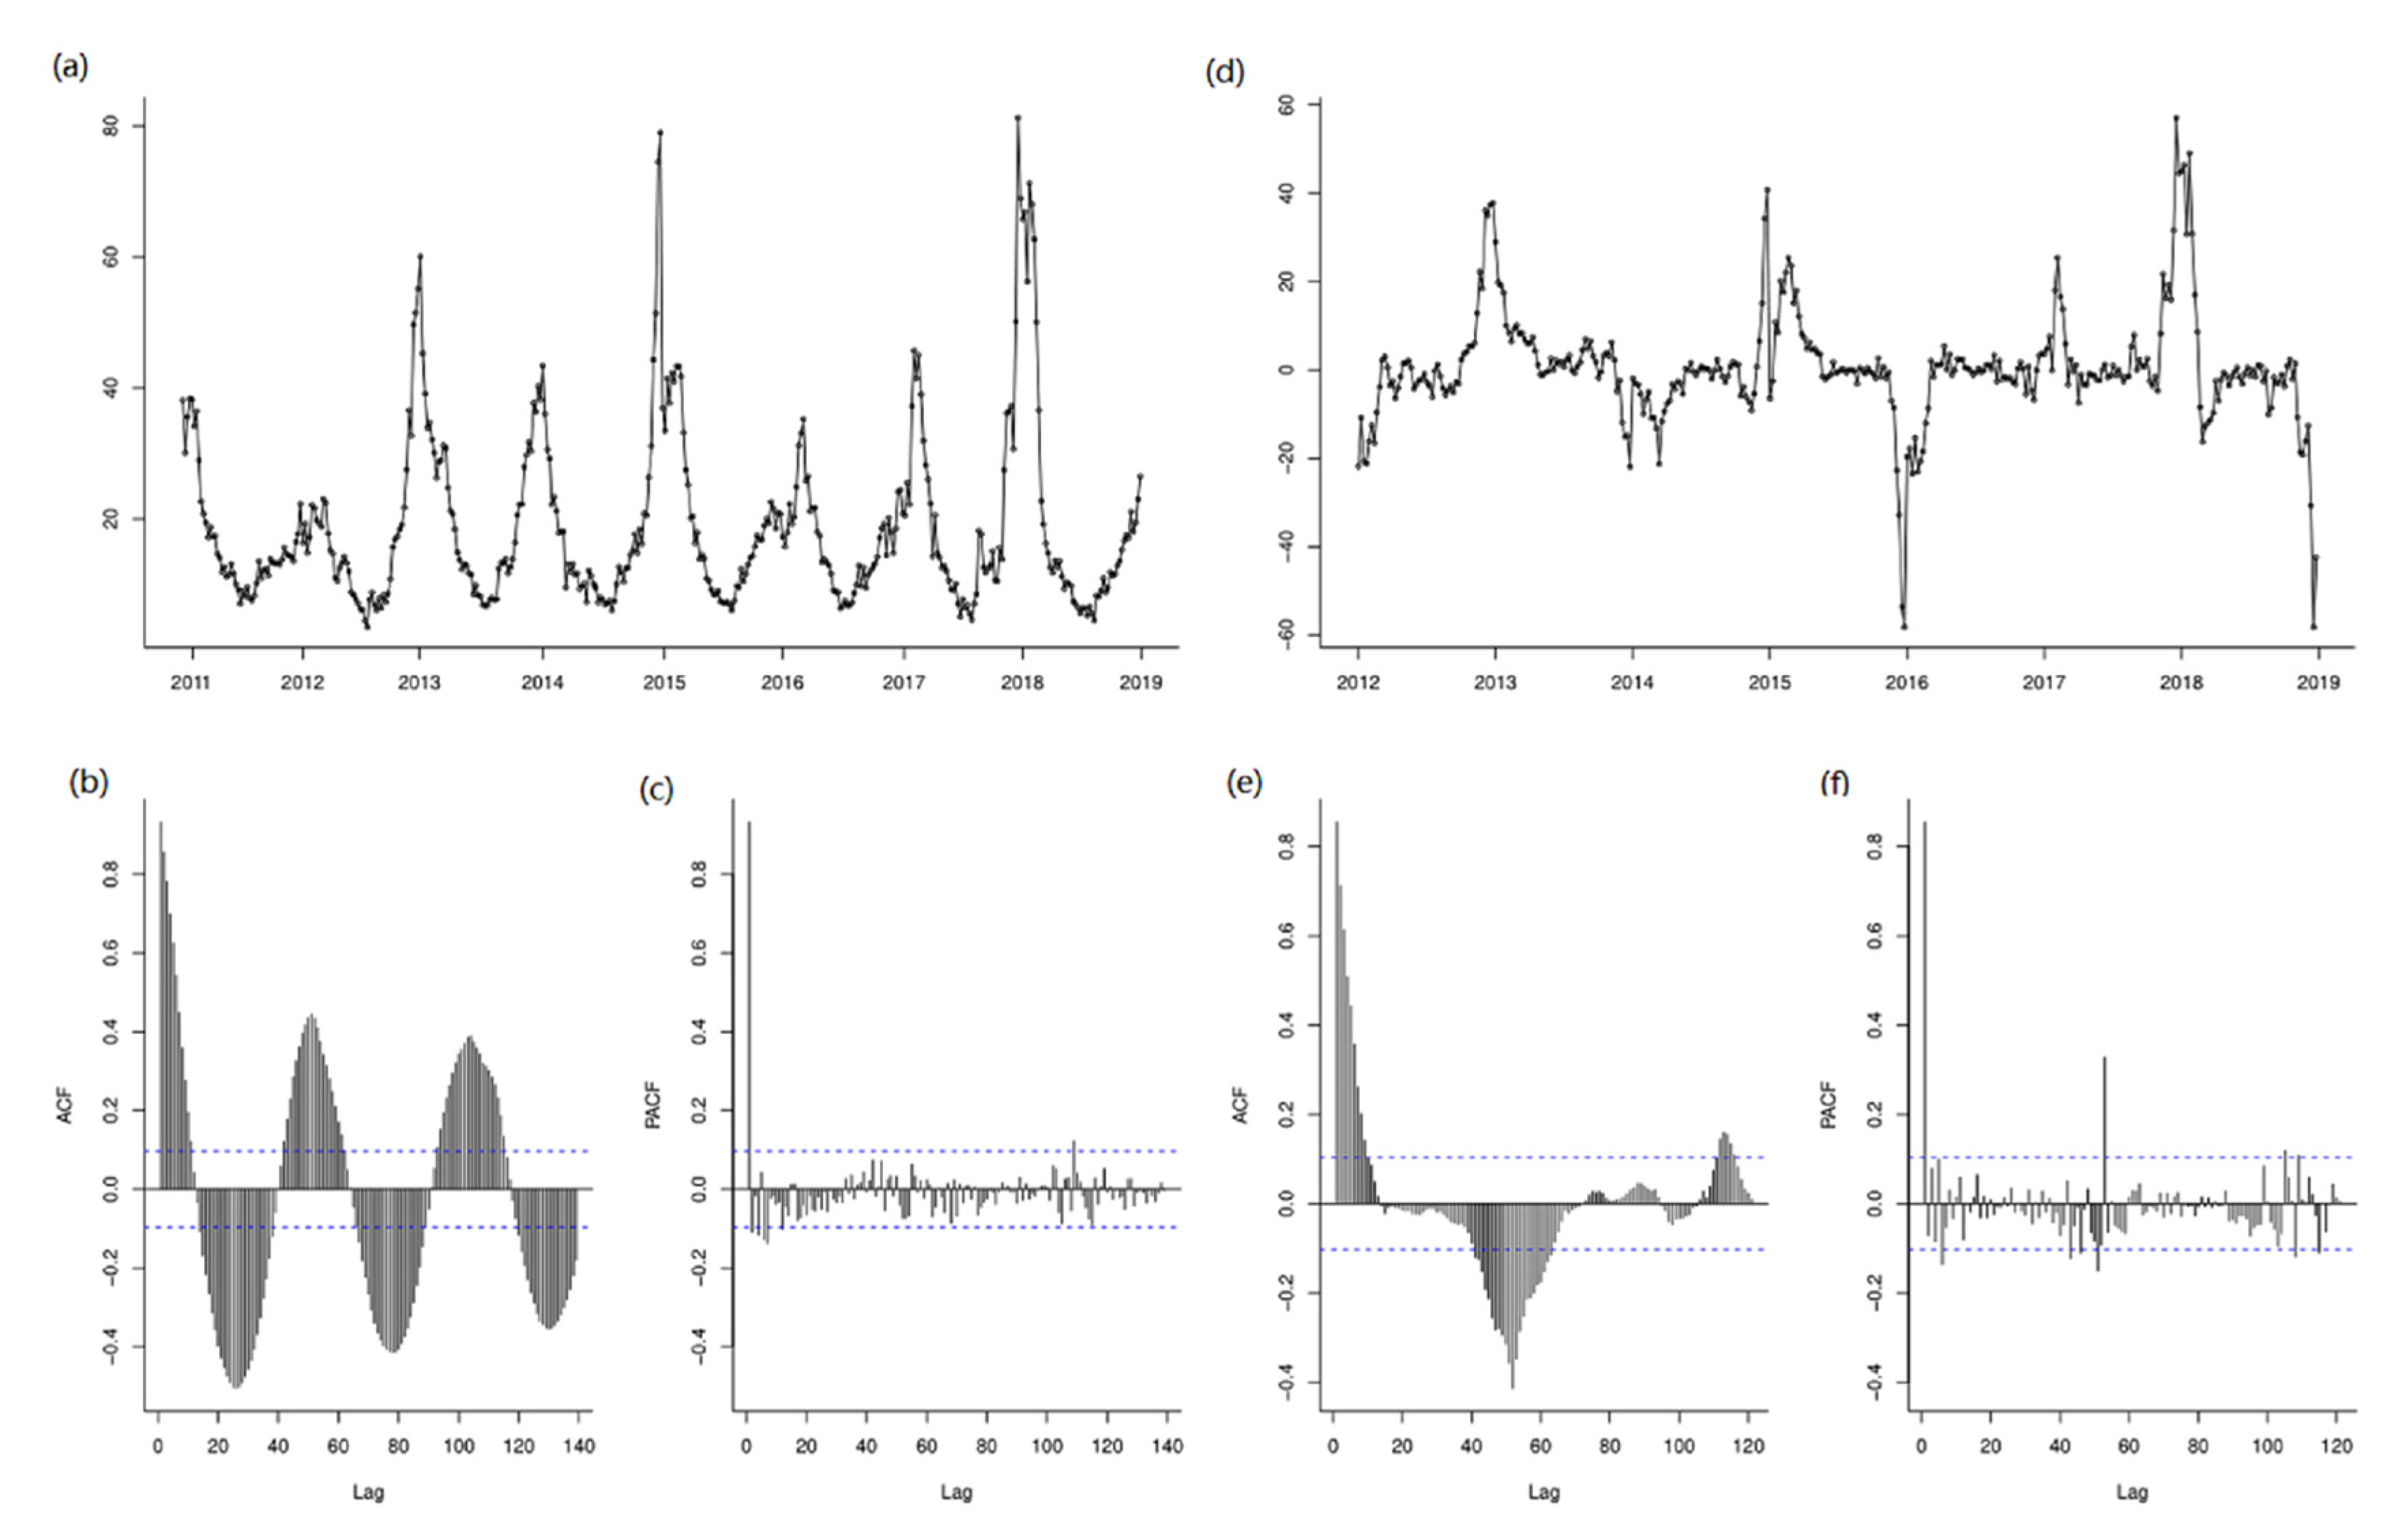
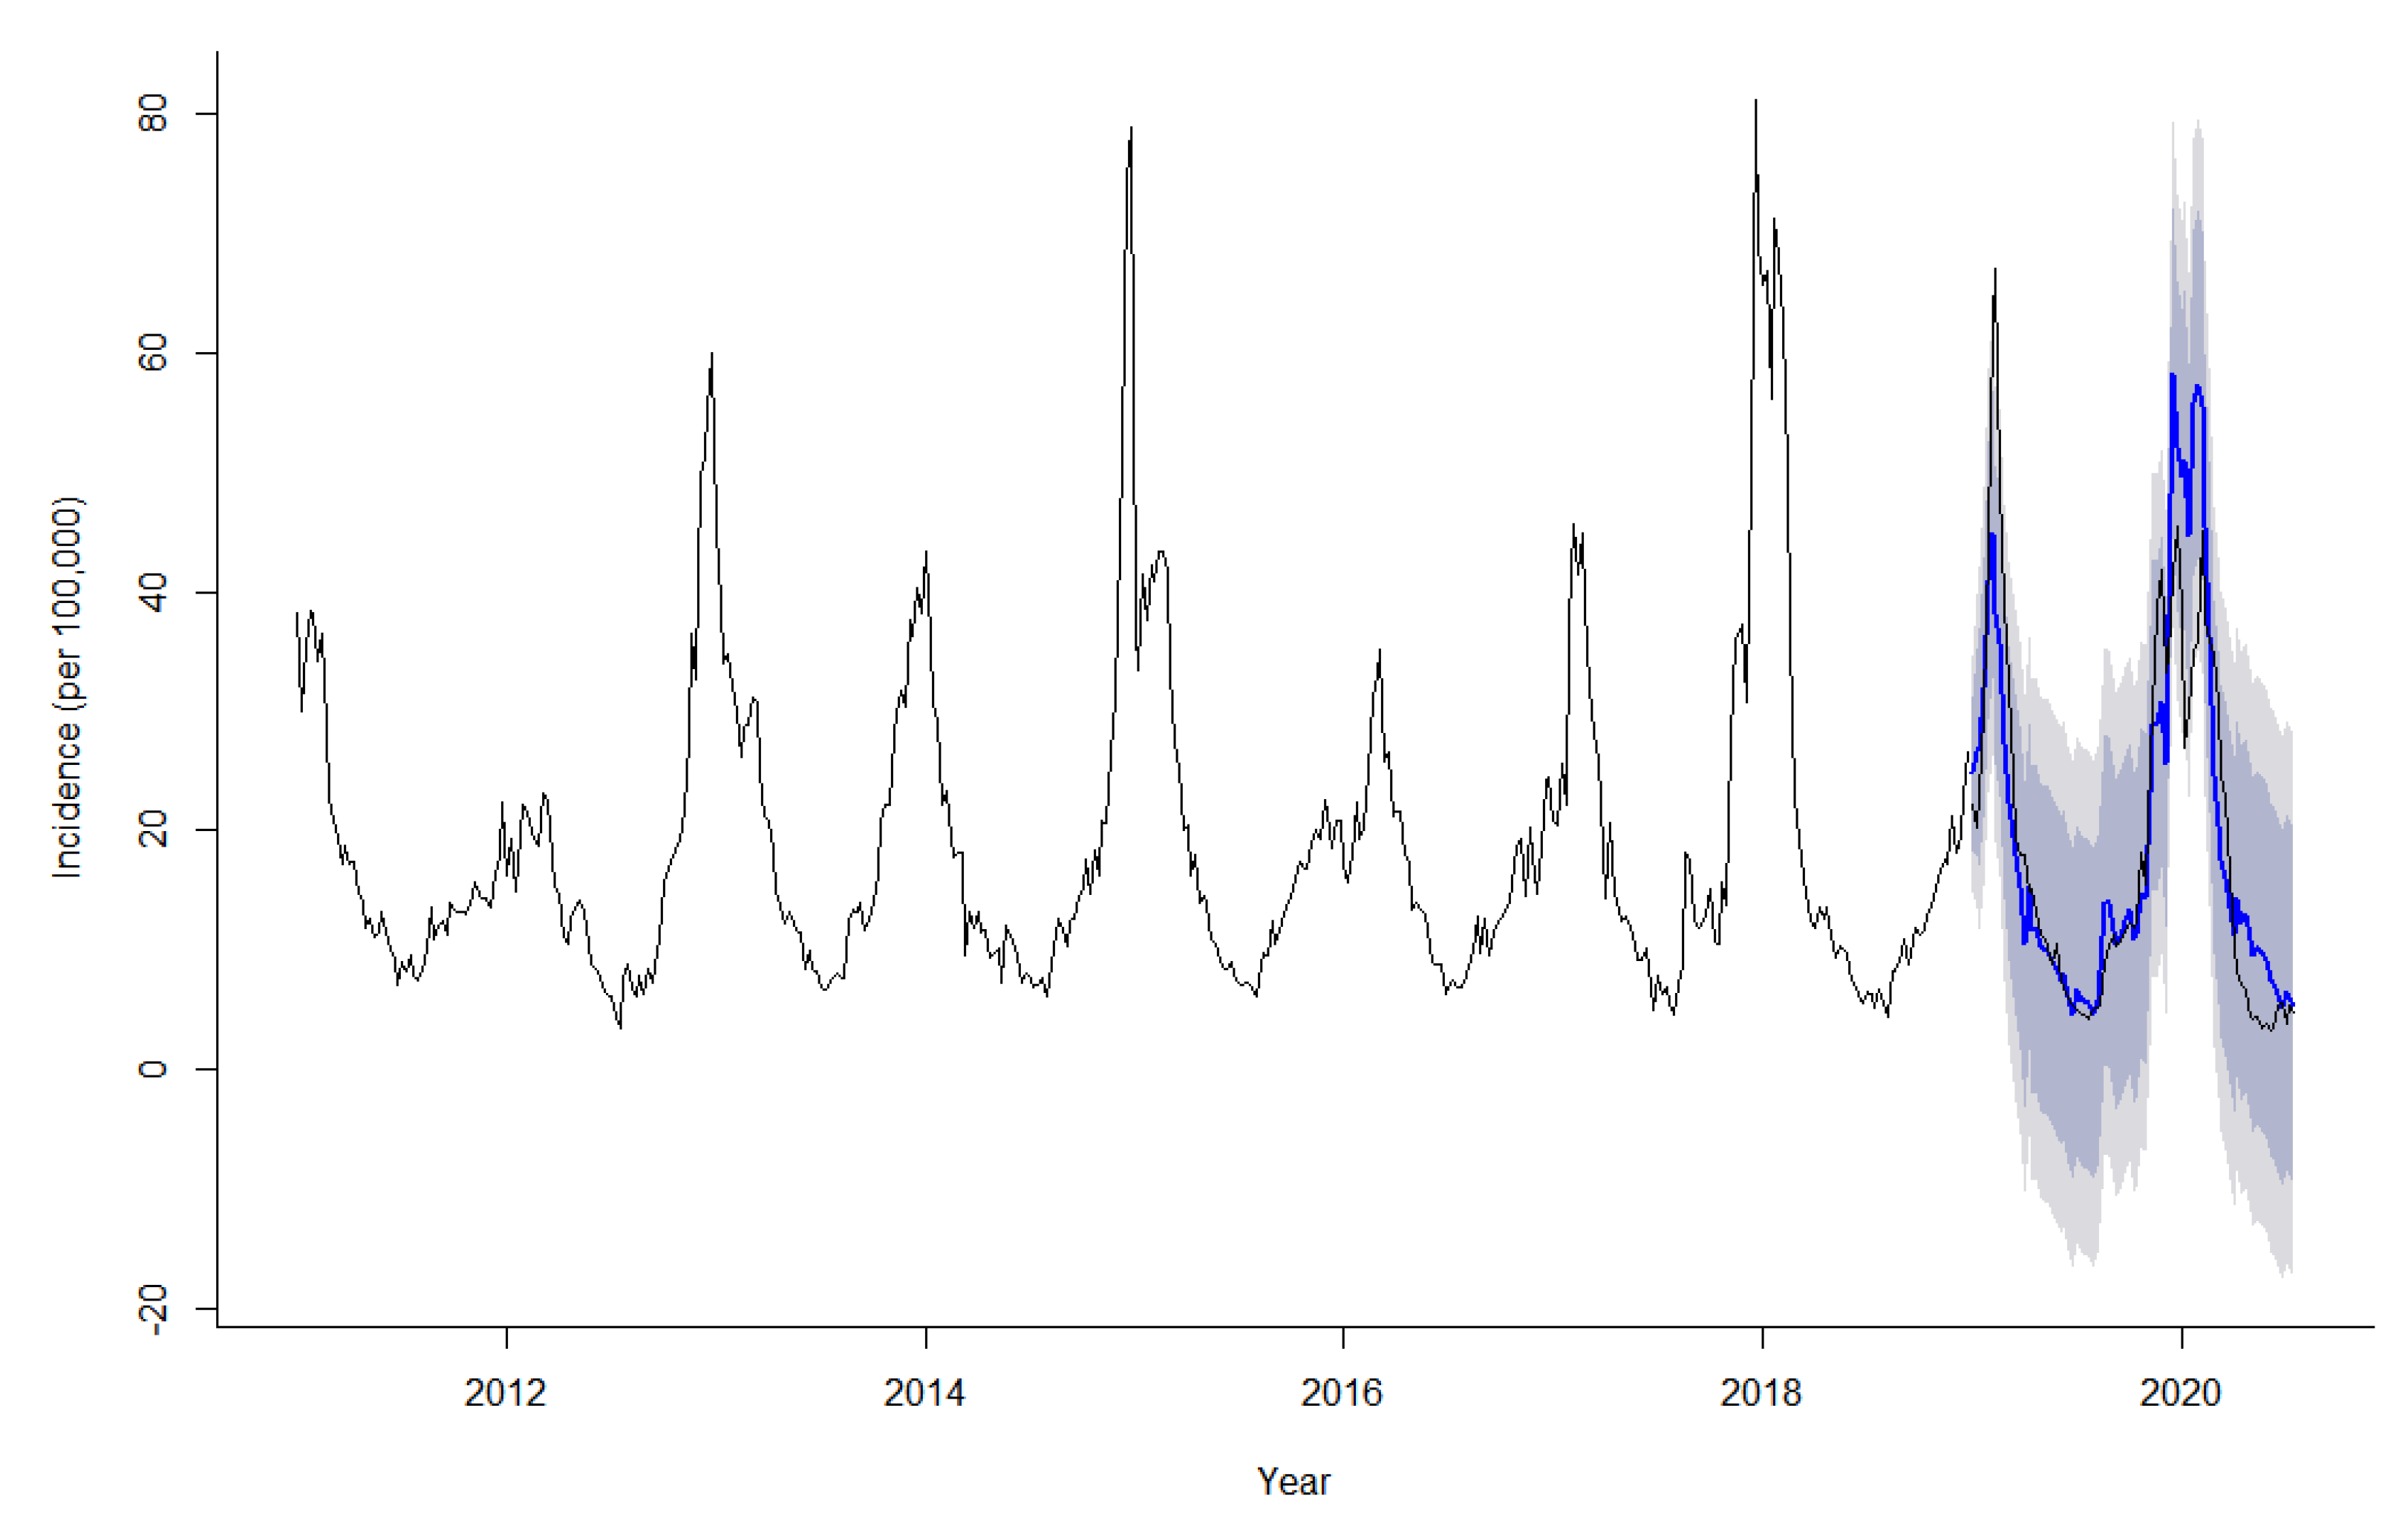
3.3. Time-Series Analysis
4. Discussion
5. Limitations
6. Conclusions
Author Contributions
Funding
Institutional Review Board Statement
Informed Consent Statement
Data Availability Statement
Conflicts of Interest
References
- Tokars, J.I.; Olsen, S.J.; Reed, C. Seasonal Incidence of Symptomatic Influenza in the United States. Clin. Infect. Dis. 2018, 66, 1511–1518. [Google Scholar] [CrossRef]
- Iuliano, A.D.; Roguski, K.M.; Chang, H.H.; Muscatello, D.J.; Palekar, R.; Tempia, S.; Cohen, C.; Gran, J.M.; Schanzer, D.; Cowling, B.J.; et al. Estimates of global seasonal influenza-associated respiratory mortality: A modelling study. Lancet 2018, 391, 1285–1300. [Google Scholar] [CrossRef]
- CDC. Diagnosing Flu. Available online: https://www.cdc.gov/flu/symptoms/testing.htm (accessed on 11 November 2020).
- Humiston, S.G.; Pham, T.N. Influenza-Like Illness Diagnosis and Management in the Acute Care Setting. Pediatric Emerg. Care 2016, 32, 875–882. [Google Scholar] [CrossRef]
- Pei, S.; Kandula, S.; Yang, W.; Shaman, J. Forecasting the spatial transmission of influenza in the United States. Proc. Natl. Acad. Sci. USA 2018, 115, 2752–2757. [Google Scholar] [CrossRef] [PubMed] [Green Version]
- Stark, J.H.; Sharma, R.; Ostroff, S.; Cummings, D.A.; Ermentrout, B.; Stebbins, S.; Burke, D.S.; Wisniewski, S.R. Local spatial and temporal processes of influenza in Pennsylvania, USA: 2003–2009. PLoS ONE 2012, 7, e34245. [Google Scholar] [CrossRef] [Green Version]
- Martin, L.J.; Dong, H.; Liu, Q.; Talbot, J.; Qiu, W.; Yasui, Y. Predicting influenza-like illness-related emergency department visits by modelling spatio-temporal syndromic surveillance data. Epidemiol. Infect. 2019, 147, e312. [Google Scholar] [CrossRef] [Green Version]
- Salimi, M.; Jesri, N.; Javanbakht, M.; Farahani, L.Z.; Shirzadi, M.R.; Saghafipour, A. Spatio-temporal distribution analysis of zoonotic cutaneous leishmaniasis in Qom Province, Iran. J. Parasit. Dis. 2018, 42, 570–576. [Google Scholar] [CrossRef] [PubMed]
- Liu, M.Y.; Li, Q.H.; Zhang, Y.J.; Ma, Y.; Liu, Y.; Feng, W.; Hou, C.B.; Amsalu, E.; Li, X.; Wang, W.; et al. Spatial and temporal clustering analysis of tuberculosis in the mainland of China at the prefecture level, 2005–2015. Infect. Dis. Poverty 2018, 7, 106. [Google Scholar] [CrossRef] [PubMed] [Green Version]
- Alimohamadi, Y.; Zahraei, S.M.; Karami, M.; Yaseri, M.; Lotfizad, M.; Holakouie-Naieni, K. Spatio-temporal analysis of Pertussis using geographic information system among Iranian population during 2012–2018. Med. J. Islamic Repub. Iran. 2020, 34, 22. [Google Scholar] [CrossRef]
- Onozuka, D.; Hagihara, A. Spatial and temporal dynamics of influenza outbreaks. Epidemiology 2008, 19, 824–828. [Google Scholar] [CrossRef]
- Petukhova, T.; Ojkic, D.; McEwen, B.; Deardon, R.; Poljak, Z. Assessment of autoregressive integrated moving average (ARIMA), generalized linear autoregressive moving average (GLARMA), and random forest (RF) time series regression models for predicting influenza A virus frequency in swine in Ontario, Canada. PLoS ONE 2018, 13, e0198313. [Google Scholar] [CrossRef] [PubMed]
- Rao, X.; Chen, Z.; Dong, H.; Zhu, C.; Yan, Y. Epidemiology of influenza in hospitalized children with respiratory tract infection in Suzhou area from 2016 to 2019. J. Med. Virol. 2020. [Google Scholar] [CrossRef] [PubMed]
- Zhang, Y.Z.; Bambrick, H.; Mengersen, K.; Tong, S.L.; Hu, W.B. Using Google Trends and ambient temperature to predict seasonal influenza outbreaks. Environ. Int. 2018, 117, 284–291. [Google Scholar] [CrossRef] [PubMed]
- Song, X.; Xiao, J.; Deng, J.; Kang, Q.; Zhang, Y.; Xu, J. Time series analysis of influenza incidence in Chinese provinces from 2004 to 2011. Medicine 2016, 95, e3929. [Google Scholar] [CrossRef] [PubMed]
- He, D.; Lui, R.; Wang, L.; Tse, C.K.; Yang, L.; Stone, L. Global Spatio-temporal Patterns of Influenza in the Post-pandemic Era. Sci. Rep. 2015, 5, 11013. [Google Scholar] [CrossRef] [Green Version]
- Lu, J.; Meyer, S. Forecasting Flu Activity in the United States: Benchmarking an Endemic-Epidemic Beta Model. Int. J. Environ. Res. Public Health 2020, 17, 1381. [Google Scholar] [CrossRef] [Green Version]
- Wang, Y.; Yang, Y.; Shi, X.; Mao, S.; Shi, N.; Hui, X. The spatial distribution pattern of human immunodeficiency virus/acquired immune deficiency syndrome in China. Geospat. Health 2016, 11, 414. [Google Scholar] [CrossRef] [Green Version]
- Zhu, B.; Liu, J.L.; Fu, Y.; Zhang, B.; Mao, Y. Spatio-Temporal Epidemiology of Viral Hepatitis in China (2003-2015): Implications for Prevention and Control Policies. Int. J. Environ. Res. Public Health 2018, 15, 661. [Google Scholar] [CrossRef] [Green Version]
- Mao, Y.; He, R.; Zhu, B.; Liu, J.; Zhang, N. Notifiable Respiratory Infectious Diseases in China: A Spatial-Temporal Epidemiology Analysis. Int. J. Environ. Res. Public Health 2020, 17, 2301. [Google Scholar] [CrossRef] [Green Version]
- Dong, W.; Yang, K.; Xu, Q.L.; Yang, Y.L. A Predictive Risk Model for A(H7N9) Human Infections Based on Spatial-Temporal Autocorrelation and Risk Factors: China, 2013–2014. Int. J. Environ. Res. Public Health 2015, 12, 15204–15221. [Google Scholar] [CrossRef]
- Gu, H.; Fan, W.; Liu, K.; Qin, S.; Li, X.; Jiang, J.; Chen, E.; Zhou, Y.; Jiang, Q. Spatio-temporal variations of typhoid and paratyphoid fevers in Zhejiang Province, China from 2005 to 2015. Sci. Rep. 2017, 7, 5780. [Google Scholar] [CrossRef]
- Khudyakov, Y.E.; Liu, Y.; Wang, X.; Liu, Y.; Sun, D.; Ding, S.; Zhang, B.; Du, Z.; Xue, F. Detecting Spatial-Temporal Clusters of HFMD from 2007 to 2011 in Shandong Province, China. PLoS ONE 2013, 8, e63447. [Google Scholar] [CrossRef] [Green Version]
- Kulldorff, M.; Athas, W.F.; Feurer, E.J.; Miller, B.A.; Key, C.R. Evaluating cluster alarms: A space-time scan statistic and brain cancer in Los Alamos, New Mexico. Am. J. Public Health 1998, 88, 1377–1380. [Google Scholar] [CrossRef] [Green Version]
- Fuentes-Vallejo, M. Space and space-time distributions of dengue in a hyper-endemic urban space: The case of Girardot, Colombia. BMC Infect. Dis. 2017, 17, 512. [Google Scholar] [CrossRef] [PubMed] [Green Version]
- Cong, J.; Ren, M.; Xie, S.; Wang, P. Predicting Seasonal Influenza Based on SARIMA Model, in Mainland China from 2005 to 2018. Int. J. Environ. Res. Public Health 2019, 16, 4760. [Google Scholar] [CrossRef] [PubMed] [Green Version]
- Keilman, L.J. Seasonal Influenza (Flu). Nurs. Clin. N. Am. 2019, 54, 227–243. [Google Scholar] [CrossRef] [PubMed]
- Talbot, H.K. Influenza in Older Adults. Infect. Dis. Clin. N. Am. 2017, 31, 757–766. [Google Scholar] [CrossRef] [PubMed]
- Zhang, Y.; Ye, C.; Yu, J.; Zhu, W.; Wang, Y.; Li, Z.; Xu, Z.; Cheng, J.; Wang, N.; Hao, L.; et al. The complex associations of climate variability with seasonal influenza A and B virus transmission in subtropical Shanghai, China. Sci. Total Environ. 2020, 701, 134607. [Google Scholar] [CrossRef]
- Yue, Y.; Liu, X.; Xu, M.; Ren, D.; Liu, Q. Epidemiological dynamics of dengue fever in mainland China, 2014–2018. Int. J. Infect. Dis. 2019, 86, 82–93. [Google Scholar] [CrossRef] [PubMed] [Green Version]
- Freitas, L.P.; Cruz, O.G.; Lowe, R.; Sa Carvalho, M. Space-time dynamics of a triple epidemic: Dengue, chikungunya and Zika clusters in the city of Rio de Janeiro. Proc. Biol. Sci. 2019, 286, 20191867. [Google Scholar] [CrossRef] [PubMed] [Green Version]
- Zhang, Y.; Wang, X.; Li, Y.; Ma, J. Spatiotemporal Analysis of Influenza in China, 2005–2018. Sci. Rep. 2019, 9, 19650. [Google Scholar] [CrossRef] [Green Version]
- Lu, F.S.; Hattab, M.W.; Clemente, C.L.; Biggerstaff, M.; Santillana, M. Improved state-level influenza nowcasting in the United States leveraging Internet-based data and network approaches. Nat. Commun. 2019, 10, 147. [Google Scholar] [CrossRef] [PubMed]
- Chandra, S.; Kassens-Noor, E.; Kuljanin, G.; Vertalka, J. A geographic analysis of population density thresholds in the influenza pandemic of 1918–1919. Int. J. Health Geogr. 2013, 12, 9. [Google Scholar] [CrossRef] [PubMed] [Green Version]
- Acuna-Soto, R.; Viboud, C.; Chowell, G. Influenza and pneumonia mortality in 66 large cities in the United States in years surrounding the 1918 pandemic. PLoS ONE 2011, 6, e23467. [Google Scholar] [CrossRef] [Green Version]
- Grantz, K.H.; Rane, M.S.; Salje, H.; Glass, G.E.; Schachterle, S.E.; Cummings, D.A.T. Disparities in influenza mortality and transmission related to sociodemographic factors within Chicago in the pandemic of 1918. Proc. Natl. Acad. Sci. USA 2016, 113, 13839–13844. [Google Scholar] [CrossRef] [Green Version]
- Okland, H.; Mamelund, S.E. Race and 1918 Influenza Pandemic in the United States: A Review of the Literature. Int. J. Environ. Res. Public Health 2019, 16, 2487. [Google Scholar] [CrossRef] [PubMed] [Green Version]
- Lippert, J.F.; Buscemi, J.; Saiyed, N.; Silva, A.; Benjamins, M.R. Influenza and Pneumonia Mortality Across the 30 Biggest U.S. Cities: Assessment of Overall Trends and Racial Inequities. J. Racial Ethn. Health Disparities 2021. [Google Scholar] [CrossRef] [PubMed]
- Hutchins, S.S.; Fiscella, K.; Levine, R.S.; Ompad, D.C.; McDonald, M. Protection of racial/ethnic minority populations during an influenza pandemic. Am. J. Public Health 2009, 99 (Suppl. S2), S261–S270. [Google Scholar] [CrossRef]
- Chow, E.J.; Doyle, J.D.; Uyeki, T.M. Influenza virus-related critical illness: Prevention, diagnosis, treatment. Crit. Care 2019, 23, 214. [Google Scholar] [CrossRef] [Green Version]
- Metz, J.A.; Finn, A. Influenza and humidity—Why a bit more damp may be good for you! J. Infect. 2015, 71, S54–S58. [Google Scholar] [CrossRef]
- Dave, K.; Lee, P.C. Global Geographical and Temporal Patterns of Seasonal Influenza and Associated Climatic Factors. Epidemiol. Rev. 2019, 41, 51–68. [Google Scholar] [CrossRef] [PubMed]


| Year | Moran’s I | E(I) | Mean | S | Z-Value | p-Value |
|---|---|---|---|---|---|---|
| 2011 | 0.099 | −0.021 | −0.023 | 0.090 | 1.358 | 0.093 |
| 2012 | 0.185 | −0.021 | −0.019 | 0.095 | 2.151 | 0.028 |
| 2013 | 0.181 | −0.021 | −0.019 | 0.094 | 2.121 | 0.031 |
| 2014 | 0.200 | −0.021 | −0.021 | 0.092 | 2.401 | 0.022 |
| 2015 | 0.166 | −0.021 | −0.222 | 0.091 | 2.073 | 0.037 |
| 2016 | 0.177 | −0.021 | −0.024 | 0.093 | 2.150 | 0.029 |
| 2017 | 0.146 | −0.021 | −0.025 | 0.087 | 1.981 | 0.039 |
| 2018 | 0.074 | −0.021 | −0.023 | 0.092 | 1.053 | 0.145 |
| 2019 | 0.074 | −0.021 | −0.021 | 0.090 | 1.053 | 0.139 |
| Year | Level | Center | N | Cluster Period | Coordinates/Radius(km) | ObservedCases | ExpectedCases | RR | LLR | p-Value |
|---|---|---|---|---|---|---|---|---|---|---|
| 2011 | 1 | Kentucky | 15 | 2011-01-01 to 2011-02-28 | (37.5 N, 85.3 W)/738.2 | 121,829 | 24,485 | 6.22 | 108,601 | <0.001 |
| 2 | Colorado | 13 | 2011-01-01 to 2011-02-28 | (39.0 N, 105.5 W)/1005.2 | 62,527 | 15,984 | 3.91 | 4.32 | <0.001 | |
| 2012 | 1 | Mississippi | 3 | 2012-10-01 to 2012-12-31 | (32.8 N, 89.7 W)/289.2 | 37,831 | 4698 | 8.65 | 46,953 | <0.001 |
| 2 | Virginia | 1 | 2012-09-01 to 2012-12-31 | (37.5 N, 78.8 W)/0.0 | 29,130 | 4234 | 7.26 | 31,944 | <0.001 | |
| 3 | Nebraska | 17 | 2012-01-01 to 2012-03-31 | (41.5 N, 99.8 W)/1116.02 | 65,301 | 32,693 | 2.15 | 13,777 | <0.001 | |
| 2013 | 1 | Virginia | 3 | 2013-01-01 to 2013-03-31 | (37.5 N, 78.8 W)/222.1 | 46,638 | 4750 | 10.61 | 66,247 | <0.001 |
| 2 | Texas | 15 | 2013-01-01 to 2013-2-28 | (31.5 N, 99.4 W)/1327.5 | 101,773 | 27,333 | 4.32 | 64,734 | <0.001 | |
| 2014 | 1 | Mississippi | 3 | 2014-10-01 to 2014-12-31 | (32.8 N, 89.7 W)/289.2 | 45,125 | 5686 | 8.52 | 55,411 | <0.001 |
| 2 | Virginia | 3 | 2014-01-01 to 2014-04-30 | (37.5 N, 78.8 W)/222.1 | 43,127 | 6524 | 7.06 | 46,035 | <0.001 | |
| 3 | New Mexico | 12 | 2014-01-01 to 2014-02-28 | (34.4 N, 106.1 W)/1249.5 | 54,639 | 18,361 | 3.18 | 24,494 | <0.001 | |
| 2015 | 1 | Louisiana | 2 | 2015-01-01 to 2015-04-30 | (31.1 N, 92.0 W)/289.2 | 45,837 | 4254 | 11.66 | 69,009 | <0.001 |
| 2 | Virginia | 3 | 2015-01-01 to 2015-04-30 | (37.5 N, 78.8 W)/222.1 | 54,666 | 6134 | 9.79 | 73,277 | <0.001 | |
| 3 | New Mexico | 12 | 2015-01-01 to 2015-02-28 | (34.4 N, 106.1 W)/1249.5 | 54,311 | 17,264 | 3.38 | 26,518 | <0.001 | |
| 2016 | 1 | Virginia | 3 | 2016-01-01 to 2016-05-31 | (37.5 N, 78.8 W)/222.1 | 63,287 | 7974 | 8.81 | 78,624 | <0.001 |
| 2 | Arizona | 3 | 2016-01-01 to 2016-04-30 | (34.3 N, 111.7 W)/559.1 | 32,319 | 7155 | 4.73 | 24,144 | <0.001 | |
| 3 | Mississippi | 10 | 2016-01-01 to 2016-04-30 | (32.8 N, 89.7 W)/820.6 | 104,314 | 34,608 | 3.47 | 50,171 | <0.001 | |
| 2017 | 1 | Florida | 13 | 2017-01-01 to 2016-03-31 | (28.6 N, 82.5 W)/1247.2 | 192,625 | 51,339 | 4.63 | 127,775 | <0.001 |
| 2 | Oregon | 1 | 2017-11-01 to 2017-12-31 | (43.9 N, 120.6 W)/0.0 | 6819 | 1714 | 4.01 | 4329 | <0.001 | |
| 3 | Colorado | 14 | 2017-01-01 to 2017-02-28 | (39.0 N, 105.5 W)/1024.3 | 54,139 | 25,185 | 2.23 | 13,031 | <0.001 | |
| 2018 | 1 | Florida | 13 | 2018-01-01 to 2018-02-28 | (28.6 N, 82.5 W)/1247.2 | 259,855 | 47,137 | 6.89 | 253,645 | <0.001 |
| 2 | Wyoming | 13 | 2018-01-01 to 2018-02-28 | (43.0 N, 107.6 W)/1052.7 | 74,812 | 19,512 | 4.04 | 46,665 | <0.001 | |
| 2019 | 1 | Colorado | 7 | 2019-01-01 to 2019-03-31 | (39.0 N, 105.5 W)/747.6 | 82,746 | 19,164 | 4.52 | 58,874 | <0.001 |
| 2 | Florida | 13 | 2019-01-01 to 2019-03-31 | (28.6 N, 85.5 W)/1247.2 | 326,625 | 94,525 | 4.16 | 193,772 | <0.001 |
| Model | Estimate | t | p | Ljung-Box Q Test | AIC | BIC | RMSE | MAPE | |
|---|---|---|---|---|---|---|---|---|---|
| Statistics | p | ||||||||
| SARIMA (1, 0, 0) (1, 1, 0)52 | - | - | - | 21.822 | 0.149 | 2235.530 | 2247.220 | 4.673 | 14.290 |
| AR1 | 0.886 | 36.768 | <0.001 | - | - | - | - | - | - |
| SAR1 | −0.607 | 14.350 | <0.001 | - | - | - | - | - | - |
| SARIMA (1, 0, 1) (1, 1, 0)52 | - | - | - | 20.962 | 0.138 | 2235.110 | 2250.700 | 4.655 | 14.368 |
| AR1 | 0.865 | 28.837 | <0.001 | - | - | - | - | - | - |
| MA1 | 0.097 | 1.5410 | 0.065 | - | - | - | - | - | - |
| SAR1 | −0.612 | −14.495 | <0.001 | - | - | - | - | - | - |
| SARIMA (2, 0, 0) (1, 1, 0)52 | - | - | - | 20.734 | 0.146 | 2201.100 | 2216.700 | 14.390 | 0.970 |
| AR1 | 0.957 | 18.254 | <0.001 | - | - | - | - | - | - |
| AR2 | −0.080 | −1.511 | 0.067 | - | - | - | - | - | - |
| SAR1 | −0.612 | −14.495 | <0.001 | - | - | - | - | - | - |
| SARIMA (2, 0, 1) (1, 1, 0)52 | - | - | - | 18.552 | 0.183 | 2233.530 | 2253.012 | 4.636 | 14.602 |
| AR1 | 0.131 | 0.695 | 0.245 | - | - | - | - | - | - |
| AR2 | 0.653 | 3.744 | <0.001 | - | - | - | - | - | - |
| MA1 | 0.835 | 5.088 | <0.001 | - | - | - | - | - | - |
| SAR1 | −0.605 | 14.157 | <0.001 | - | - | - | - | - | - |
| SARIMA (2, 0, 2) (1, 1, 0)52 | - | - | - | 18.405 | 0.143 | 2233.480 | 2256.87 | 4.599 | 14.906 |
| AR1 | −0.080 | −2.161 | 0.018 | - | - | - | - | - | - |
| AR2 | 0.825 | 26.101 | <0.001 | - | - | - | - | - | - |
| MA1 | 1.064 | 16.272 | <0.001 | - | - | - | - | - | - |
| MA2 | 0.064 | 0.994 | 0.163 | - | - | - | - | - | - |
| SAR1 | −0.611 | −14.45 | <0.001 | - | - | - | - | - | - |
| Year/Week | Incidence | 95% CI | Year/Week | Incidence | 95% CI |
|---|---|---|---|---|---|
| 2020/30 | 5.504 | −4.248–15.256 | 2021/16 | 11.536 | −8.684–31.755 |
| 2020/31 | 5.163 | −7.801–18.128 | 2021/17 | 10.344 | −9.876–30.563 |
| 2020/32 | 4.681 | −10.288–19.651 | 2021/18 | 8.225 | −11.995–28.444 |
| 2020/33 | 6.943 | −9.399–23.284 | 2021/19 | 7.892 | −12.327–28.112 |
| 2020/34 | 8.422 | −8.900–25.743 | 2021/20 | 7.633 | −12.587–27.853 |
| 2020/35 | 9.549 | −8.488–27.587 | 2021/21 | 6.467 | −13.753–26.687 |
| 2020/36 | 11.084 | −7.484–29.652 | 2021/22 | 7.606 | −12.613–27.826 |
| 2020/37 | 9.433 | −9.532–28.398 | 2021/23 | 5.670 | −14.550–25.890 |
| 2020/38 | 9.993 | −9.271–29.258 | 2021/24 | 5.411 | −14.809–25.63 |
| 2020/39 | 11.696 | −7.795–31.187 | 2021/25 | 5.784 | −14.436–26.004 |
| 2020/40 | 11.710 | −7.953–31.373 | 2021/26 | 5.468 | −14.751–25.688 |
| 2020/41 | 11.726 | −8.068–31.520 | 2021/27 | 4.498 | −15.721–24.718 |
| 2020/42 | 12.617 | −7.276–32.511 | 2021/28 | 4.990 | −15.230–25.21 |
| 2020/43 | 15.611 | −4.359–35.581 | 2021/29 | 4.672 | −15.548–24.892 |
| 2020/44 | 15.406 | −4.623–35.434 | 2021/30 | 4.823 | −15.851–25.496 |
| 2020/45 | 20.754 | 0.681–40.827 | 2021/31 | 5.010 | −16.006–26.025 |
| 2020/46 | 23.021 | 2.913–43.128 | 2021/32 | 4.910 | −16.364–26.184 |
| 2020/47 | 26.565 | 6.431–46.698 | 2021/33 | 6.056 | −15.414–27.526 |
| 2020/48 | 30.270 | 10.116–50.423 | 2021/34 | 8.693 | −12.926–30.313 |
| 2020/49 | 24.789 | 4.619–44.958 | 2021/35 | 9.995 | −11.739–31.728 |
| 2020/50 | 26.030 | 5.849–46.211 | 2021/36 | 11.233 | −10.587–33.054 |
| 2020/51 | 31.144 | 10.954–51.334 | 2021/37 | 9.925 | −11.962–31.812 |
| 2020/52 | 34.819 | 14.622–55.016 | 2021/38 | 10.378 | −11.560–32.316 |
| 2021/01 | 29.301 | 9.099–49.503 | 2021/39 | 11.596 | −10.380–33.573 |
| 2021/02 | 23.157 | 2.951–43.363 | 2021/40 | 11.996 | −10.010–34.003 |
| 2021/03 | 25.995 | 5.785–46.204 | 2021/41 | 11.853 | −10.176–33.883 |
| 2021/04 | 32.197 | 11.985–52.409 | 2021/42 | 12.471 | −9.577–34.518 |
| 2021/05 | 40.479 | 20.266–60.693 | 2021/43 | 17.086 | −4.975–39.147 |
| 2021/06 | 54.811 | 34.596–75.026 | 2021/44 | 15.498 | −6.574–37.569 |
| 2021/07 | 54.064 | 33.848–74.28 | 2021/45 | 23.641 | 1.562–45.720 |
| 2021/08 | 43.281 | 23.064–63.498 | 2021/46 | 26.943 | 4.858–49.028 |
| 2021/09 | 37.155 | 16.938–57.373 | 2021/47 | 33.262 | 11.172–55.352 |
| 2021/10 | 31.506 | 11.288–51.724 | 2021/48 | 36.767 | 14.674–58.86 |
| 2021/11 | 24.705 | 4.487–44.924 | 2021/49 | 29.557 | 7.461–51.654 |
| 2021/12 | 20.839 | 0.620–41.058 | 2021/50 | 30.704 | 8.606–52.802 |
| 2021/13 | 17.175 | −3.044–37.394 | 2021/51 | 36.928 | 14.828–59.027 |
| 2021/14 | 14.670 | −5.549–34.889 | 2021/52 | 40.739 | 18.638–62.84 |
| 2021/15 | 11.900 | −8.319–32.119 |
Publisher’s Note: MDPI stays neutral with regard to jurisdictional claims in published maps and institutional affiliations. |
© 2021 by the authors. Licensee MDPI, Basel, Switzerland. This article is an open access article distributed under the terms and conditions of the Creative Commons Attribution (CC BY) license (https://creativecommons.org/licenses/by/4.0/).
Share and Cite
Song, Z.; Jia, X.; Bao, J.; Yang, Y.; Zhu, H.; Shi, X. Spatio-Temporal Analysis of Influenza-Like Illness and Prediction of Incidence in High-Risk Regions in the United States from 2011 to 2020. Int. J. Environ. Res. Public Health 2021, 18, 7120. https://doi.org/10.3390/ijerph18137120
Song Z, Jia X, Bao J, Yang Y, Zhu H, Shi X. Spatio-Temporal Analysis of Influenza-Like Illness and Prediction of Incidence in High-Risk Regions in the United States from 2011 to 2020. International Journal of Environmental Research and Public Health. 2021; 18(13):7120. https://doi.org/10.3390/ijerph18137120
Chicago/Turabian StyleSong, Zhijuan, Xiaocan Jia, Junzhe Bao, Yongli Yang, Huili Zhu, and Xuezhong Shi. 2021. "Spatio-Temporal Analysis of Influenza-Like Illness and Prediction of Incidence in High-Risk Regions in the United States from 2011 to 2020" International Journal of Environmental Research and Public Health 18, no. 13: 7120. https://doi.org/10.3390/ijerph18137120
APA StyleSong, Z., Jia, X., Bao, J., Yang, Y., Zhu, H., & Shi, X. (2021). Spatio-Temporal Analysis of Influenza-Like Illness and Prediction of Incidence in High-Risk Regions in the United States from 2011 to 2020. International Journal of Environmental Research and Public Health, 18(13), 7120. https://doi.org/10.3390/ijerph18137120