
Role of Chest Imaging in Viral Lung Diseases

 , ,
, ,
Abstract
1. Introduction
2. Lower Respiratory Tract Viral Infections in Immunocompetent
2.1. Coronaviridae
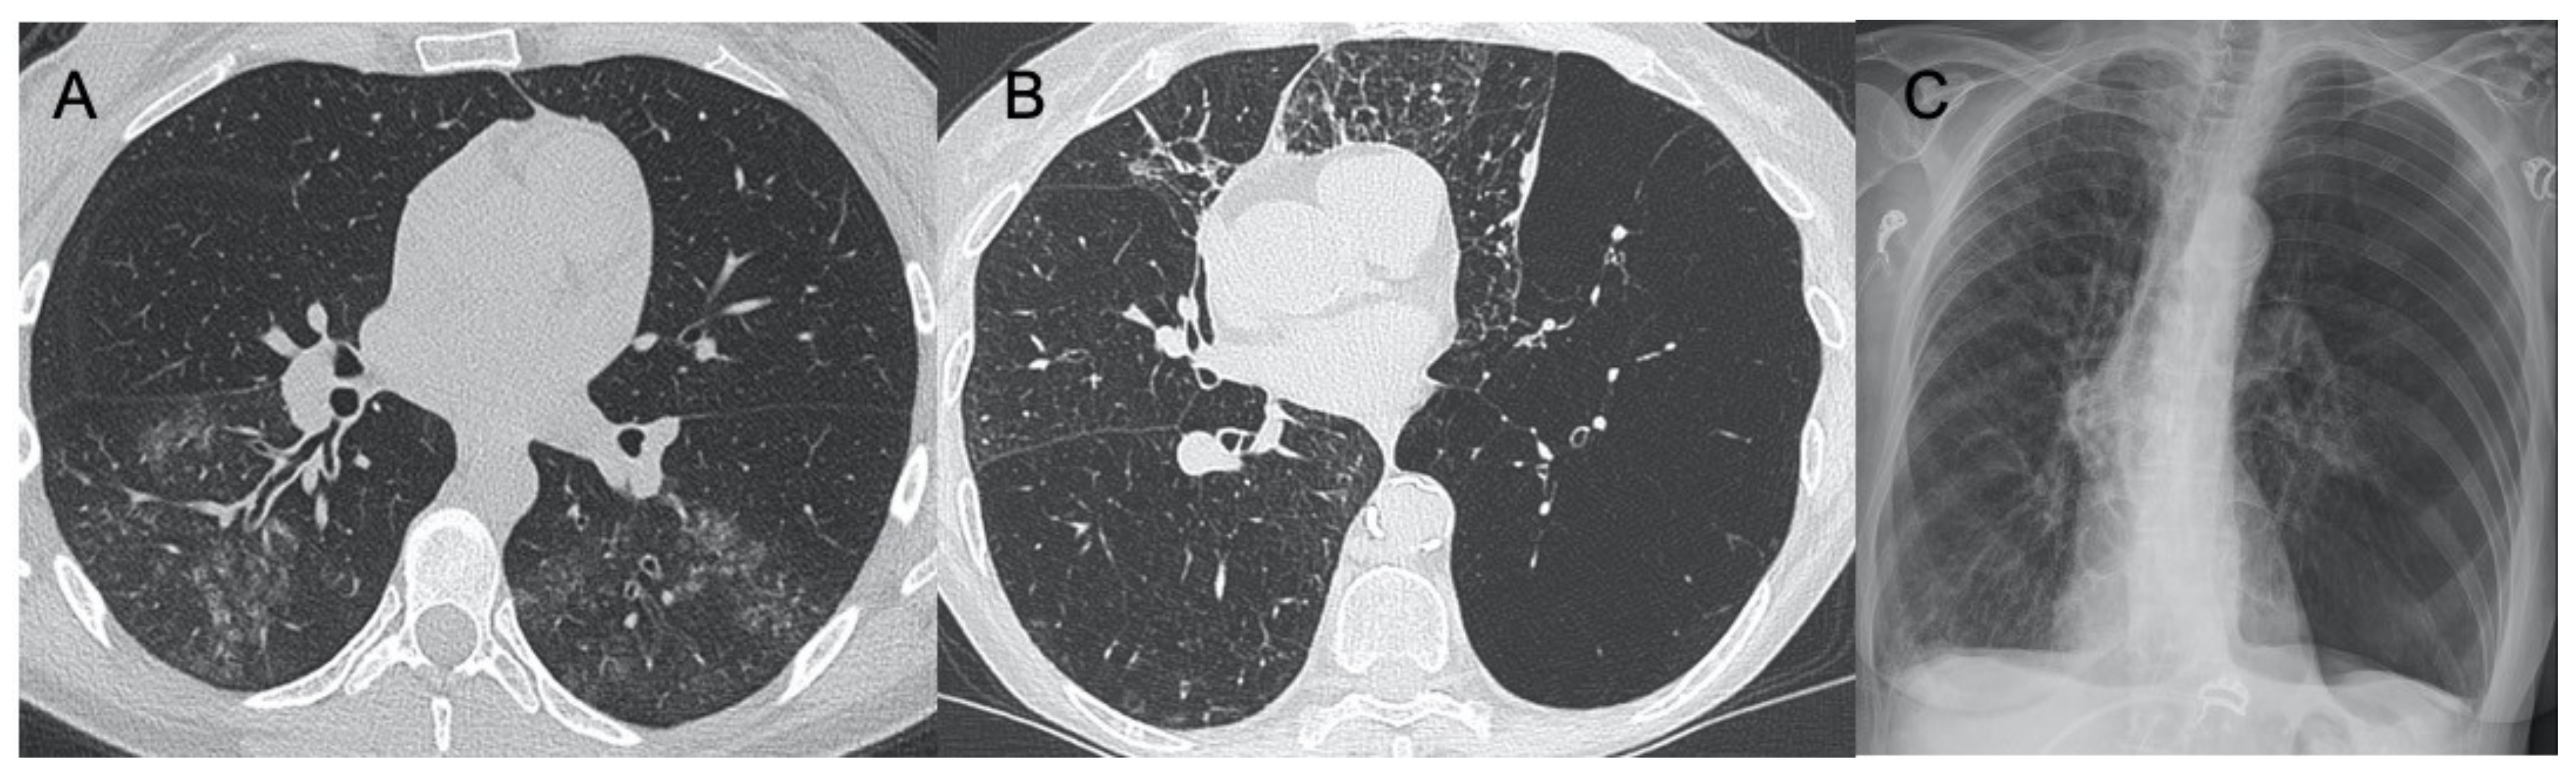
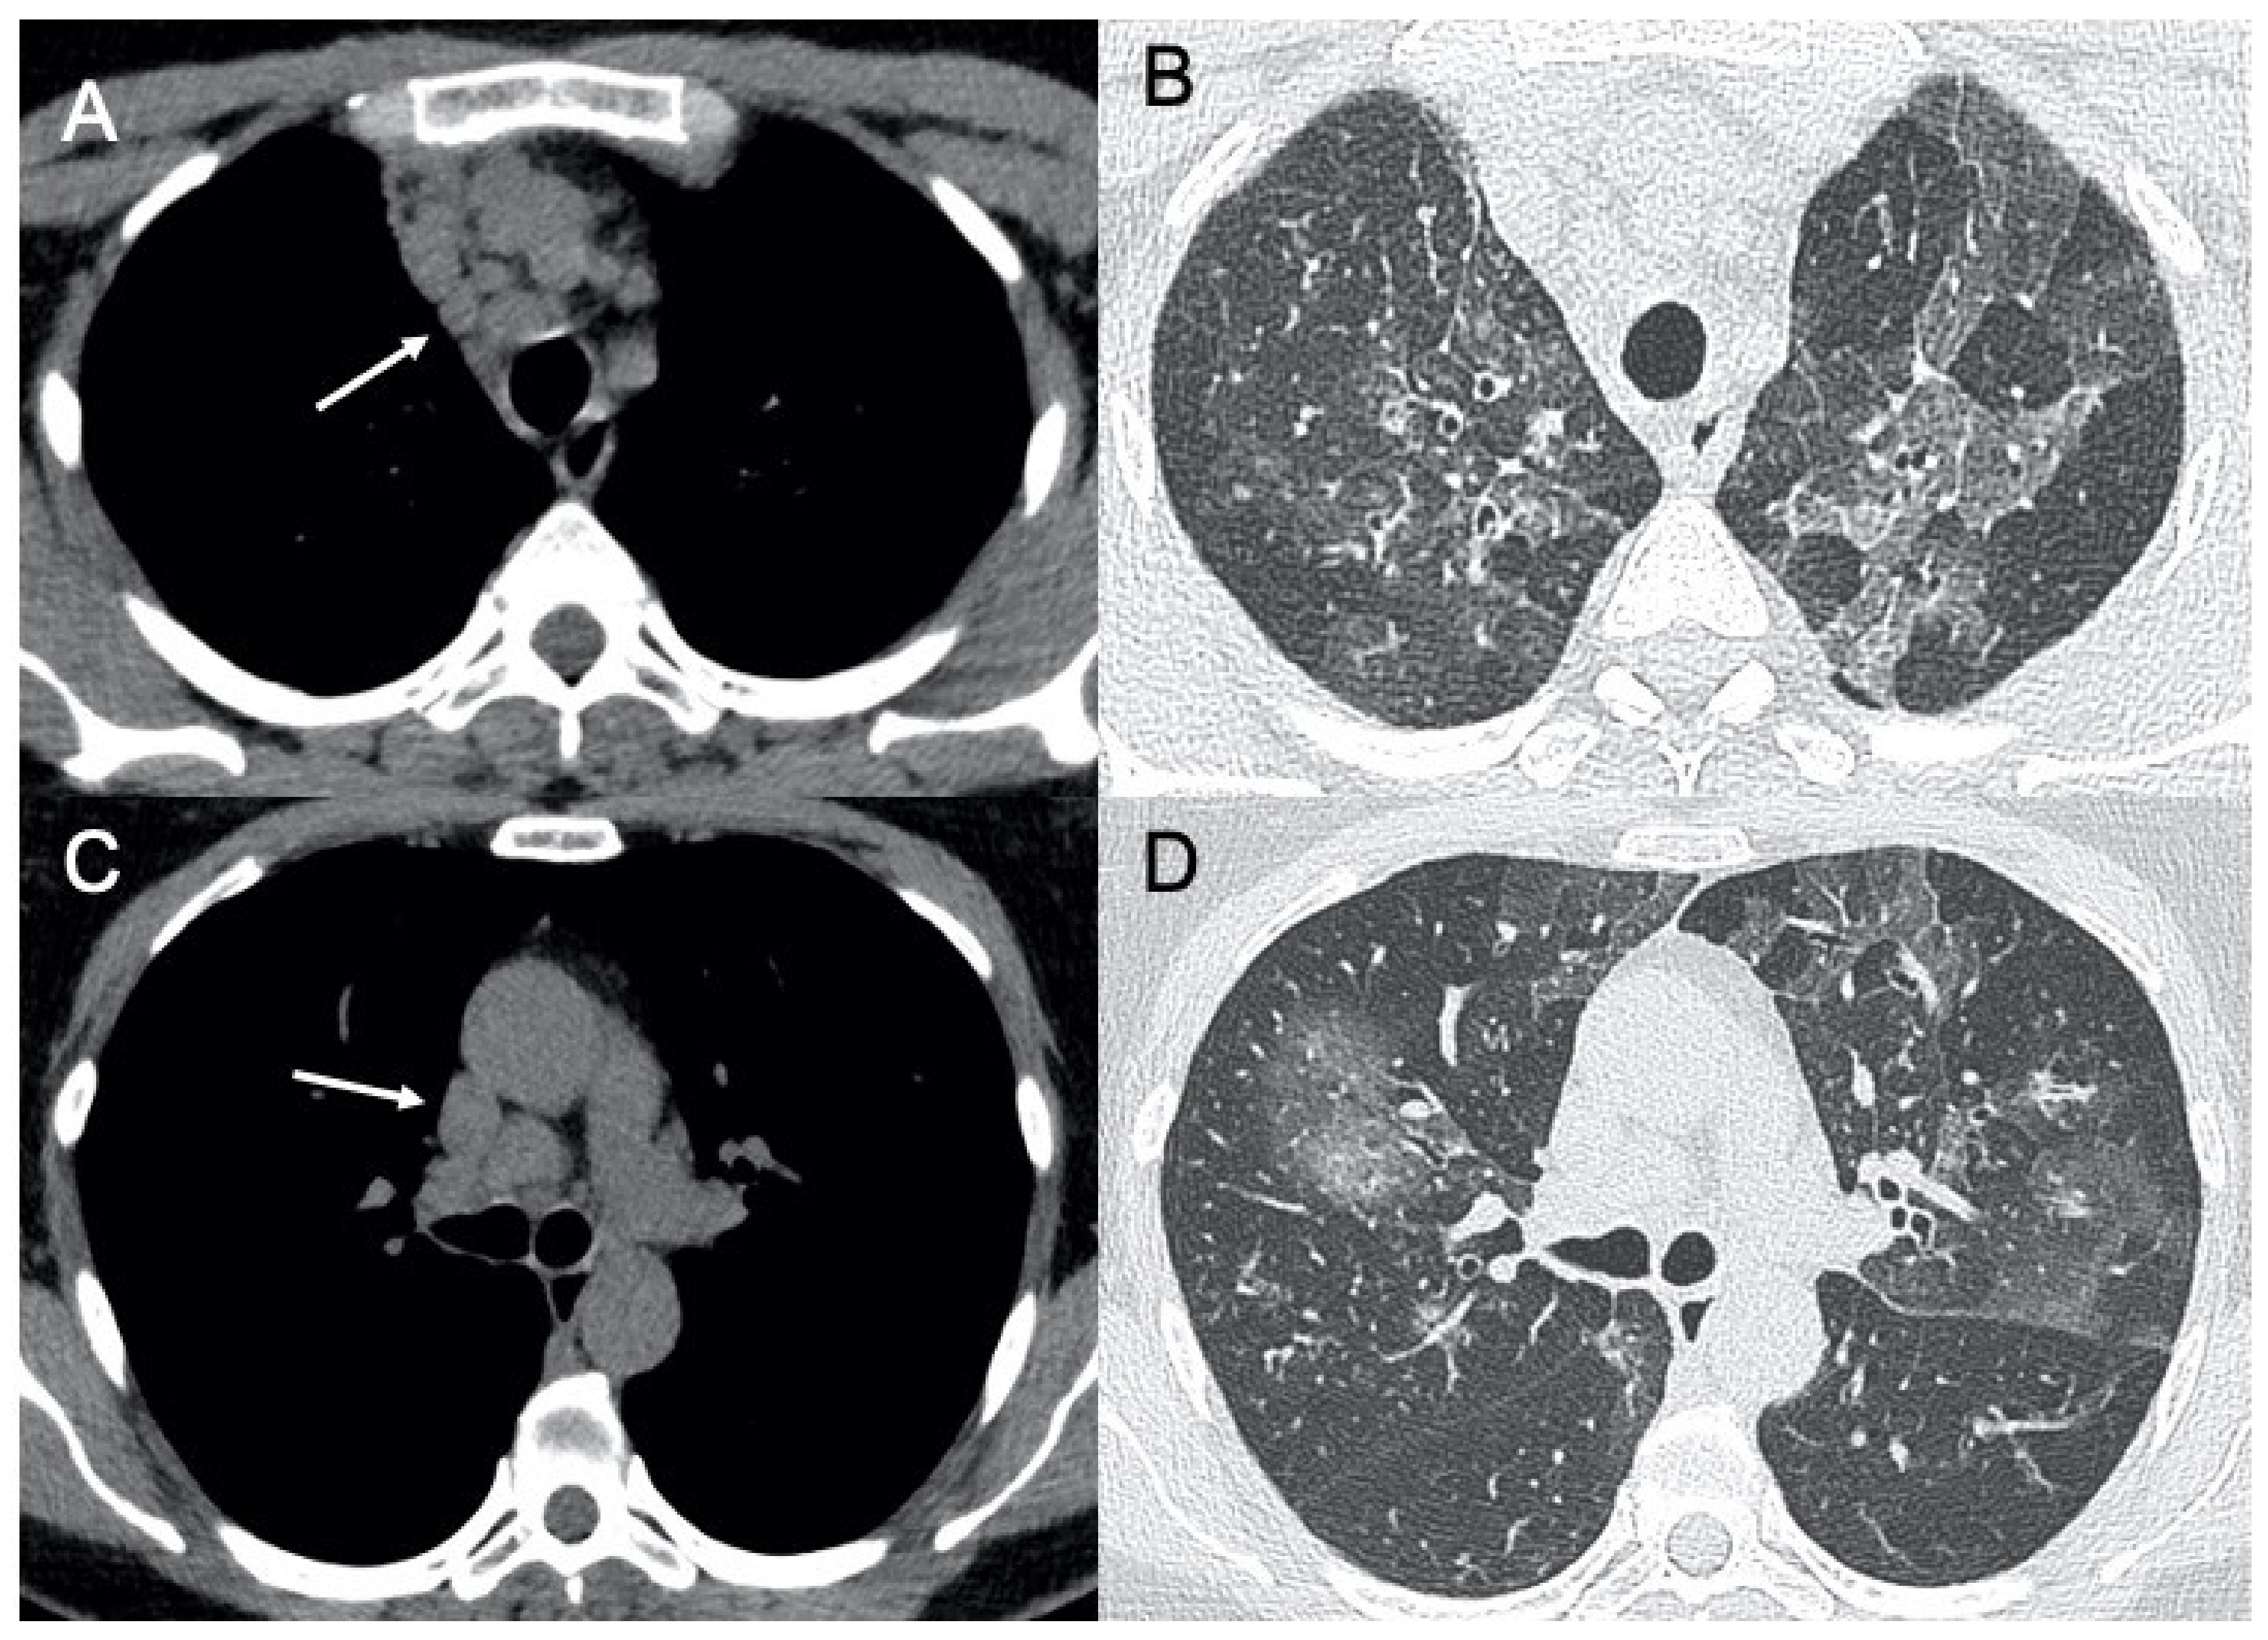
2.1.1. SARS-CoV-2—Coronavirus Disease 2019 (COVID-19)


2.1.2. Middle East Respiratory Syndrome (MERS)
2.1.3. Severe Acute Respiratory Syndrome (SARS)
2.1.4. Orthomyxoviridae
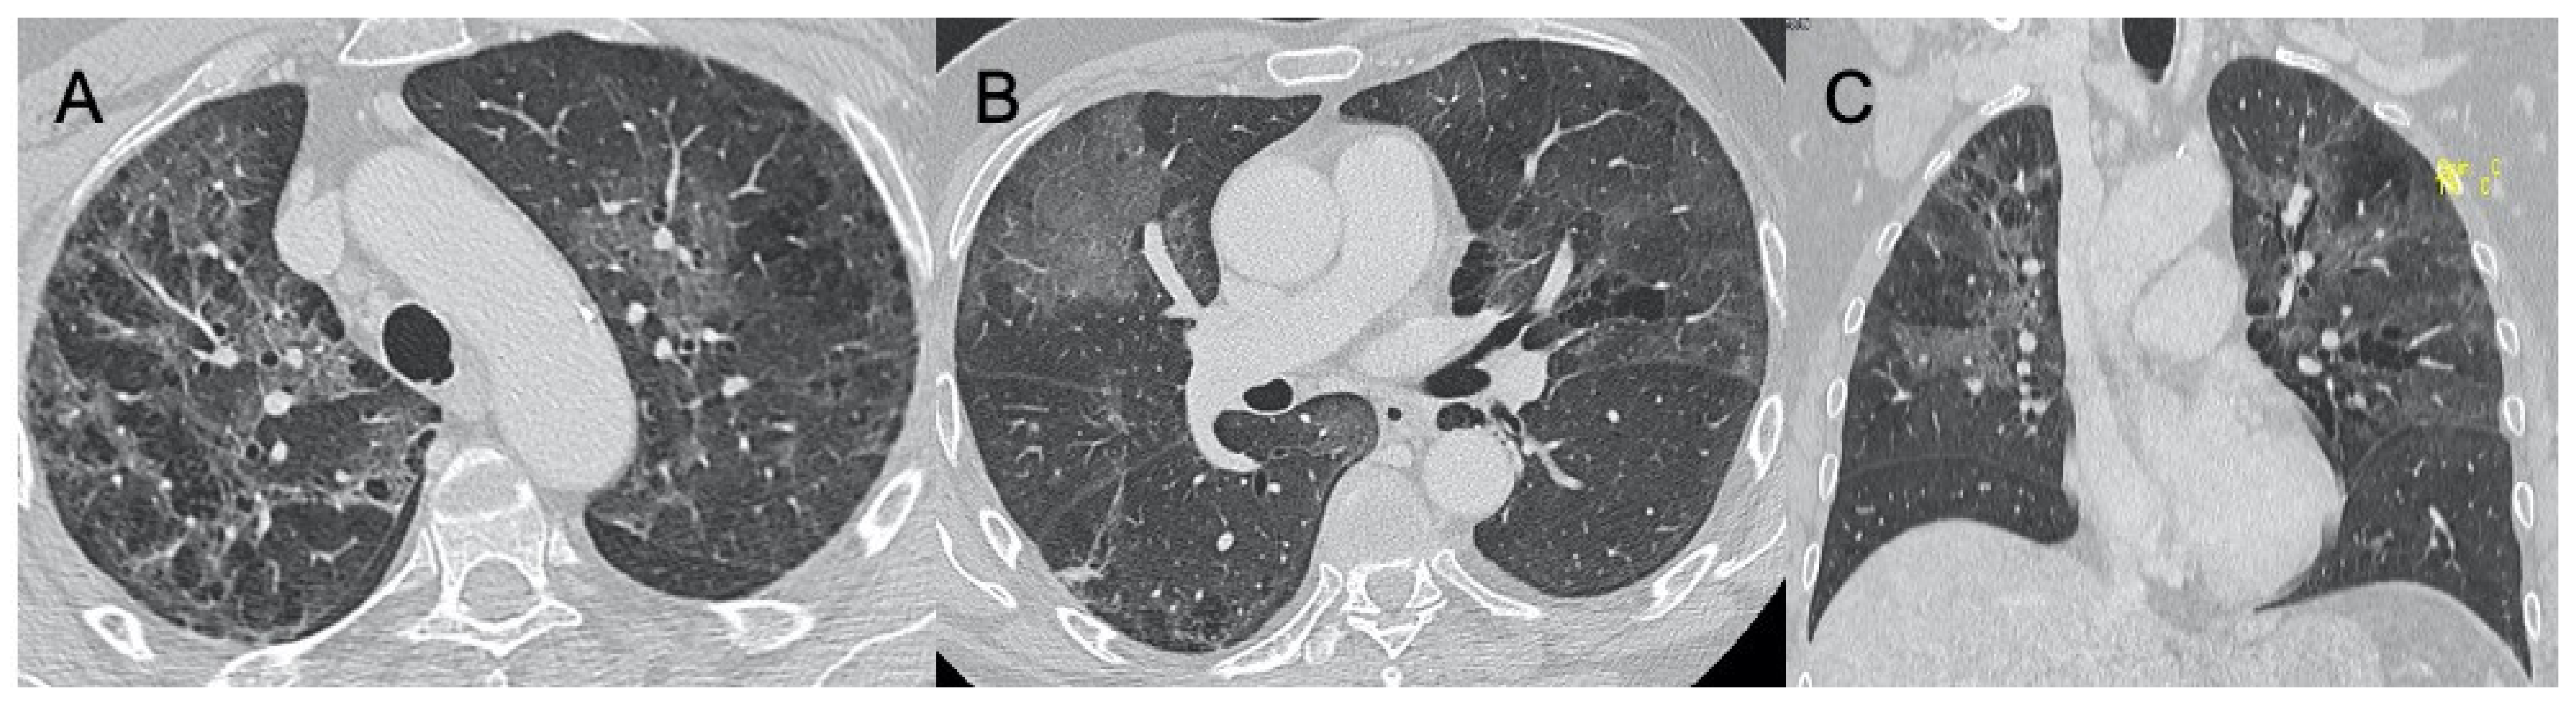
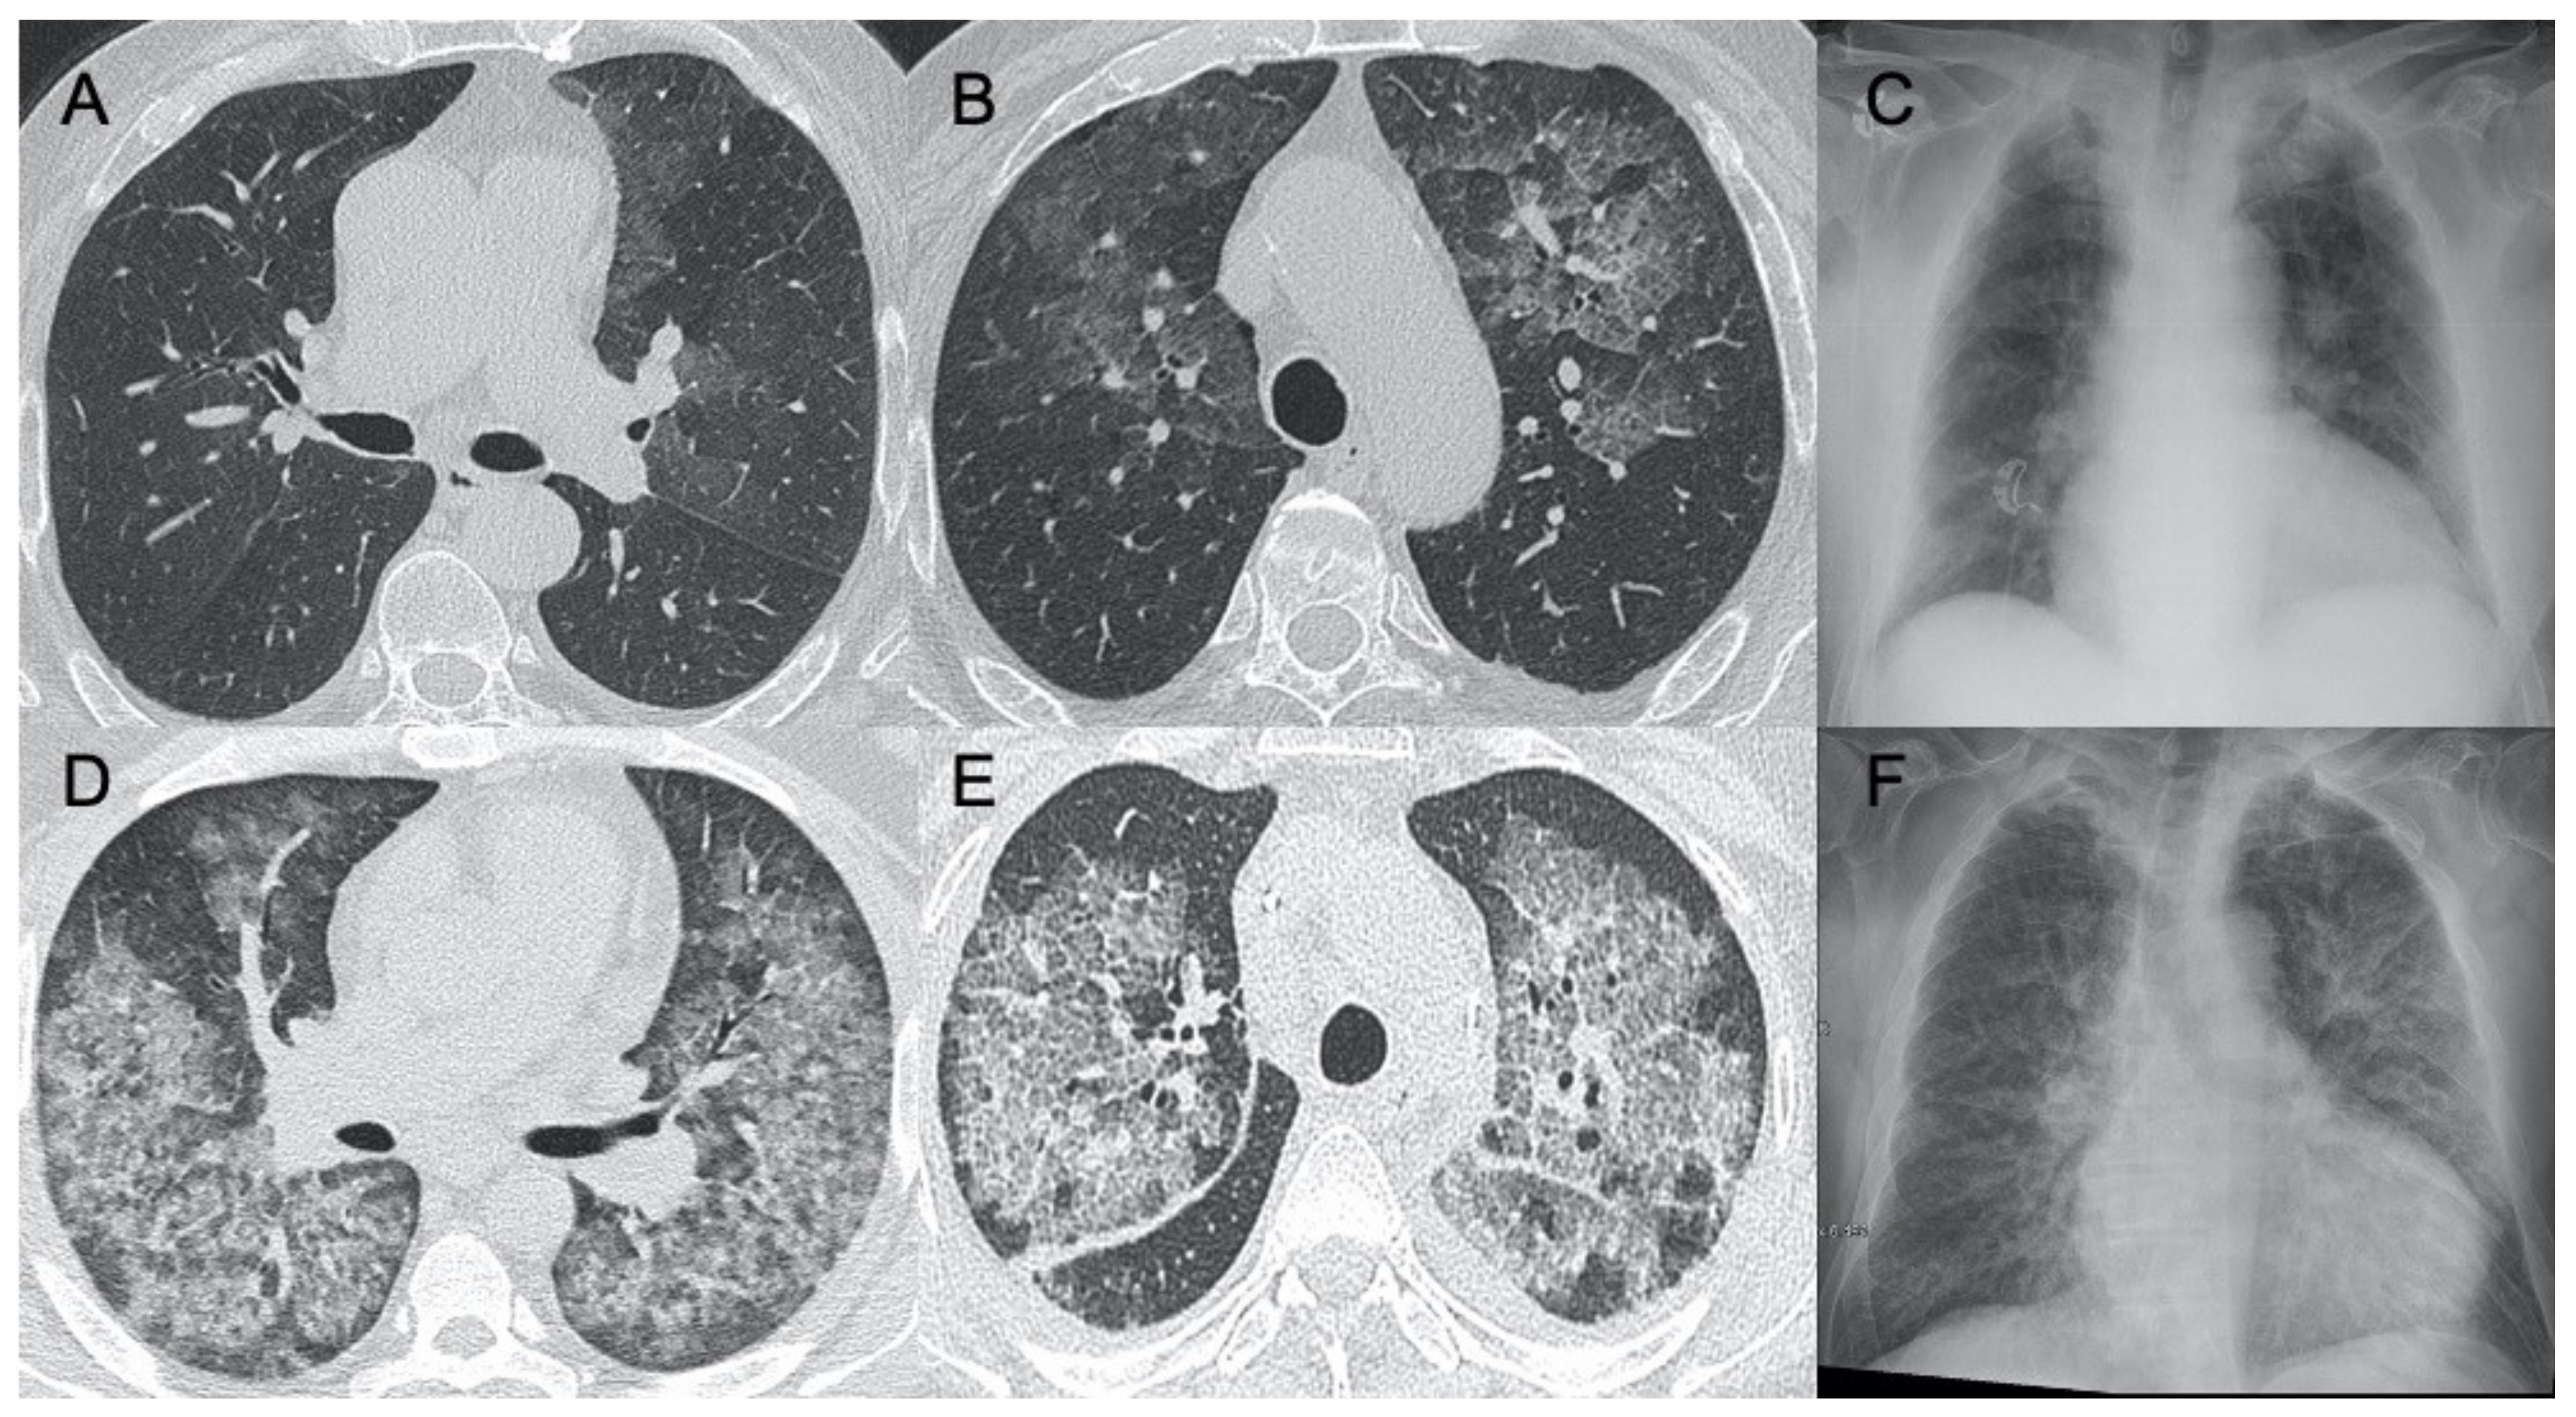
Influenza A, B, and C


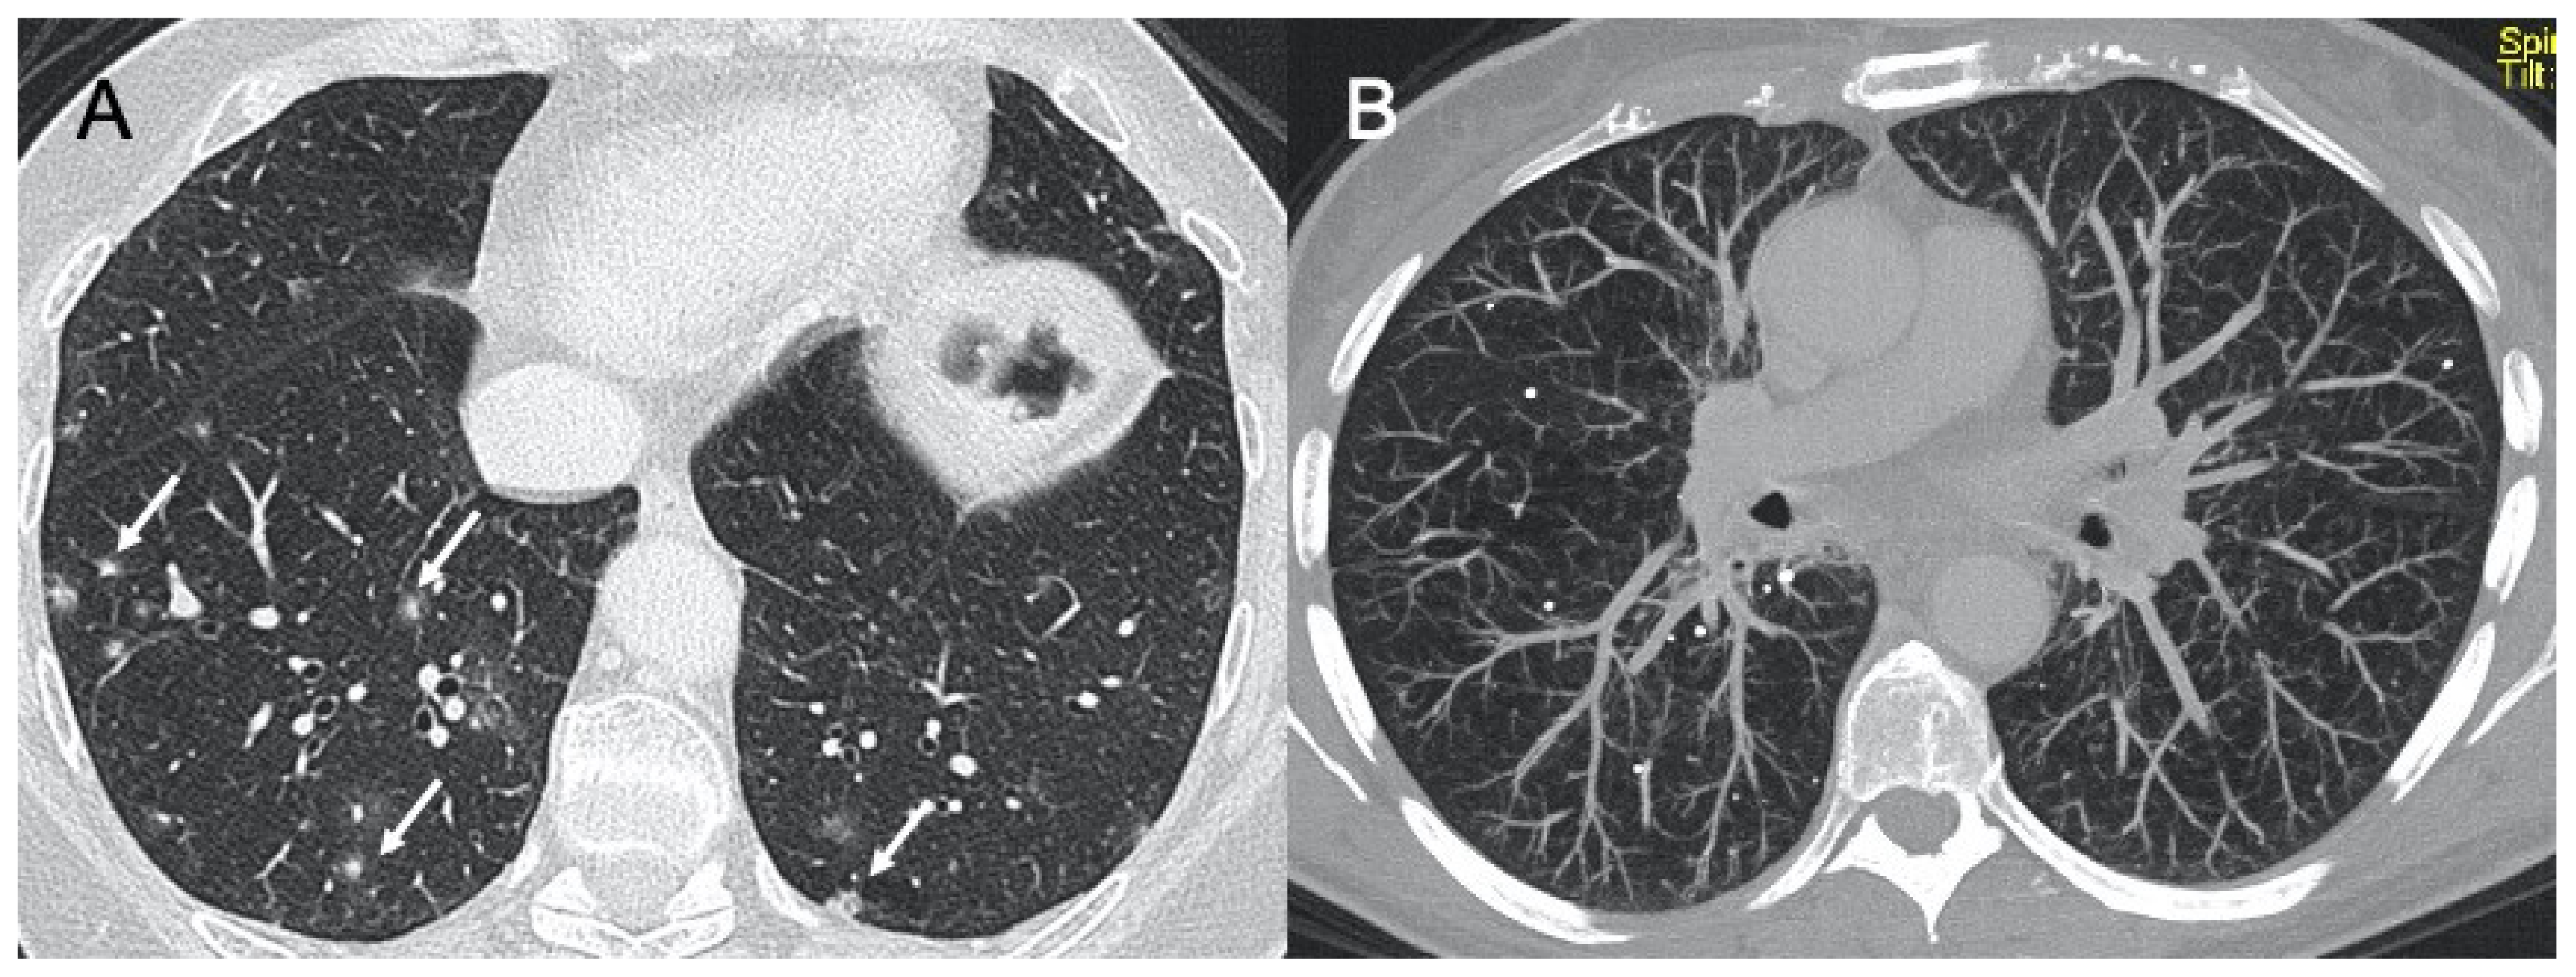
2.1.5. Adenoviridae

2.1.6. Pneumoviridae
Respiratory Syncytial Virus (RSV)
3. Lower Respiratory Tract Viral Infections in Immunocompromised
3.1. Herpesviridae
3.2. HSV Pneumonia

3.3. Varicella-Zoster Virus Infection

3.4. Cytomegalovirus (CMV) Pneumonia

3.5. Epstein–Barr Virus (EBV) Pneumonia

3.6. Paramyxoviridae
3.6.1. Human Parainfluenza Virus (HPIV)
3.6.2. Measles
4. Conclusions
Author Contributions
Funding
Institutional Review Board Statement
Informed Consent Statement
Data Availability Statement
Conflicts of Interest
References
- Falsey, A.R.; Walsh, E.E. Viral Pneumonia in Older Adults. Clin. Infect. Dis. 2006, 42, 518–524. [Google Scholar] [CrossRef] [PubMed]
- Jain, S. Epidemiology of Viral Pneumonia. Clin. Chest Med. 2017, 38, 1–9. [Google Scholar] [CrossRef] [PubMed]
- Reynolds, J.H.; McDonald, G.; Alton, H.; Gordon, S.B. Pneumonia in the immunocompetent patient. Br. J. Radiol. 2010, 83, 998–1009. [Google Scholar] [CrossRef] [PubMed]
- Vigil, K.J.; Adachi, J.A.; Chemaly, R.F. Analytic Review: Viral Pneumonias in Immunocompromised Adult Hosts. J. Intensive Care Med. 2010, 25, 307–326. [Google Scholar] [CrossRef] [PubMed]
- Azoulay, E.; the Nine-i Investigators; Russell, L.; Van De Louw, A.; Metaxa, V.; Bauer, P.; Povoa, P.; Montero, J.G.; Loeches, I.M.; Mehta, S.; et al. Diagnosis of severe respiratory infections in immunocompromised patients. Intensive Care Med. 2020, 46, 298–314. [Google Scholar] [CrossRef]
- Azoulay, E.; Mokart, D.; Kouatchet, A.; Demoule, A.; Lemiale, V. Acute respiratory failure in immunocompromised adults. Lancet Respir. Med. 2019, 7, 173–186. [Google Scholar] [CrossRef]
- Seemungal, T.; Harper-Owen, R.; Bhowmik, A.; Moric, I.; Sanderson, G.; Message, S.; Maccallum, P.; Meade, T.W.; Jeffries, D.J.; Johnston, S.; et al. Respiratory Viruses, Symptoms, and Inflammatory Markers in Acute Exacerbations and Stable Chronic Obstructive Pulmonary Disease. Am. J. Respir. Crit. Care Med. 2001, 164, 1618–1623. [Google Scholar] [CrossRef]
- Sullivan, C.J.; Jordan, M.C. Diagnosis of viral pneumonia. Semin. Respir. Infect. 1988, 3, 148–161. [Google Scholar]
- Couch, R.B.; Englund, J.A. Respiratory Viral Infections in Immunocompetent and Immunocompromised Persons. Am. J. Med. 1997, 102, 2–9. [Google Scholar] [CrossRef]
- Koo, H.J.; Lim, S.; Choe, J.; Choi, S.-H.; Sung, H.; Do, K.-H. Radiographic and CT Features of Viral Pneumonia. Radiographies 2018, 38, 719–739. [Google Scholar] [CrossRef]
- Talbot, H.K.; Falsey, A.R. The Diagnosis of Viral Respiratory Disease in Older Adults. Clin. Infect. Dis. 2010, 50, 747–751. [Google Scholar] [CrossRef]
- Franquet, T. Imaging of Pulmonary Viral Pneumonia. Radiology 2011, 260, 18–39. [Google Scholar] [CrossRef]
- Wang, C.; Horby, P.W.; Hayden, F.G.; Gao, G.F. A novel coronavirus outbreak of global health concern. Lancet 2020, 395, 470–473. [Google Scholar] [CrossRef]
- Giovagnoni, A. Facing the COVID-19 emergency: We can and we do. Radiol. Med. 2020, 125, 337–338. [Google Scholar] [CrossRef]
- ACR Recommendations for the Use of Chest Radiography and Computed Tomography (CT) for Suspected COVID-19 Infection. American College of Radiology. Available online: https://www.acr.org/Advocacy-and-Economics/ACR-Position-Statements/Recommendations-for-Chest-Radiography-and-CT-for-Suspected-COVID-19-infection (accessed on 22 March 2020).
- COVID-19 SIUMB INFORMS. Available online: https://www.sirm.org/wp-content/uploads/2020/03/DI-COVID-19-documento-intersocietario.pdf (accessed on 23 April 2020).
- Albano, D.; On behalf of the Young SIRM Working Group; Bruno, A.; Bruno, F.; Calandri, M.; Caruso, D.; Clemente, A.; Coppolino, P.; Cozzi, D.; De Robertis, R.; et al. Impact of coronavirus disease 2019 (COVID-19) emergency on Italian radiologists: A national survey. Eur. Radiol. 2020, 30, 6635–6644. [Google Scholar] [CrossRef] [PubMed]
- Cozzi, D.; Albanesi, M.; Cavigli, E.; Moroni, C.; Bindi, A.; Luvarà, S.; Lucarini, S.; Busoni, S.; Mazzoni, L.N.; Miele, V. Chest X-ray in new Coronavirus Disease 2019 (COVID-19) infection: Findings and correlation with clinical outcome. Radiol. Med. 2020, 125, 730–737. [Google Scholar] [CrossRef]
- Moroni, C.; Cozzi, D.; Albanesi, M.; Cavigli, E.; Bindi, A.; Luvarà, S.; Busoni, S.; Mazzoni, L.N.; Grifoni, S.; Nazerian, P.; et al. Chest X-ray in the emergency department during COVID-19 pandemic descending phase in Italy: Correlation with patients’ outcome. La Radiol. Med. 2021, 126, 661–668. [Google Scholar] [CrossRef]
- Ye, Z.; Zhang, Y.; Wang, Y.; Huang, Z.; Song, B. Chest CT manifestations of new coronavirus disease 2019 (COVID-19): A pictorial review. Eur. Radiol. 2020, 30, 4381–4389. [Google Scholar] [CrossRef]
- Zhou, S.; Zhu, T.; Wang, Y.; Xia, L. Imaging features and evolution on CT in 100 COVID-19 pneumonia patients in Wuhan, China. Eur. Radiol. 2020, 30, 1–9. [Google Scholar] [CrossRef]
- Chung, M.; Bernheim, A.; Mei, X.; Zhang, N.; Huang, M.; Zeng, X.; Cui, J.; Xu, W.; Yang, Y.; Fayad, Z.A.; et al. CT Imaging Features of 2019 Novel Coronavirus (2019-nCoV). Radiology 2020, 295, 202–207. [Google Scholar] [CrossRef]
- Caruso, D.; Polici, M.; Zerunian, M. Quantitative chest CT analysis in discriminating COVID-19 from non-COVID-19 patients. Radiol. Med. 2021, 126, 243–249. [Google Scholar] [CrossRef] [PubMed]
- Shi, H.; Han, X.; Jiang, N.; Cao, Y.; Alwalid, O.; Gu, J.; Fan, Y.; Zheng, C. Radiological findings from 81 patients with COVID-19 pneumonia in Wuhan, China: A descriptive study. Lancet Infect. Dis. 2020, 20, 425–434. [Google Scholar] [CrossRef]
- Li, Y.; Xia, L. Coronavirus Disease 2019 (COVID-19): Role of Chest CT in Diagnosis and Management. Am. J. Roentgenol. 2020, 214, 1280–1286. [Google Scholar] [CrossRef] [PubMed]
- Shi, H.; Han, X.; Cao, Y.; Alwalid, O.; Zheng, C. CT screening for early diagnosis of SARS-CoV-2 infection—Authors’ reply. Lancet Infect. Dis. 2020, 20, 1011. [Google Scholar] [CrossRef]
- Li, K.; Wu, J.; Wu, F.; Guo, D.; Chen, L.; Fang, Z.; Li, C. The Clinical and Chest CT Features Associated with Severe and Critical COVID-19 Pneumonia. Investig. Radiol. 2020, 55, 327–331. [Google Scholar] [CrossRef]
- Xiong, Y.; Sun, D.; Liu, Y.; Fan, Y.; Zhao, L.; Li, X.; Zhu, W. Clinical and High-Resolution CT Features of the COVID-19 Infection: Comparison of the Initial and Follow-up Changes. Investig. Radiol. 2020, 55, 332–339. [Google Scholar] [CrossRef]
- Smith, M.J. Point-of-care lung ultrasound in patients with COVID-19 —A narrative review. Anaesthesia 2020, 75, 1096–1104. [Google Scholar] [CrossRef]
- Peng, Q.-Y.; Chinese Critical Care Ultrasound Study Group (CCUSG); Wang, X.-T.; Zhang, L.-N. Findings of lung ultrasonography of novel corona virus pneumonia during the 2019–2020 epidemic. Intensive Care Med. 2020, 46, 849–850. [Google Scholar] [CrossRef]
- Zhang, L.; Zhu, F.; Xie, L.; Wang, C.; Wang, J.; Chen, R.; Jia, P.; Guan, H.Q.; Peng, L.; Chen, Y.; et al. Clinical characteristics of COVID-19-infected cancer patients: A retrospective case study in three hospitals within Wuhan, China. Ann. Oncol. 2020, 31, 894–901. [Google Scholar] [CrossRef]
- Neri, E.; Coppola, F.; Miele, V.; Bibbolino, C.; Grassi, R. Artificial intelligence: Who is responsible for the diagnosis? Radiol. Med. 2020, 125, 517–521. [Google Scholar] [CrossRef]
- Geis, J.R.; Brady, A.P.; Wu, C.C.; Spencer, J.; Ranschaert, E.; Jaremko, J.L.; Langer, S.G.; Kits, A.B.; Birch, J.; Shields, W.F.; et al. Ethics of artificial intelligence in radiology: Summary of the joint European and North American multisociety statement. Can. Assoc. Radiol. J. 2019, 70, 329–334. [Google Scholar] [CrossRef]
- Neri, E.; Miele, V.; Coppola, F.; Grassi, R. Use of CT and artificial intelligence in suspected or COVID-19 positive patients: Statement of the Italian Society of Medical and Interventional Radiology. Radiol. Med. 2020, 125, 505–508. [Google Scholar] [CrossRef]
- Grassi, R.; Cappabianca, S.; Urraro, F.; Feragalli, B.; Montanelli, A.; Patelli, G.; Granata, V.; Giacobbe, G.; Russo, G.M.; Grillo, A.; et al. Chest CT Computerized Aided Quantification of PNEUMONIA Lesions in COVID-19 Infection: A Comparison among Three Commercial Software. Int. J. Env. Res. Public Health 2020, 17, 6914. [Google Scholar] [CrossRef]
- Hijawi, B.; Abdallat, M.; Sayaydeh, A.; Alqasrawi, S.; Haddadin, A.; Jaarour, N.; El Sheikh, S.; Alsanouri, T. Novel coronavirus infections in Jordan, April 2012: Epidemiological findings from a retrospective investigation. East. Mediterr. Health J. 2013, 19, S12–S18. [Google Scholar] [CrossRef]
- Assiri, A.; Al-Tawfiq, J.A.; Al-Rabeeah, A.; Al-Rabiah, F.; Al-Hajjar, S.; Al-Barrak, A.; Flemban, H.; Al-Nassir, W.N.; Balkhy, H.H.; Al-Hakeem, R.F.; et al. Epidemiological, demographic, and clinical characteristics of 47 cases of Middle East respiratory syndrome coronavirus disease from Saudi Arabia: A descriptive study. Lancet Infect. Dis. 2013, 13, 752–761. [Google Scholar] [CrossRef]
- Das, K.M.; Lee, E.Y.; Al Jawder, S.E.; Enani, M.A.; Singh, R.; Skakni, L.; Al-Nakshabandi, N.; Aldossari, K.; Larsson, S.G. Acute Middle East Respiratory Syndrome Coronavirus: Temporal Lung Changes Observed on the Chest Radiographs of 55 Patients. Am. J. Roentgenol. 2015, 205, W267–S274. [Google Scholar] [CrossRef]
- Das, K.M.; Lee, E.Y.; Enani, M.A.; Aljawder, S.E.; Singh, R.; Bashir, S.; Al-Nakshbandi, N.; Aldossari, K.; Larsson, S.G. CT Correlation With Outcomes in 15 Patients With Acute Middle East Respiratory Syndrome Coronavirus. Am. J. Roentgenol. 2015, 204, 736–742. [Google Scholar] [CrossRef]
- Ooi, G.C.; Daqing, M. SARS: Radiological features. Respirology 2003, 8, S15–S19. [Google Scholar] [CrossRef]
- Ooi, G.C.; Khong, P.L.; Müller, N.L.; Yiu, W.C.; Zhou, L.J.; Ho, J.; Lam, B.; Nicolaou, S.; Tsang, K.W.T. Severe Acute Respiratory Syndrome: Temporal Lung Changes at Thin-Section CT in 30 Patients. Radiology 2004, 230, 836–844. [Google Scholar] [CrossRef]
- Wong, K.T.; Antonio, G.E.; Hui, D.; Lee, N.; Yuen, E.H.Y.; Wu, A.; Leung, C.B.; Rainer, T.; Cameron, P.; Chung, S.S.C.; et al. Severe Acute Respiratory Syndrome: Radiographic Appearances and Pattern of Progression in 138 Patients. Radiology 2003, 228, 401–406. [Google Scholar] [CrossRef]
- Carotti, M.; Salaffi, F.; Sarzi-Puttini, P.; Agostini, A.; Borgheresi, A.; Minorati, D.; Galli, M.; Marotto, D.; Giovagnoni, A. Chest CT features of coronavirus disease 2019 (COVID-19) pneumonia: Key points for radiologists. Radiol. Med. 2020, 125, 636–646. [Google Scholar] [CrossRef]
- Hosseiny, M.; Kooraki, S.; Gholamrezanezhad, A.; Reddy, S.; Myers, L. Radiology Perspective of Coronavirus Disease 2019 (COVID-19): Lessons From Severe Acute Respiratory Syndrome and Middle East Respiratory Syndrome. Am. J. Roentgenol. 2020, 214, 1078–1082. [Google Scholar] [CrossRef]
- Borghesi, A.; Zigliani, A.; Masciullo, R.; Golemi, S.; Maculotti, P.; Farina, D.; Maroldi, R. Radiographic severity index in COVID-19 pneumonia: Relationship to age and sex in 783 italian patients. Radiol. Med. 2020, 125, 461–464. [Google Scholar] [CrossRef]
- Wright, P.F.; Kirkland, K.B.; Modlin, J.F. When to Consider the Use of Antibiotics in the Treatment of 2009 H1N1 Influenza–Associated Pneumonia. N. Engl. J. Med. 2009, 361, e112. [Google Scholar] [CrossRef]
- Leung, A.N.; Gosselin, M.V.; Napper, C.H.; Braun, S.G.; Hu, W.W.; Wong, R.M.; Gasman, J. Pulmonary Infections after Bone Marrow Transplantation: Clinical and Radiographic Findings. Radiology 1999, 210, 699–710. [Google Scholar] [CrossRef] [PubMed]
- Oikonomou, A.; Müller, N.L.; Nantel, S. Radiographic and High-Resolution CT Findings of Influenza Virus Pneumonia in Patients with Hematologic Malignancies. Am. J. Roentgenol. 2003, 181, 507–511. [Google Scholar] [CrossRef]
- Kloth, C.; Forler, S.; Gatidis, S.; Beck, R.; Spira, D.; Nikolaou, K.; Horger, M. Comparison of chest-CT findings of Influenza virus-associated pneumonia in immunocompetent vs. immunocompromised patients. Eur. J. Radiol. 2015, 84, 1177–1183. [Google Scholar] [CrossRef]
- Ajlan, A.M.; Quiney, B.; Nicolaou, S.; Müller, N.L. Swine-Origin Influenza A (H1N1) Viral Infection: Radiographic and CT Findings. Am. J. Roentgenol. 2009, 193, 1494–1499. [Google Scholar] [CrossRef]
- Qureshi, N.R.; Hien, T.T.; Farrar, J.; Gleeson, F.V. The Radiologic Manifestations of H5N1 Avian Influenza. J. Thorac. Imaging 2006, 21, 259–264. [Google Scholar] [CrossRef]
- Valente, T.; Lassandro, F.; Marino, M.; Squillante, F.; Aliperta, M.; Muto, R. H1N1 pneumonia: Our experience in 50 patients with a severe clinical course of novel swine-origin influenza A (H1N1) virus (S-OIV). Radiol. Med. 2012, 117, 165–184. [Google Scholar] [CrossRef]
- Mineo, G.; Ciccarese, F.; Modolon, C.; Landini, M.P.; Valentino, M.; Zompatori, M. Post-ARDS pulmonary fibrosis in patients with H1N1 pneumonia: Role of follow-up CT. Radiol. Med. 2012, 117, 185–200. [Google Scholar] [CrossRef] [PubMed]
- Lin, L.; Fu, G.; Chen, S.; Tao, J.; Qian, A.; Yang, Y.; Wang, M. CT Manifestations of Coronavirus Disease (COVID-19) Pneumonia and Influenza Virus Pneumonia: A Comparative Study. Am. J. Roentgenol. 2021, 216, 71–79. [Google Scholar] [CrossRef]
- Buckwalter, S.P.; Teo, R.; Espy, M.J.; Sloan, L.M.; Smith, T.F.; Pritt, B.S. Real-time qualitative PCR for 57 human adenovirus types from multiple specimen sources. J. Clin. Microbiol. 2012, 50, 766–771. [Google Scholar] [CrossRef] [PubMed]
- Marti-Bonmati, L.; Perales, F.R.; Catala, F.; Mata, J.M.; Calonge, E. CT findings in Swyer-James syndrome. Radiology 1989, 172, 477–480. [Google Scholar] [CrossRef]
- Shi, H.-S.; Yang, F.; Han, P.; Zheng, J.-L.; Feng, G.-S.; Liu, Y.-H.; Tian, Z.-L.; Liu, G. Findings of chest radiograph and spiral computed tomography in Swyer-James syndrome. Chin. Med Sci. J. 2006, 21, 53–56. [Google Scholar]
- Lucaya, J.; Gartner, S.; García-Peña, P.; Cobos, N.; Roca, I.; Liñan, S. Spectrum of manifestations of Swyer-James-MacLeod syndrome. J. Comput. Assist. Tomogr. 1998, 22, 592–597. [Google Scholar] [CrossRef]
- Pierangeli, A.; Scagnolari, C.; Antonelli, G. Respiratory syncytial virus. Minerva Pediatr. 2018, 70, 553–565. [Google Scholar] [CrossRef]
- Miller, W.T., Jr.; Mickus, T.J.; Barbosa, E., Jr.; Mullin, C.; Van Deerlin, V.M.; Shiley, K.T. CT of viral lower respiratory tract infections in adults: Comparison among viral organisms and between viral and bacterial infections. Am. J. Roentgenol. 2011, 197, 1088–1095. [Google Scholar] [CrossRef]
- Aquino, S.L.; Dunagan, D.P.; Chiles, C.; Haponik, E.F.; Chiles, C.; Haponik, E.F. Herpes simplex virus 1 pneumonia: Patterns on CT scans and conventional chest radiographs. J. Comput. Assist. Tomogr. 1998, 22, 795–800. [Google Scholar] [CrossRef]
- Gasparetto, E.L.; Escuissato, D.L.; Inoue, C.; Marchiori, E.; Müller, N.L. Herpes simplex virus type 2 pneumonia after bone marrow transplantation: High-resolution CT findings in 3patients. J. Thorac. Imaging. 2005, 20, 71–73. [Google Scholar] [CrossRef]
- Douglas, R.G., Jr.; Couch, R.B. A prospective study of chronic herpes simplex virus infection and recurrent herpes labialis in humans. J. Immunol. 1970, 104, 289–295. [Google Scholar] [PubMed]
- Nash, G. Necrotizing tracheobronchitis and bronchopneumonia consistent with herpetic infection. Hum. Pathol. 1972, 3, 283–291. [Google Scholar] [CrossRef]
- Ramsey, P.G.; Fife, K.H.; Hackman, R.C.; Meyers, J.D.; Corey, L. Herpes Simplex Virus Pneumonia. Ann. Intern. Med. 1982, 97, 813–820. [Google Scholar] [CrossRef] [PubMed]
- Umans, U.; Golding, R.; Duraku, S.; Manoliu, R. Herpes simplex virus 1 pneumonia: Conventional chest radiograph pattern. Eur. Radiol. 2001, 11, 990–994. [Google Scholar] [CrossRef]
- Chong, S.; Kim, T.S.; Cho, E.Y. Herpes simplex virus pneumonia: High-resolution CT findings. Br. J. Radiol. 2010, 83, 585–589. [Google Scholar] [CrossRef]
- AlAnezi, M. Varicella pneumonia in adults: 13 years’ experience with review of literature. Ann. Thorac. Med. 2007, 2, 163–165. [Google Scholar] [CrossRef]
- Kim, J.S.; Ryu, C.W.; Lee, S.I.; Sung, D.W.; Park, C.K. High-resolution CT findings of varicella-zoster pneumonia. Am. J. Roentgenol. 1999, 172, 113–116. [Google Scholar] [CrossRef]
- Kim, E.A.; Lee, K.S.; Primack, S.L.; Yoon, H.K.; Byun, H.S.; Kim, T.S.; Suh, G.Y.; Kwon, O.J.; Han, J. Viral Pneumonias in Adults: Radiologic and Pathologic Findings. Radiographics 2002, 22, S137–S149. [Google Scholar] [CrossRef]
- McGuinness, G.; Scholes, J.V.; Garay, S.M.; Leitman, B.; McCauley, D.I.; Naidich, D. Cytomegalovirus pneumonitis: Spectrum of parenchymal CT findings with pathologic correlation in 21 AIDS patients. Radiology 1994, 192, 451–459. [Google Scholar] [CrossRef]
- Kang, E.-Y.; Patz, E.F.; Müller, N.L. Cytomegalovirus Pneumonia in Transplant Patients: CT Findings. J. Comput. Assist. Tomogr. 1996, 20, 295–299. [Google Scholar] [CrossRef]
- Moon, J.H.; Kim, E.A.; Lee, K.S.; Kim, T.S.; Jung, K.-J.; Song, J.-H. Cytomegalovirus Pneumonia: High-Resolution CT Findings in Ten Non-AIDS Immunocompromised Patients. Korean J. Radiol. 2000, 1, 73–78. [Google Scholar] [CrossRef]
- McKinnell, J.A.; Cannella, A.P.; Kunz, D.F. Pneumocystis pneumonia in hospitalized patients: A detailed examination of symptoms, management, and outcomes in human immunodeficiency virus (HIV)-infected and HIV-uninfected persons. Transpl. Infect. Dis. 2012, 14, 510–518. [Google Scholar] [CrossRef]
- Vogel, M.N.; Brodoefel, H.; Hierl, T.; Beck, R.; Bethge, W.A.; Claussen, C.D.; Horger, M.S. Differences and similarities of cytomegalovirus and pneumocystis pneumonia in HIV-negative immunocompromised patients—Thin section CT morphology in the early phase of the disease. Br. J. Radiol. 2007, 80, 516–523. [Google Scholar] [CrossRef]
- Gautschi, O.; Berger, C.; Gubler, J.; Laube, I. Acute respiratory failure and cerebral haemorrhage due to primary Epstein-Barr virus infection. Respiration 2003, 70, 419–422. [Google Scholar] [CrossRef]
- Miyake, H.; Matsumoto, A.; Komatsu, E.; Matsumoto, S.; Takeoka, H.; Mori, H.; Yokoyama, S. Infectious Mononucleosis with Pulmonary Consolidation. J. Thorac. Imaging 1996, 11, 158–160. [Google Scholar] [CrossRef]
- Chien, J.W.; Johnson, J.L. Viral pneumonias. Epidemic respiratory viruses. Postgrad. Med. 2000, 107, 41–42. [Google Scholar] [CrossRef]
- Shah, D.P.; Shah, P.K.; Azzi, J.M.; Chemaly, R.F. Parainfluenza virus infections in hematopoietic cell transplant recipients and he-matologic malignancy patients: A systematic review. Cancer Lett. 2016, 370, 358–364. [Google Scholar] [CrossRef]
- Choi, S.-H.; Hong, S.-B.; Ko, G.-B.; Lee, Y.; Park, H.J.; Park, S.-Y.; Moon, S.M.; Cho, O.-H.; Park, K.-H.; Chong, Y.P.; et al. Viral Infection in Patients with Severe Pneumonia Requiring Intensive Care Unit Admission. Am. J. Respir. Crit. Care Med. 2012, 186, 325–332. [Google Scholar] [CrossRef]
- Kim, M.C.; Kim, M.Y.; Lee, H.J. CT findings in viral lower respiratory tract infections caused by parainfluenza virus, influenza virus and respiratory syncytial virus. Medicine 2016, 95, e4003. [Google Scholar] [CrossRef]
- Moss, W.J. Measles. Lancet 2017, 390, 2490–2501. [Google Scholar] [CrossRef]
- Rota, P.A.; Moss, W.J.; Takeda, M. Measles. Nat. Rev. Dis. Primers 2016, 2, 16049. [Google Scholar] [CrossRef]
- Carrillo-Santisteve, P.; Lopalco, P.L. Measles still spreads in Europe: Who is responsible for the failure to vaccinate? Clin. Microbiol. Infect. 2012, 18, 50–56. [Google Scholar] [CrossRef]
- Cockbain, B.C.; Bharucha, T.; Irish, D.; Jacobs, M. Measles in older children and adults. BMJ 2017, 356, j426. [Google Scholar] [CrossRef]
- Yasunaga, H.; Shi, Y.; Takeuci, M.; Horiguchi, H.; Hashimoto, H.; Matsuda, S.; Ohe, K. Measles-related hospitalizations and compli-cations in Japan, 2007–2008. Intern Med. 2010, 49, 1965–1970. [Google Scholar] [CrossRef][Green Version]
- Albarello, F.; Cristofaro, M.; Rizzi, E.B.; Giancola, M.L.; Nicastri, E.; Schininà, V. Pulmonary measles disease: Old and new imaging tools. Radiol. Med. 2018, 123, 935–943. [Google Scholar] [CrossRef]
- Choi, H.; Qi, X.; Yoon, S.H.; Park, S.J.; Lee, K.H.; Kim, J.Y.; Lee, Y.K.; Ko, H.; Kim, K.H.; Park, C.M.; et al. Extension of Coronavirus Disease 2019 on Chest CT and Implications for Chest Radiographic Interpretation. Radiol. Cardiothorac. Imaging 2020, 2, e200107. [Google Scholar] [CrossRef]

| Virus | Chest X-ray Signs | Chest CT Signs | Figure in the Text |
|---|---|---|---|
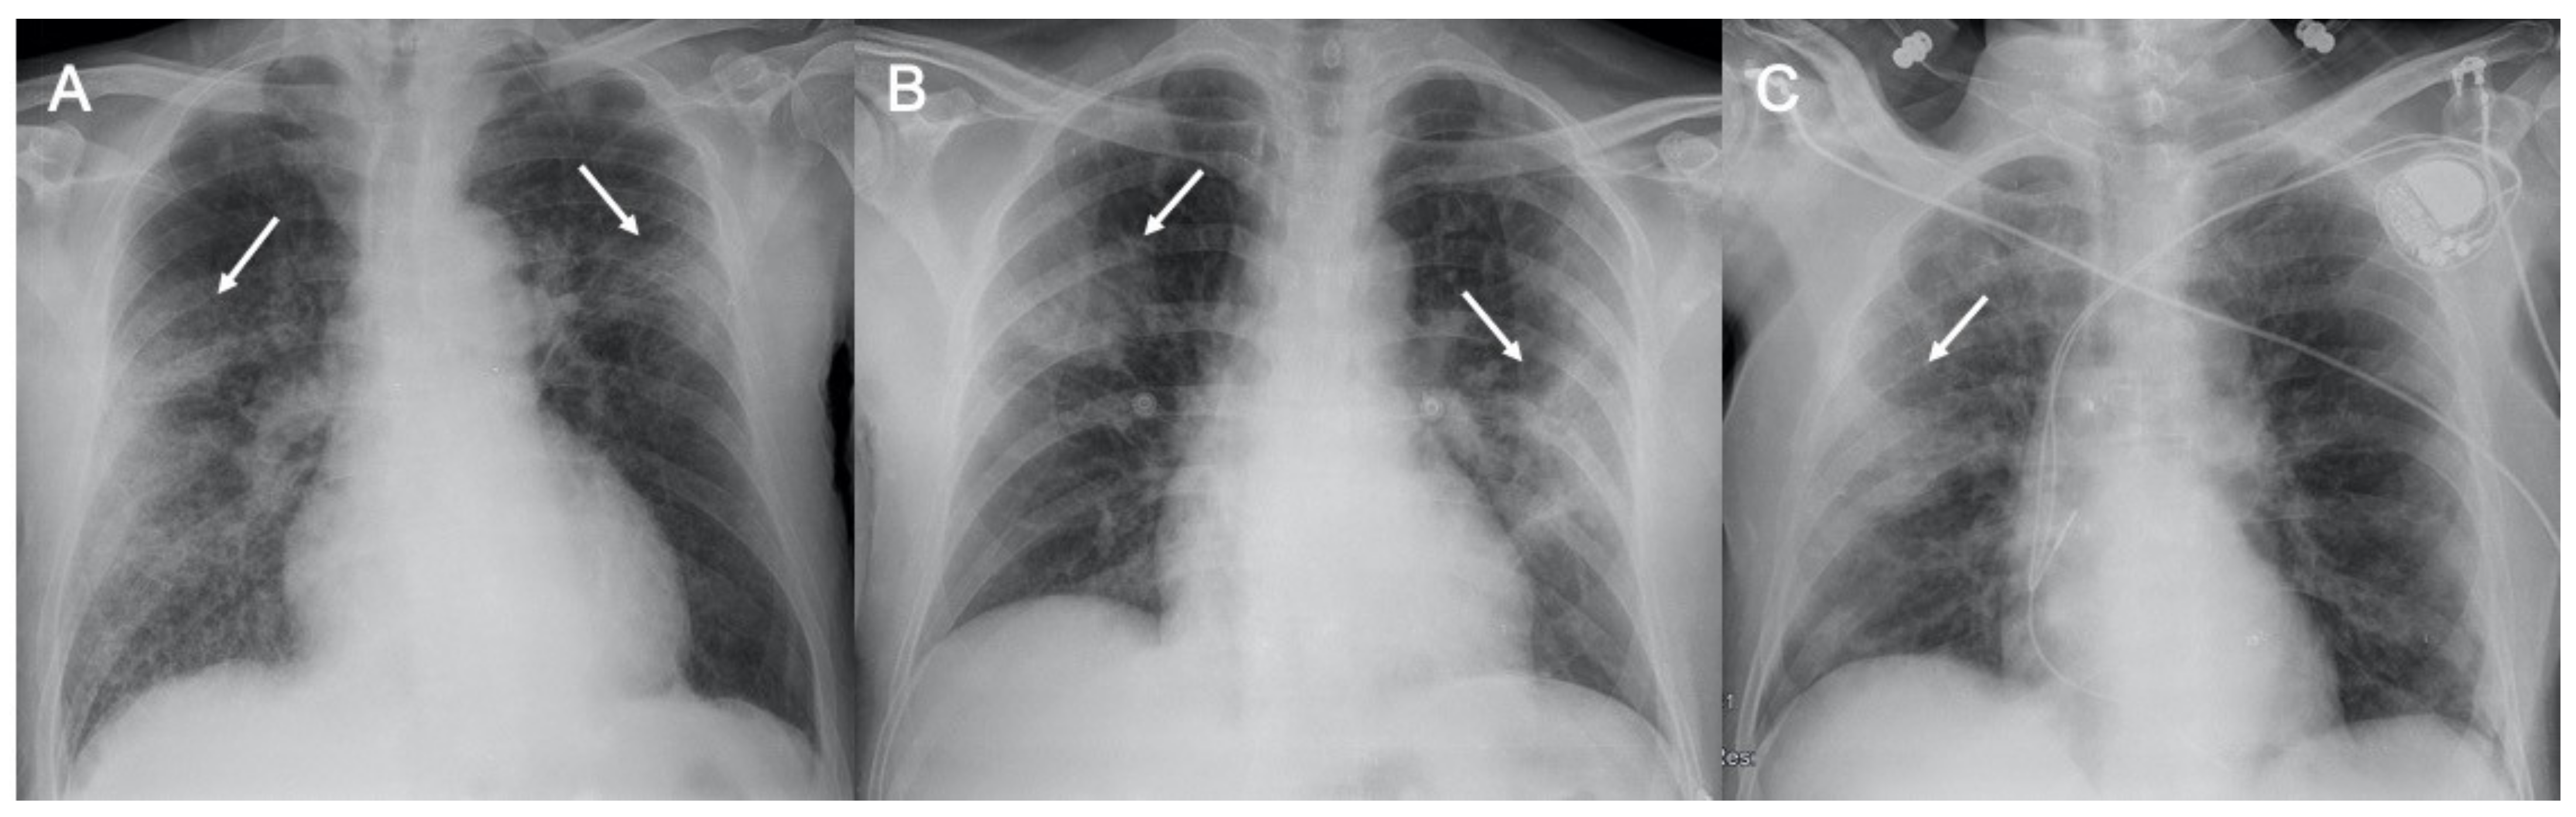
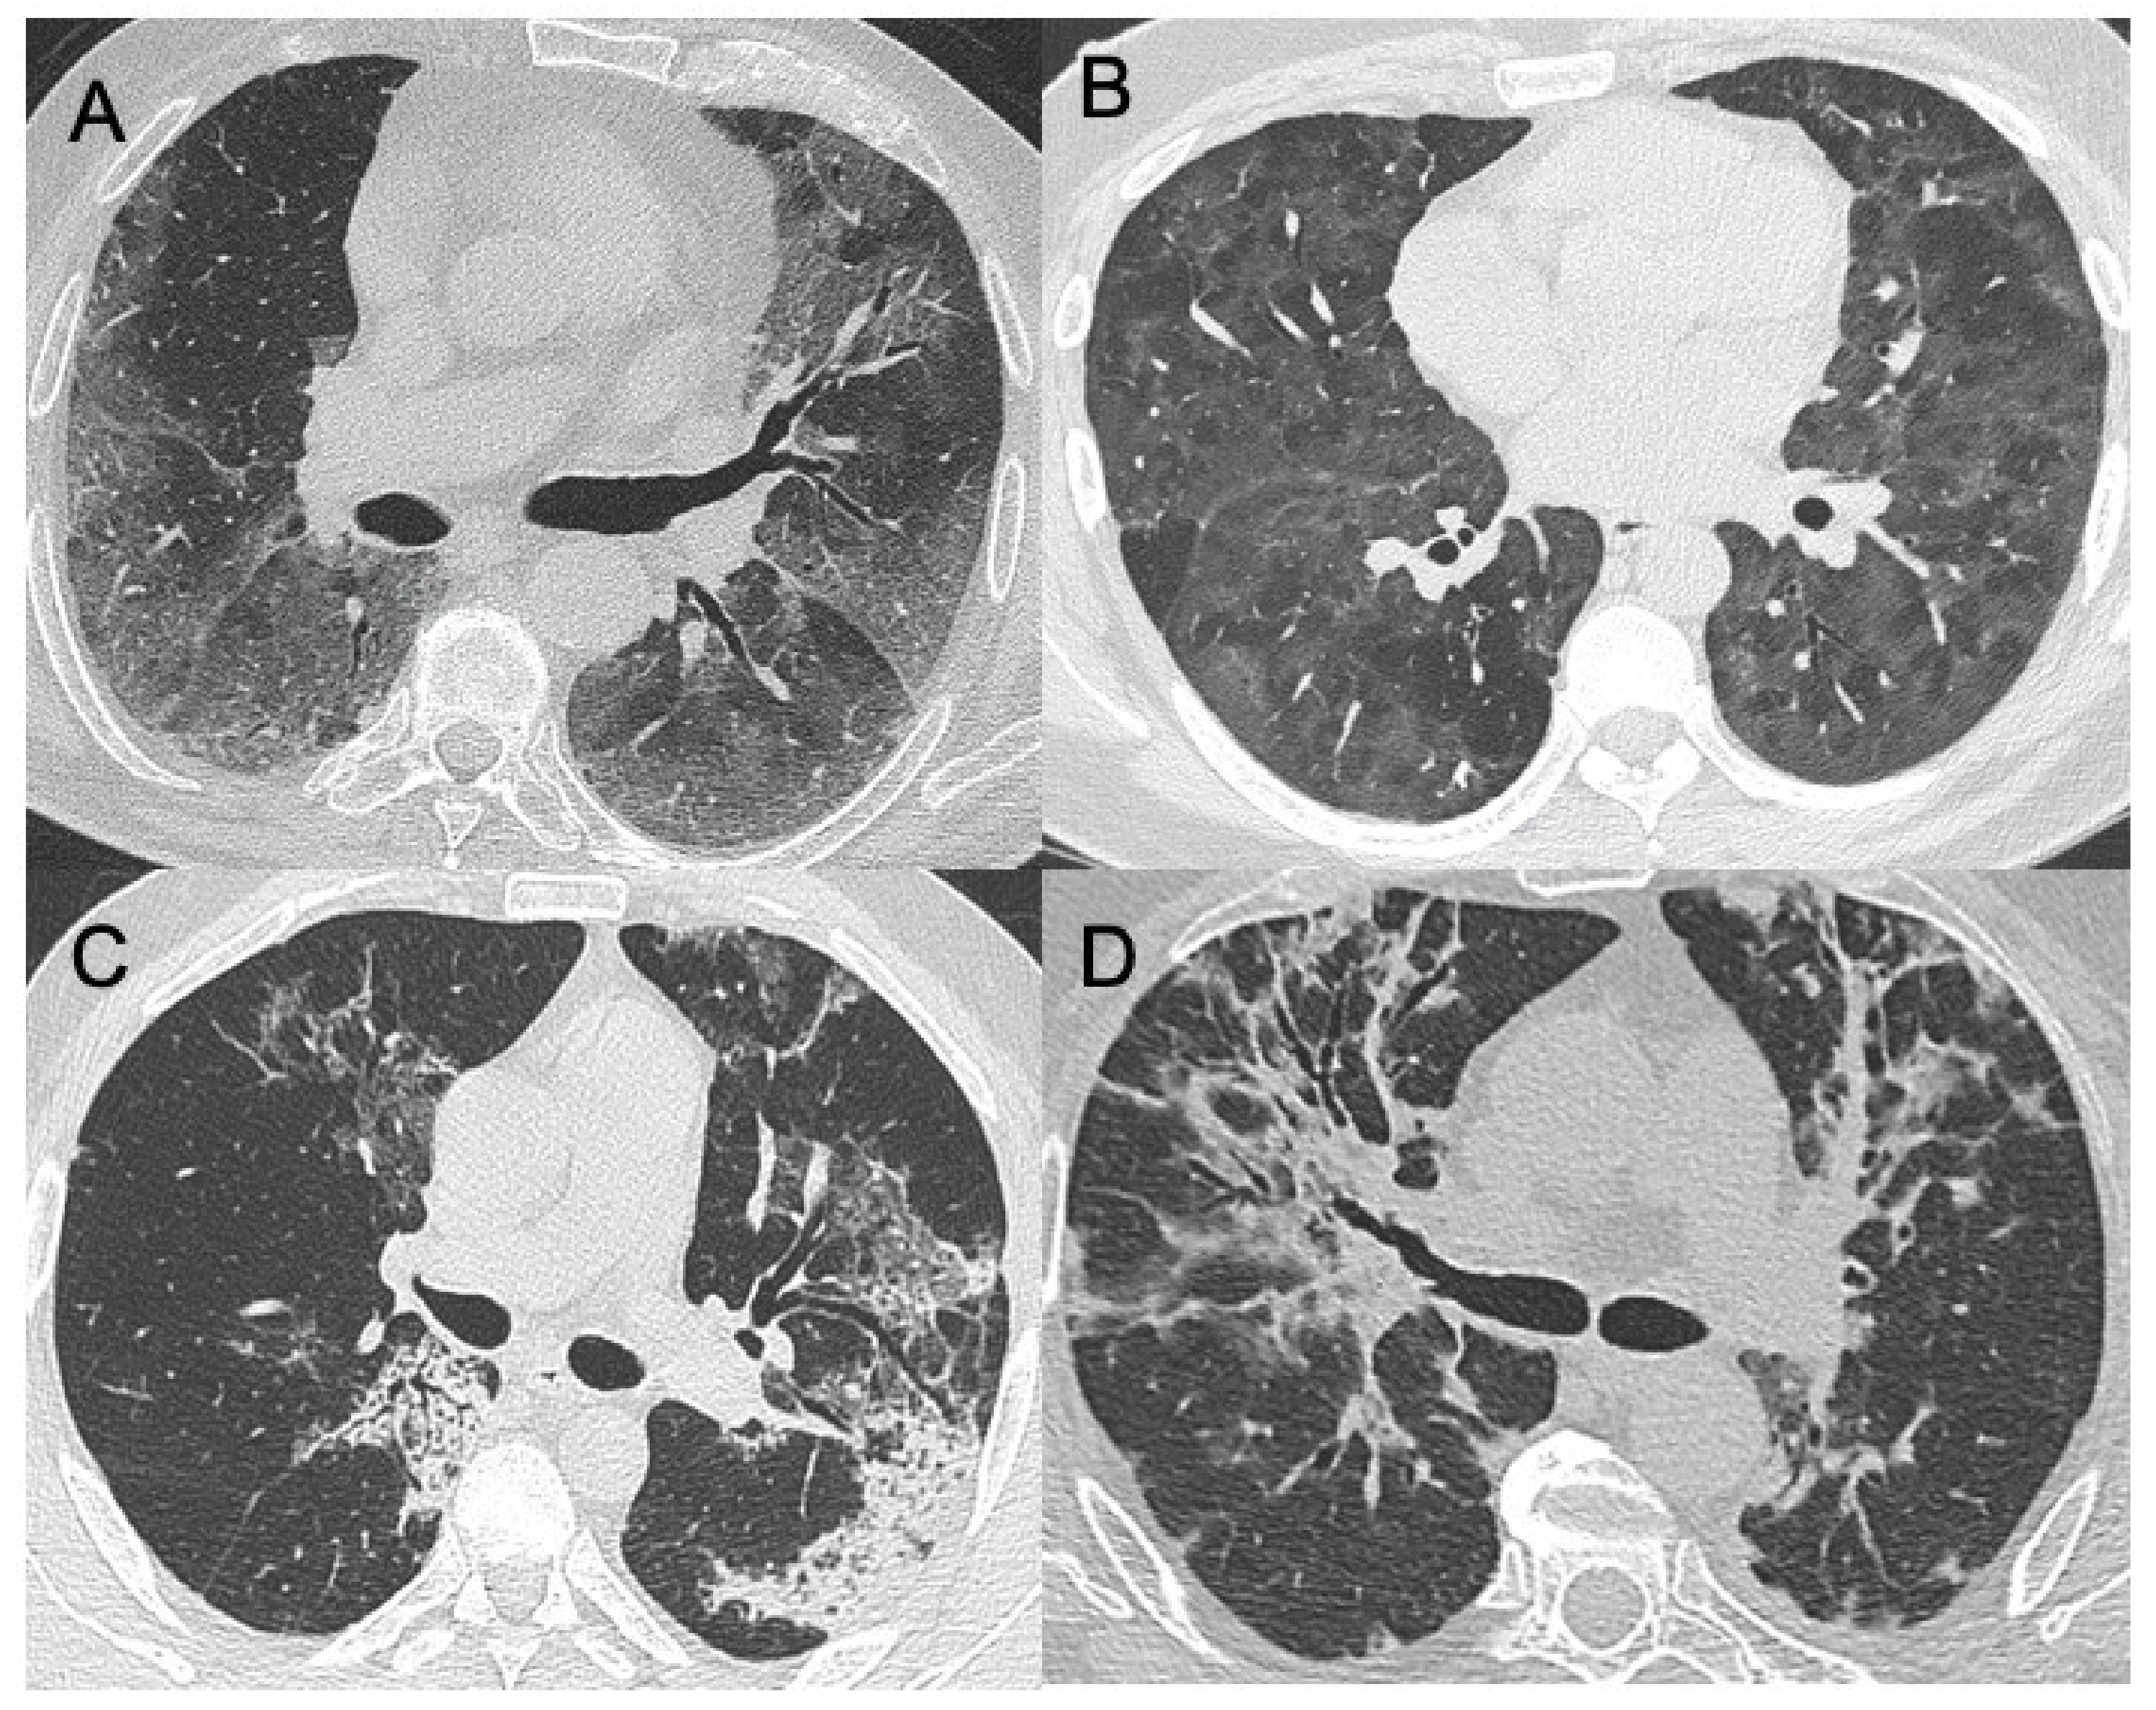
| Sars-CoV-2 | Lung subpleural consolidations, ground-glass opacities, nodules and reticular–nodular opacities, manifesting as interstitial pneumonia with diffuse alveolar damage | In the early phase, predominantly peripheral, bilateral GGOs, in association with limited consolidations, interlobular and intralobular septal thickening creating a “crazy-paving” pattern. Air bronchograms, vascular enlargement, halo sign, and reverse halo sign are also reported | Figure 1 and Figure 2 |
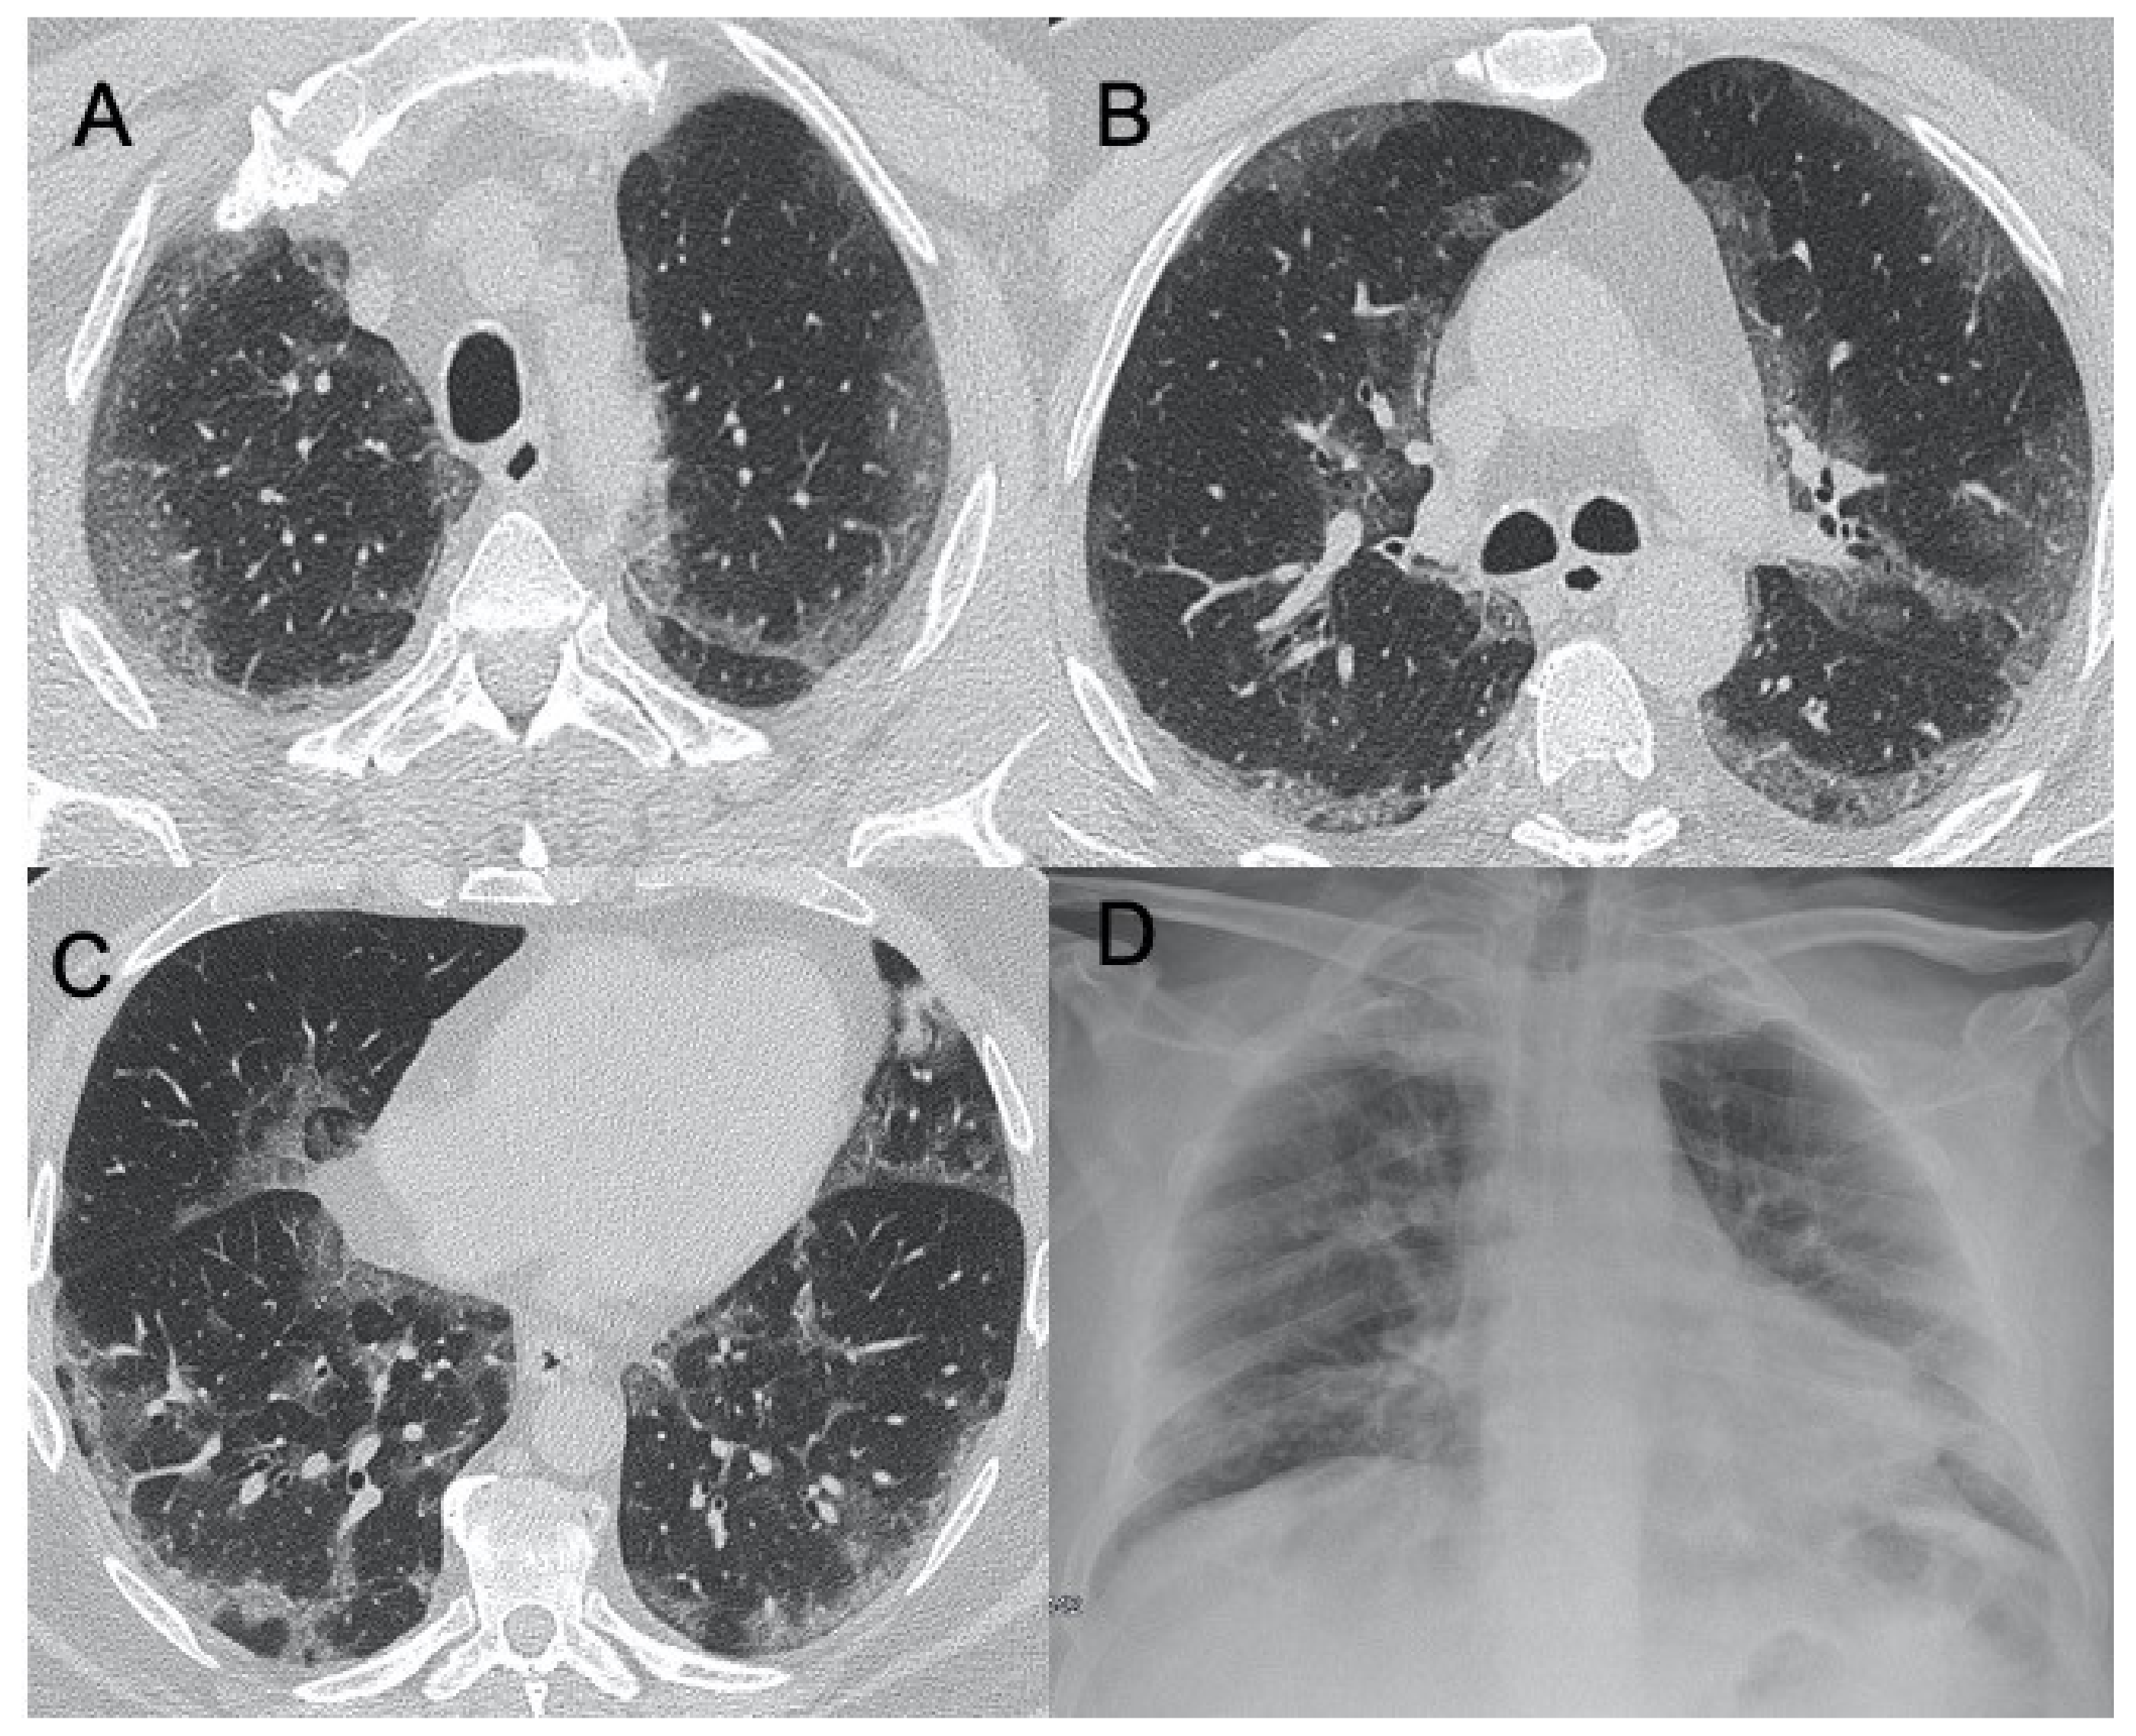
| Influenza A | Bilateral reticular-nodular opacities in association with areas of consolidation, usually in the lower lobes | Multifocal consolidations and diffuse areas of GGO. Lymphadenopathy, cavitation, pleural effusion, and pneumatocele were also observed | Figure 3 |
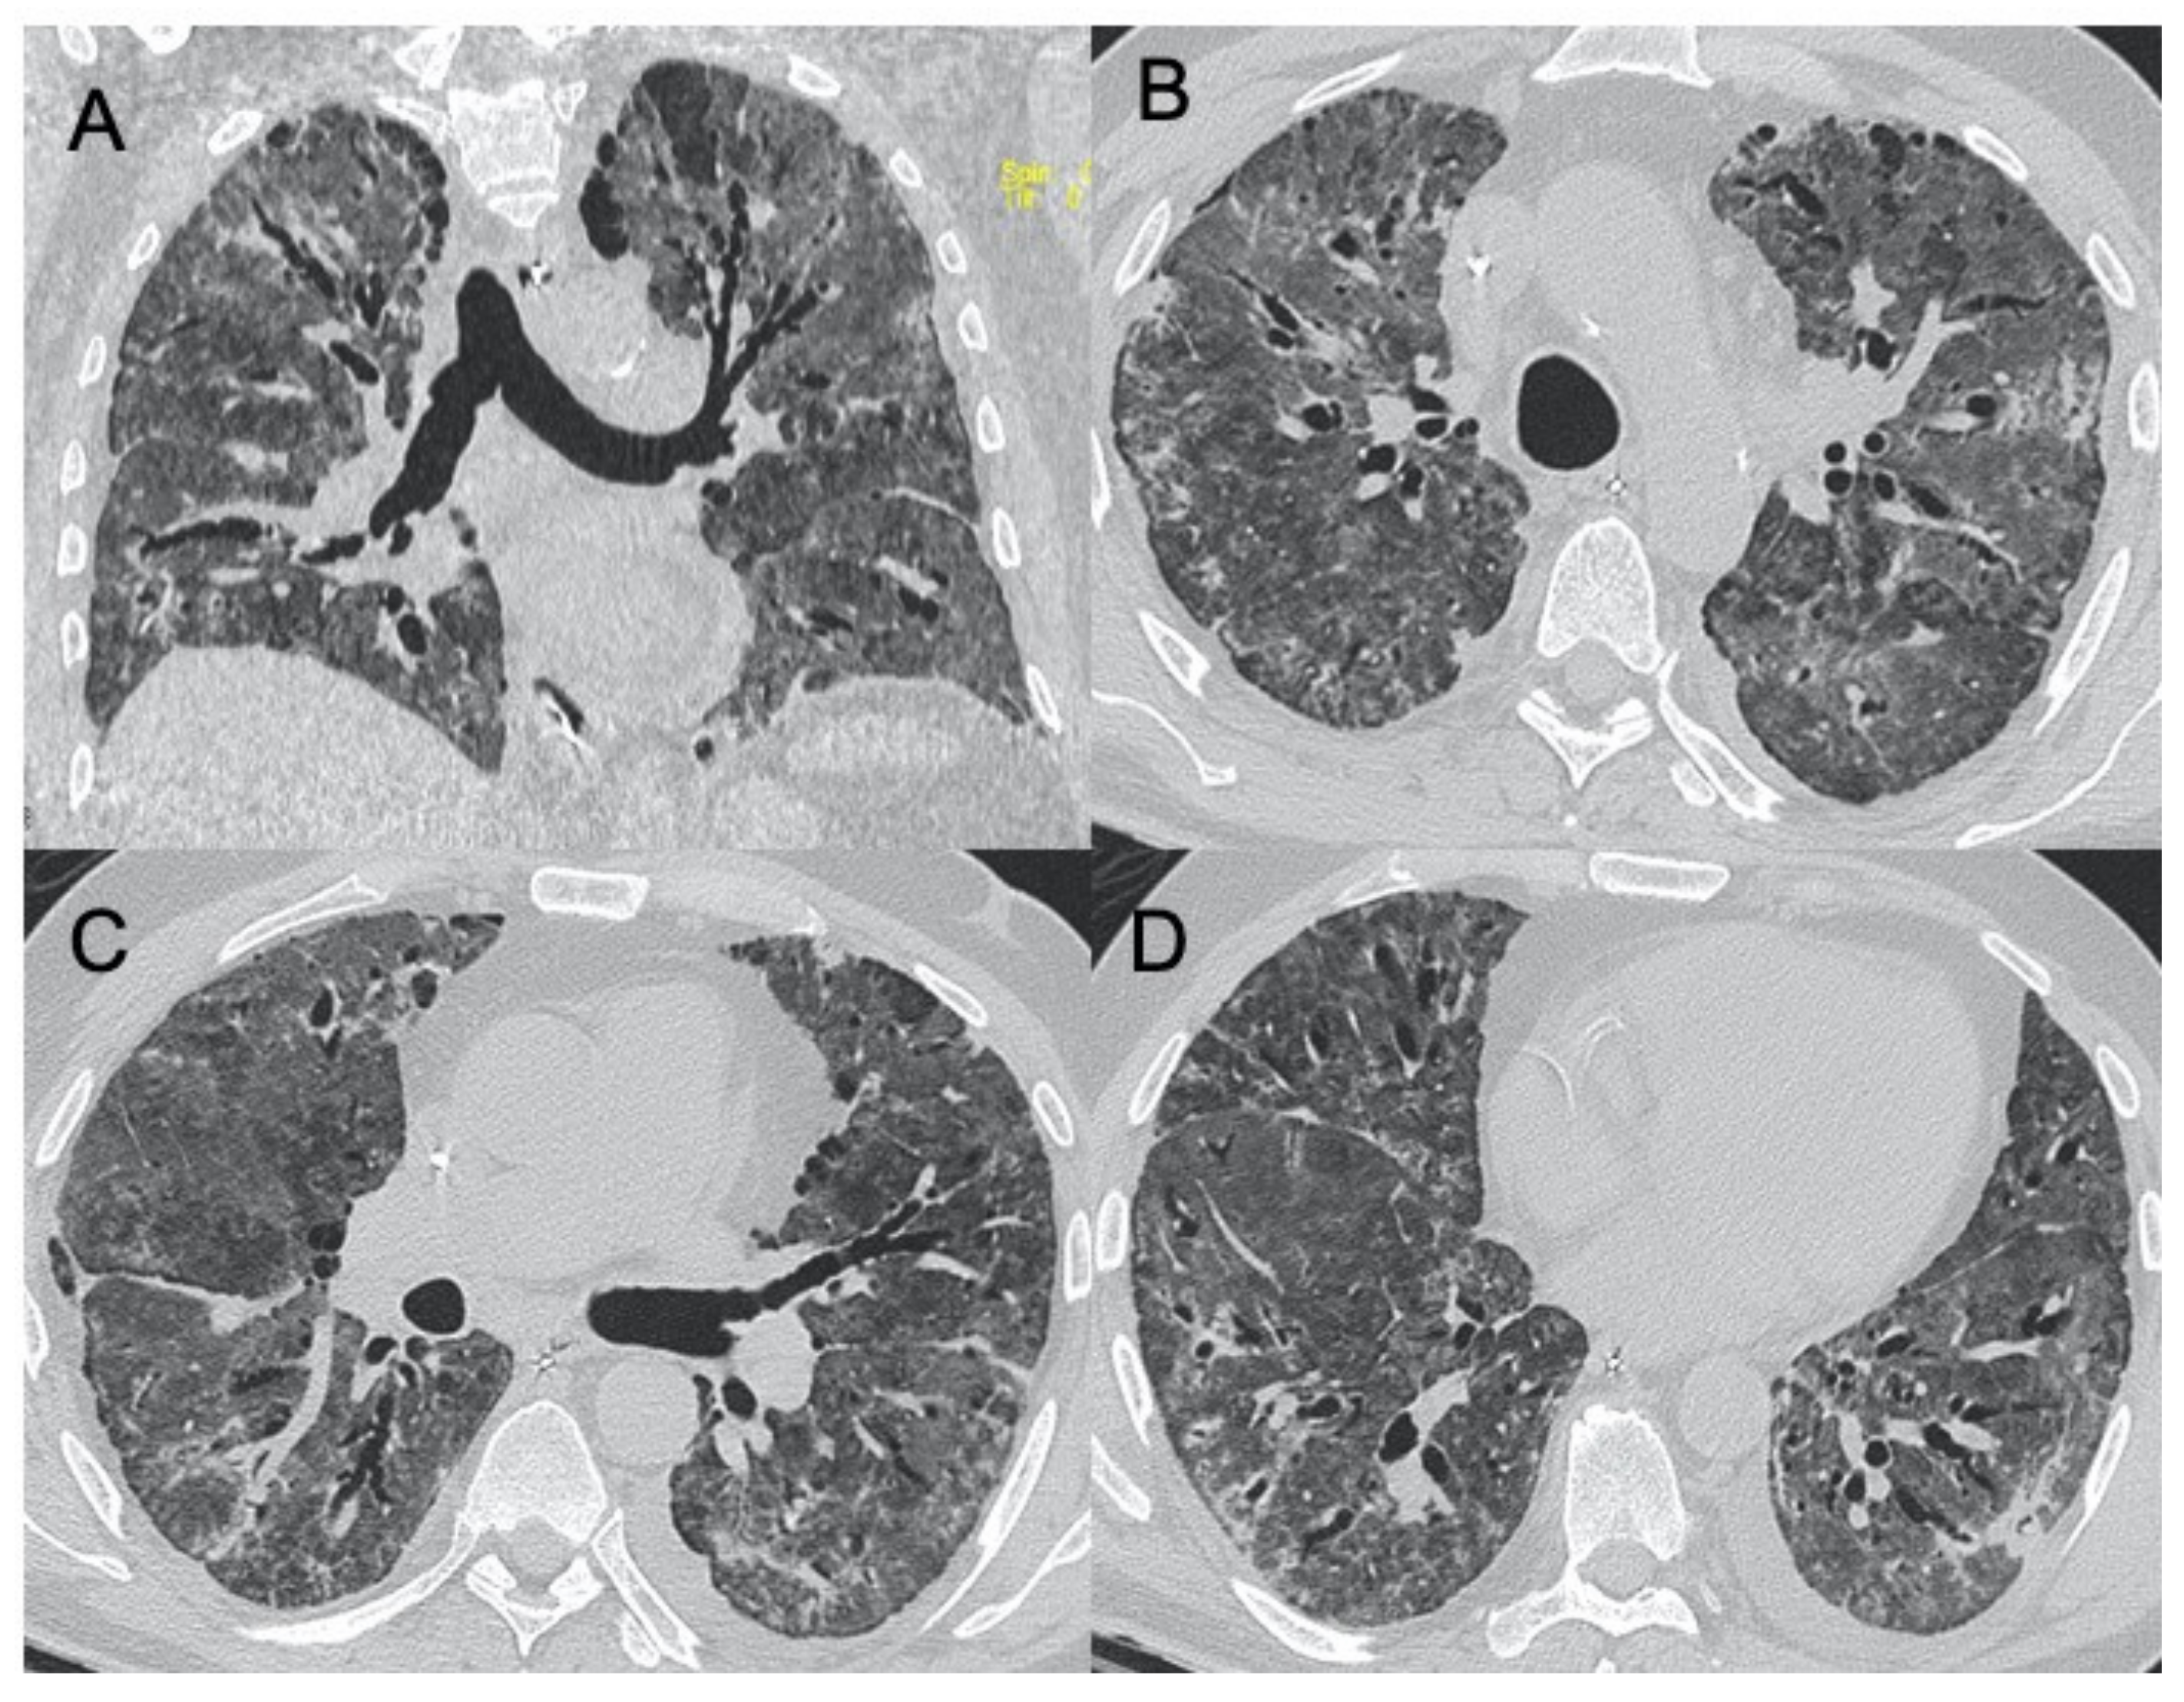
| H1N1 virus | Unilateral/bilateral GGO with or without associated areas of consolidation with predominantly peribroncho-vascular and subpleural distribution | Unilateral or bilateral GGO with or without associated areas of consolidation with predominantly peribroncho-vascular and subpleural distribution | Figure 4 |
| Adenovirus | Bilateral and multifocal GGO with lobar or segmental involvement, similarly to bacterial pneumonia. In case of complication, unilateral small lung with hyperlucency and air trapping on expiration (Swyer–James Syndrome) | Bilateral and multifocal GGO with lobar or segmental involvement, similarly to bacterial pneumonia | Figure 5 |
| Herpes virus | Bilateral areas of consolidation with GGO with lobular, segmental, or sub-segmental distribution | Multifocal areas of segmental or sub-segmental GGO are observed; pleural effusion is frequent | Figure 6 |
| Varicella Zoster | Multiple nodules (5–10 mm) with defined margins that may tend to confluence. Pleural effusion and lymphadenopathy may be present although they are not common | Well-defined nodules (1–10 mm) with a halo of GGO. These millimetric lesions may calcify. | Figure 7 |
| Cytomegalovirus | Diffuse and bilateral consolidations with interstitial involvement. | Interstitial and alveolar infiltrates, bilateral and asymmetric GGO areas in association with areas of parenchymal consolidation | Figure 8 |
| Epstein-Barr virus | Lymphadenopathies with smooth interstitial parenchymal involvement in both lungs | Lymphadenopathies and less frequently interstitial infiltrates with diffuse GGOs and consolidations | Figure 9 |
Publisher’s Note: MDPI stays neutral with regard to jurisdictional claims in published maps and institutional affiliations. |
© 2021 by the authors. Licensee MDPI, Basel, Switzerland. This article is an open access article distributed under the terms and conditions of the Creative Commons Attribution (CC BY) license (https://creativecommons.org/licenses/by/4.0/).
Share and Cite
Cozzi, D.; Bicci, E.; Bindi, A.; Cavigli, E.; Danti, G.; Galluzzo, M.; Granata, V.; Pradella, S.; Trinci, M.; Miele, V. Role of Chest Imaging in Viral Lung Diseases. Int. J. Environ. Res. Public Health 2021, 18, 6434. https://doi.org/10.3390/ijerph18126434
Cozzi D, Bicci E, Bindi A, Cavigli E, Danti G, Galluzzo M, Granata V, Pradella S, Trinci M, Miele V. Role of Chest Imaging in Viral Lung Diseases. International Journal of Environmental Research and Public Health. 2021; 18(12):6434. https://doi.org/10.3390/ijerph18126434
Chicago/Turabian StyleCozzi, Diletta, Eleonora Bicci, Alessandra Bindi, Edoardo Cavigli, Ginevra Danti, Michele Galluzzo, Vincenza Granata, Silvia Pradella, Margherita Trinci, and Vittorio Miele. 2021. "Role of Chest Imaging in Viral Lung Diseases" International Journal of Environmental Research and Public Health 18, no. 12: 6434. https://doi.org/10.3390/ijerph18126434
APA StyleCozzi, D., Bicci, E., Bindi, A., Cavigli, E., Danti, G., Galluzzo, M., Granata, V., Pradella, S., Trinci, M., & Miele, V. (2021). Role of Chest Imaging in Viral Lung Diseases. International Journal of Environmental Research and Public Health, 18(12), 6434. https://doi.org/10.3390/ijerph18126434