Development of Nomophobia Profiles in Education Students through the Use of Multiple Correspondence Analysis

 , ,
, ,
Abstract
1. Introduction
2. Methods
2.1. Participants
2.2. Research Variables
2.3. Instrument for the Collection of Information and Reliability and Validity
2.4. Ethical Considerations
3. Data Analysis and Interpretation
4. Discussion of Study
5. Conclusions
6. Limitations and Prospections of the Study
Author Contributions
Funding
Conflicts of Interest
References
- Gentina, E.; Chen, R. Digital natives’ coping with loneliness: Facebook or face-to-face? Inf. Manag. 2019, 56, 103–138. [Google Scholar] [CrossRef]
- McLay, K.F. Geeks, gamers, and girls: Revealing diverse digital identities with membership categorisation analysis. Discourse-Stud. Cult. Politics Educ. 2019, 40, 946–961. [Google Scholar] [CrossRef]
- Bert, F.; Giacometti, M.; Gualano, M.R.; Squilini, R. Smartphones and health promotion: A review of the evidence. J. Med. Syst. 2014, 38, 9995. [Google Scholar] [CrossRef]
- Pivetta, E.; Harkin, L.; Billieux, J.; Kanjo, E.; Kuss, D.J. Problematic smartphone use: An empirically validated model. Comput. Hum. Behav. 2019, 100, 105–117. [Google Scholar] [CrossRef]
- Shin, D.; Shin, Y.; Choo, H.; Beom, K. Smartphones as smart pedagogical tools: Implications for smartphones as u-learning devices. Comput. Hum. Behav. 2011, 27, 2207–2214. [Google Scholar] [CrossRef]
- Murdock, K.K. Texting while stressed: Implications for students’ burnout, sleep, and well-being. Psychol. Pop. Media Cult. 2013, 2, 207. [Google Scholar] [CrossRef]
- Wang, J.; Wang, H.; Gaskin, J.; Hawk, S. The mediating roles of upward social comparison and self-esteem and the moderating role of social comparison orientation in the association between social networking site usage and subjective well-being. Front. Psychol. 2017, 8, 771. [Google Scholar] [CrossRef] [PubMed]
- Christakis, D.A.; Moreno, M.M.; Jelenchick, L.; Myaing, M.T.; Zhou, C. Problematic internet usage in US college students: A pilot study. BMC Med. 2011, 9, 77. [Google Scholar] [CrossRef]
- Karpinski, A.C.; Kirschner, P.A.; Ozer, I.; Mellott, J.A.; Ochwo, P. An exploration of social networking site use, multitasking, and academic performance among United States and European university students. Comput. Hum. Behav. 2013, 29, 1182–1192. [Google Scholar] [CrossRef]
- Sarmiento, A.; Herrera-López, M.; Zych, I. Is cyberbullying a group process? Online and offline bystanders of cyberbullying act as defenders, reinforcers and outsiders. Comput. Hum. Behav. 2019, 99, 328–334. [Google Scholar] [CrossRef]
- Digital Marketing Trends. Informe Mobile en España y en el Mundo 2018. Available online: https://mktefa.ditrendia.es/hubfs/Ditrendia-Informe%20Mobile%202018.pdf (accessed on 26 September 2020).
- King, A.L.S.; Valença, A.M.; Nardi, A.E. Nomophobia: The mobile phone in panic disorder with agoraphobia: Reducing phobias or worsening of dependence? Cogn. Behav. Neurol. 2010, 23, 52–54. [Google Scholar] [CrossRef]
- Bragazzi, N.L.; Del Puente, G. A proposal for including nomophobia in the new DSM-V. Psychol. Res. Behav. Manag. 2014, 7, 155. [Google Scholar] [CrossRef]
- Thomée, S.; Härenstam, A.; Hagberg, M. Mobile phone use and stress, sleep disturbances, and symptoms of depression among young adults-a prospective cohort study. BMC Public Health 2011, 11, 66. [Google Scholar] [CrossRef]
- Nickerson, R.C.; Isaac, H.; Mak, B. A multi-national study of attitudes about mobile phone use in social settings. Intern. J. Mob. Commun. 2008, 6, 541–563. [Google Scholar] [CrossRef]
- Elhai, J.D.; Dvorak, R.D.; Levine, J.C.; Hall, B.J. Problematic smartphone use: A conceptual overview and systematic review of relations with anxiety and depression psychopathology. J. Affect. Disord. 2017, 207, 251–259. [Google Scholar] [CrossRef]
- Wolniewicz, C.A.; Tiamiyu, M.F.; Weeks, J.W.; Elhai, J.D. Problematic smartphone use and relations with negative affect. fear of missing out. and fear of negative and positive evaluation. Psychiatry Res. 2018, 262, 618–623. [Google Scholar] [CrossRef] [PubMed]
- Zsido, A.N.; Arato, N.; Lang, A.; Labadi, B.; Stecina, D.; Bandi, S.A. The connection and background mechanisms of social fears and problematic social networking site use: A Structural Equation Modeling analysis. Psychiatry Res. 2020, 292, 113323. [Google Scholar] [CrossRef]
- Gomes-Franco-Silva, F.; Sendín-Gutiérrez, J. Internet como refugio y escudo social: Usos problemáticos de la Red por jóvenes españoles. Comunicar 2014, 22, 45–53. [Google Scholar] [CrossRef]
- Kuss, D.J.; Griffiths, M.D.; Binder, J.F. Internet addiction in students: Prevalence and risk factors. Comput. Hum. Behav. 2013, 29, 959–966. [Google Scholar] [CrossRef]
- Crone, E.A.; Konijn, E.A. Media use and brain development during adolescence. Nat. Commun. 2018, 9, 1–10. [Google Scholar] [CrossRef]
- Zurita-Ortega, F.; Sánchez, M.C.; Álvaro-González, J.I.; Rodríguez-Fernández, S.; Pérez-Cortés, A.J. Autoconcepto, Actividad física y Familia: Análisis de un modelo de ecuaciones estructurales. Rev. Psicol. Deporte 2016, 25, 97–104. [Google Scholar] [CrossRef]
- Chacón-Cuberos, R.; Zurita-Ortega, F.; Sánchez, M.C.; Espejo, T. The association of Self-concept with Substance Abuse and Problematic Use of Video Games in University Students: A Structural Equation Model. Adicciones 2018, 30, 179–188. [Google Scholar] [CrossRef]
- Beranuy, M.; Chamarro, A.; Graner, C.; Carbonell, X. Validacion de dos escalas breves para evaluar la adicción a internet y el abuso del móvil. Psicothema 2009, 21, 480–485. [Google Scholar]
- Ramos-Soler, I.; López-Sánchez, C.; Quiles-Soler, M.C. Adaptation and validation of the Yildirim & Correia nomophobia scale in Spanish students of «compulsory secondary education. Health Addict. 2017, 17, 201–213. [Google Scholar] [CrossRef]
- Yildirim, C.; Correia, A.P. Exploring the dimensions of nomophobia: Development and validation of a self-reported questionnaire. Comput. Hum. Behav. 2015, 49, 130–137. [Google Scholar] [CrossRef]
- González-Cabrera, J.; León-Mejía, A.; Pérez-Sancho, C.; Calvete, E. Adaptation of the Nomophobia Questionnaire (NMP-Q) to Spanish in a sample of adolescents. Actas Esp. Psiquiatr. 2017, 45, 137–144. [Google Scholar]
- Chiu, S.; Hong, F.; Chiu, S. An analysis on the correlation and gender difference between college students’ Internet addiction and mobile phone addiction in Taiwan. ISRN Addict. 2013, 1–10. [Google Scholar] [CrossRef] [PubMed]
- Matoza-Báez, C.M.; Carballo-Ramírez, M.S. Nomophobia levels on medical students from Paraguay, year 2015. CIMEL 2016, 21, 28–30. [Google Scholar] [CrossRef]
- Dias, P.; Goncalves, S.; Correia, A.P. An examination of nomophobia among Portuguese college students. J. Behav. Addict. 2019, 8, 161. [Google Scholar] [CrossRef]
- Rosales-Huamani, J.A.; Guzman-Lopez, R.R.; Aroni-Vilca, E.E.; Matos-Avalos, C.R.; Castillo-Sequera, J.L. Determining symptomatic factors of nomophobia in peruvian students from the national university of engineering. Appl. Sci. 2019, 9, 1814. [Google Scholar] [CrossRef]
- Bragazzi, N.L.; Re, T.S.; Zarbetto, R. The relationship between nomophobia and maladaptive coping styles in a sample of Italian young adults: Insights and implications from a cross-sectional study. JMIR Ment. Health 2019, 6, e13154. [Google Scholar] [CrossRef]
- Gutiérrez-Puertas, L.; Márquez-Hernández, V.V.; São-Romão-Preto, L.; Granados-Gámez, G.; Gutiérrez-Puertas, V.; Aguilera-Manrique, G. Comparative study of nomophobia among Spanish and Portuguese nursing students. Nurse Educ. Pract. 2019, 34, 79–84. [Google Scholar] [CrossRef]
- Ma, J.; Liu, C. Evaluation of the factor structure of the Chinese version of the Nomophobia Questionnaire. Curr. Psychol. 2018, 1–7. [Google Scholar] [CrossRef]
- Chun-Hao, L.; Sheng-Hsuan, L.; Yuan-Chien, P.; Yu-Hsuan, L. Smartphone gaming and frequent use pattern associated with smartphone addiction. Medicine 2016, 95, 1–10. [Google Scholar] [CrossRef]
- Hong, F.; Chiu, S.; Huang, D. A model of the relationship between psychological characteristics, mobile phone addiction and use of mobile phones by Taiwanese university female students. Comput. Hum. Behav. 2012, 28, 2152–2159. [Google Scholar] [CrossRef]
- Haug, S.; Castro, R.P.; Kwon, M.; Filler, A.; Kowatsch, T.; Schaub, M.P. Smartphone use and smartphone addiction among young people in Switzerland. J. Behav. Addict. 2015, 4, 299–307. [Google Scholar] [CrossRef] [PubMed]
- Yildiz-Durak, H. Investigation of nomophobia and smartphone addiction predictors among adolescents in Turkey: Demographic variables and academic performance. Soc. Sci. J. 2019, 56, 492–517. [Google Scholar] [CrossRef]
- Bartwal, J.; Nath, B. Evaluation of nomophobia among medical students using smartphone in north India. Med. J. Armed Forces India 2019, 451–455. [Google Scholar] [CrossRef]
- Sanz, C.S.; Martínez Sabater, A.; Ballestar Tarín, M.L.; Romero, A.D. Instrumentos de evaluación del uso problemático del teléfono móvil/smartphone. Health Addict. 2017, 17, 5–14. [Google Scholar] [CrossRef]
- Thompson, S.K. Sampling, 3rd ed.; John Wiley & Sons: New York, NY, USA, 2012. [Google Scholar]
- Chernyshenko, O.S.; Stark, S.; Chan, K.; Drasgow, F.; Williams, B. Fitting Item Response Theory models to two personality inventories: Issues and insights. Multivar. Behav. Res. 2001, 36, 523–562. [Google Scholar] [CrossRef]
- George, D.; Mallery, P. SPSS for Windows Step by Step: A Simple Guide and Reference; 17.0 Update; Allyn & Bacon: Boston, MA, USA, 2010. [Google Scholar]
- Samejima, F. The Graded Response Model. In Handbook of Polytomous Item Response Theory Models; Nering, M.L., Ostini, R., Eds.; Routledge Academic: London, UK, 2010; pp. 77–107. [Google Scholar]
- Baker, F.B. The Basics of Item Response Theory; ERIC Clearinghouse on Assessment and Evaluation: College Park, MD, USA, 2001. [Google Scholar]
- Furr, R.M. Psichometrics: A Introduction; Sage: Los Ángeles, CA, USA, 2018. [Google Scholar] [CrossRef]
- Newton, P.; Shaw, S. Validity in Educational and Psychological Assessment; Sage: Thousand Oaks, CA, USA, 2014. [Google Scholar]
- The JAMOVI Project. JAMOVI. (Version 1.2) [Computer Software]. Available online: https://www.jamovi.org.2020 (accessed on 26 September 2020).
- Hair, J.; Babin, B.; Anderson, R.; Black, W. Multivariate Data Analysis, 8th ed.; Cengage Learning: Hampshire, UK, 2018. [Google Scholar]
- Bagozzi, R.; Yi, Y. On the valuation of structural equation models. JAMS 1988, 16, 74–94. [Google Scholar] [CrossRef]
- Labrador Encinas, F.; Villadangos González, S. Menores y nuevas tecnologías: Conductas indicadoras de posible problema de adicción. Psicothema 2010, 22, 180–188. [Google Scholar]
- Ordóñez, M.B.Q.; Urbano, E.R.; Esparrell, J.A. Tecno adicciones: Una propuesta de intervención para prevenirlas en el aula. Rev. Dig. Investig. Educ. Connect 2013, 3, 111–129. [Google Scholar]
- Roberts, J.A. Shiny Objects: Why We Spend Money We don’t Have in Search of Happiness We can’t Buy; HarperOne: New York, NY, USA, 2011. [Google Scholar]
- Dawson, J. Analysing Quantitative Survey Data for Business and Management Students; 55 City Road; Sage: London, UK, 2016. [Google Scholar] [CrossRef]
- Salkind, N.J.; Frey, B.B. Statistics for People Who (Think They) Hate Statistics; Sage: Thousand Oaks, CA, USA, 2019. [Google Scholar]
- Fabrigar, L.R.; Wegener, D.T. Exploratory Factor Analysis; Oxford University Press: Oxford, UK, 2012. [Google Scholar]
- Holmes Finch, W. Exploratory Factor Analysis; Sage: Los Ángeles, CA, USA, 2019. [Google Scholar]
- Meyers, L.S.; Gamst, G.; Guarino, A.J. Applied Multivariate Research: Design and Interpretation; Sage: Thousand Oaks, CA, USA, 2016. [Google Scholar]
- Carmines, E.; Zeller, R. Reliability and Validityassessment; Sage: Los Ángeles, CA, USA, 1979. [Google Scholar]
- Reckase, M. Unifactor latent trait models applied tomultifactor tests: Results and implications. J. Educ. Stat. 1979, 4, 207–230. [Google Scholar] [CrossRef]
- Schermelleh-Engel, K.; Moosbrugger, H.; Müller, H. Evaluating the fit of structural equation models: Tests of significance and descriptive goodness-of-fit measures. Methods Psychol. Res. Online 2003, 8, 23–74. [Google Scholar]
- Hu, L.; Bentler, P. Cut-off criteria for fit indexes in covariance structure analysis: Conventional criteria versus new alternatives. Struct. Equ. Model. 1999, 6, 1–55. [Google Scholar] [CrossRef]
- Brown, M.W.; Cudeck, R. Alternative ways of assessing model fit. In Testing Methods and Organization Studies; Bollen, K.A., Long, J.S., Eds.; Routledge: London, UK, 1993. [Google Scholar]
- Raftery, A.E. Bayesian Model Selection in Social Research. Soc. Methodol. 1995, 15, 111–163. [Google Scholar] [CrossRef]
- Chóliz, M. Mobile-phone addiction in adolescence: The test of mobile phone dependence (TMD). Prog. Health Sci. 2012, 2, 33–44. [Google Scholar]
- Olivencia-Carrión, M.A.; Ferri-García, R.; del Mar Rueda, M.; Jiménez-Torres, M.G.; López-Torrecillas, F. Temperament and characteristics related to nomophobia. Psychiatry Res. 2018, 266, 5–10. [Google Scholar] [CrossRef]
- Onal, N. Metaphoric perceptions of high school students about nomophobia. Intern. J. Res. Educ. Sci. 2019, 5, 437–449. [Google Scholar] [CrossRef]
- Davie, N.; Hilber, T. Nomophobia: Is Smartphone Addiction a Genuine Risk for Mobile Learning? International association for development of the information society. In Proceedings of the 13th International Conference Mobile Learning, Budapest, Hungary, 10–12 April 2017. [Google Scholar]
- Mendoza, J.S.; Pody, B.C.; Lee, S.; Kim, M.; McDonough, I.M. The effect of cellphones on attention and learning: The influences of time, distraction, and nomophobia. Comput. Hum. Behav. 2018, 86, 52–60. [Google Scholar] [CrossRef]
- Ak, N.Y.; Yildirim, S. Nomophobia among undergraduate students: The case of a turkish state university. Intern. J. New Trends Educ. Implic. 2018, 9, 11–20. [Google Scholar] [CrossRef]
- Gezgin, D.M.; Hamutoglu, N.B.; Sezen-Gultekin, G.; Ayas, T. The Relationship between Nomophobia and Loneliness among Turkish Adolescents. Intern. J. Res. Educ. Sci. 2018, 4, 358–374. [Google Scholar] [CrossRef]
- Ahmed, S.; Pokhrel, N.; Roy, S.; Samuel, A.J. Impact of nomophobia: A nondrug addiction among students of physiotherapy course using an online cross-sectional survey. Indian J. Psychiatry 2019, 61, 77–80. [Google Scholar] [CrossRef]
- Baym, N.K. Personal Connections in the Digital Age. In Digital Media and Society; Polity Press: Cambridge, UK, 2011. [Google Scholar]
- Jenkins, H.; Ford, S.; Green, J. Cultura Transmedia: La Creación de Contenido y Valor en Una Cultura en Red; Editorial Gedisa: Barcelona, Spain, 2015. [Google Scholar]
- Smith, M.A.; Himelboim, I.; Rainie, L.; Shneiderman, B. The Structures of Twitter Crowds and Conversations. In Transparency in Social Media; Springer: Berlin/Heidelberg, Germany, 2015; pp. 67–108. [Google Scholar]
- Goh, A.Y.S. An individual learning journey: Learning as becoming a vocational teacher. Intern. J. Lifelong Educ. 2015, 34, 680–695. [Google Scholar] [CrossRef]
- Howard, K.A.; Flanagan, S.; Castine, E.; Walsh, M.E. Perceived influences on the career choices of children and youth: An exploratory study. Intern. J. Educ. Vocat. Guid. 2015, 15, 99–111. [Google Scholar] [CrossRef]
- Miller, M. The role of service-learning to promote early childhood physical education while examining its influence upon the vocational call to teach. Phys. Educ. Sport Pedag. 2012, 17, 61–77. [Google Scholar] [CrossRef]
- Ali, A.M.M.; Ridzuan, A.R.; Nuji, M.; Izzamuddin, M.; Latiff, D. The Relationship between Phone Usage Factors and Nomophobia. Adv. Sci. Lett. 2017, 23, 7610–7613. [Google Scholar] [CrossRef]
- Argumosa-Villar, L.; Boada-Grau, J.; Vigil-Colet, A. Exploratory investigation of theoretical predictors of nomophobia using the Mobile Phone Involvement Questionnaire (MPIQ). J. Adolesc. 2017, 56, 127–135. [Google Scholar] [CrossRef]
- Bragazzi, N.L.; Del Puente, G.; Adavastro, G.; Pompei, V.; Siri, A.; Rania, N.; Correia, A.-P.; Yildirim, C. Translation and validation of the Nomophobia Questionnaire (NMP-Q) in Italian language: Insights from factor analysis. Eur. Psychiatry 2016, 33, S390. [Google Scholar] [CrossRef]
- Yildirim, C.; Sumuer, E.; Adnan, M.; Yildirim, S. A growing fear: Prevalence of nomophobia among Turkish college students. Inf. Dev. 2016, 32, 1322–1331. [Google Scholar] [CrossRef]


| Factor | Composite Reliability | AVE |
|---|---|---|
| F1 | 0.91 | 0.34 |
| F2 | 0.88 | 0.56 |
| F3 | 0.85 | 0.55 |
| F4 | 0.76 | 0.52 |
| F5 | 0.73 | 0.62 |
| F6 | 0.71 | 0.57 |
| F7 | 1 | 1 |
| F8 | 1 | 1 |
| RMSEA 90%CI | ||||||
|---|---|---|---|---|---|---|
| Gender | CFI | TLI | RMSEA | Lower | Upper | BIC |
| Female | 0.911 | 0.912 | 0.0611 | 0.0611 | 0.0718 | 22,793 |
| Male | 0.903 | 0.901 | 0.0782 | 0.0678 | 0.0886 | 7247 |
| Levels | Range of Reported Scores | Max. S. | Min. S | Mean. S |
|---|---|---|---|---|
| High | >p66 = >84.33 (third tertile) | 112 | 28 | 112 + 28/2 = 70 |
| Medium | p33 to p66 = 55.67 to 84.33 (second tertile) | |||
| Low | <p33 = <55.66 (first tertile) |
| Nomophobia Levels | Statistic | Std. Error | |||
|---|---|---|---|---|---|
| Total Scale | High nomophobia | Mean | 81.23 | 1.038 | |
| 95% Confidence Interval for Mean | Lower Bound | 79.11 | |||
| Upper Bound | 83.36 | ||||
| Std. Deviation | 5.685 | ||||
| Medium nomophobia | Mean | 54.52 | 0.406 | ||
| 95% Confidence Interval for Mean | Lower Bound | 53.73 | |||
| Upper Bound | 55.32 | ||||
| Std. Deviation | 8.718 | ||||
| Low nomophobia | Mean | 35.33 | 0.443 | ||
| 95% Confidence Interval for Mean | Lower Bound | 34.40 | |||
| Upper Bound | 36.27 | ||||
| Std. Deviation | 1.879 | ||||
| Crosstabs | Chi-Square Test | df | Asymp. Sig. (2-Sided) |
|---|---|---|---|
| Gender by nomophobia’s levels | 1.746 | 2 | 0.418 |
| Grade by nomophobia’s levels | 23.665 | 8 | 0.003 *** |
| Degree by nomophobia’s levels | 27.269 | 8 | 0.001 *** |
| Age by nomophobia’s levels | 7.657 | 4 | 0.045 * |
| Dimension | Cronbach’s Alpha | Variance Accounted for | |
|---|---|---|---|
| Total (Eigenvalue) | Inertia | ||
| 1 | 0.728 | 2.395 | 0.479 |
| 2 | 0.573 | 1.847 | 0.369 |
| Total | 4.242 | 0.848 | |
| Mean | 0.650 * | 2.121 * | 0.424 * |
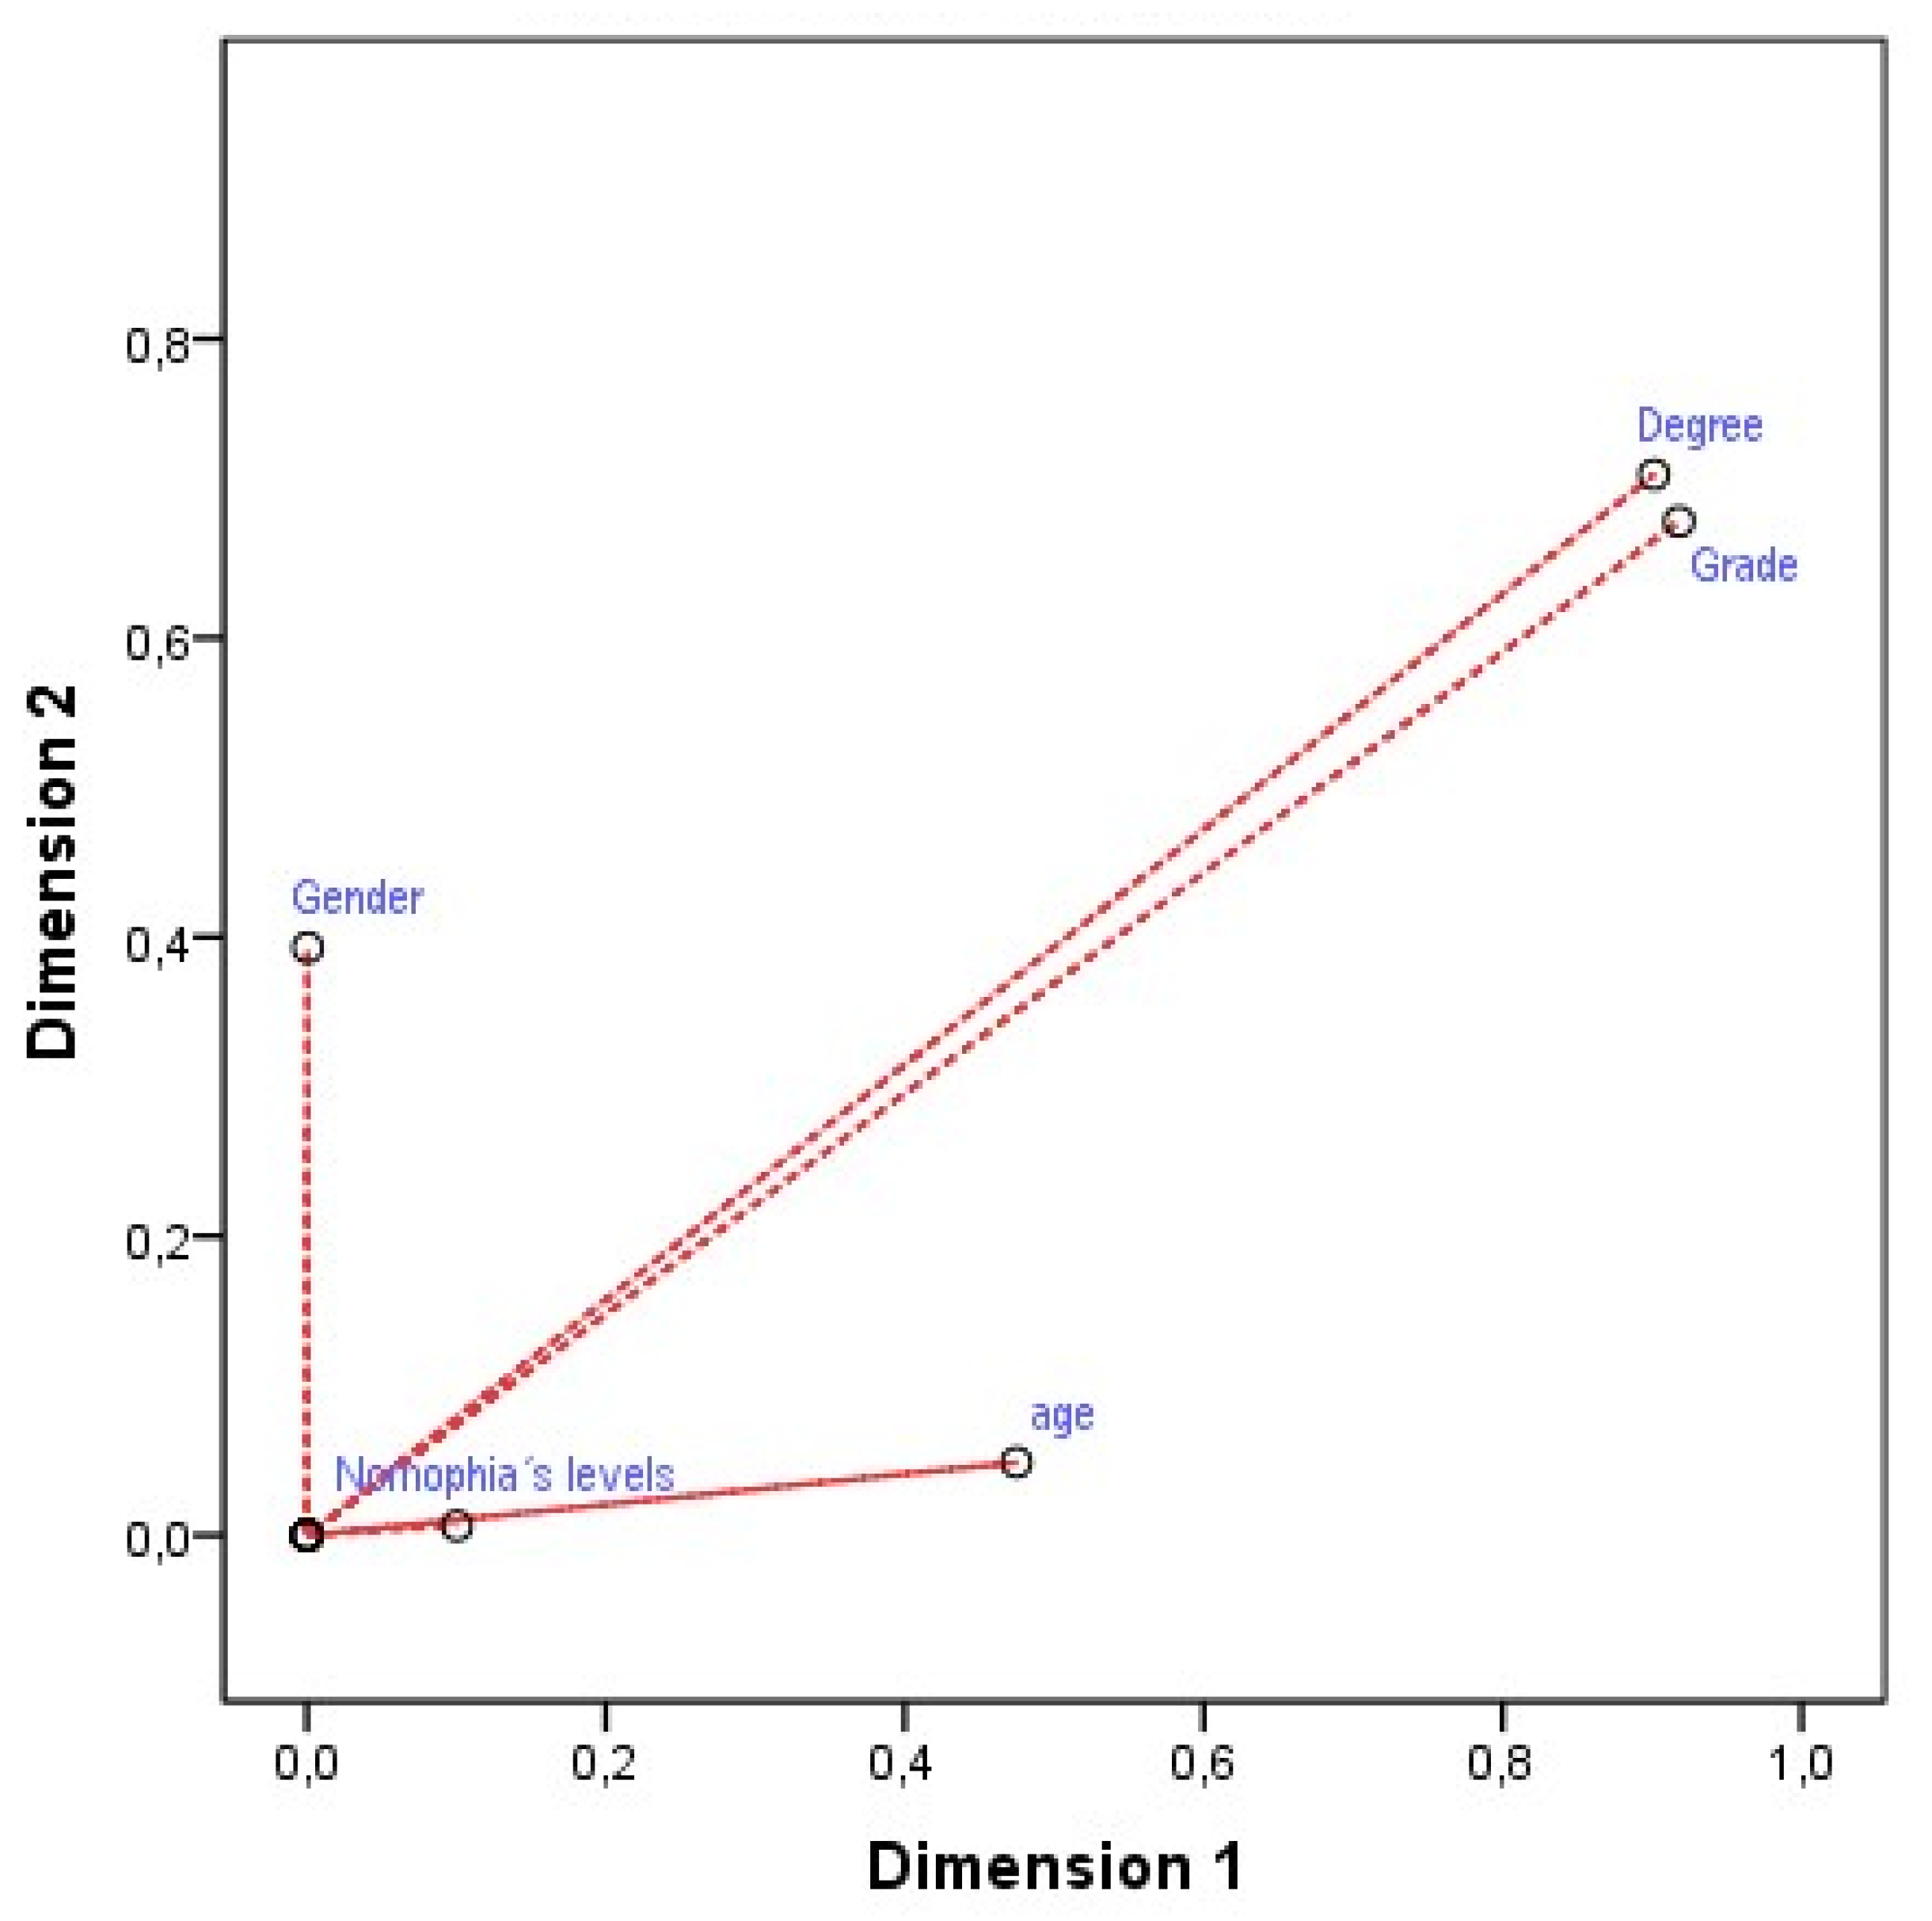
| Variables | Dimension | Mean | |
|---|---|---|---|
| 1 | 2 | ||
| Gender | 0.000 | 0.410 | 0.205 |
| Grade | 0.918 | 0.666 | 0.792 |
| Degree | 0.902 | 0.710 | 0.806 |
| Age | 0.475 | 0.055 | 0.265 |
| Nomophobia’s levels | 0.101 | 0.005 | 0.053 |
| Active Total | 2.395 | 1.847 | 2.121 |
Publisher’s Note: MDPI stays neutral with regard to jurisdictional claims in published maps and institutional affiliations. |
© 2020 by the authors. Licensee MDPI, Basel, Switzerland. This article is an open access article distributed under the terms and conditions of the Creative Commons Attribution (CC BY) license (http://creativecommons.org/licenses/by/4.0/).
Share and Cite
Rodríguez-Sabiote, C.; Álvarez-Rodríguez, J.; Álvarez-Ferrandiz, D.; Zurita-Ortega, F. Development of Nomophobia Profiles in Education Students through the Use of Multiple Correspondence Analysis. Int. J. Environ. Res. Public Health 2020, 17, 8252. https://doi.org/10.3390/ijerph17218252
Rodríguez-Sabiote C, Álvarez-Rodríguez J, Álvarez-Ferrandiz D, Zurita-Ortega F. Development of Nomophobia Profiles in Education Students through the Use of Multiple Correspondence Analysis. International Journal of Environmental Research and Public Health. 2020; 17(21):8252. https://doi.org/10.3390/ijerph17218252
Chicago/Turabian StyleRodríguez-Sabiote, Clemente, José Álvarez-Rodríguez, Daniel Álvarez-Ferrandiz, and Felix Zurita-Ortega. 2020. "Development of Nomophobia Profiles in Education Students through the Use of Multiple Correspondence Analysis" International Journal of Environmental Research and Public Health 17, no. 21: 8252. https://doi.org/10.3390/ijerph17218252
APA StyleRodríguez-Sabiote, C., Álvarez-Rodríguez, J., Álvarez-Ferrandiz, D., & Zurita-Ortega, F. (2020). Development of Nomophobia Profiles in Education Students through the Use of Multiple Correspondence Analysis. International Journal of Environmental Research and Public Health, 17(21), 8252. https://doi.org/10.3390/ijerph17218252