Air Emissions from Natural Gas Facilities in New York State


Abstract
1. Introduction
2. Materials and Methods
3. Results
4. Discussion
5. Conclusions
Author Contributions
Funding
Conflicts of Interest
References
- World Health Organization. Air Pollution and Health. Available online: https://www.who.int/airpollution/en/ (accessed on 24 August 2019).
- Watts, N.; Adher, W.N.; Agnolucci, P.; Blockstock, J.; Byass, P.; Cai, W.; Chaytor, S.; Colburn, T.; Collins, M.; Cooper, A.; et al. Health and climate change: Policy response to protect public health. Lancet 2016, 386, 1861–1914. [Google Scholar] [CrossRef]
- Montzka, S.A.; Dlugokencky, E.J.; Butler, J.H. Non-CO2 greenhouse gases and climate change. Nature 2011, 476, 43–50. [Google Scholar]
- Macey, G.P.; Breech, R.; Chernaik, M.; Cox, C.; Larsen, D.; Thomas, D.; Carpenter, D.O. Air concentrations of volatile compounds near oil and gas production: A community-based exploratory study. Environ. Health 2014, 13, 82. [Google Scholar] [CrossRef]
- McKenzie, L.M.; Allshouse, W.B.; Byers, T.E.; Bedrick, E.J.; Serdar, B.; Adgate, J.L. Childhood hematologic cancer and residential proximity to oil and gas development. PLoS ONE 2017, 12, e0170423. [Google Scholar] [CrossRef] [PubMed]
- McKenzie, L.M.; Guo, R.; Wotter, R.Z.; Savitz, D.A.; Newman, L.S.; Adgate, J.L. Birth outcomes and maternal residential proximity to natural gas development in rural Colorado. Environ. Health Perspect. 2014, 122, 412–417. [Google Scholar] [CrossRef]
- Casey, J.A.; Savitz, D.A.; Rasmussen, S.G.; Ogburn, E.L.; Pollak, J.; Mercer, D.G.; Schwartz, B.S. Unconventional natural gas development and birth outcomes in Pennsylvania, USA. Epidemiology 2016, 27, 162–172. [Google Scholar] [CrossRef] [PubMed]
- Rabinowitz, P.M.; Silzovskly, I.B.; Lamers, V.; Trufan, S.J.; Holford, T.R.; Dziura, J.D.; Peduzi, P.N.; Kane, M.J.; Reif, J.S.; Weiss, T.; et al. Proximity to natural gas wells and reported health status: Results of a household survey in Washington County, Pennsylvania. Environ. Health Perspect. 2015, 123, 21–26. [Google Scholar] [CrossRef] [PubMed]
- Rasmussen, S.G.; Ogburn, E.L.; McCormack, M.; Casey, J.A.; Bandeen-Roche, K.; Mercer, D.G.; Schwartz, B.S. Asthma exacerbations and unconventional natural gas development in the Marcellus Shale. JAMA Intern. Med. 2016, 176, 1334–1343. [Google Scholar] [CrossRef] [PubMed]
- Tustin, A.W.; Hirsch, A.G.; Rasmussen, S.G.; Casey, J.A.; Bandeed-Roche, K.; Schwartz, B.S. Associations between unconventional natural gas development and nasal and sinus, migraine headache, and fatigue symptoms in Pennsylvania. Environ. Health Perspect. 2017, 125, 189–197. [Google Scholar] [CrossRef]
- Karion, A.; Sweeney, C.; Petron, G.; Frost, G.; Hardesty, R.M.; Kofler, J.; Miller, B.R.; Newberger, T.; Wolter, S.; Hanta, R.; et al. Methane emissions estimate from airborne measurements over a western United States natural gas field. Geophys. Res. Lett. 2013, 40, 4393–4397. [Google Scholar] [CrossRef]
- Brandt, A.R.; Health, G.A.; Kort, E.A.; O’Sullivan, F.; Petron, G.; Jordon, S.M.; Tans, P.; Wilcox, J.; Gopstein, A.M.; Arent, D.; et al. Methane leaks from North American natural gas systems. Science 2014, 343, 733–735. [Google Scholar] [CrossRef]
- Alvarez, R.A.; Zavala-Avalza, D.; Lyon, D.R.; Allen, D.T.; Barkley, A.R.; Brandt, A.R.; David, K.J.; Herndon, S.C.; Jacob, D.J.; Karion, A.; et al. Assessment of methane emissions from the U.S. oil and gas supply chain. Science 2015, 361, 186–188. [Google Scholar] [CrossRef]
- Miller, S.M.; Wofsy, S.C.; Michalak, A.M.; Kort, E.A.; Andrews, A.E.; Biraud, S.C.; Djugokencky, E.J.; Eluszkiewicz, J.; Fischer, M.L.; Janssens-Maenhout, G.; et al. Anthropogenic emissions of methane in the United States. Proc. Natl. Acad. Sci. USA 2013, 110, 20018–20022. [Google Scholar] [CrossRef]
- Howarth, R.W.; Santoro, R.; Ingraffea, A. Methane and the greenhouse-gas footprint of natural gas from shale formations. Clim. Chang. 2011, 106, 679–690. [Google Scholar] [CrossRef]
- Nisbet, E.G.; Dlugokansky, E.J.; Bousquet, P. Methane on the rise—Again. Science 2014, 343, 493–495. [Google Scholar] [CrossRef]
- IARC (International Agency for Research on Cancer). Air Pollution and Cancer; IARC Scientific Publication No. 161; World Health Organization: Lyon, France, 2013; p. 170. [Google Scholar]
- Bell, M.L.; Ebisu, K.; Leaderer, B.P.; Gent, J.F.; Lee, H.J.; Koutrakis, P.; Wang, Y.; Dominici, F.; Peng, R.D. Associations of PM2.5 constituents and source with hospital admissions: Analysis of four counties in Connecticut and Massachusetts (USA) for persons> 65 years of age. Environ. Health Perspect. 2014, 122, 138–144. [Google Scholar] [CrossRef] [PubMed]
- Song, Q.; Christiani, D.C.; Wang, X.; Ren, J. The global contribution of outdoor air pollution to the incidence, prevalence, mortality and hospital admission for chronic obstructive pulmonary disease: A systematic review and meta-analysis. Int. J. Environ. Res. Public Health 2015, 11, 11822–11832. [Google Scholar] [CrossRef]
- Krall, J.R.; Mulholland, J.A.; Russell, A.G.; Balachandran, S.; Winquist, A.; Tolbert, P.E.; Waller, L.A.; Sarnat, S.E. Associations between source-specific fine particulate matter and emergency department visits for respiratory disease in four U.S. cities. Environ. Health Perspect. 2017, 125, 97–103. [Google Scholar] [CrossRef] [PubMed]
- Schwartz, J.; Bind, M.A.; Koutrakis, P. Estimating causal effects of local air pollution on daily deaths: Effect of low levels. Environ. Health Perspect. 2017, 125, 23–29. [Google Scholar] [CrossRef] [PubMed]
- Stofaggia, M.; Cesaroni, G.; Peters, A.; Andersen, Z.J.; Badaloni, C.; Beelen, R.; Caracciolo, B.; Cyrys, J.; de Faire, U.; de Hoogh, K.; et al. Long-term exposure to ambient air pollution and incidence of cerebrovascular events: Results from 11 European cohorts within the ESCAPE project. Environ. Health Perspect. 2014, 122, 919–925. [Google Scholar] [CrossRef]
- Zhang, Z.; Laden, F.; Forman, J.P.; Hart, J.E. Long-term exposure to particulate matter and self-reported hypertension: A prospective analysis in the nurses’ health study. Environ. Health Perspect. 2016, 124, 1414–1420. [Google Scholar] [CrossRef]
- Trasande, L.; Malecha, P.; Attina, T.M. Particulate matter exposure and preterm birth: Estimate of U.S. attributable burden and economic costs. Environ. Health Perspect. 2016, 124, 1913–1918. [Google Scholar] [CrossRef]
- Tzvian, L.; Dlugaj, M.; Winkler, A.; Weinmayr, G.; Hennig, F.; Fuks, K.B.; Vossoughi, M.; Schikowski, T.; Weimar, C.; Erbel, R.; et al. Long-term air pollution and traffic noise exposures and mild cognitive impairment in older adults: A cross-sectional analysis of the heinz nixdorf recall study. Environ. Health Perspect. 2016, 124, 1361–1368. [Google Scholar] [CrossRef] [PubMed]
- Finkel, M.L. Shale gas development and cancer incidence in southwest Pennsylvania. Public Health 2016, 141, 198–206. [Google Scholar] [CrossRef]
- Glass, D.C.; Gray, C.N.; Jolley, D.J.; Gibbons, C.; Sim, M.R.; Fritschi, L.; Adams, G.G.; Bisby, J.A.; Manuell, W.R. Leukemia risk associated with low-level benzene exposure. Epidemiology 2003, 14, 569–577. [Google Scholar] [CrossRef]
- Boberg, R.; Lessneer, L.; Carpenter, D.O. The role of residence near hazardous waste sites containing benzene in the development of hematologic cancers in upstate New York. Int. J. Occup. Med. Environ. Health 2011, 24, 1–12. [Google Scholar] [CrossRef] [PubMed]


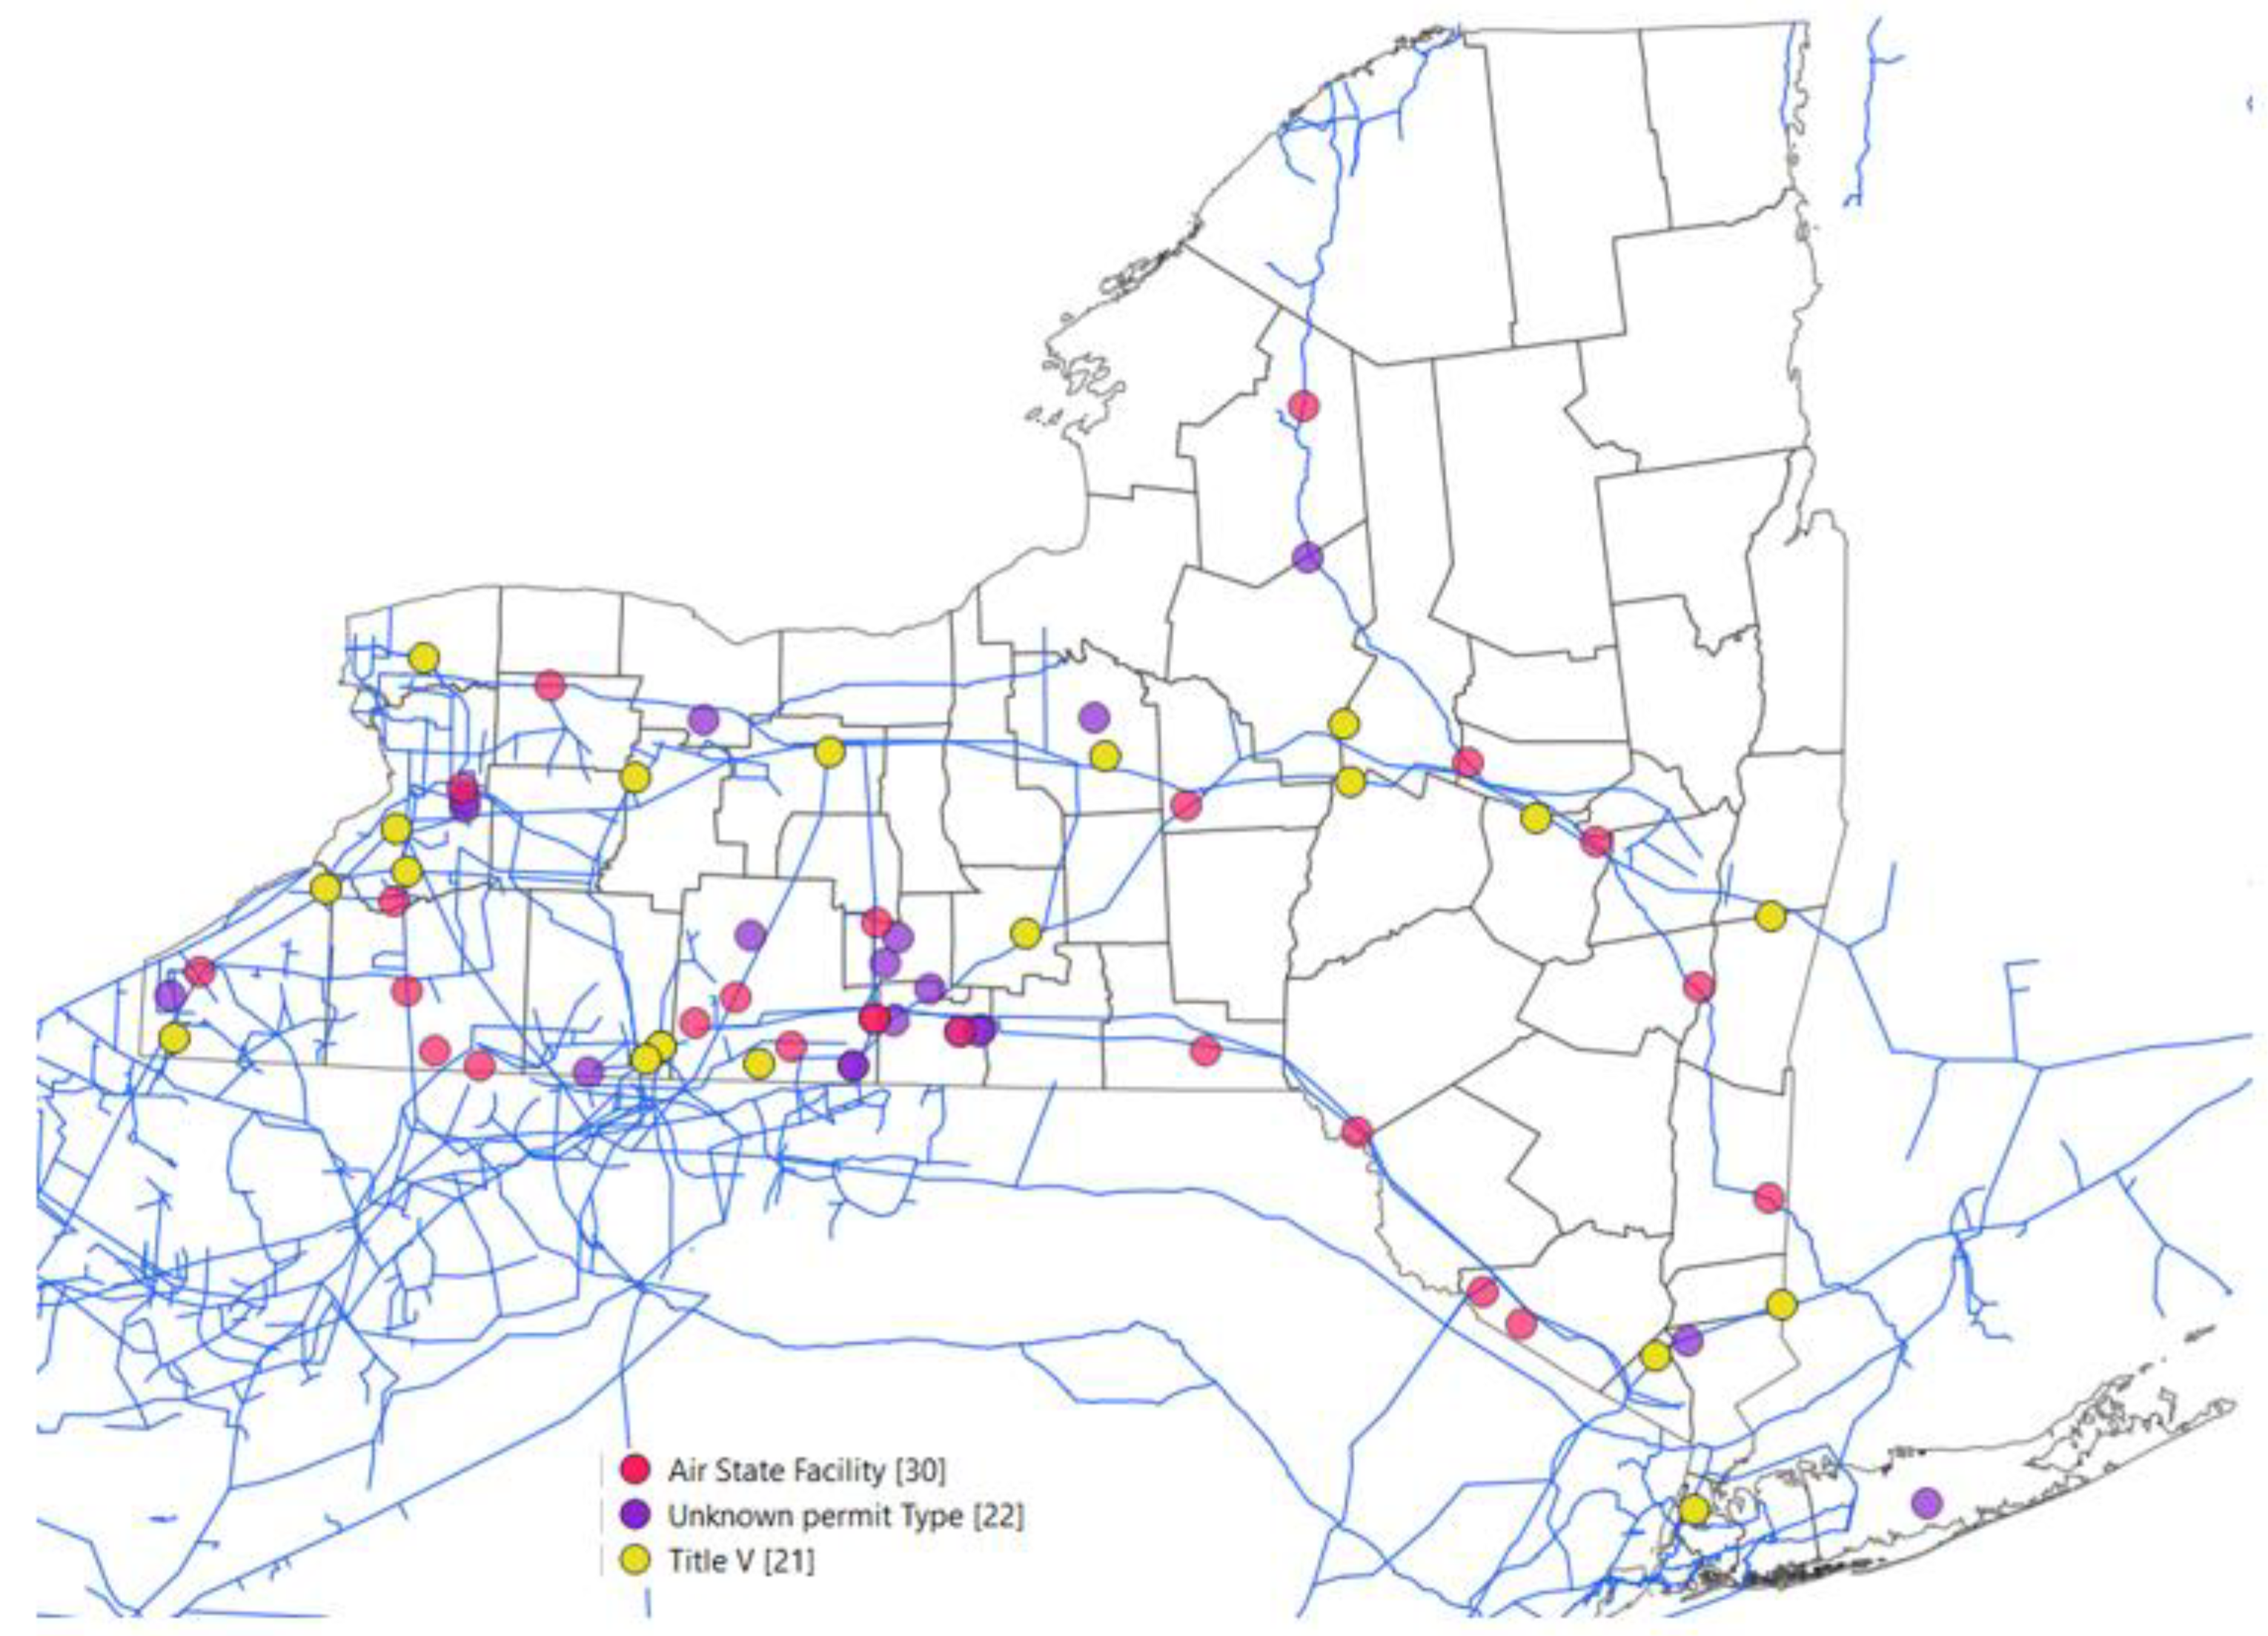
| Compressor Stations by Permit Type | 74 |
|---|---|
| Title V | 21 |
| Air State Permit | 30 |
| No permit information | 22 |
| Mapped in Figure 1 | 63 |
| Other Facilities | |
| Underground storage facilities | 26 |
| Rank | Chemical | NEI-2008 | NEI 2011 | NEI 2014 | 2008–2014 Estimate |
|---|---|---|---|---|---|
| 1 | Nitrogen oxides | 2,269,341 | 2,991,946 | 2,487,284 | 18,079,997 |
| 2 | Carbon monoxide | 1,415,996 | 2,029,497 | 1,850,403 | 12,357,089 |
| 3 | Volatile organic compounds | 374,277 | 830,863 | 902,548 | 4,917,940 |
| Benzene | 110,334 | 229,882 | 220,928 | 1,309,335 | |
| Formaldehyde | 2029 | 3875 | 3199 | 21,240 | |
| 1,3-Butadiene | 273 | 999 | 751 | 4719 | |
| Other VOCs | 261,642 | 596,107 | 677,671 | 3,582,646 | |
| 4 | PM 10 Primary (Filt + Cond) | 107,946 | 241,483 | 189,665 | 1,257,888 |
| 5 | Sulfur dioxide | 7587 | 13,894 | 58,287 | 186,124 |
| 6 | Ammonia | 262 | 209 | 174 | 1505 |
| 7 | Nickel | 169 | 21 | 107 | 692 |
| 8 | Manganese | 104 | 0 | 47 | 350 |
| 9 | Mercury | 17 | 6 | 6 | 70 |
| 10 | Chromium III | 16 | 0 | 7 | 56 |
| 11 | Phenanthrene | 4 | 14 | 2 | 48 |
| 12 | PAH, total | 0 | 0 | 15 | 35 |
| 13 | Cadmium | 9 | 0 | 4 | 30 |
| 14 | Fluorene | 2 | 8 | 1 | 28 |
| 15 | Benz[a]anthracene | 4 | 2 | 2 | 19 |
| 16 | Fluoranthene | 2 | 2 | 1 | 11 |
| 17 | Anthracene | 0 | 4 | 0 | 10 |
| Other chemicals (19) | 4 | 4 | 1 | 21 | |
| Total | 4,175,740 | 6,107,954 | 5,488,555 | 36,801,914 |
| Town | NEI-2008 | NEI 2011 | NEI 2014 | 2008–2014 Estimate |
|---|---|---|---|---|
| Andover | 110,115 | 194,987 | 241,599 | 1,275,636 |
| Carlisle | 692,603 | 476,313 | 490,580 | 3,872,157 |
| Clifton Spring | 288,483 | 434,874 | 167,787 | 2,079,336 |
| Clymer | 39,824 | 350,616 | 51,161 | 1,030,402 |
| Concord | 331,832 | 934 | 317,222 | 1,516,638 |
| Eden 1 | 458,153 | 1,062,255 | 502,879 | 4,721,002 |
| Eden 2 | 78,928 | 2605 | 115,654 | 460,102 |
| Forestville | 94,041 | 72,528 | 0 | 582,989 |
| Ithaca | 127,634 | 81,663 | 119,933 | 768,204 |
| LaFayette | 265,611 | 485,718 | 388,652 | 2,659,956 |
| New Hartford | 45,120 | 53,281 | 9667 | 252,161 |
| Riders Mills | 282,478 | 243,945 | 447,805 | 2,273,200 |
| Southeast | 156,151 | 220,860 | 273,543 | 1,517,959 |
| Stony Point | 234,506 | 236,490 | 310,657 | 1,823,858 |
| Willing | 108,133 | 201,357 | 245,720 | 1,295,491 |
| Winfield | 707,609 | 1,782,565 | 1,773,419 | 9,948,386 |
| Woodhull | 102,213 | 178,035 | 22,769 | 707,040 |
| York | 52,304 | 28,925 | 9,510 | 211,725 |
| Total | 4,175,740 | 6,107,954 | 5,488,555 | 36,996,244 |
| Town | CO2 non-Biological | CH4 | Total |
|---|---|---|---|
| Andover | 10,527,722 | 2,725,796 | 13,253,518 |
| Carlisle | 85,376,555 | 176,468 | 85,553,023 |
| Clymer | 9,331,054 | 62,399 | 9,393,453 |
| Concord | 40,485,642 | 1,789,128 | 42,274,770 |
| Eden 1 | 32,559,592 | 287,408 | 32,847,000 |
| Eden 2 | 100,509,508 | 127,710 | 100,637,218 |
| LaFayette | 79,500,361 | 233,158 | 79,733,519 |
| Southeast | 241,438,739 | 243,453 | 241,682,192 |
| Stony Point | 165,034,546 | 223,690 | 165,258,236 |
| Winfield | 100,681,909 | 261,740 | 100,943,649 |
| Total | 6,122,265,234 | 6,217,993 | 6,128,483,227 |
| Chemical | Authority | Stations Reporting | ||||
|---|---|---|---|---|---|---|
| IARC | CA P65 | USEPA | 2008 | 2011 | 2014 | |
| Acetaldehyde | 2B | Known | B2 | 13 | 14 | 12 |
| Arsenic | 1 | Known | A | 5 | 4 | 2 |
| Benz[a]anthracene | 2B | Known | B2 | 9 | 7 | 2 |
| Benzene | 1 | Known | Known/Likely | 16 | 15 | 14 |
| Benzo[a]pyrene | 1 | Known | B2 | 7 | 5 | 1 |
| Benzo[b]fluoranthene | 2B | Known | B2 | 9 | 8 | 3 |
| Benzo[k]fluoranthene | 2B | Known | B2 | 5 | 0 | 0 |
| Beryllium | 1 | Known | Known/Likely | 4 | 5 | 2 |
| 1,3-Butadiene | 1 | Known | Known | 13 | 12 | 12 |
| Cadmium | 1 | Known | B1 | 9 | 5 | 4 |
| Carbon tetrachloride | 2B | Known | Likely | 6 | 4 | 4 |
| Chloroform | 2B | Known | Likely | 6 | 4 | 4 |
| Chrysene | 2B | Known | B2 | 9 | 8 | 3 |
| Cobalt | 2B | Known | NR | 5 | 4 | 2 |
| Dibenzo[a,h]anthracene | 2A | Known | NR | 4 | 0 | 0 |
| 1,3-Dichloropropene | 2B | Known | B | 8 | 0 | 3 |
| 7,12-Dimethylbenz[a]anthracene | NR | Known | NR | 0 | 3 | 2 |
| Ethyl benzene | 2B | Known | D | 13 | 13 | 13 |
| Ethyl chloride | 3 | Known | NR | 4 | 4 | 4 |
| Ethylene dibromide | 2A | Known | Likely | 6 | 4 | 5 |
| Ethylene dichloride | 2B | Known | B2 | 6 | 3 | 3 |
| Ethylidene dichloride | NR | Known | C | 6 | 3 | 3 |
| Formaldehyde | 1 | Known | B1 | 18 | 17 | 16 |
| Indeno[1,2,3-c,d]pyrene | 2B | Known | B2 | 1 | 4 | 1 |
| Lead | 2B | Known | B2 | 16 | 8 | 10 |
| 3-Methylcholanthrene | NR | Known | NR | 0 | 3 | 0 |
| Methylene chloride | 2A | Known | Likely | 11 | 6 | 8 |
| Naphthalene | 2B | Known | C | 15 | 15 | 12 |
| Nickel | 1 | Known | A | 11 | 6 | 5 |
| PM2.5 Filterable | 1 | MC | NR | 18 | 18 | 15 |
| PM2.5 Primary (Filt + Cond) | 1 | MC | NR | 18 | 18 | 15 |
| PM Condensable | 1 | No Record | NR | 18 | 18 | 15 |
| Propylene dichloride | 1 | Known | NR | 6 | 3 | 3 |
| Propylene oxide | 2B | Known | B2 | 8 | 5 | 4 |
| Styrene | 2B | Known | NR | 6 | 4 | 4 |
| 1,1,2,2-Tetrachloroethane | 2B | Known | Likely | 10 | 7 | 6 |
| Tetrachloroethylene | 2A | Known | Likely | 4 | 4 | 4 |
| 1,1,2-Trichloroethane | 3 | Known | C | 6 | 4 | 4 |
| Vinyl chloride | 1 | Known | A | 6 | 4 | 5 |
- IARC:
- 1-Known, 2A-Probable, 2B-Possible, 3-Unclassifiable (evidence of carcinogenicity is inadequate in humans and inadequate or limited in experimental animals), NR-No Records
- CA P65:
- MC-Member candidate
- USEPA:
- Group A: “Human Carcinogen” - There is enough evidence to conclude that it can cause cancer in humans. Group B1: “Probable Human Carcinogen” - There is limited evidence that it can cause cancer in humans, but at present it is not conclusive. Group B2: “Probable Human Carcinogen” - There is inadequate evidence that it can cause cancer in humans but at present it is far from conclusive. Group C: “Possible Human Carcinogen” - There is limited evidence that it can cause cancer in animals in the absence of human data, but at present it is not conclusive. Group D: “Not Classifiable as to Human Carcinogenicity” - There is no evidence at present that it causes cancer in humans. Group E: “Evidence of Non-Carcinogenicity for Humans” - There is strong evidence that it does not cause cancer in humans.
© 2019 by the authors. Licensee MDPI, Basel, Switzerland. This article is an open access article distributed under the terms and conditions of the Creative Commons Attribution (CC BY) license (http://creativecommons.org/licenses/by/4.0/).
Share and Cite
Russo, P.N.; Carpenter, D.O. Air Emissions from Natural Gas Facilities in New York State. Int. J. Environ. Res. Public Health 2019, 16, 1591. https://doi.org/10.3390/ijerph16091591
Russo PN, Carpenter DO. Air Emissions from Natural Gas Facilities in New York State. International Journal of Environmental Research and Public Health. 2019; 16(9):1591. https://doi.org/10.3390/ijerph16091591
Chicago/Turabian StyleRusso, Pasquale N., and David O. Carpenter. 2019. "Air Emissions from Natural Gas Facilities in New York State" International Journal of Environmental Research and Public Health 16, no. 9: 1591. https://doi.org/10.3390/ijerph16091591
APA StyleRusso, P. N., & Carpenter, D. O. (2019). Air Emissions from Natural Gas Facilities in New York State. International Journal of Environmental Research and Public Health, 16(9), 1591. https://doi.org/10.3390/ijerph16091591