1. Introduction
Mercury (Hg) is a global contaminant due to its high toxicity, bioaccumulation, and long residence time in the atmosphere during widespread transport, adversely affecting ecosystems and human beings [
1,
2,
3,
4]. Increasing mercury releases from human activities and increasing deposition of mercury to the soil [
5,
6,
7] have resulted in severe soil pollution problems. Soil, as an essential medium for connecting atmosphere and water, plays a critical role in the global mercury cycle [
8]. Soil is not only the sink of mercury but also the source of mercury, receiving the mercury input from the environment and re-emitting the deposit of mercury to the atmosphere [
9], water [
10] or plants [
11]. Mercury contamination in the soil can suppress crops growth or kill plants, eventually affecting human health through bioaccumulation [
12,
13]. Therefore, soil mercury is closely related to the survival of humanity and the growth of crops [
14]. As mercury pollutants have caught the interest of many researchers, some studies have already reported the behavior of mercury in the surficial environment around the world [
15,
16,
17]. Thailand has undergone industrialization and urbanization development, as well as the increasing anthropogenic pollution deposited to the soil during this process [
18]. However, these studies have been focused on mercury pollutants in the surface soil in Thailand except for the Mun River basin [
19,
20,
21]. The lack of investigation into the vertical mercury distribution and content of mercury in the Mun River basin has made it difficult to identify potential contaminant problems. Moreover, a study on the controlling factors for mercury distribution behavior in different land use types is useful for providing basic ideas for solving potential mercury contamination in the future.
The objective of this study was to analyze mercury contamination, vertical mercury distribution patterns under different land uses, and the controlling factors of distribution to determine the geochemical characteristics of mercury in the Mun River basin, Thailand. Besides, the evaluation of mercury contamination can be used to provide advice for guiding agricultural activities in the future.
2. Materials and Methods
2.1. Study Area
The Mun River, located in the northeast of Thailand, is the main river system in the Korat Plateau. The Mun River, with a length of 673 km, covers 10 provinces and finally joins the Mekong river. The study area, the Mun River basin (14° N–16° N and 101°30′ E–105°30′ E), is the largest basin in Thailand with an area of approximately 82,000 km
2 [
22]. Within the basin, the terrain increases from east to west, and the area of the southwest is mountainous, while plains are distributed in the central and eastern regions [
23]. The climate of the basin is humid subtropical [
24], leading to the rainy and dry seasons. The annual precipitation is between 800 and 1800 mm [
25]. The rainy season is from mid-May to mid-October and is affected by the southwest monsoon, with maxima rainfall generally in August or September. The dry season is from November to April and is generated by the northeast monsoon. The monthly average temperature is from 25 to 30 °C [
25], and the highest temperature is in April. The fluvial deposit area where the Mun River flows through is primarily dominated by cretaceous claystone and sandstone with some halite and gypsum spread around the basin, while there is less than 10% coverage of tertiary basalt in the south of basin [
22,
26].
As Thailand is a large rice-producing country, the main land use type is agricultural land in the Mun River basin, of which 75% is paddy land [
25]. The primary rice cultivation technique is seeding, and it takes nearly a half year (July to November) for the rice to go from growth to ripe [
27]. With the well-development of agriculture in the Mun River basin, a few industry areas are scattered in the basin. The dry land is main in the Upper Mun River, while the paddy land concentrates in Lower-Middle Mun River. The woodland and the grassland are mainly distributed in the south of the Mun River basin, and the rest of them are sporadically distributed around the basin (
Figure 1).
2.2. Sampling Collection and Sample Analysis Methods
Sample collection was implemented in March 2018. A total of 240 soil samples was collected from six profiles by taking different land use types into consideration, as shown in
Figure 1. Additionally, the Thailand soil sites (TS) were chosen by considering intense agricultural activities, which are concentrated in the Upper Mun River and Lower Mun River. In order to compare the behavior and content of mercury in different land use types, the six sampling sites were set into agricultural land, abandoned agricultural land, and woodland. The location of each sampling site was recorded by a global positioning system (GPS), including the longitude and latitude coordinates; meanwhile, the land use type and soil conditions in the sampling sites were documented, as detailed in
Table 1. In general, soil mercury content is affected by complicated factors from top to bottom; thus, a uniform sampling interval was performed in each sampling site to study the behavior of the soil mercury content. The different sampling intervals were based on the observation of the soil layer in the field, and a smaller interval was adopted in the complex soil conditions [
28]. The color and particle of the soil in the TS5 profile change rapidly with soil depth. A 2 cm interval of sample collection was adopted in order to clearly show the variation of every property of the soil samples with depth. Sample collection was carried out by digging out each soil profile, using a tap measure to mark the depth, and then collecting the soil samples from bottom to top to avoid the mixed pollution. Every collected soil sample was about 2 kg.
The Hg (mercury) content was determined by an RA-915M mercury analyzer (Lumex Instrument, St. Petersburg, Russia) using the direct injection of a solid module, which was successfully applied in a previous study [
29]. Compared to the atomic fluorescence spectrometer, this method directly focuses on soil samples without any digestion involved in the procedure; a lack of pre-treatment or digestion reduces the possibility of mercury loss and contamination during the process; meanwhile, this analysis is fast, accurate, and low cost. The standard reference materials GBW07402 (15 ± 3 μg∙kg
−1) and GBW07405 (290 ± 30 μg∙kg
−1) were provided by China National Standard Materials Research Center, and they were used to evaluate analyzer accuracy. The analyzer relative standard deviation (RSD) was 4.8%, and the detection limit was 0.10 μg∙kg
−1 [
29]. The Fe
2O
3 content was measured by ICP-OES (Optima 5300DV, Perkin Elmer, Waltham, MA, USA). The pH values were determined by a pH-meter (INESA Scientific Instrument Co., Ltd., Shanghai, China). The measurement of soil particle size was determined using a Mastersizer-2000 (Malvern Panalytical Ltd., Malvern, UK). The ISSS (International Society of Soil Science) method was used to describe the soil texture.
The mercury contamination of the study area was assessed by the geoaccumulation index (
Igeo), the formula of which is:
where
Cn is the concentration of the samples for metal n;
Bn is the background value of study area for metal n; and
k (usually 1.5) is the correction index that is commonly used to characterize sedimentary characteristics, rock geology, and other effects. The mercury background value of soil in this study area was 11 μg∙kg
−1 [
20], which was from the ultisol soil type, which represented the majority of the agricultural soils in Thailand, meaning the
Bn was 11 μg∙kg
−1. In general, the contamination level of the geoaccumulation index includes seven grades, and the risk of each level is shown in the
Table 2.
2.3. Statistical Analysis
The statistical analysis was analyzed by SPSS 18.0 (SPSS Inc., Chicago, IL, USA). The relationships among the mercury content, the total organic carbon (TOC) content, the Fe content, and pH value were determined by regression analyses. The bivariate correlations with a Pearson correlation coefficient and two-side test in significance test were adopted; the coefficient R2 and p-values were determined while the fitting lines were drawn. The figures were drawn using Origin 9.0 (OriginLab Corporation, Northampton, MA, USA).
3. Results and Discussion
3.1. Content of THg in Soil
The total mercury (THg) contents in different sampling sites are shown in
Table 3. In the TS4 and TS5 sampling sites, the content of mercury in the soil was not detected after 116 and 290 cm, respectively. Moreover, a sample in TS4 where the content of mercury was much higher than those in other profiles is shown in
Figure 2a.
In general, the average THg content tested in this study was 12.16 μg∙kg
−1, ranging from 0.13 to 69.4 μg∙kg
−1. The mercury content of the agricultural land topsoil (0–20 cm) in this study (9.8–21.5 μg∙kg
−1) was higher than that of other paddy land (3.2–4.05 μg∙kg
−1) [
21] in Thailand. The average contents of THg were generally lower than those in different contamination sources have been reported by other researchers in Thailand, such as municipal waste in Samui Island (76–215 μg∙kg
−1) [
30] and mining in Phichit Province (16–181 μg∙kg
−1) [
31], indicating that the contamination from agriculture is lower than those from mining or municipal waste.
Figure 2b shows distinct differences of the THg content among different land use types. In the depth of 0–30 cm, the average content of THg in the agricultural land and the woodland was 13.48 and 15.89 μg∙kg
−1, respectively, while the average content in the abandoned agricultural land was 4.08 μg∙kg
−1. A likely explanation for this is that the higher content of THg in the agricultural land and the woodland is a result of crops or plants, implying that the widespread contamination of mercury in the soil happens via agricultural activities [
20]. The influence of using fertilizer, dung, and sludge during agricultural activities may result in the enrichment of mercury in the crop lands [
32].
3.2. Vertical Distribution of THg in Soil Profiles
The vertical distribution of THg, divided into three types of land use: agricultural land, abandoned agricultural land, and woodland, as shown in
Figure 3. In the agricultural land and the woodland, the content of THg in the surface soil (<2 cm) was a little higher than those at a depth of 2–30 cm. Liu et al. [
33] observed the same phenomenon; a possible reason for this is that the surface soil covered by plants has not been not to be exposed to solar radiation, which makes the lessens the loss of mercury in the surface soil by solar reduction.
In the agricultural land, both TS1 and TS5 showed a homogenous distribution of THg in the surface soil and the deeper layer (<90 cm). However, in the medium and bottom soil, the content of THg in TS1 slightly decreased but was still homogenous, while the THg content in TS5 showed three peaks and was divided into three parts (80–130, 135–160, and 165–290 cm), implying that there were three controlling factors leading to these behaviors. The different vertical behaviors of TS1 and TS5 was due to the complicated variation in the soil of the TS5 profile. As shown in
Table 1, compared with the lack of variation of soil found in the TS1 profile, several different types of soil and the occurrence of Fe-Mn nodules, which have a great adsorption of soil mercury [
34], were observed in the TS5 profile, resulting in more complicated mercury distribution behavior. In the abandoned the agricultural land, there was a gradual increase of the THg content in the deep soil because of the occurrence of Fe-Mn nodules, which can absorb mercury in soil. Compared with the content of THg in the woodland soil, the TS2 profile showed a more homogenous distribution than the TS6 profile. The soil mercury increased with the depth in the TS6 profile, possibly due to the low content of the TOC, oxidizing conditions, acid pH value [
35,
36] and soil texture.
3.3. Influence of Controlling Factors on the Distribution of THg
3.3.1. Organic Carbon and Iron Oxides
With the objective of finding the main controlling factor on the distribution behavior of mercury in the soil profiles, the correlations between organic carbon, iron content, and mercury content were evaluated in this study. Organic carbon plays an essential role in enhancing the capacity of binding metals for soil [
37] and affects the distribution behavior of mercury in soil [
38]. Similar research findings have been reported to verify this correlation between the TOC and mercury [
36,
39,
40], and a high TOC content can increase the baseline content of mercury [
41], which was observed in this study area. As shown in
Figure 4, the THg content of the surface soil and the deeper layer (<90 cm) in the agricultural land and the woodland (oak) showed significantly positive correlations with the TOC, indicating that a high content of the TOC is beneficial for the enrichment of mercury. The high affinity of mercury for the TOC is the reason for the higher THg content in the agricultural land and the woodland than that in the abandoned agricultural land.
In comparison with the TS2 profile, the TS6 profile was supposed to have a high content of the TOC in the soil that was covered by thick leaves, but the result was not expected (
Table 4). The high THg concentration with a low content of the TOC in forest soil showed no correlation between the TOC and THg in
Figure 4. A possible explanation for this is that organic carbon is important in bioavailability [
42], and the organic carbon can be decomposed by soil microorganisms. Wu et al. [
43] stated that the light fraction of organic carbon is easily covered under forest soil and is readily decomposed by soil microorganisms. Pant and Allen [
40] also reported that the decomposed light fraction of organic carbon might affect the Hg/TOC ratio, leading to a low coefficient of correlation between THg and the TOC under forest cover.
It has been reported in some studies that THg concentration decreases with increasing depth studies [
15,
17]. However, THg concentration increased in deep soil such as the abandoned agricultural land (TS3, TS4) and the agricultural land (TS5), as shown in
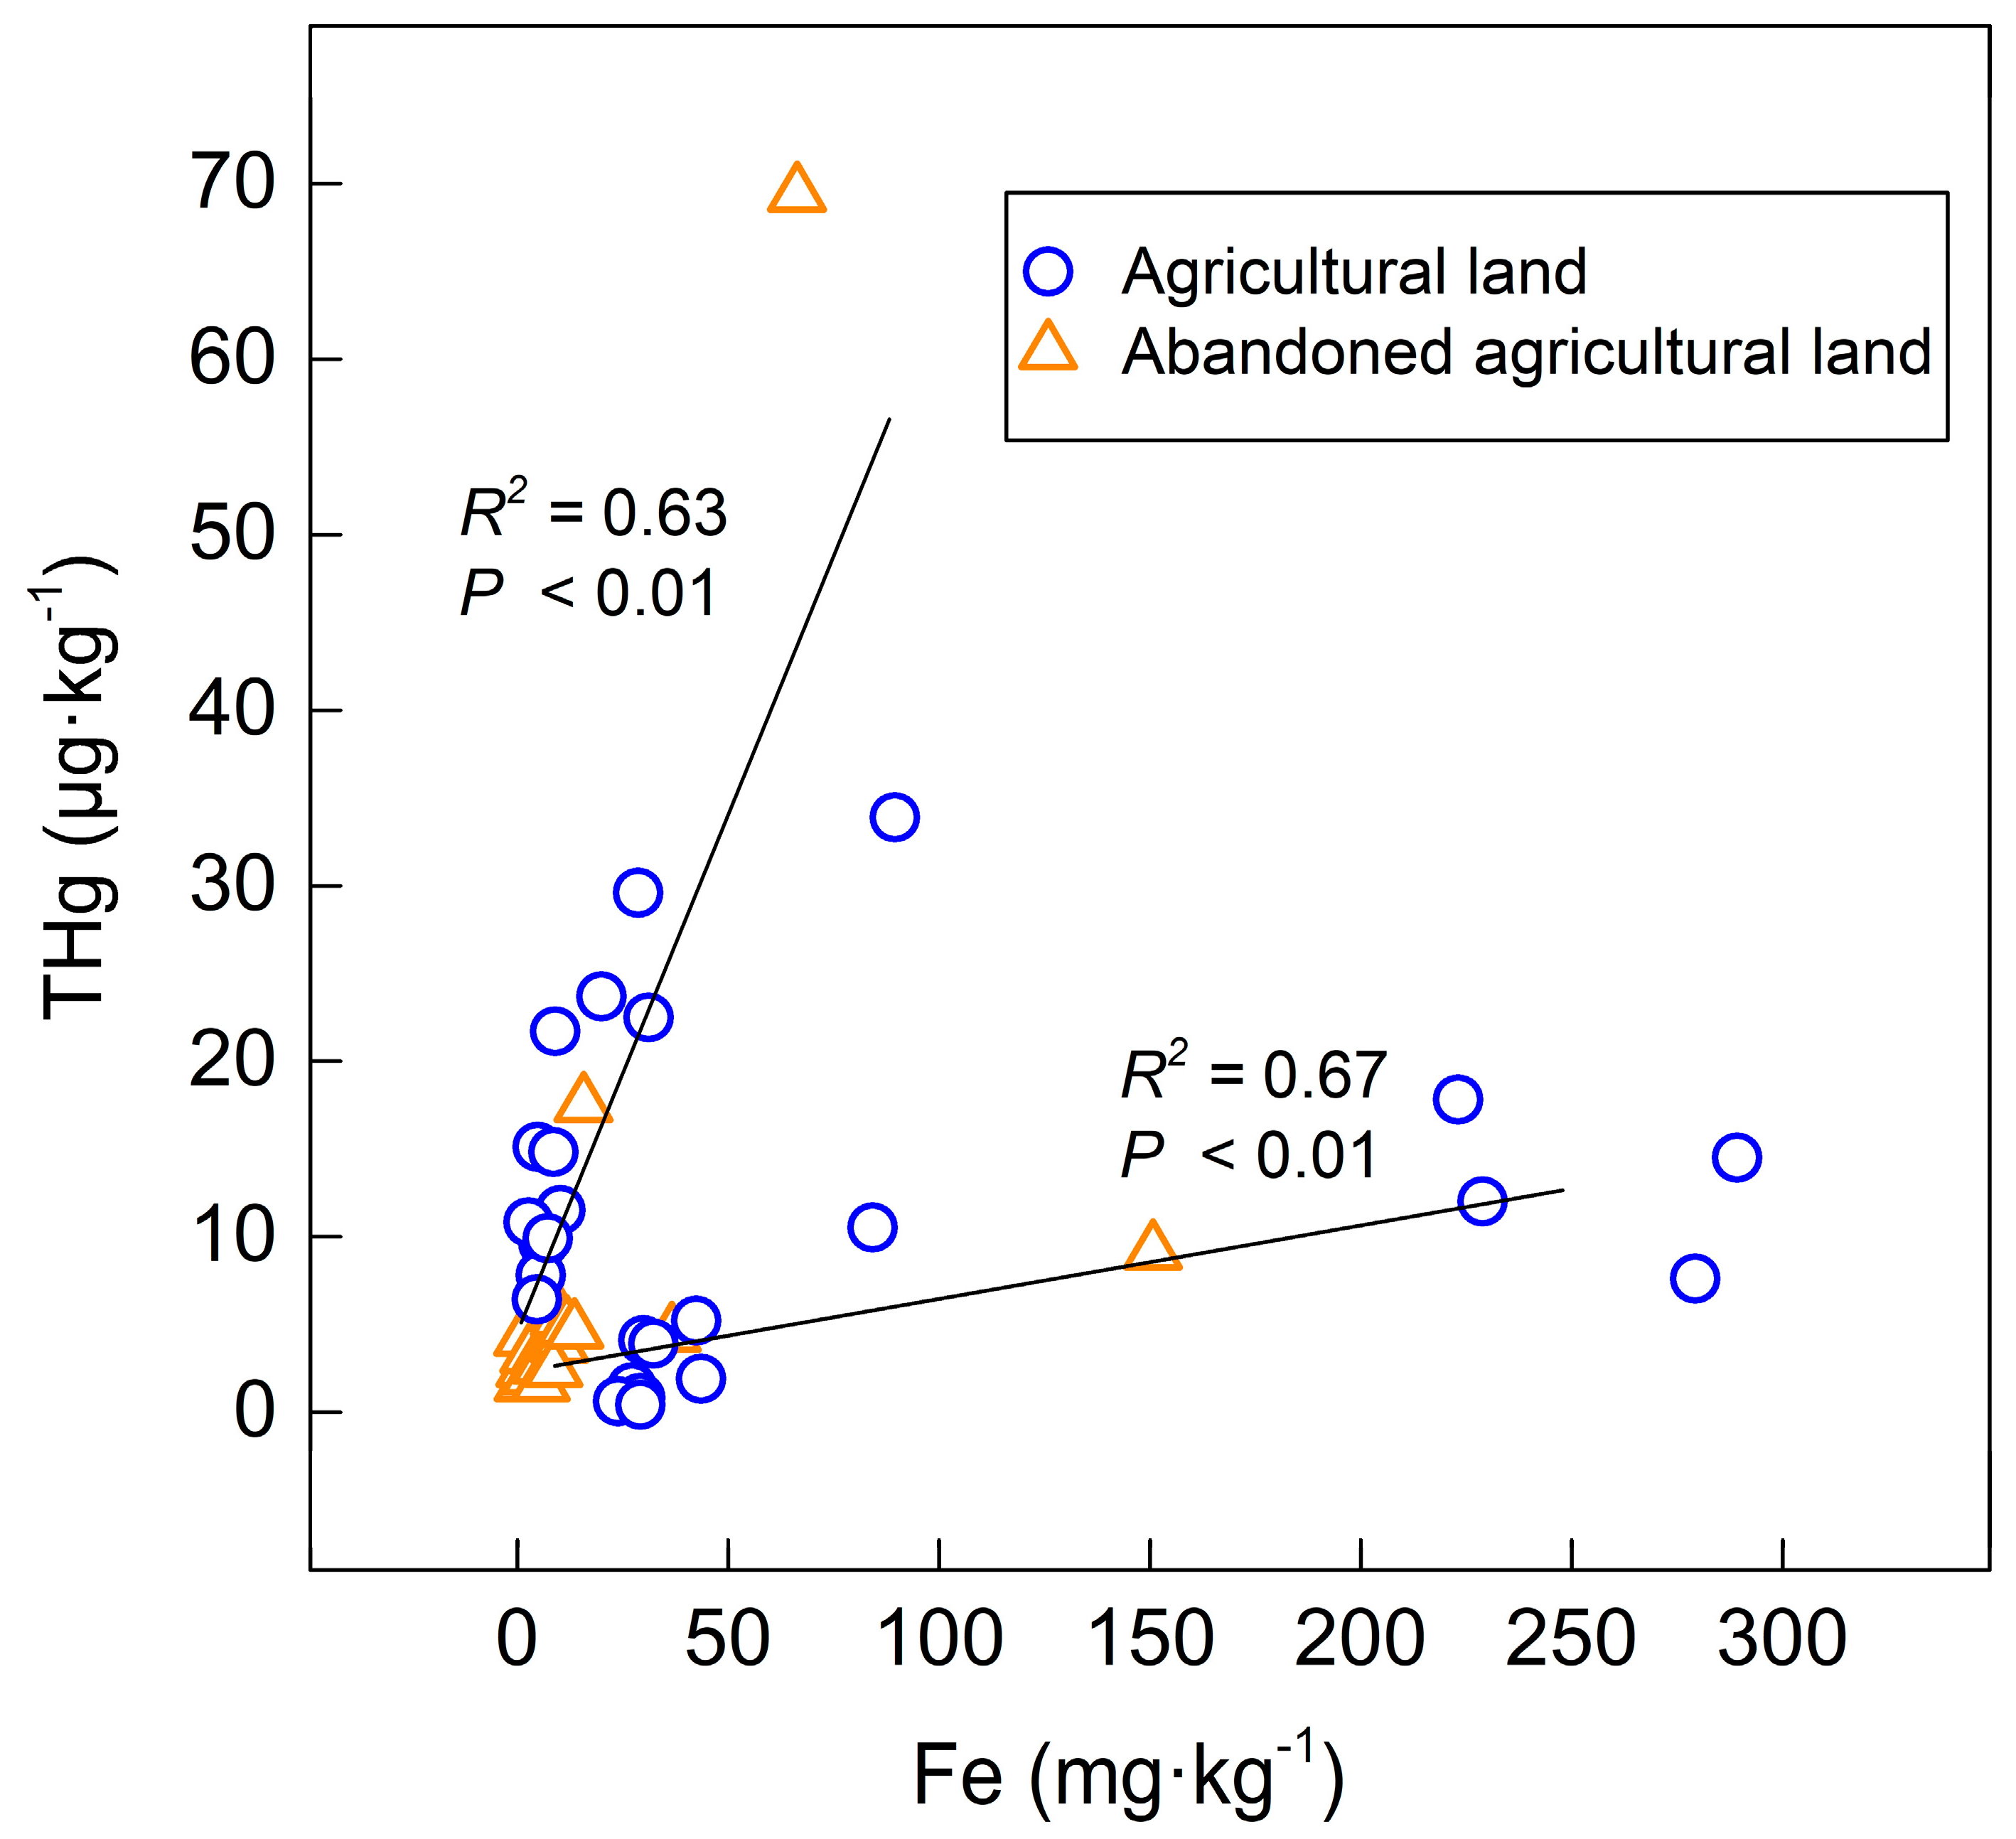
Figure 3, where we found some iron rust and Fe-Mn nodules in the soil (
Table 1). The profiles with Fe-Mn nodule presentation had a distinct variation of Fe content between the surface soil and deep soil, showing a large range of the Fe content and a high standard deviation (
Table 4). As shown in
Figure 5, both the agricultural land and the abandoned agricultural land showed similar correlation trends between the Fe content and the THg content. The different correlation trends in the same land use type indicate that the amount of mercury in the soil affects the adsorption efficiency of iron to mercury.
Zarcinas et al. [
20] adopted a principal component analysis of heavy metal in soil around Thailand and suggested that the content of mercury had a strong correlation with the Fe content. In this study, the Fe content in the deep soil was higher than that in the surface soil, showing that the mercury content increased in the deep soil of the abandoned agricultural land and the occurrence of first and third peaks of the agricultural land (TS5), as shown in
Figure 3.
3.3.2. pH and Soil Texture
Soil properties are supposed to affect the behavior and content of metals [
45]. The pH value in soil can strongly change the mobility of mercury by influencing the different presence forms of mercury. As pH increases in soil, the bioavailability and mobility of mercury decreases [
46,
47,
48], and the content of mercury increases, which is in agreement with our results. In the agricultural land, the occurrence of mercury content decreased in TS1, and the second peak in TS5 (
Figure 4) was attributed to the influence of pH value change. Though no significant variance of the TOC concentration occurred in TS1, the average content of mercury slightly decreased from 15.72 to 10.44 μg∙kg
−1. This discrepancy could be attributed to the decrease in pH value, which reduced from 6.55 to 6.14. A decrease in pH may reduce the adsorption of mercury by soil or the TOC, or it may increase the mobility and bioavailability of mercury [
49,
50].
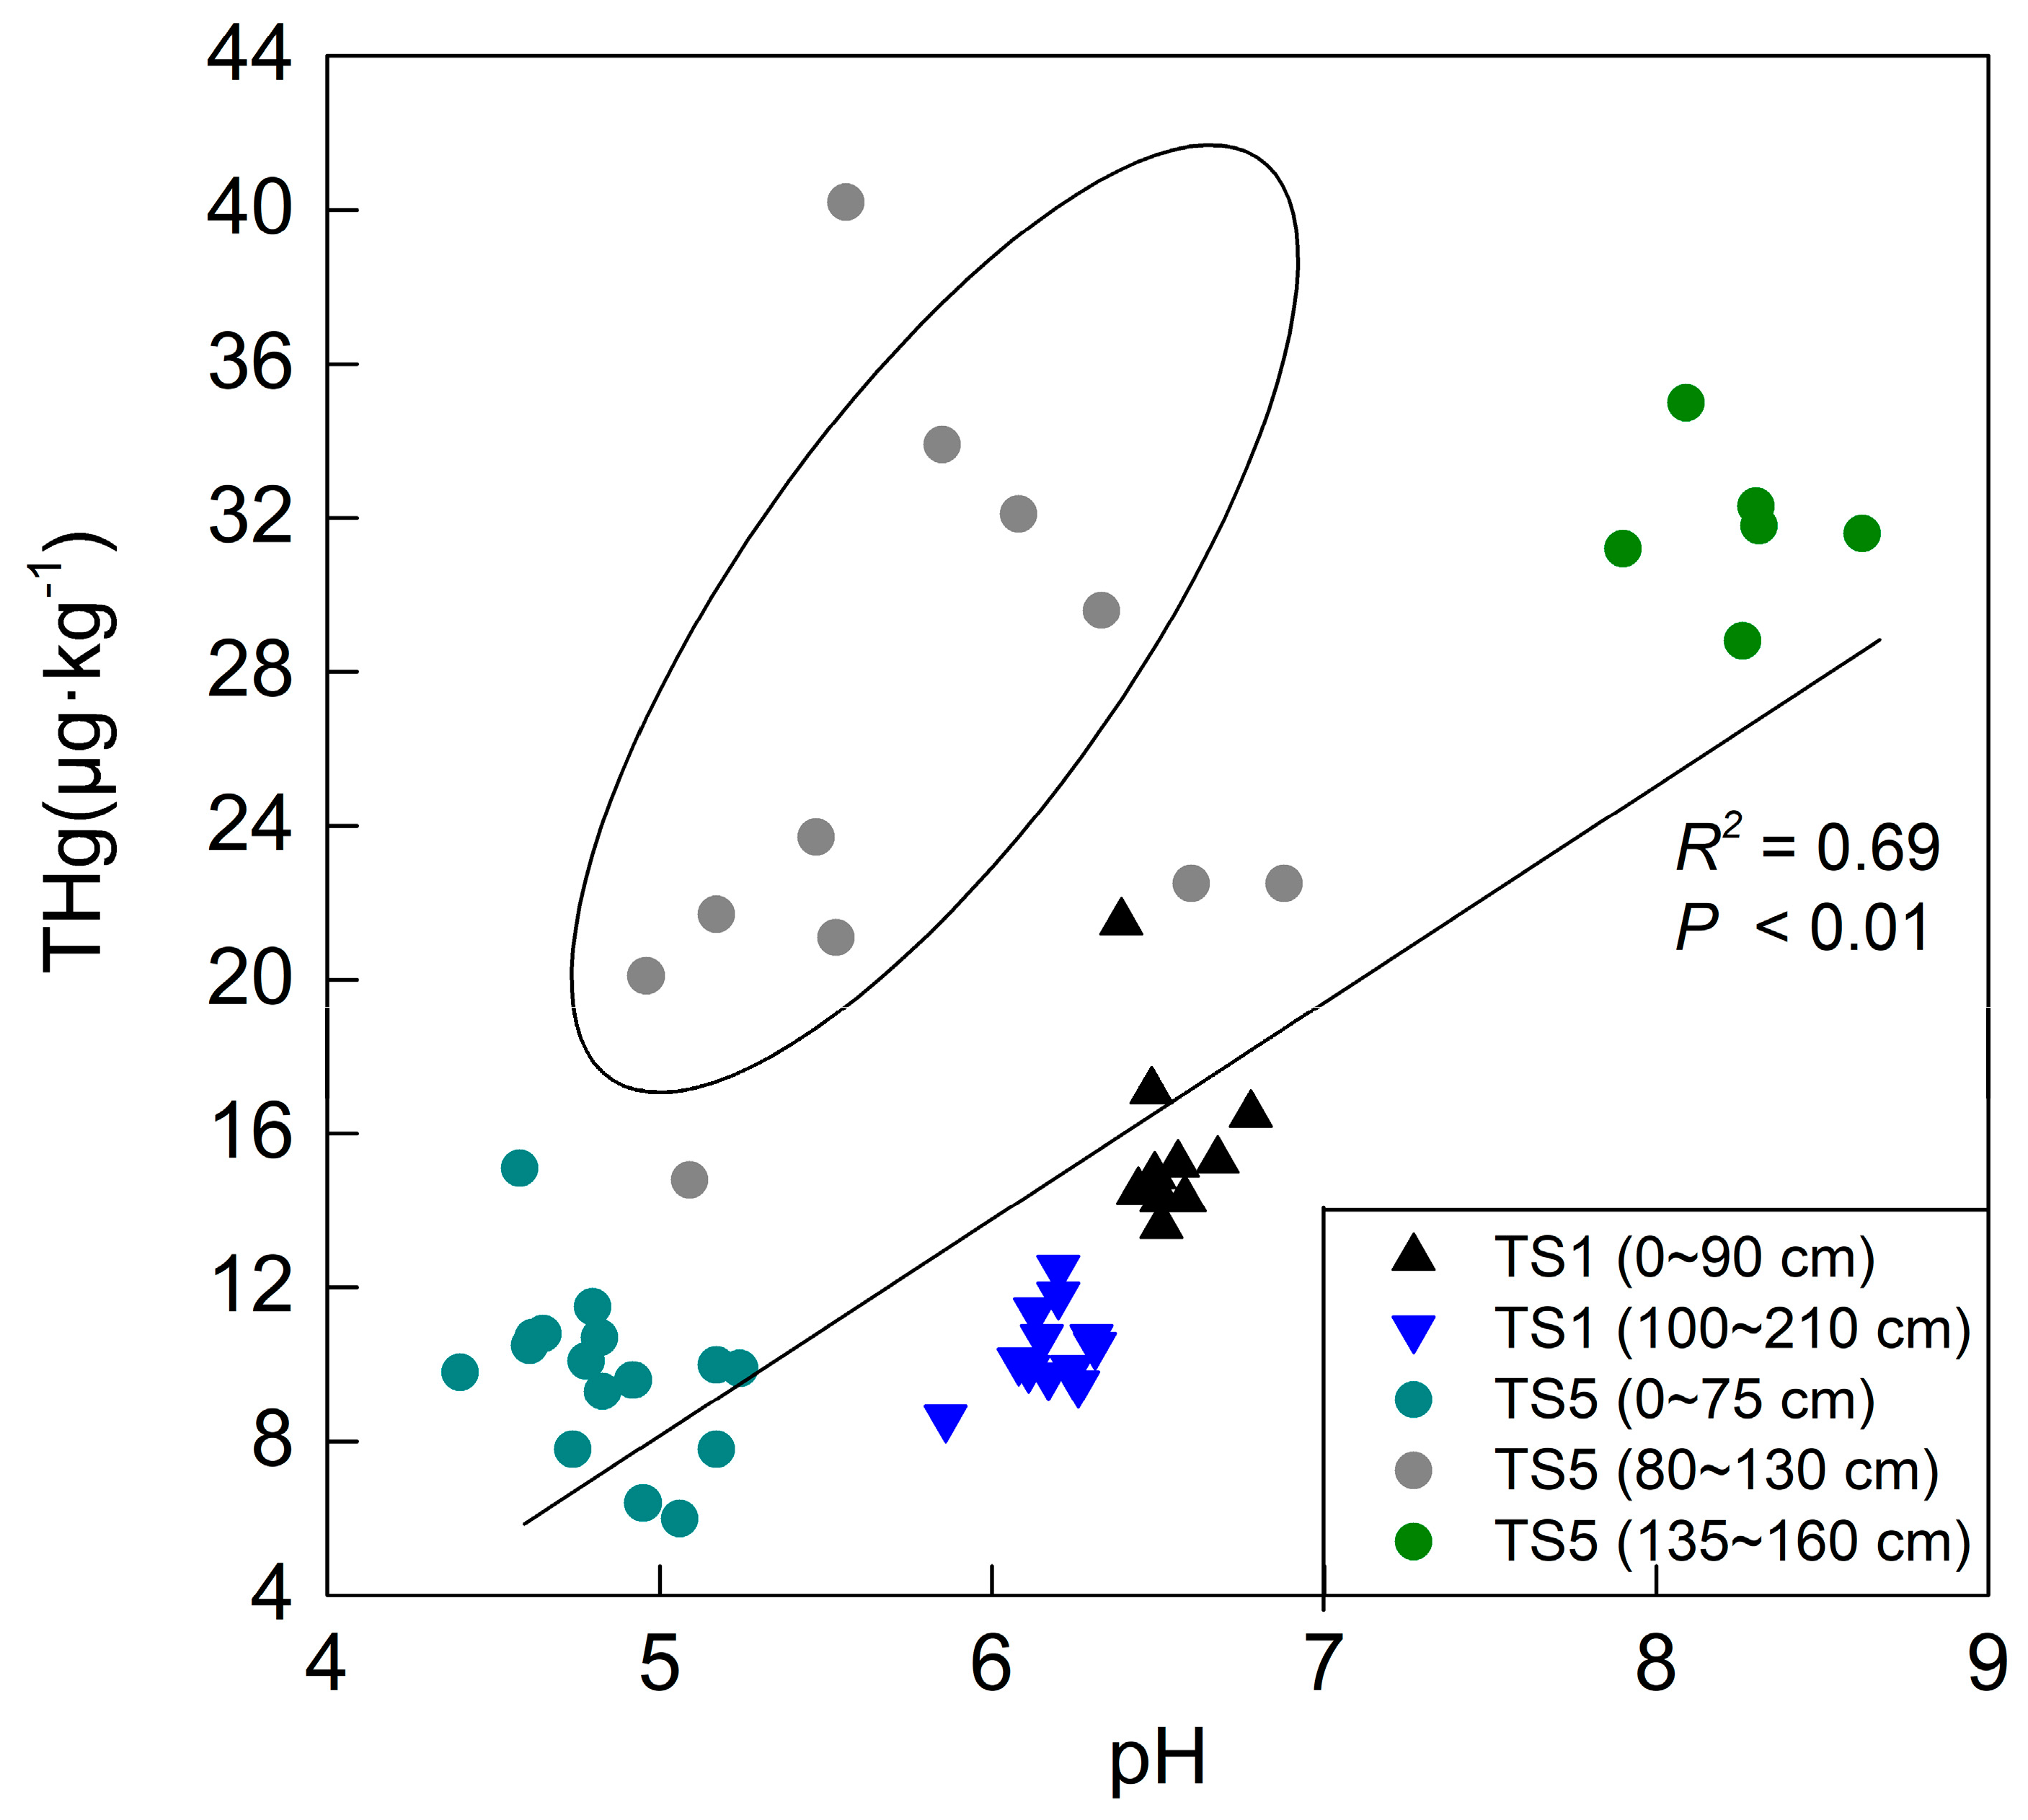
Moreover, a similar explanation may be adopted in the vertical distribution of mercury in TS5. As can be seen in
Figure 6, the points out of the circle are more concentrated and have a positive correlation trend, while the gray points in the circle are more disordered and were affected by adsorption of iron-containing minerals—the main controlling factor. The behavior of the gray points implies that using pH value to analyze mercury distribution behaviors does not rule out the influence of other factors, such as the TOC, iron-containing minerals, and soil texture. As mentioned above, the occurrence of the first peak (TS5; 80–130 cm) and third peak (TS5; 165–290 cm) (
Figure 4) was attributed to the Fe content increase, which showed a strong positive correlation. However, there was no correlation between the Fe content and the THg content, and there were no disordered points (
Figure 6) for the occurrence of the second peak (TS5; 135–160 cm), indicating that the increase of the mercury content could not be attributed to the iron content. The THg content increased with the increasing pH value in the agricultural land, as shown in
Figure 6, and this result was applied to the explanation of the occurrence of the second peak in the TS5 profile.
With respect to soil texture, grain size was taken into account for the controlling factor of mercury distribution. Palmieri et al. [
36] reported that clay, silt, and sand have similar distribution behaviors to mercury, suggesting that grain size primarily affects the content of mercury in soil. Liao et al. [
51] stated that clay has the highest capacity of adsorption for mercury compared to loam and sand, implying the a smaller grain size is beneficial for the enrichment of mercury. The negative correlation between the content of THg and mean grain size was also reported by Zhao et al. [
52]. In our study area, the results showed that the soil texture is mainly loam (
Table 5), which is in agreement with another study [
20]. The TS4 and TS5 profiles had different types of soil texture, while the other profiles had the same soil texture. In this study, the land use type showed no clear the relationship with soil texture. However, the soil texture of the abandoned land with less mercury had more sand content compared with the other profiles. The high sand content in the forest profile may provide an explanation for the increase of mercury with increasing depth, because sand is beneficial for enhancing the vertical mobility of mercury.
The total mercury contents were combined in all profiles according to the different types of soil texture (
Figure 7). The soil texture was arranged from coarse to fine according to average grain size: loamy sand > sandy loam > loam > silty loam; this means that the fine soil texture had a lesser sand content. As shown in
Figure 7, the finer grain size has a larger concentration range and a higher average value of total mercury in the soil, suggesting that the content of mercury is relative to soil grain size. As for profiles with different types of soil texture, like TS4 and TS5, although the distribution behaviors are dominated by the TOC, iron-containing minerals, and pH value, we could distinctly observe that the change of soil texture led to a change of the THg content (
Figure 3).
3.4. Geoaccumulation Index
The mercury contamination level in the soil was evaluated by the geoaccumulation index (
Igeo) in the Mun River basin. The ratio of mercury contamination level and graphs of contamination levels in different types of land use which changed with the depth are shown in
Table 6 and
Figure 8, respectively. In general, the range of contamination level in this study area was 0–2, which corresponds to uncontaminated to moderately contaminated levels. The soil samples in this study area were mainly slightly contaminated, and a small number of soil samples were moderately contaminated. All the soil profiles were contaminated with different contaminated levels except for TS4 (
Table 6).
As shown in
Figure 8, the mercury contamination was concentrated on the shallow and deeper soil (<100 cm). The moderate contamination occurred in the deeper soil of the profiles in the abandoned agricultural land (TS3) and the agricultural land (TS5), while the other situations were slightly contaminated. The contamination of the woodland was probably due to the agricultural land near the sites. Agricultural activities may have contributed to the mercury contamination of the soil, and the vertical mobility of mercury was likely beneficial for the enrichment in the deeper soil.
4. Conclusions
This study reported the content of total mercury, the characteristics of vertical distribution, and the controlling factors of distribution behaviors in the soil around the Mun River basin, Thailand. The THg concentration in the study area ranged from the 0.13 to 69.4 μg∙kg−1. The mercury content was higher in the agricultural land and the woodland than that in the abandoned agricultural land, suggesting that crops or plants are beneficial for the enrichment of mercury. The vertical mercury distribution behaviors in the Mun River basin soil were dominated by the TOC, iron-containing mineral, pH value, and soil texture. The distribution of mercury was homogenous in the surface soil and the deeper layer (<90 cm) within the agricultural land and the woodland, and it was mainly controlled by the TOC content, which had a strong positive correlation with the mercury content. Moreover, an explanation for the increase of mercury in the bottom soil is the adsorption of iron-containing minerals for mercury in the agricultural land and the abandoned agricultural land (TS3, TS4, and TS5), which showed a high correlation between the Fe content and the THg content. The ability of iron adsorption for mercury was based on the amount of mercury. Additionally, the pH value and soil texture made some contributions to the mercury distribution behavior. The increase of the pH value in the agricultural land resulted in the increase of the THg content. In our case, the mercury content, in sequence from high to low in different soil textures, was loamy sand, sandy loam, loam, and silty loam; this indicates that the finer grain size may have had a higher THg content. Moreover, the variation of the vertical mercury distribution may have been attributed to the change of soil texture in the profiles. Taken together, the geochemical characteristics of mercury were controlled by the TOC content, iron-containing minerals, pH value, and soil texture, which together determine the vertical distribution patterns of mercury.
Most sample sites (TS1, TS2, TS4, and TS6) are slight mercury contamination and a few sample soils (TS3 and TS5) are moderate mercury contamination. The mercury contamination was concentrated in the shallow and deeper layers (<100 cm) of the soil profiles, and the moderate contamination occurred in the deeper layer of the agricultural land and the abandoned agricultural land. Agricultural activities may lead to mercury contamination and contaminate the surrounding woodland. According to the pollution assessment results, in order to prevent mercury pollution and expansion, agricultural behaviors need to be monitored and managed. Agricultural behavior such as straw returning or burning straw in the field must be reduced or prohibited; although this can improve the nutrition level of soil, the increasing the TOC content will enhance the mercury content, which will then harm human health through the food chain. Moreover, we must reduce the cultivation period in the agricultural land near the woodland in order to reduce the mercury pollution of the woodland.
Author Contributions
Conceptualization, R.Q. and G.H.; methodology, R.Q.; software, R.Q.; validation, G.H.; formal analysis, R.Q.; investigation, M.L. and X.L.; resources, G.H.; data curation, G.H.; writing—original draft preparation, R.Q.; writing—review and editing, R.Q. and G.H.; supervision, G.H.; project administration, G.H.; funding acquisition, G.H.
Funding
This research was funded by the National Natural Science Foundation of China, grant number No. 41661144029; 41325010.
Acknowledgments
The authors gratefully acknowledge Fairda Malem from Ministry of Natural Resource and Environment of Thailand, and Chao Song from the Institute of Hydrogeology and Environmental Geology, Chinese Academy of Geological Sciences for land sampling.
Conflicts of Interest
The authors declare no conflict of interest.
References
- Driscoll, C.T.; Mason, R.P.; Chan, H.M.; Jacob, D.J.; Pirrone, N. Mercury as a global pollutant: Sources, pathways, and effects. Environ. Sci. Technol. 2013, 47, 4967–4983. [Google Scholar] [CrossRef] [PubMed]
- Schroeder, W.H.; Munthe, J. Atmospheric mercury—An overview. Atmos. Environ. 1998, 32, 809–822. [Google Scholar] [CrossRef]
- Johansson, K.; Bergbäck, B.; Tyler, G. Impact of Atmospheric long range transport of lead, mercury and cadmium on the swedish forest environment. Water Air Soil Pollut. Focus 2001, 1, 279–297. [Google Scholar] [CrossRef]
- Liu, Y.; Song, S.; Bi, C.; Zhao, J.; Xi, D.; Su, Z. Occurrence, distribution and risk assessment of mercury in multimedia of Soil-Dust-Plants in Shanghai, China. Int. J. Environ. Res. Public Health 2019, 16, 3028. [Google Scholar] [CrossRef] [PubMed]
- Hoyer, M.; Burke, J.; Keeler, G. Atmospheric sources, transport and deposition of mercury in Michigan: Two years of event precipitation. Water Air Soil Pollut. 1995, 80, 199–208. [Google Scholar] [CrossRef]
- Li, P.; Feng, X.B.; Qiu, G.L.; Shang, L.H.; Li, Z.G. Mercury pollution in Asia: A review of the contaminated sites. J. Hazard. Mater. 2009, 168, 591–601. [Google Scholar] [CrossRef] [PubMed]
- Dai, Q.; Feng, X.; Tang, G. The geochemical behavior of mercury in soil and its pollution control. Geol. Geochem. 2002, 30, 75–78. [Google Scholar]
- Reis, A.T.; Davidson, C.M.; Vale, C.; Pereira, E. Overview and challenges of mercury fractionation and speciation in soils. Trac. Trends Anal. Chem. 2016, 82, 109–117. [Google Scholar] [CrossRef]
- Carpi, A.; Lindberg, S.E.; Prestbo, E.M.; Bloom, N.S. Methyl mercury contamination and emission to the atmosphere from soil amended with municipal sewage sludge. J. Environ. Qual. 1997, 26, 1650–1655. [Google Scholar] [CrossRef]
- Balogh, S.J.; Meyer, M.L.; Johnson, D.K. Transport of mercury in three contrasting river basins. Environ. Sci. Technol. 1998, 32, 456–462. [Google Scholar] [CrossRef]
- Godbold, D.L. Mercury-induced root damage in spruce seedlings. Water Air Soil Pollut. 1991, 56, 823–831. [Google Scholar] [CrossRef]
- Hongjuan, L.U.; Wuzhong, N.I.; Zhengqian, Y.E.; Xiao’e, Y. Mercury form in soil and the effect of excessive mercury on plants and human beings. J. Soil Sci. 2007, 38, 597–600. [Google Scholar]
- Hang, X.S.; Gan, F.Q.; Wang, J.G.; Chen, X.Q.; Chen, Y.D.; Wang, H.Y.; Zhou, J.M.; Du, C.W. Soil mercury accumulation and transference to different crop grains. Hum. Ecol. Risk Assess. 2016, 22, 1242–1252. [Google Scholar] [CrossRef]
- Feng-man, F.; Qi-chao, W. A review on the studies on mercury pollution of soil. Soil Environ. Sci. 2000, 9, 326. [Google Scholar]
- Golovatskaya, E.A.; Lyapina, E.E. Distribution of total mercury in peat soil profiles in West Siberia. Contemp. Probl. Ecol. 2009, 2, 156–161. [Google Scholar] [CrossRef]
- Liu, R.; Wang, Q.; Xianguo, L.; Fang, F.; Hao, Q. The geochemistry characteristic of mercury in Sanjiang plain marsh. Acta Sci. Circumst. 2002, 22, 661–663. [Google Scholar]
- Butakov, E.V.; Kuznetsov, P.V.; Kholodova, M.S.; Grebenshchikova, V.I. Mercury in soils of the agro-industrial zone of Zima city (Irkutsk oblast). Eur. Soil Sci. 2017, 50, 1354–1361. [Google Scholar] [CrossRef]
- Reutergårdh, L.B.; Yen, N.T. The Thai environment: Prospering or suffering from development? Trac. Trends Anal. Chem. 1997, 16, 436–450. [Google Scholar] [CrossRef]
- Umbangtalad, S.; Parkpian, P.; Visvanathan, C.; Delaune, R.D.; Jugsujinda, A. Assessment of Hg contamination and exposure to miners and schoolchildren at a small-scale gold mining and recovery operation in Thailand. J. Environ. Sci. Health Part. A-Toxic/Hazard. Subst. Environ. Eng. 2007, 42, 2071–2079. [Google Scholar] [CrossRef]
- Zarcinas, B.A.; Pongsakul, P.; McLaughlin, M.J.; Cozens, G. Heavy metals in soils and crops in southeast Asia. 2. Thailand. Environ. Geochem. Health 2004, 26, 359–371. [Google Scholar] [CrossRef]
- Sowana, A.; Shrestha, R.P.; Parkpian, P.; Pongquan, S. Influence of coastal land use on soil heavy-metal contamination in Pattani Bay, Thailand. J. Coast. Res. 2011, 27, 252–262. [Google Scholar] [CrossRef]
- Zhao, Z.; Liu, G.; Liu, Q.; Huang, C.; Li, H. Studies on the spatiotemporal variability of river water quality and its relationships with soil and precipitation: A case study of the Mun River Basin in Thailand. Int. J. Environ. Res. Public Health 2018, 15, 2466. [Google Scholar] [CrossRef] [PubMed]
- Zhao, Z.H.; Liu, G.H.; Liu, Q.S.; Huang, C.; Li, H.; Wu, C.S. Distribution characteristics and seasonal variation of soil nutrients in the Mun River Basin, Thailand. Int. J. Environ. Res. Public Health 2018, 15, 18. [Google Scholar] [CrossRef] [PubMed]
- Peel, M.C.; Finlayson, B.L.; McMahon, T.A. Updated world map of the Koppen-Geiger climate classification. Hydrol. Earth Syst. Sci. 2007, 11, 1633–1644. [Google Scholar] [CrossRef]
- Prabnakorn, S.; Maskey, S.; Suryadi, F.X.; de Fraiture, C. Rice yield in response to climate trends and drought index in the Mun River Basin, Thailand. Sci. Total Environ. 2018, 621, 108–119. [Google Scholar] [CrossRef]
- Liu, J.; Han, G.; Liu, X.; Man, L.; Chao, S.; Yang, K.; Xiaoqiang, L.; Zhang, Q. Distributive characteristics of riverine nutrients in the Mun River, northeast Thailand: Implications for Anthropogenic Inputs. Water 2019, 11, 954. [Google Scholar] [CrossRef]
- Brouwer, C.; Prins, K.; Heibloem, M. Irrigation water management: Irrigation scheduling. Train. Man. 1989, 4, 45. [Google Scholar]
- Liu, M.; Han, G.; Zhang, Q.; Song, Z. Variations and indications of δ13CSOC and δ15NSON in soil profiles in Karst Critical Zone Observatory (CZO), Southwest China. Sustainability 2019, 11, 2144. [Google Scholar] [CrossRef]
- Qian, Z.; Guilin, H.; Kunhua, Y.; Jian, L.; Yue, H. Determination and application of mercury in soil and sediment. China Meas. Test 2018, 44, 66–70. (In Chinese) [Google Scholar] [CrossRef]
- Muenhor, D.; Satayavivad, J.; Limpaseni, W.; Parkpian, P.; Delaune, R.D.; Gambrell, R.P.; Jugsujinda, A. Mercury contamination and potential impacts from municipal waste incinerator on Samui Island, Thailand. J. Environ. Sci. Health Part A-Toxic/Hazard. Subst. Environ. Eng. 2009, 44, 376–387. [Google Scholar] [CrossRef]
- Pataranawat, P.; Parkpian, P.; Polprasert, C.; Delaune, R.D.; Jugsujinda, A. Mercury emission and distribution: Potential environmental risks at a small-scale gold mining operation, Phichit province, Thailand. J. Environ. Sci. Health Part A-Toxic/Hazard. Subst. Environ. Eng. 2007, 42, 1081–1093. [Google Scholar] [CrossRef] [PubMed]
- Chen, L.; Xu, Z.; Ding, X.; Zhang, W.; Huang, Y.; Fan, R.; Sun, J.; Liu, M.; Qian, D.; Feng, Y. Spatial trend and pollution assessment of total mercury and methylmercury pollution in the Pearl River Delta soil, South China. Chemosphere 2012, 88, 612–619. [Google Scholar] [CrossRef] [PubMed]
- Liu, R.; Zhang, Y.; Yan, W.; Jin, Z.; Shan, H. Vertical distribution of mercury and MeHg in Nandagang and Beidagang wetlands: Influence of microtopography. Phys. Chem. Earth Parts A/B/C 2017, 103, S1474706516303023. [Google Scholar] [CrossRef]
- Ren, L.; Zhao, M.; Dong, Y.; Wang, F.; Gao, X.; Pang, X. Adsorption effect of two kinds of iron oxides on available Hg in soil. Acta Sci. Circumst. 2014, 34, 749–753. [Google Scholar]
- Fergusson, J.E. Heavy elements: Chemistry, environmental impact and health effects. Met. Pesados 1990, 69, 614. [Google Scholar]
- Palmieri, H.E.L.; Nalini, H.A.; Leonel, L.V.; Windmoller, C.C.; Santos, R.C.; de Brito, W. Quantification and speciation of mercury in soils from the Tripui, Ecological Station, Minas Gerais, Brazil. Sci. Total Environ. 2006, 368, 69–78. [Google Scholar] [CrossRef]
- Bolt, G.M.; Bruggenwert, M.G.M. Soil chemistry. A. Basic elements. Earth Sci. Rev. 1978, 13, 304–305. [Google Scholar]
- Dermont, G.; Bergeron, M.; Mercier, G.; Richer-Lafleche, M. Soil washing for metal removal: A review of physical/chemical technologies and field applications. J. Hazard. Mater. 2008, 152, 1–31. [Google Scholar] [CrossRef]
- Jian-Bo, S.; Li-Na, L.; Gui-Bin, J.; Xing-Long, J. The speciation and bioavailability of mercury in sediments of Haihe River, China. Environ. Int. 2005, 31, 357–365. [Google Scholar]
- Pant, P.; Allen, M. Interaction of soil and mercury as a function of soil organic carbon: Some field evidence. Bull. Environ. Contam. Toxicol. 2007, 78, 539–542. [Google Scholar] [CrossRef]
- Tack, F.M.G.; Vanhaesebroeck, T.; Verloo, M.G.; Van Rompaey, K.; Van Ranst, E. Mercury baseline levels in Flemish soils (Belgium). Environ. Pollut. 2005, 134, 173–179. [Google Scholar] [CrossRef] [PubMed]
- Andersson, A. Mercury in soils. In The Biogeochemistry of Mercury in the Environment; Nriagu, J.O., Ed.; Elsevier/North-Holland Biomedical Press: Amsterdam, The Netherlands, 1979; Volume 79–112. [Google Scholar]
- Wu, T.Y.; Schoenau, J.J.; Li, F.M.; Qian, P.Y.; Malhi, S.S.; Shi, Y.C.; Xu, F.L. Influence of cultivation and fertilization on total organic carbon and carbon fractions in soils from the Loess Plateau of China. Soil Tillage Res. 2004, 77, 59–68. [Google Scholar] [CrossRef]
- Zhou, W.X.; Han, G.L.; Liu, M.; Li, X.Q. Effects of soil pH and texture on soil carbon and nitrogen in soil profiles under different land uses in Mun River Basin, Northeast Thailand. PeerJ 2019, 7, e7880. [Google Scholar] [CrossRef] [PubMed]
- Tack, F.M.G.; Verloo, M.G.; Vanmechelen, L.; VanRanst, E. Baseline concentration levels of trace elements as a function of clay and organic carbon contents in soils in Flanders (Belgium). Sci. Total Environ. 1997, 201, 113–123. [Google Scholar] [CrossRef]
- GarcãA-Sã, N.M.; Klouza, M.; HoleäčKovã, Z.; Tlustoå, P.; Szã, k.J. Organic and inorganic amendment application on mercury-polluted soils: Effects on soil chemical and biochemical properties. Environ. Sci. Pollut. Res. Int. 2016, 23, 14254–14268. [Google Scholar]
- Park, J.H.; Wang, J.J.; Xiao, R.; Pensky, S.M.; Kongchum, M.; Delaune, R.D.; Seo, D.C. Mercury adsorption in the Mississippi River deltaic plain freshwater marsh soil of Louisiana Gulf coastal wetlands. Chemosphere 2018, 195, 455–462. [Google Scholar] [CrossRef] [PubMed]
- Zhang, M.M.; Liu, J.; Tian, C.Y.; Wang, R.Q.; Dai, J.L. Effect of pH, temperature, and the role of ionic strength on the adsorption of mercury (II) by typical Chinese soils. Commun. Soil Sci. Plant. Anal. 2012, 43, 1599–1613. [Google Scholar] [CrossRef]
- Fan, W.; Hui, L.; Zhang, M.; Wen, M.; Huang, X.; Liu, S.; Dai, J. Adsorption characteristics and the effect of dissolved organic matter on mercury (II) adsorption of various soils in China. J. Soil Contam. 2017, 26, 157–170. [Google Scholar]
- Miao, X.; Li, Z.; Long, J.; Wei, D.; Ma, Y. Mercury and arsenic adsorption-desorption behaviors in the different soils. Acta Agric. Nucleatae Sin. 2012, 26, 552–557. [Google Scholar]
- Liao, L.; Selim, H.M.; Delaune, R.D. Mercury adsorption-desorption and transport in soils. J. Environ. Qual. 2009, 38, 1608–1616. [Google Scholar] [CrossRef]
- Zhao, L.; Wang, R.; Zhang, C.; Yin, D.Q.; Yang, S.Y.; Huang, X.T. Geochemical controls on the distribution of mercury and methylmercury in sediments of the coastal East China Sea. Sci. Total Environ. 2019, 667, 133–141. [Google Scholar] [CrossRef]
© 2019 by the authors. Licensee MDPI, Basel, Switzerland. This article is an open access article distributed under the terms and conditions of the Creative Commons Attribution (CC BY) license (http://creativecommons.org/licenses/by/4.0/).


