Differential Relationship between Tobacco Control Policies and U.S. Adult Current Smoking by Poverty

 , and
, and
Abstract
1. Introduction
2. Materials and Methods
2.1. Sample
2.2. Outcome Variable
2.3. Independent Variables
2.3.1. Primary Independent Variables
Poverty
SFALs
Tobacco Tax
Per Capita State Tobacco Control Funding
2.4. Analysis
3. Results
3.1. Descriptive Statistics
3.2. Bivariate Statistics
3.3. Logistic Regression Models
3.3.1. Overall Models
SFAL-All Coverage
SFAL-WP and SFAL-RB Coverage
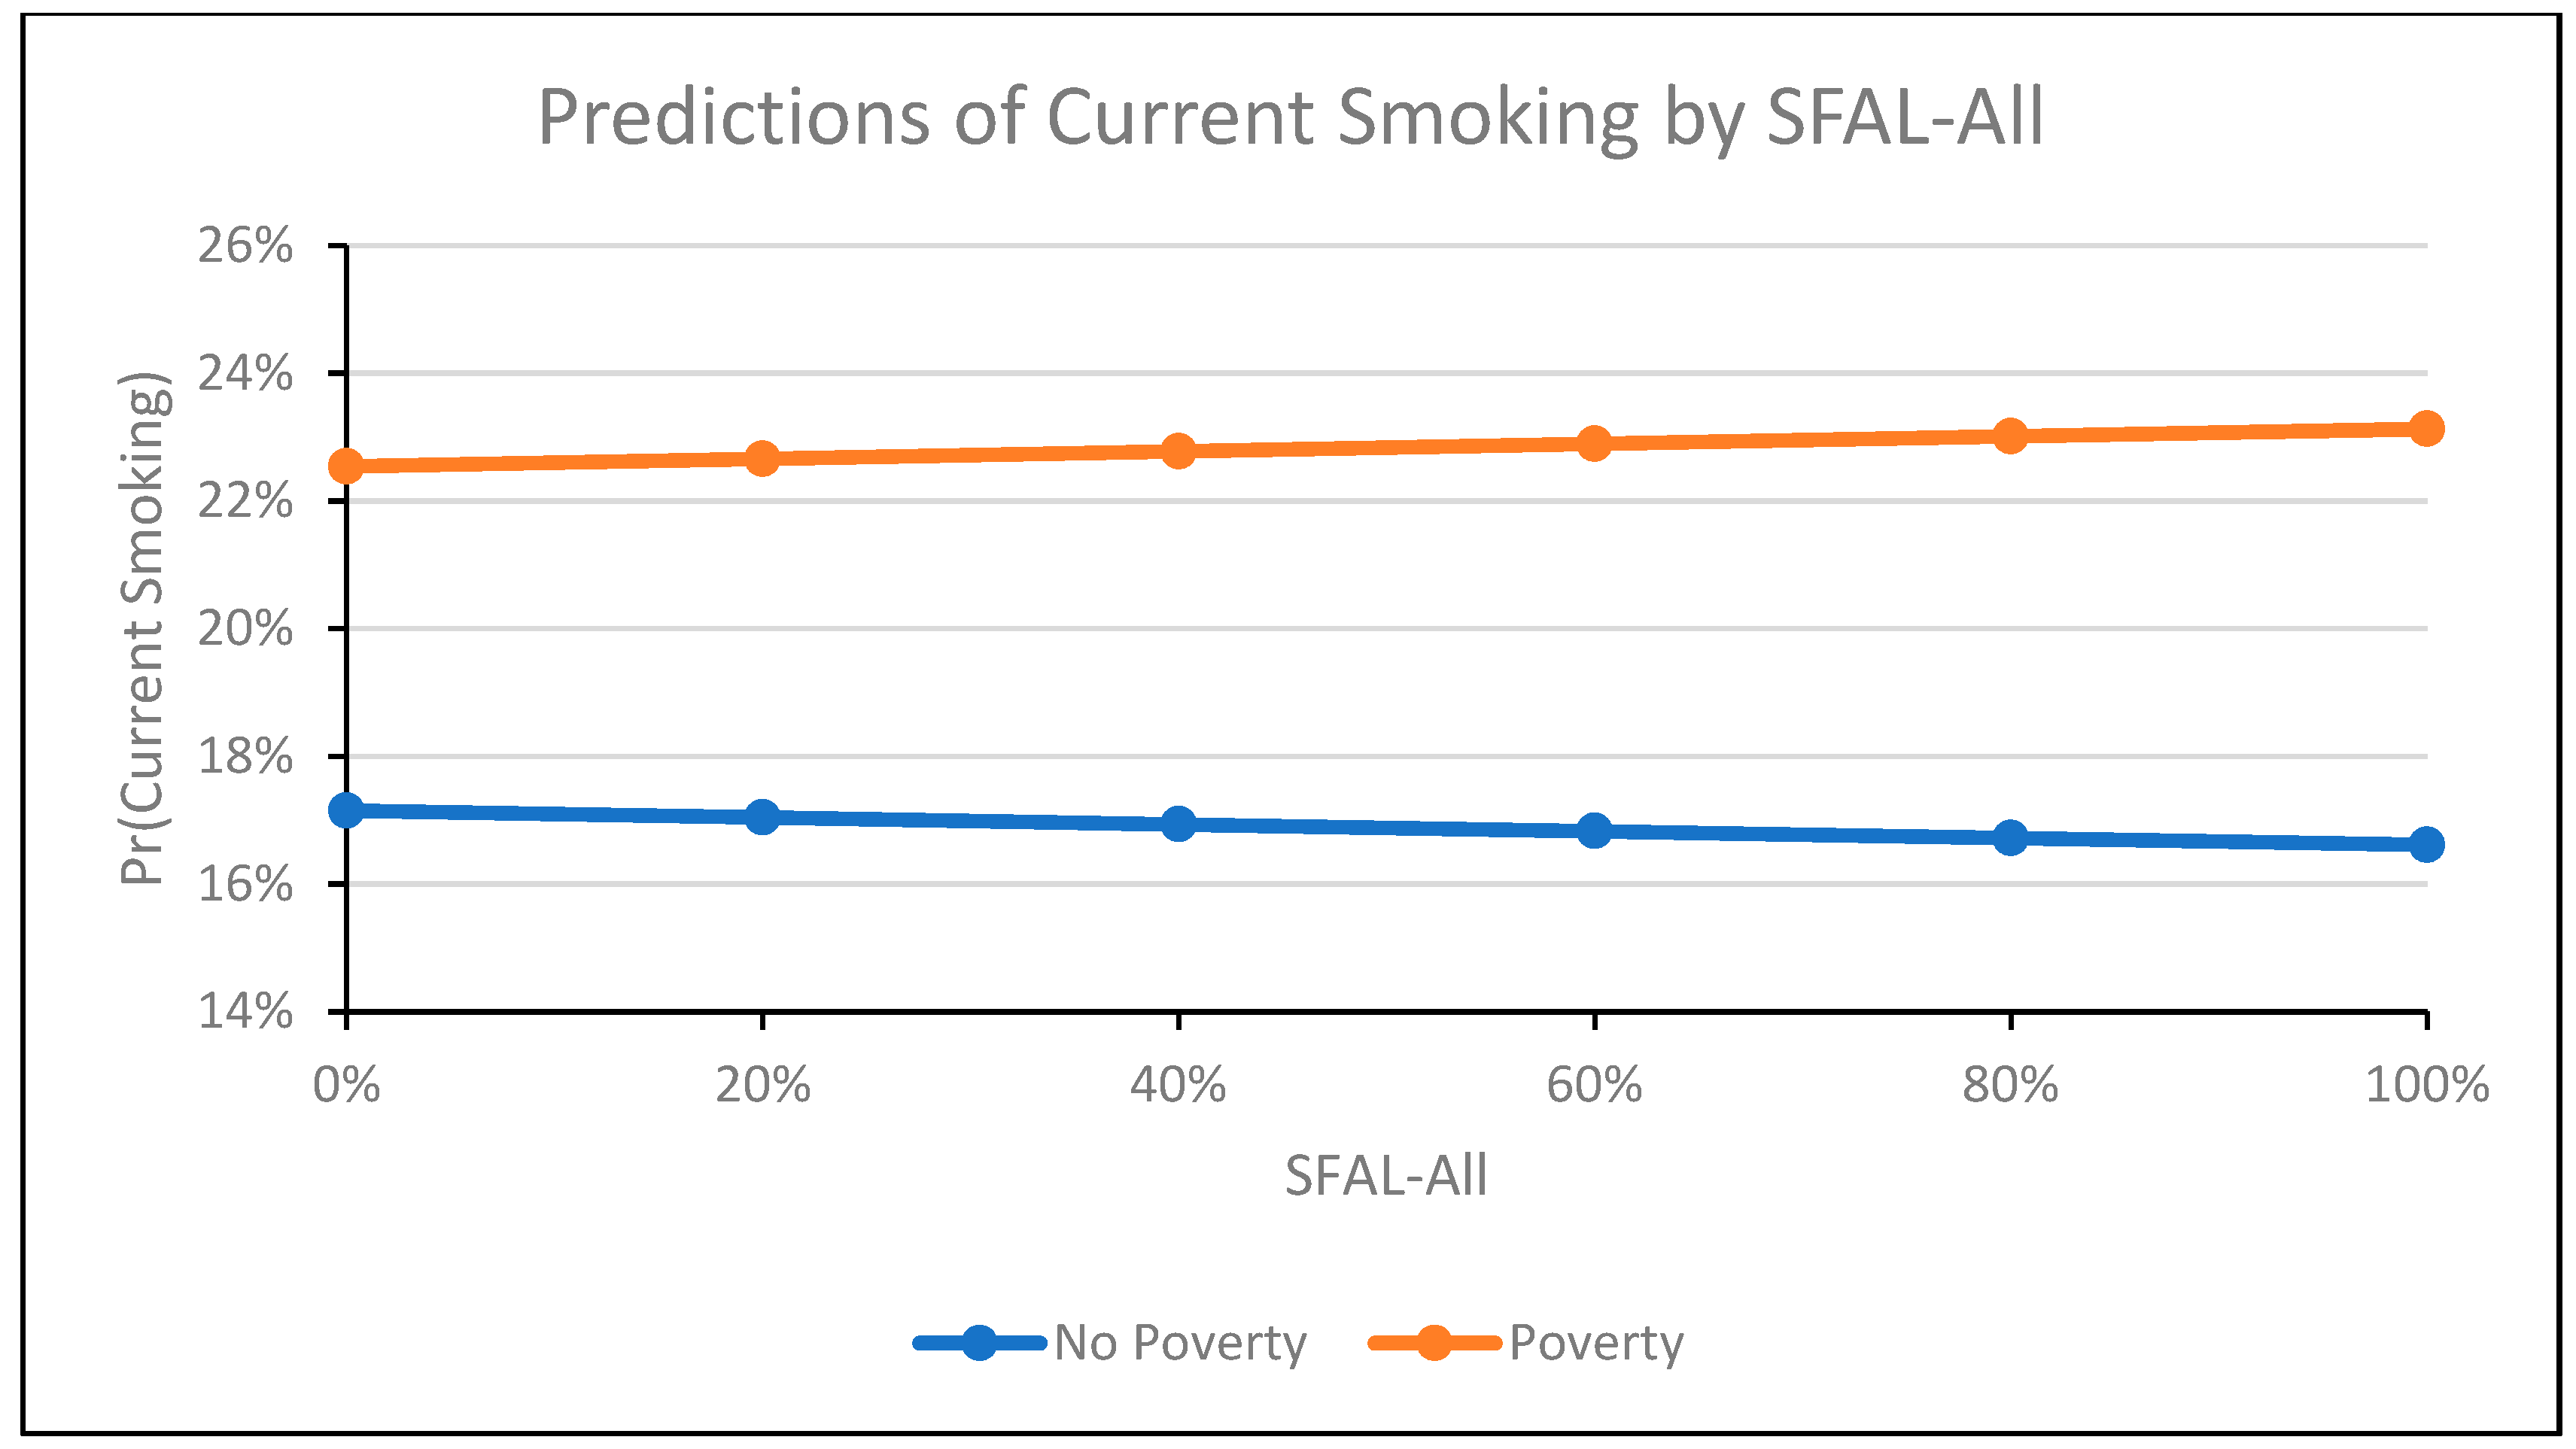
3.3.2. Models Containing Interactions
SFAL-All Coverage
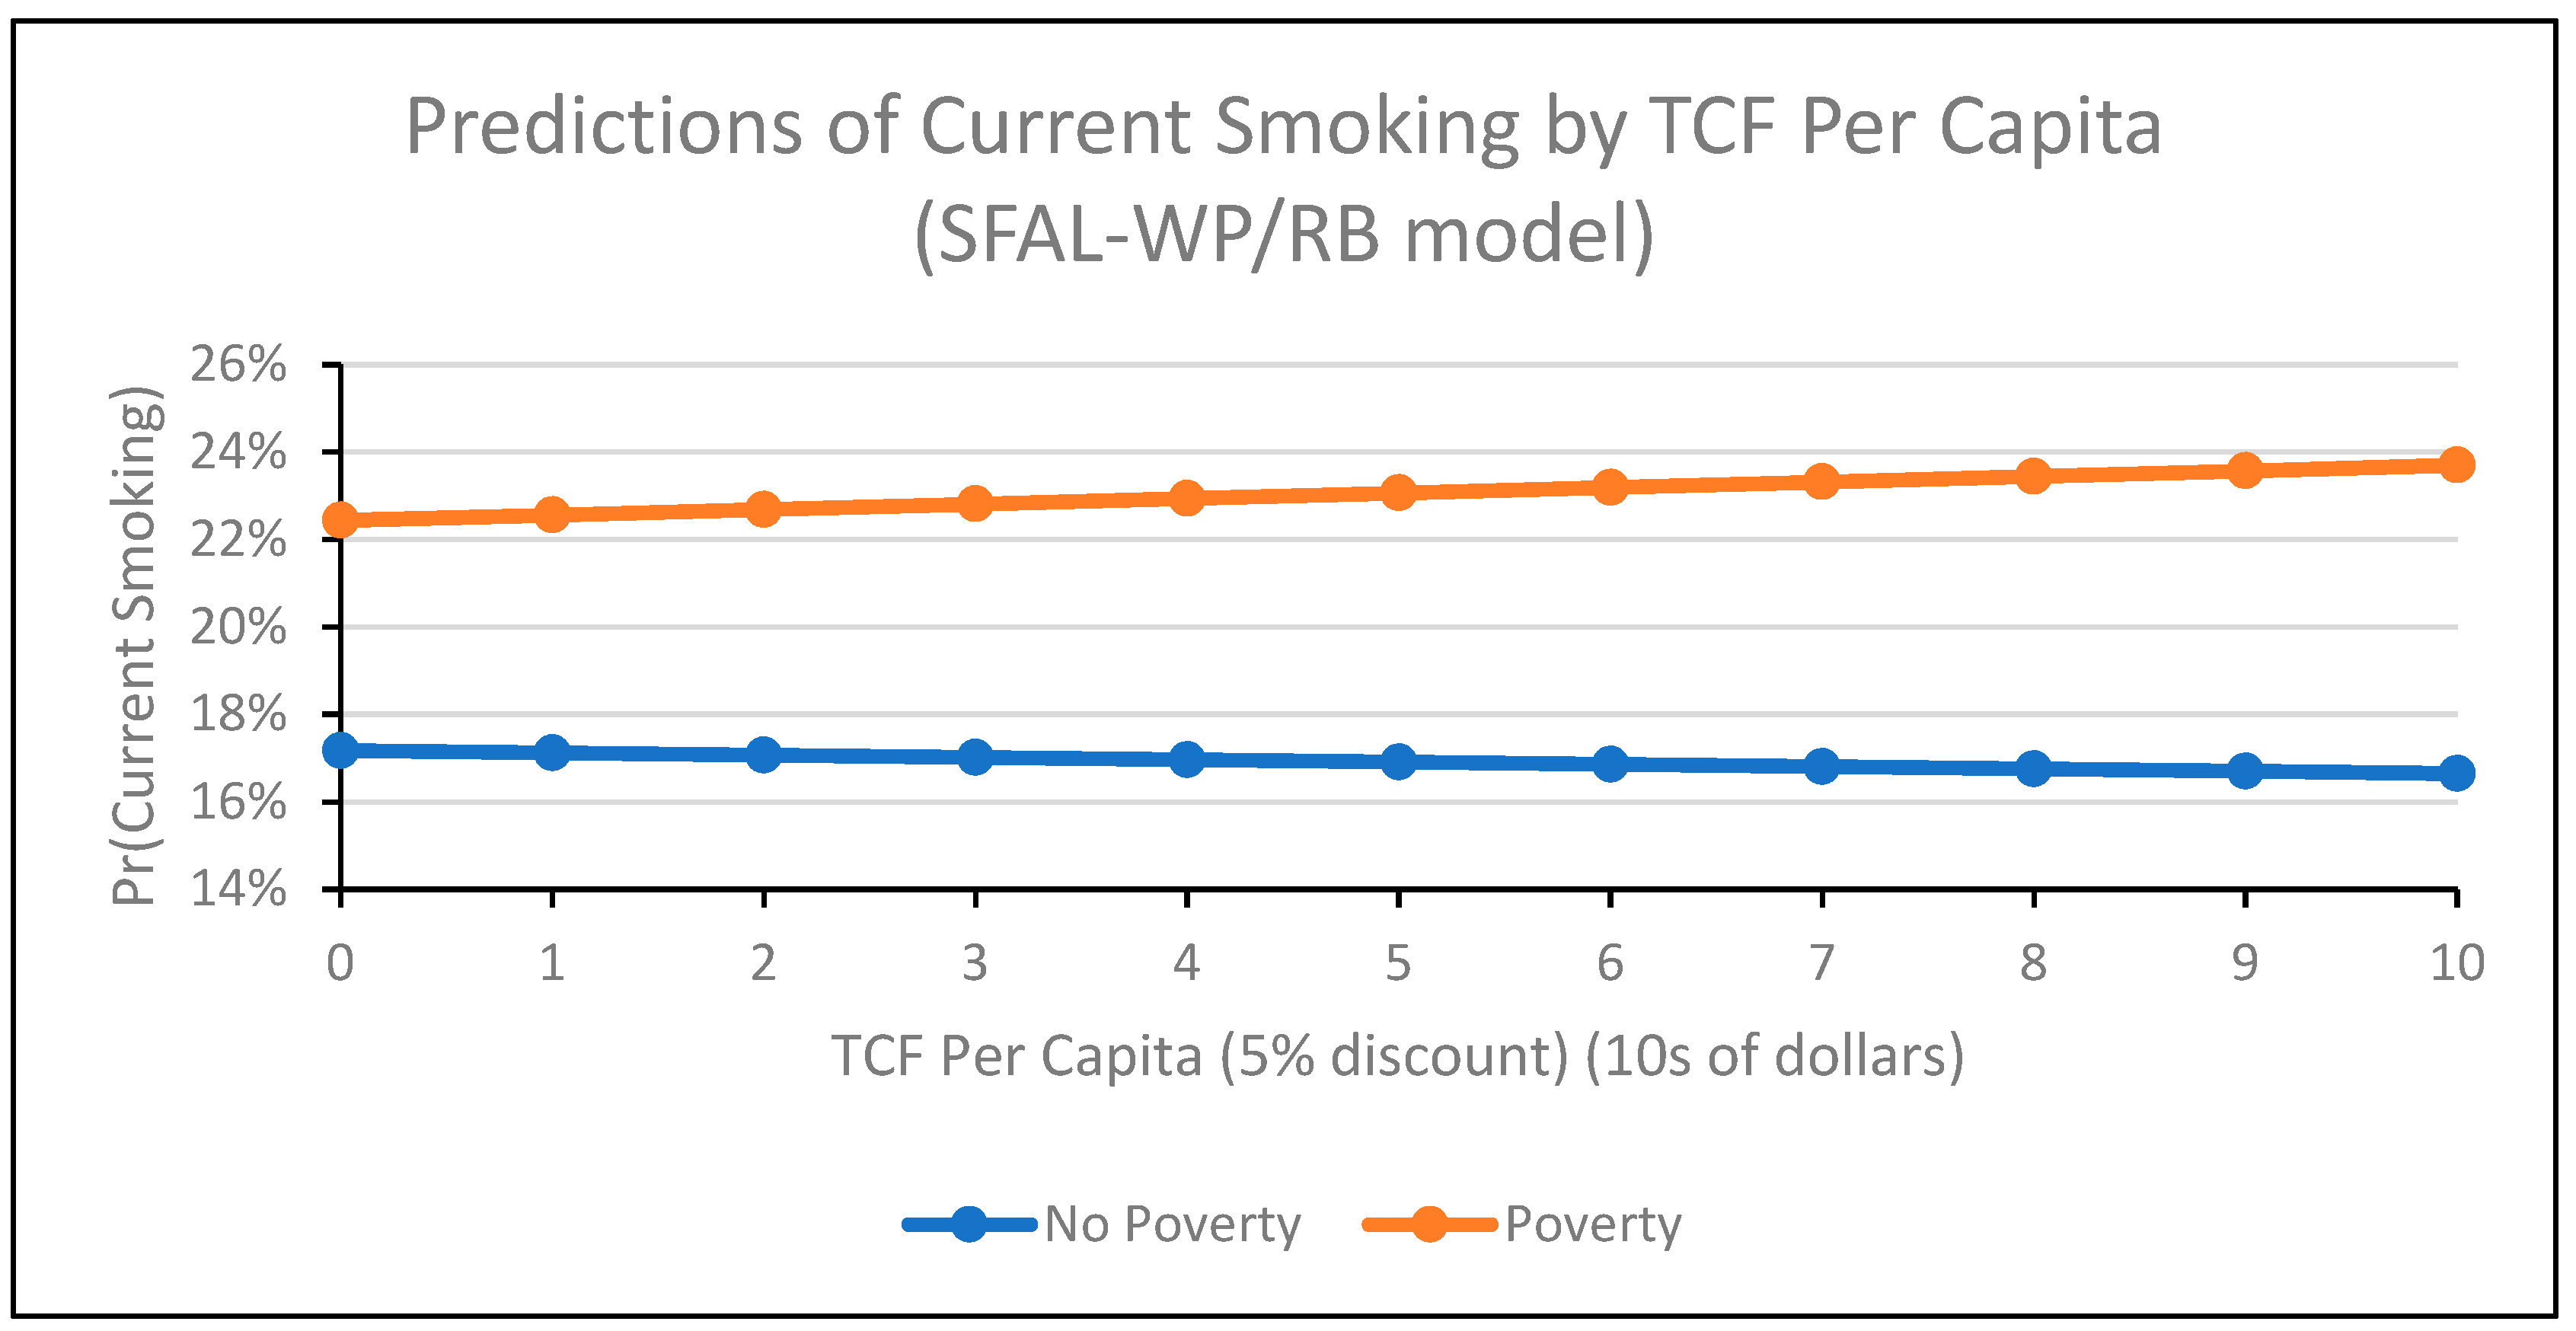
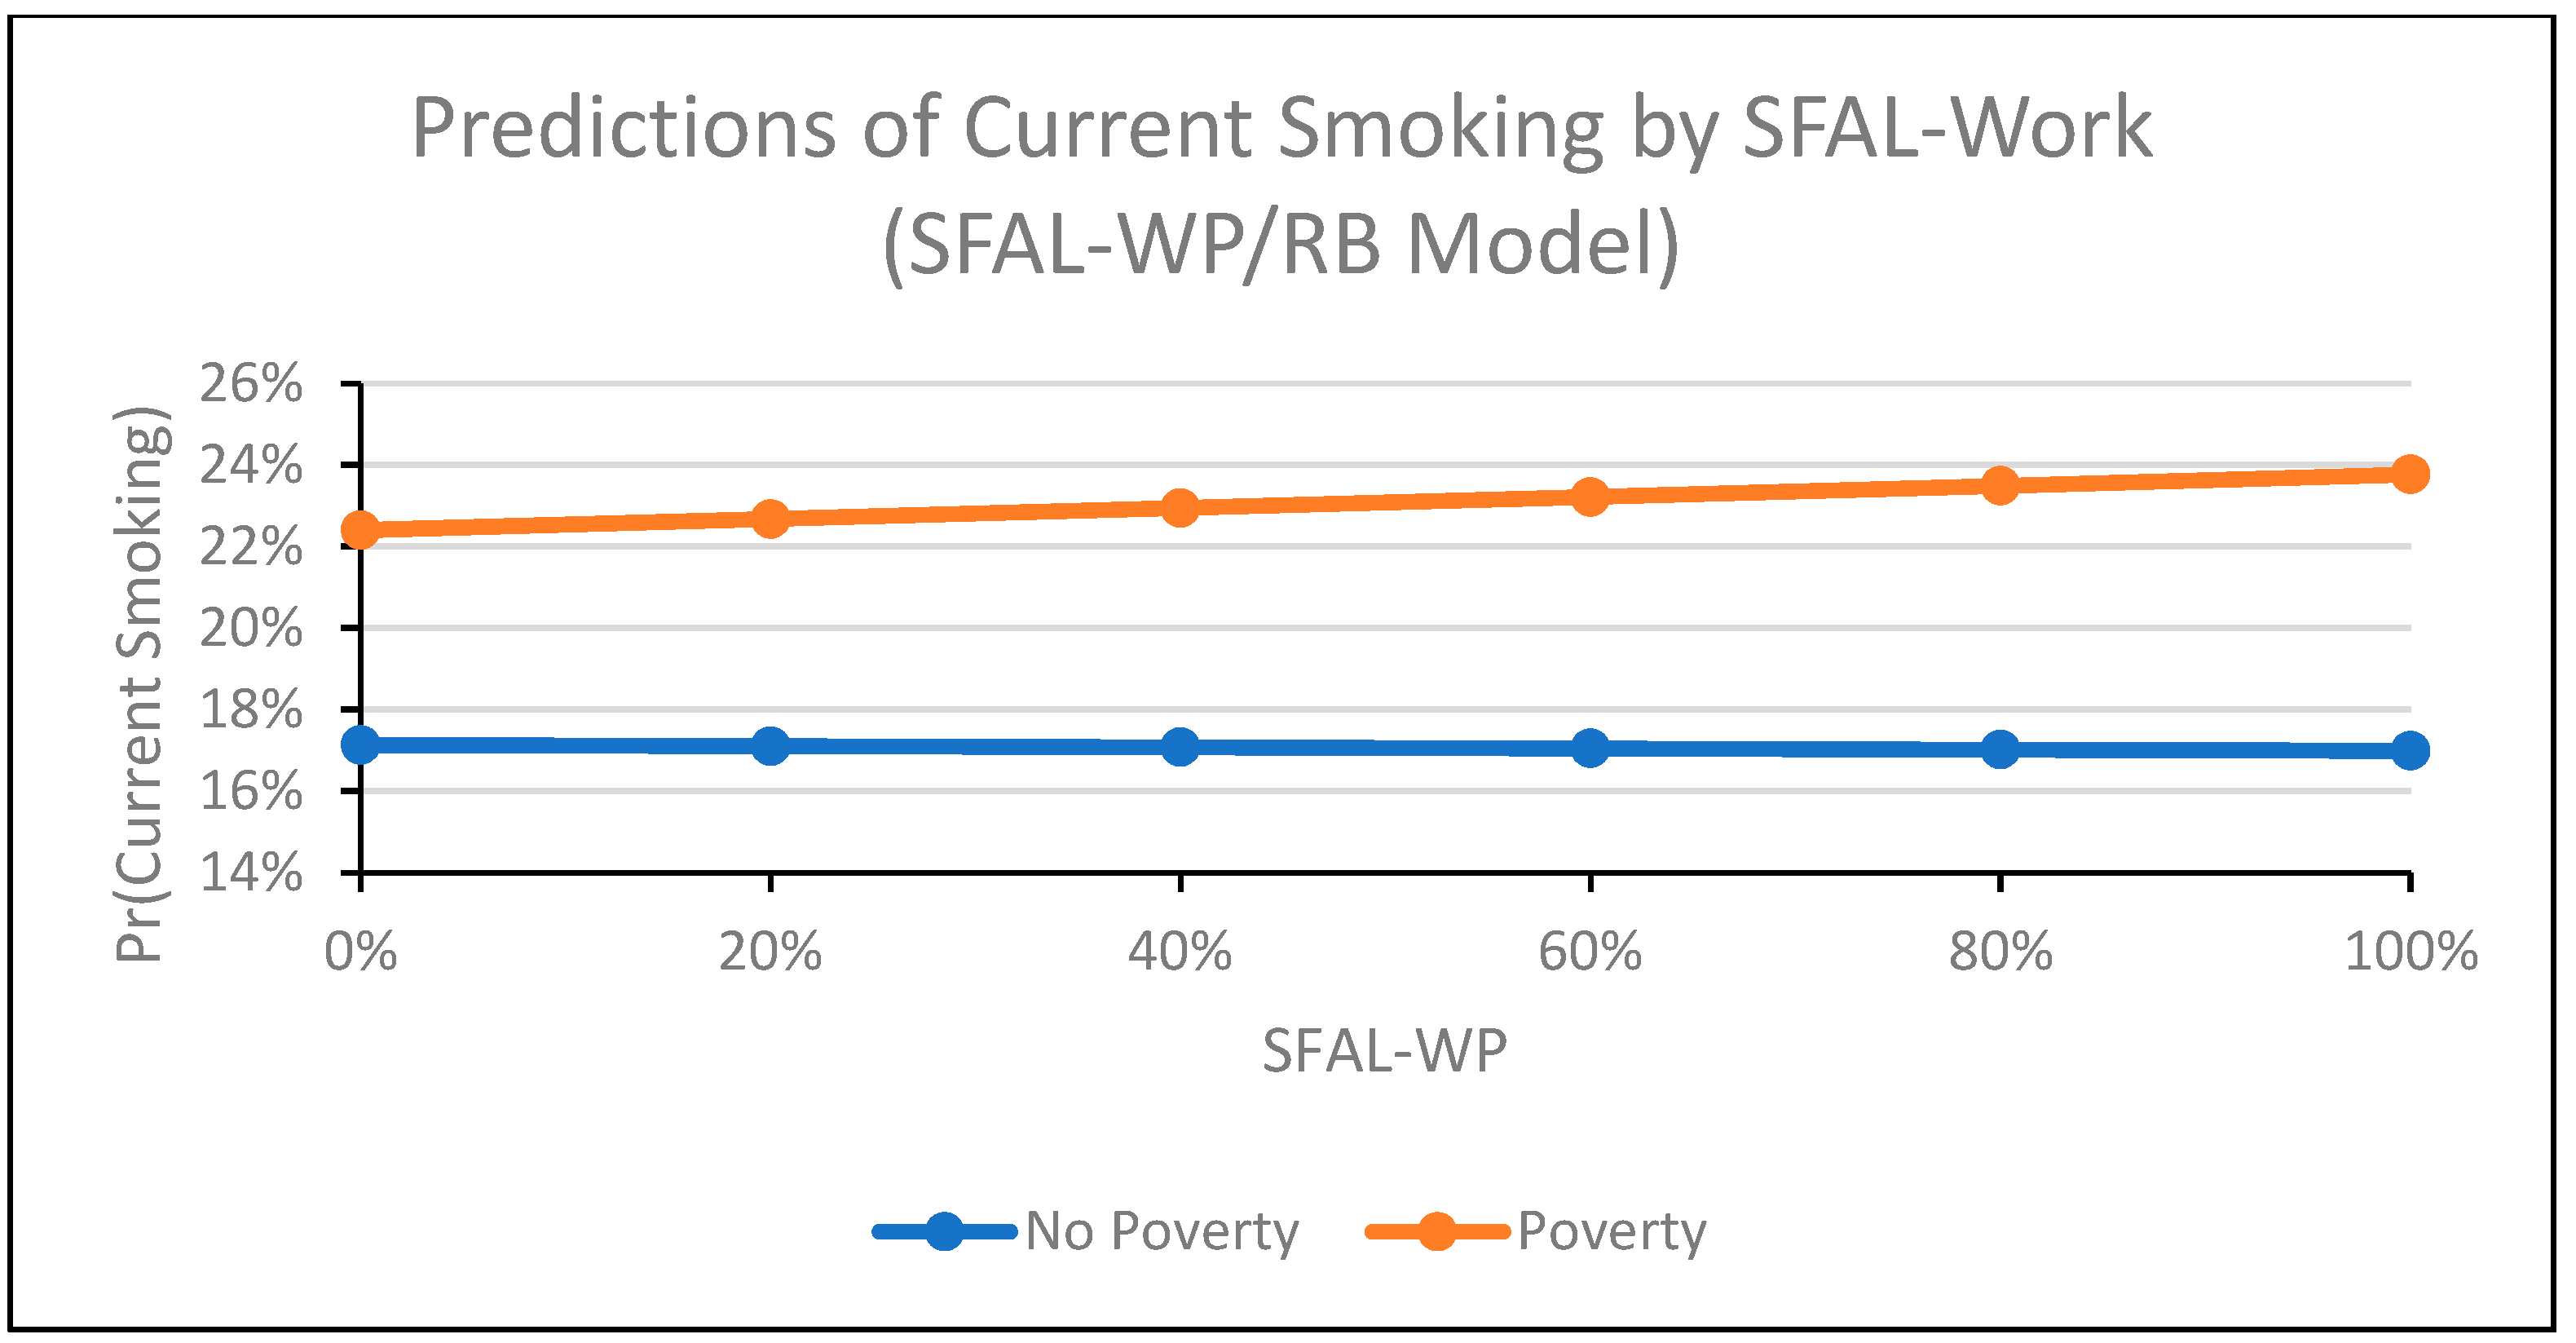
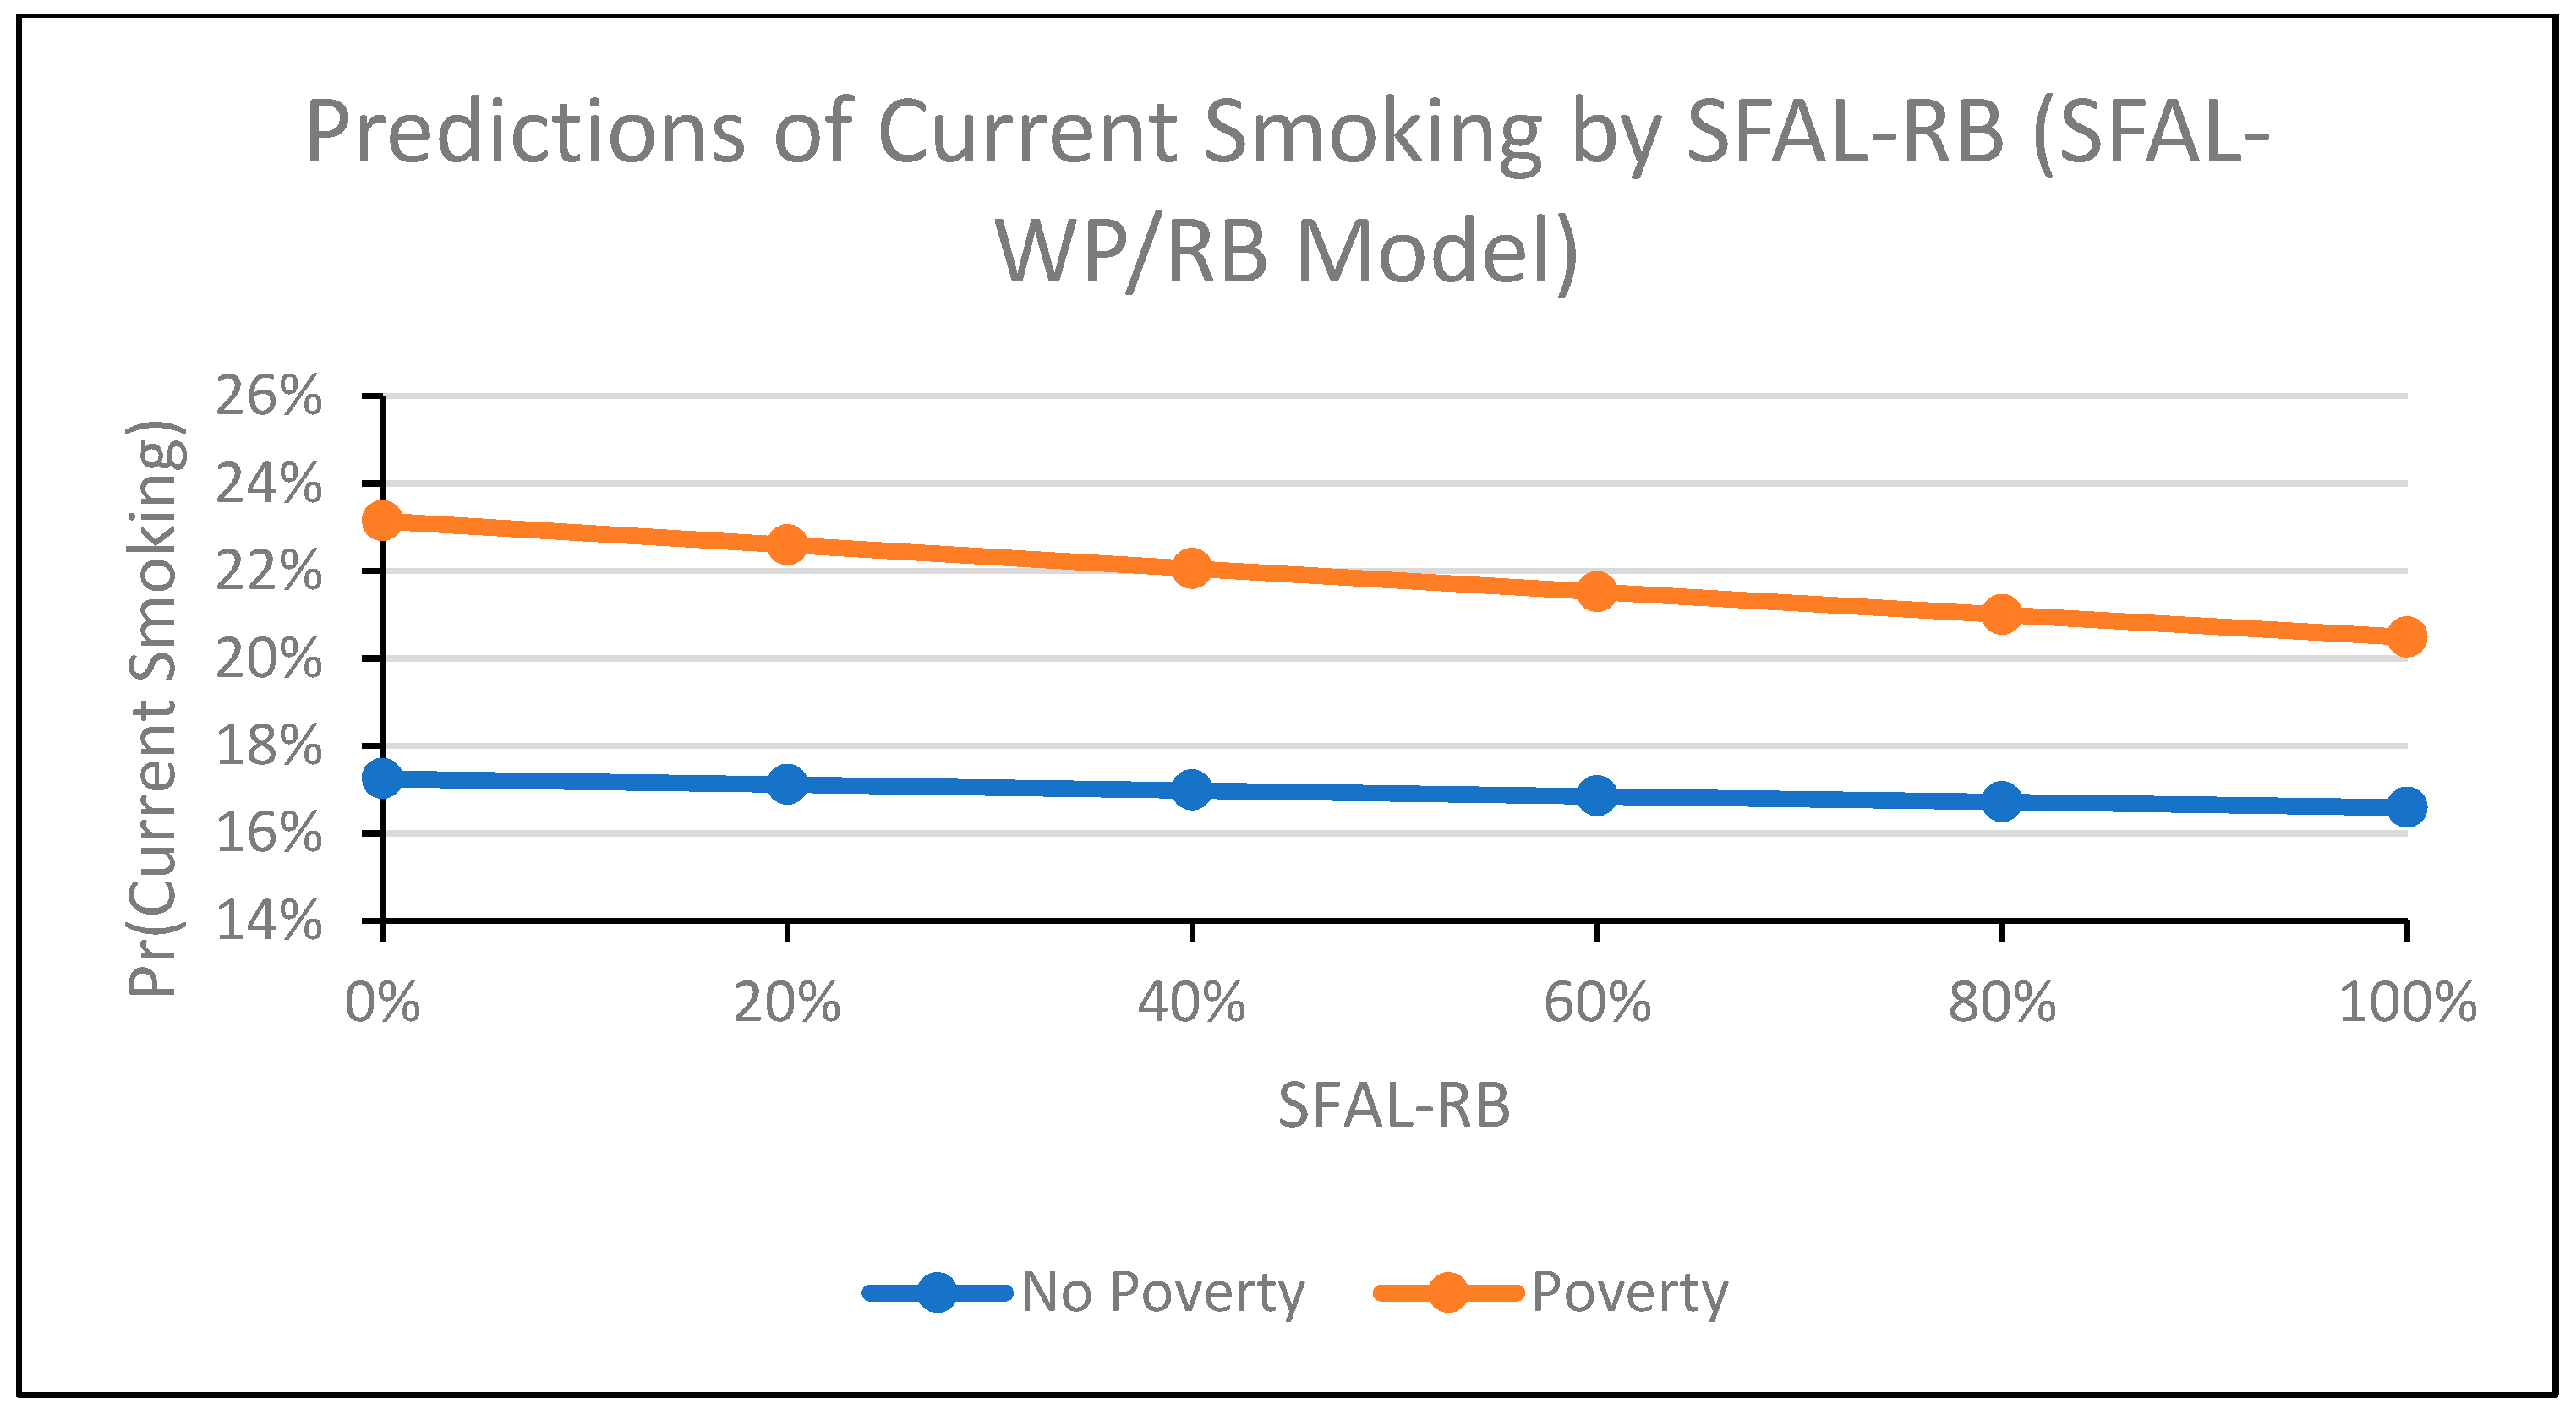
SFAL-WP and SFAL-RB Coverage
3.3.3. Sensitivity Analyses
4. Discussion
Limitations
5. Conclusions
Supplementary Materials
Author Contributions
Funding
Conflicts of Interest
References
- U.S. Department of Health and Human Services, National Center for Chronic Disease Prevention and Health Promotion, Office on Smoking and Health. The Health Consequences of Smoking: 50 Years of Progress. A Report of the Surgeon General; U.S. Department of Health and Human Services, Centers for Disease Control and Prevention: Atlanta, GA, USA, 2014.
- Jamal, A.; Homa, D.M.; O’Connor, E.; Babb, S.D.; Caraballo, R.S.; Singh, T.; Hu, S.S.; King, B.A. Current cigarette smoking among adults - United States, 2005–2014. Morb. Mortal. Wkly. Rep. 2015, 64, 1233–1240. [Google Scholar] [CrossRef] [PubMed]
- Siahpush, M.; Singh, G.H.; Jones, P.R.; Timsina, L.R. Racial/ethnic and socioeconomic variations in duration of smoking: Results from 2003, 2006 and 2007 Tobacco Use Supplement of the Current Population Survey. J. Public Health 2009, 32, 210–218. [Google Scholar] [CrossRef] [PubMed]
- Centers for Disease Control and Prevention. Disparities in secondhand smoke exposure--United States, 1988–1994 and 1999–2004. Morb. Mortal. Wkly. Rep. 2008, 57, 744–747. [Google Scholar]
- Skeer, M.; George, S.; Hamilton, W.L.; Cheng, D.M.; Siegel, M. Town-level characteristics and smoking policy adoption in Massachusetts: Are local restaurant smoking regulations fostering disparities in health protection? Am. J. Public Health 2004, 94, 286–292. [Google Scholar] [CrossRef]
- Ham, D.C.; Przybeck, T.; Strickland, J.R.; Luke, D.A.; Bierut, L.J.; Evanoff, B.A. Occupation and workplace policies predict smoking behaviors: Analysis of national data from the current population survey. J. Occup. Environ. Med. 2011, 53, 1337–1345. [Google Scholar] [CrossRef]
- Moore, R.S.; Annechino, R.M.; Lee, J.P. Unintended consequences of smoke-free bar policies for low-SES women in three California counties. Am. J. Prev. Med. 2009, 37, S138–S143. [Google Scholar] [CrossRef]
- Tong, E.K.; Tang, H.; Tsoh, J.; Wong, C.; Chen, M.S. Smoke-Free Policies Among Asian-American Women: Comparisons by Education Status. Am. J. Prev. Med. 2009, 37, S144–S150. [Google Scholar] [CrossRef]
- Choi, S.E. Are lower income smokers more price sensitive?: The evidence from Korean cigarette tax increases. Tobacco Control 2016, 25, 141–146. [Google Scholar] [CrossRef]
- Tworek, C.; Yamaguchi, R.; Kloska, D.D.; Emery, S.; Barker, D.C.; Giovino, G.A.; O’Malley, P.M.; Chaloupka, F.J. State-level tobacco control policies and youth smoking cessation measures. Health Policy 2010, 97, 136–144. [Google Scholar] [CrossRef]
- Parks, M.J.; Kingsbury, J.H.; Boyle, R.G.; Choi, K. Behavioral change in response to a statewide tobacco tax increase and differences across socioeconomic status. Addict. Behav. 2017, 73, 209–215. [Google Scholar] [CrossRef]
- Farrelly, M.C.; Nonnemaker, J.M.; Watson, K.A. The consequences of high cigarette excise taxes for low-income smokers. PLoS ONE 2012, 7, e43838. [Google Scholar] [CrossRef] [PubMed]
- Golden, S.D.; Farrelly, M.C.; Luke, D.A.; Ribisl, K.M. Comparing projected impacts of cigarette floor price and excise tax policies on socioeconomic disparities in smoking. Tobacco Control 2016, 25, i60–i66. [Google Scholar] [CrossRef] [PubMed]
- Thomas, S.; Fayter, D.; Misso, K.; Ogilvie, D.; Petticrew, M.; Sowden, A.; Whitehead, M.; Worthy, G. Population tobacco control interventions and their effects on social inequalities in smoking: Systematic review. Tobacco Control 2008, 17, 230–237. [Google Scholar] [CrossRef] [PubMed]
- Tauras, J.A.; Huang, J.; Chaloupka, F.J. Differential impact of tobacco control policies on youth sub-populations. Int. J. Environ. Res. Public Health 2013, 10, 4306–4322. [Google Scholar] [CrossRef] [PubMed]
- Brown, T.; Platt, S.; Amos, A. Equity impact of population-level interventions and policies to reduce smoking in adults: A systematic review. Drug Alcohol Depend. 2014, 138, 7–16. [Google Scholar] [CrossRef]
- Choi, K.; Hennrikus, D.; Forster, J.; St Claire, A.W. Use of price-minimizing strategies by smokers and their effects on subsequent smoking behaviors. Nicotine Tobacco Res. 2012, 14, 864–870. [Google Scholar] [CrossRef]
- DeCicca, P.; McLeod, L. Cigarette taxes and older adult smoking: Evidence from recent large tax increases. J. Health Econ. 2008, 27, 918–929. [Google Scholar] [CrossRef]
- Farrelly, M.C.; Bray, J.W.; Pechacek, T.; Woollery, T. Response by Adults to Increases in Cigarette Prices by Sociodemographic Characteristics. South. Econ. J. 2001, 68, 156–165. [Google Scholar] [CrossRef]
- Farrelly, M.C.; Loomis, B.R.; Han, B.; Gfroerer, J.; Kuiper, N.; Couzens, G.L.; Dube, S.; Caraballo, R.S. A comprehensive examination of the influence of state tobacco control programs and policies on youth smoking. Am. J. Public Health 2013, 103, 549–555. [Google Scholar] [CrossRef]
- Farrelly, M.C.; Pechacek, T.F.; Thomas, K.Y.; Nelson, D. The impact of tobacco control programs on adult smoking. Am. J. Public Health 2008, 98, 304–309. [Google Scholar] [CrossRef]
- Tauras, J.A.; Chaloupka, F.J.; Farrelly, M.C.; Giovino, G.A.; Wakefield, M.; Johnston, L.D.; O’Malley, P.M.; Kloska, D.D.; Pechacek, T.F. State tobacco control spending and youth smoking. Am. J. Public Health 2005, 95, 338–344. [Google Scholar] [CrossRef] [PubMed]
- Miller, C.L.; Sedivy, V. Using a quitline plus low-cost nicotine replacement therapy to help disadvantaged smokers to quit. Tobacco Control 2009, 18, 144–149. [Google Scholar] [CrossRef] [PubMed]
- Dinno, A.; Glantz, S. Tobacco control policies are egalitarian: A vulnerabilities perspective on clean indoor air laws, cigarette prices, and tobacco use disparities. Soc. Sci. Med. 2009, 68, 1439–1447. [Google Scholar] [CrossRef] [PubMed]
- Vijayaraghavan, M.; Schroeder, S.A.; Kushel, M. The effectiveness of tobacco control policies on vulnerable populations in the USA: A review. Postgrad. Med J. 2016, 92, 670–676. [Google Scholar] [CrossRef]
- Bala, M.M.; Strzeszynski, L.; Topor-Madry, R. Mass media interventions for smoking cessation in adults. Cochrane Database Syst. Rev. 2017, 11, Cd004704. [Google Scholar] [CrossRef]
- Hill, S.; Amos, A.; Clifford, D.; Platt, S. Impact of tobacco control interventions on socioeconomic inequalities in smoking: Review of the evidence. Tobacco Control 2014, 23, e89–e97. [Google Scholar] [CrossRef]
- Niederdeppe, J.; Kuang, X.; Crock, B.; Skelton, A. Media campaigns to promote smoking cessation among socioeconomically disadvantaged populations: What do we know, what do we need to learn, and what should we do now? Soc. Sci. Med. 2008, 67, 1343–1355. [Google Scholar] [CrossRef]
- Farrelly, M.C.; Loomis, B.R.; Kuiper, N.; Han, B.; Gfroerer, J.; Caraballo, R.S.; Pechacek, T.F.; Couzens, G.L. Are tobacco control policies effective in reducing young adult smoking? J. Adolesc. Health 2014, 54, 481–486. [Google Scholar] [CrossRef]
- U.S. Census Bureau. About the current Population Survey. Current Population Survey (CPS). Available online: https://www.census.gov/programs-surveys/cps/about.html (accessed on 12 June 2018).
- Bureau of the Census. Current Population Survey, September 1985: United States Immunization and Smoking Survey; Inter-University Consortium for Political and Social Research: Ann Arbor, MI, USA, 2001.
- Bureau of the Census. Current Population Survey 1989: Veterans and Cardiovascular Disease Risk Factor Supplements; Inter-University Consortium for Political and Social Research: Ann Arbor, MI, USA, 1999.
- U.S. Census Bureau. Supplemental Surveys. Current Population Survey (CPS). Available online: https://www.census.gov/programs-surveys/cps/about/supplemental-surveys.html (accessed on 12 June 2018).
- Office of Disease Prevention and Health Promotion. Tobacco Use Supplement-Current Population Survey. Available online: https://www.healthypeople.gov/2020/data-source/tobacco-use-supplement-current-population-survey (accessed on 14 June 2018).
- Soulakova, J.; Davis, W.W.; Hartman, A.; Gibson, J. The Impact of Survey and Response Modes on Current Smoking Prevalence Estimates Using TUS-CPS: 1992–2003. Surv. Res. Methods 2009, 3, 123–137. [Google Scholar]
- Bureau of the Census. Technical Documentation CPS—00. Available online: https://www2.census.gov/programs-surveys/cps/techdocs/cpsjanmay00.pdf (accessed on 14 June 2018).
- Bureau of the Census. Technical Documentation CPS—07. Available online: https://www2.census.gov/programs-surveys/cps/techdocs/cpsjan07.pdf (accessed on 14 June 2018).
- Bureau of the Census. Technical Documentation CPS—15. Available online: http://www.nber.org/cps/cpsjan2015.pdf (accessed on 24 June 2018).
- Adler, N. Overview of Health Disparities. From: Institute of Medicine (US) Committee on the Review and Assessment of the NIH’s Strategic Research Plan and Budget to Reduce and Ultimately Eliminate Health Disparities. In Examining the Health Disparities Research Plan of the National Institutes of Health: Unfinished Business; Thomson, G.E., Mitchell, F., Williams, M.B., Eds.; National Academies Press: Washington, DC, USA, 2006. [Google Scholar]
- Fosu, A.K. Poverty and development. Bull. World Health Organ. 2007, 85, 734. [Google Scholar] [CrossRef]
- Michael, R.T.; Atkinson, A.B.; Betson, D.M.; Blank, R.M.; Bobo, L.D.; Brooks-Gunn, J.; Cogan, J.F.; Danziger, S.H.; Deaton, A.S.; Ellwood, D.T.; et al. Measuring Poverty: A New Approach. Adv. Consum. Interest 1997, 9, 18–23. [Google Scholar]
- Brady, D. Rethinking the Sociological Measurement of Poverty. Soc. Forces 2003, 81, 715–751. [Google Scholar] [CrossRef]
- Braveman, P.A.; Cubbin, C.; Egerter, S.; Williams, D.R.; Pamuk, E. Socioeconomic Disparities in Health in the United States: What the Patterns Tell Us. Am. J. Public Health 2010, 100, S186–S196. [Google Scholar] [CrossRef] [PubMed]
- HealthCare.gov. Federal Poverty Level (FPL). Available online: https://www.healthcare.gov/glossary/federal-poverty-level-fpl/ (accessed on 9 July 2019).
- Medicaid.gov. Determining Eligibility for Medicaid. Available online: https://www.medicaid.gov/medicaid/eligibility/index.html (accessed on 9 July 2019).
- U.S. Social Security Administration. Annual Statistical Supplement. 2014. Available online: https://www.ssa.gov/policy/docs/statcomps/supplement/2014/3e.html#table3.e8 (accessed on 12 June 2014).
- American Nonsmokers’ Rights Foundation. U.S. 100% Smokefree Laws in Non-Hospitality Workplaces AND Restaurants AND Bars. Available online: https://no-smoke.org/wp-content/uploads/pdf/WRBLawsMap.pdf (accessed on 12 June 2018).
- American Nonsmokers’ Rights Foundation. U.S. 100% Smokefree Definitions. Available online: https://no-smoke.org/100-smokefree-definitions/ (accessed on 27 July 2018).
- Song, A.V.; Dutra, L.M.; Neilands, T.B.; Glantz, S.A. Association of Smoke-Free Laws with Lower Percentages of New and Current Smokers Among Adolescents and Young Adults: An 11-Year Longitudinal Study. JAMA Pediatr. 2015, 169, e152285. [Google Scholar] [CrossRef] [PubMed]
- Dutra, L.M.; Glantz, S.A.; Arrazola, R.A.; King, B.A. Impact of E-Cigarette Minimum Legal Sale Age Laws on Current Cigarette Smoking. J. Adolesc. Health 2018, 62, 532–538. [Google Scholar] [CrossRef] [PubMed]
- Orzechowski, W.; Walker, R.C. The Tax Burden on Tobacco, Historical Compilation; Orzechowski and Walker: Arlington, VA, USA, 2016; Volume 51. [Google Scholar]
- U.S. Bureau of Labor Statistics. CPI Inflation Calculator. Available online: https://www.bls.gov/data/inflation_calculator.htm (accessed on 3 July 2019).
- Farrelly, M.C.; Arnold, K.Y.; Juster, H.R.; Allen, J.A. Quantifying the effect of changes in state-level adult smoking rates on youth smoking. J. Public Health Manag. Pract. 2014, 20, E1–E6. [Google Scholar] [CrossRef]
- Gammon, D.G.; Loomis, B.R.; Dench, D.L.; King, B.A.; Fulmer, E.B.; Rogers, T. Effect of price changes in little cigars and cigarettes on little cigar sales: USA, Q4 2011–Q4 2013. Tobacco Control 2016, 25, 538–544. [Google Scholar] [CrossRef]
- Williams, R. Using the margins command to estimate and interpret adjusted predictions and marginal effects. Stata J. 2012, 12, 308–331. [Google Scholar] [CrossRef]
- Yitzhaki, S. Relative deprivation and the Gini coefficient. Q. J. Econ. 1979, 93, 321–324. [Google Scholar] [CrossRef]
- Goldberger, A.S. A Course in Econometrics; Harvard University Press: Cambridge, MA, USA, 1991. [Google Scholar]
- U.S. Department of Health and Human Services. Preventing Tobacco Use Among Youth and Young Adults: A Report of the Surgeon General; U.S. Department of Health and Human Services, Centers for Disease Control and Prevention, National Center for Chronic Disease Prevention and Health Promotion, Office on Smoking and Health: Atlanta, GA, USA, 2012.
- Bitler, M.P.; Carpenter, C.S.; Zavodny, M. Effects of venue-specific state clean indoor air laws on smoking-related outcomes. Health Econ. 2010, 19, 1425–1440. [Google Scholar] [CrossRef]
- Dearlove, J.V.; Bialous, S.A.; Glantz, S.A. Tobacco industry manipulation of the hospitality industry to maintain smoking in public places. Tobacco Control 2002, 11, 94–104. [Google Scholar] [CrossRef] [PubMed]
- Adler, N.E.; Boyce, W.T.; Chesney, M.A.; Folkman, S.; Syme, S.L. Socioeconomic inequalities in health—No easy solution. J. Am. Med. Assoc. 1993, 269, 3140–3145. [Google Scholar] [CrossRef]
- Parry, O.; Platt, S. Smokers at risk: Implications of an institutionally bordered risk-reduced environment. Health Place 2000, 6, 117–123. [Google Scholar] [CrossRef]
- Sorsensen, G.; Rigotti, N.; Rosen, A.; Pinney, J.; Prible, R. Effects of a worksite nonsmoking policy: Evidence for increased cessation. Am. J. Public Health 1991, 81, 202–204. [Google Scholar] [CrossRef] [PubMed]
- Acs, G.; Nichols, A. Low-Income Workers and Their Employers Characteristics and Challenges; The Urban Institute: Washington, DC, USA, 2007. [Google Scholar]


| Variable Name | Equal to or above 138% of Poverty Line n = 1,683,311 | Below 138% of Poverty Line n = 431,711 | Total n = 2,070,022 | p Value |
|---|---|---|---|---|
| Current Smoker, % (SE) | ||||
| Yes | 18.56 (0.03) | 27.82 (0.07) | 20.49 (0.03) | <0.0001 |
| Primary predictor variables, Mean (SE) | ||||
| Smoke-free law coverage (SFALs) 2 | ||||
| % state covered by workplace, bar, and restaurant laws (All) | 13.65 (0.03) | 12.26 (0.05) | 13.36 (0.02) | <0.0001 |
| % state covered by workplace laws (WP) | 25.83 (0.03) | 24.59 (0.06) | 25.57 (0.03) | <0.0001 |
| % state covered by restaurant and/or bar laws (RB) | 19.36 (0.03) | 18.41 (0.05) | 19.16 (0.02) | <0.0001 |
| Per-pack state cigarette tax ($) 3 | 1.43 (0.001) | 1.36 (0.001) | 1.42 (0.001) | <0.0001 |
| Per capita tobacco control funding - 5% discount ($) 4 | 14.87 (0.02) | 13.94 (0.03) | 14.68 (0.01) | <0.0001 |
| Covariates, Mean (SE) | ||||
| Age | 45.92 (0.01) | 45.37 (0.03) | 45.80 (0.01) | <0.0001 |
| Income ($ 5) | 84,458.34 (39.91) | 16,391.33 (12.27) | 70,262.71 (37.11) | <0.0001 |
| Covariates, % (SE) | ||||
| Race/ethnicity | ||||
| Non-Hispanic white | 81.57 (0.03) | 59.08 (0.07) | 76.88 (0.03) | <0.0001 |
| Non-Hispanic black | 6.90 (0.02) | 16.79 (0.06) | 8.96 (0.02) | <0.0001 |
| Hispanic | 6.63 (0.02) | 17.54 (0.06) | 8.91 (0.02) | <0.0001 |
| Non-Hispanic other | 4.89 (0.02) | 6.58 (0.04) | 5.24 (0.02) | <0.0001 |
| Educational attainment | ||||
| No high school | 3.51 (0.02) | 17.39 (0.06) | 6.41 (0.02) | <0.0001 |
| High school dropout | 7.12 (0.02) | 20.72 (0.07) | 9.96 (0.02) | <0.0001 |
| High school graduate/ General Education Diploma (GED) | 32.42 (0.04) | 35.68 (0.08) | 33.10 (0.03) | <0.0001 |
| Some college | 28.08 (0.04) | 19.50 (0.06) | 26.29 (0.03) | <0.0001 |
| College graduate | 28.87 (0.04) | 6.71 (0.04) | 24.25 (0.03) | <0.0001 |
| Marital status | ||||
| Married | 63.68 (0.04) | 40.03 (0.07) | 58.75 (0.03) | <0.0001 |
| Divorced | 9.23 (0.02) | 13.26 (0.05) | 10.07 (0.02) | <0.0001 |
| Widowed | 5.49 (0.02) | 12.33 (0.05) | 6.91 (0.02) | <0.0001 |
| Separated | 1.54 (0.01) | 4.47 (0.03) | 2.15 (0.01) | <0.0001 |
| Never married | 20.06 (0.03) | 29.91 (0.07) | 22.12 (0.03) | <0.0001 |
| Employment status | ||||
| Working | 69.91 (0.04) | 42.21 (0.08) | 64.13 (0.03) | <0.0001 |
| Unemployed | 2.78 (0.01) | 7.51 (0.04) | 3.77 (0.01) | <0.0001 |
| Not in labor force | 27.31 (0.03) | 50.28 (0.08) | 32.10 (0.03) | <0.0001 |
| Variable Name | Without Interaction Terms | With Interaction Terms | ||
|---|---|---|---|---|
| Model 1 | Model 2 | Model 3 | Model 4 | |
| Coeff (95% CI) | Coeff (95% CI) | Coeff (95% CI) | Coeff (95% CI) | |
| Poverty (<138% of poverty line) | 0.32 (0.30, 0.33) | 0.32 (0.30, 0.33) | 0.32 (0.30, 0.34) | 0.30 (0.28, 0.32) |
| Smoke-free law coverage (SFALs) 2 | ||||
| % state covered by workplace, bar, and restaurant laws (All) | −0.01 (−0.04, 0.01) | - | −0.03 (−0.06, −0.002) | - |
| % state covered by workplace laws (WP) | - | 0.02 (−0.01, 0.05) | - | −0.002 (−0.04, 0.03) |
| % of state covered by restaurant and/or bar laws (RB) | - | −0.08 (−0.11, −0.06) | - | −0.05 (−0.08, −0.02) |
| Poverty by SFAL-All | - | - | 0.08 (0.02, 0.13) | - |
| Poverty by SFAL-WP | - | - | - | 0.09 (0.03, 0.15) |
| Poverty by SFAL-RB | - | - | - | −0.14 (−0.19, −0.09) |
| Per-pack state cigarette tax ($) 3 | −0.06 (−0.07, −0.05) | −0.05 (−0.06, −0.04) | −0.06 (−0.07, −0.05) | −0.05 (−0.06, −0.04) |
| Poverty by Tax | - | - | −0.01 (−0.03, 0.02) | 0.02 (−0.00, 0.04) |
| Per capita tobacco control funding - 5% discount ($) 4 | −0.01 (−0.01, −0.002) | −0.003 (−0.01, 0.001) | −0.01 (−0.01, −0.001) | −0.01 (−0.01, −0.00) |
| Poverty by TCF | - | - | −0.002 (−0.01, 0.01) | 0.01 (0.00, 0.02) |
| Age | 0.11 (0.11, 0.11) | 0.11 (0.11, 0.11) | 0.11 (0.11, 0.11) | 0.11 (0.11, 0.11) |
| Age ² | −0.001 (−0.001, −0.001) | −0.001 (−0.001, −0.001) | −0.001 (−0.001, -0.001) | −0.001 (−0.001, −0.001) |
| Race/ethnicity | ||||
| Non-Hispanic white | Ref | Ref | Ref | Ref |
| Non-Hispanic black | −0.50 (−0.51, −0.48) | −0.50 (−0.51, −0.48) | −0.50 (−0.51, −0.48) | −0.50 (−0.51, −0.48) |
| Hispanic | −0.90 (−0.92, −0.88) | −0.90 (−0.92, −0.88) | −0.90 (−0.92, −0.88) | −0.90 (−0.91, −0.88) |
| Non-Hispanic other | −0.36 (−0.38, −0.33) | −0.36 (−0.38, −0.33) | −0.36 (−0.38, −0.33) | −0.36 (−0.38, −0.33) |
| Educational attainment | ||||
| No high school | 0.02 (−0.001, 0.04) | 0.02 (−0.001, 0.04) | 0.02 (−0.001, 0.04) | 0.02 (−0.00, 0.04) |
| High school dropout | 0.42 (0.41, 0.43) | 0.42 (0.41, 0.43) | 0.42 (0.41, 0.43) | 0.42 (0.41, 0.43) |
| High school graduate/General Education Diploma (GED) | Ref | Ref | Ref | Ref |
| Some college | −0.36 (−0.37, −0.35) | −0.36 (−0.37, −0.35) | −0.36 (−0.37, −0.35) | −0.36 (−0.37, −0.35) |
| College graduate | −1.22 (−1.23, −1.20) | −1.22 (−1.23, −1.20) | −1.22 (−1.23, −1.20) | −1.22 (−1.23, −1.20) |
| Marital Status | ||||
| Married | Ref | Ref | Ref | Ref |
| Divorced | 0.74 (0.73, 0.75) | 0.74 (0.73, 0.75) | 0.74 (0.73, 0.75) | 0.74 (0.72, 0.75) |
| Widowed | 0.41 (0.39, 0.43) | 0.41 (0.39, 0.43) | 0.41 (0.39, 0.43) | 0.41 (0.39, 0.43) |
| Separated | 0.74 (0.71, 0.76) | 0.74 (0.71, 0.76) | 0.74 (0.71, 0.76) | 0.74 (0.71, 0.76) |
| Never married | 0.33 (0.32, 0.35) | 0.33 (0.32, 0.35) | 0.33 (0.32, 0.35) | 0.33 (0.32, 0.35) |
| Employment | ||||
| Working | Ref | Ref | Ref | Ref |
| Unemployed | 0.45 (0.43, 0.47) | 0.45 (0.43, 0.47) | 0.45 (0.43, 0.47) | 0.45 (0.43, 0.47) |
| Not in labor force | −0.09 (−0.10, −0.10) | −0.09 (−0.10, −0.08) | −0.09 (−0.10, −0.08) | −0.09 (−0.10, −0.10) |
© 2019 by the authors. Licensee MDPI, Basel, Switzerland. This article is an open access article distributed under the terms and conditions of the Creative Commons Attribution (CC BY) license (http://creativecommons.org/licenses/by/4.0/).
Share and Cite
Dutra, L.M.; Farrelly, M.C.; Nonnemaker, J.; Bradfield, B.; Gaber, J.; Patel, M.; Hair, E.C. Differential Relationship between Tobacco Control Policies and U.S. Adult Current Smoking by Poverty. Int. J. Environ. Res. Public Health 2019, 16, 4130. https://doi.org/10.3390/ijerph16214130
Dutra LM, Farrelly MC, Nonnemaker J, Bradfield B, Gaber J, Patel M, Hair EC. Differential Relationship between Tobacco Control Policies and U.S. Adult Current Smoking by Poverty. International Journal of Environmental Research and Public Health. 2019; 16(21):4130. https://doi.org/10.3390/ijerph16214130
Chicago/Turabian StyleDutra, Lauren M., Matthew C. Farrelly, James Nonnemaker, Brian Bradfield, Jennifer Gaber, Minal Patel, and Elizabeth C. Hair. 2019. "Differential Relationship between Tobacco Control Policies and U.S. Adult Current Smoking by Poverty" International Journal of Environmental Research and Public Health 16, no. 21: 4130. https://doi.org/10.3390/ijerph16214130
APA StyleDutra, L. M., Farrelly, M. C., Nonnemaker, J., Bradfield, B., Gaber, J., Patel, M., & Hair, E. C. (2019). Differential Relationship between Tobacco Control Policies and U.S. Adult Current Smoking by Poverty. International Journal of Environmental Research and Public Health, 16(21), 4130. https://doi.org/10.3390/ijerph16214130