Examination of Human Health Impacts Due to Adverse Climate Events Through the Use of Vulnerability Mapping: A Scoping Review


Abstract
1. Introduction
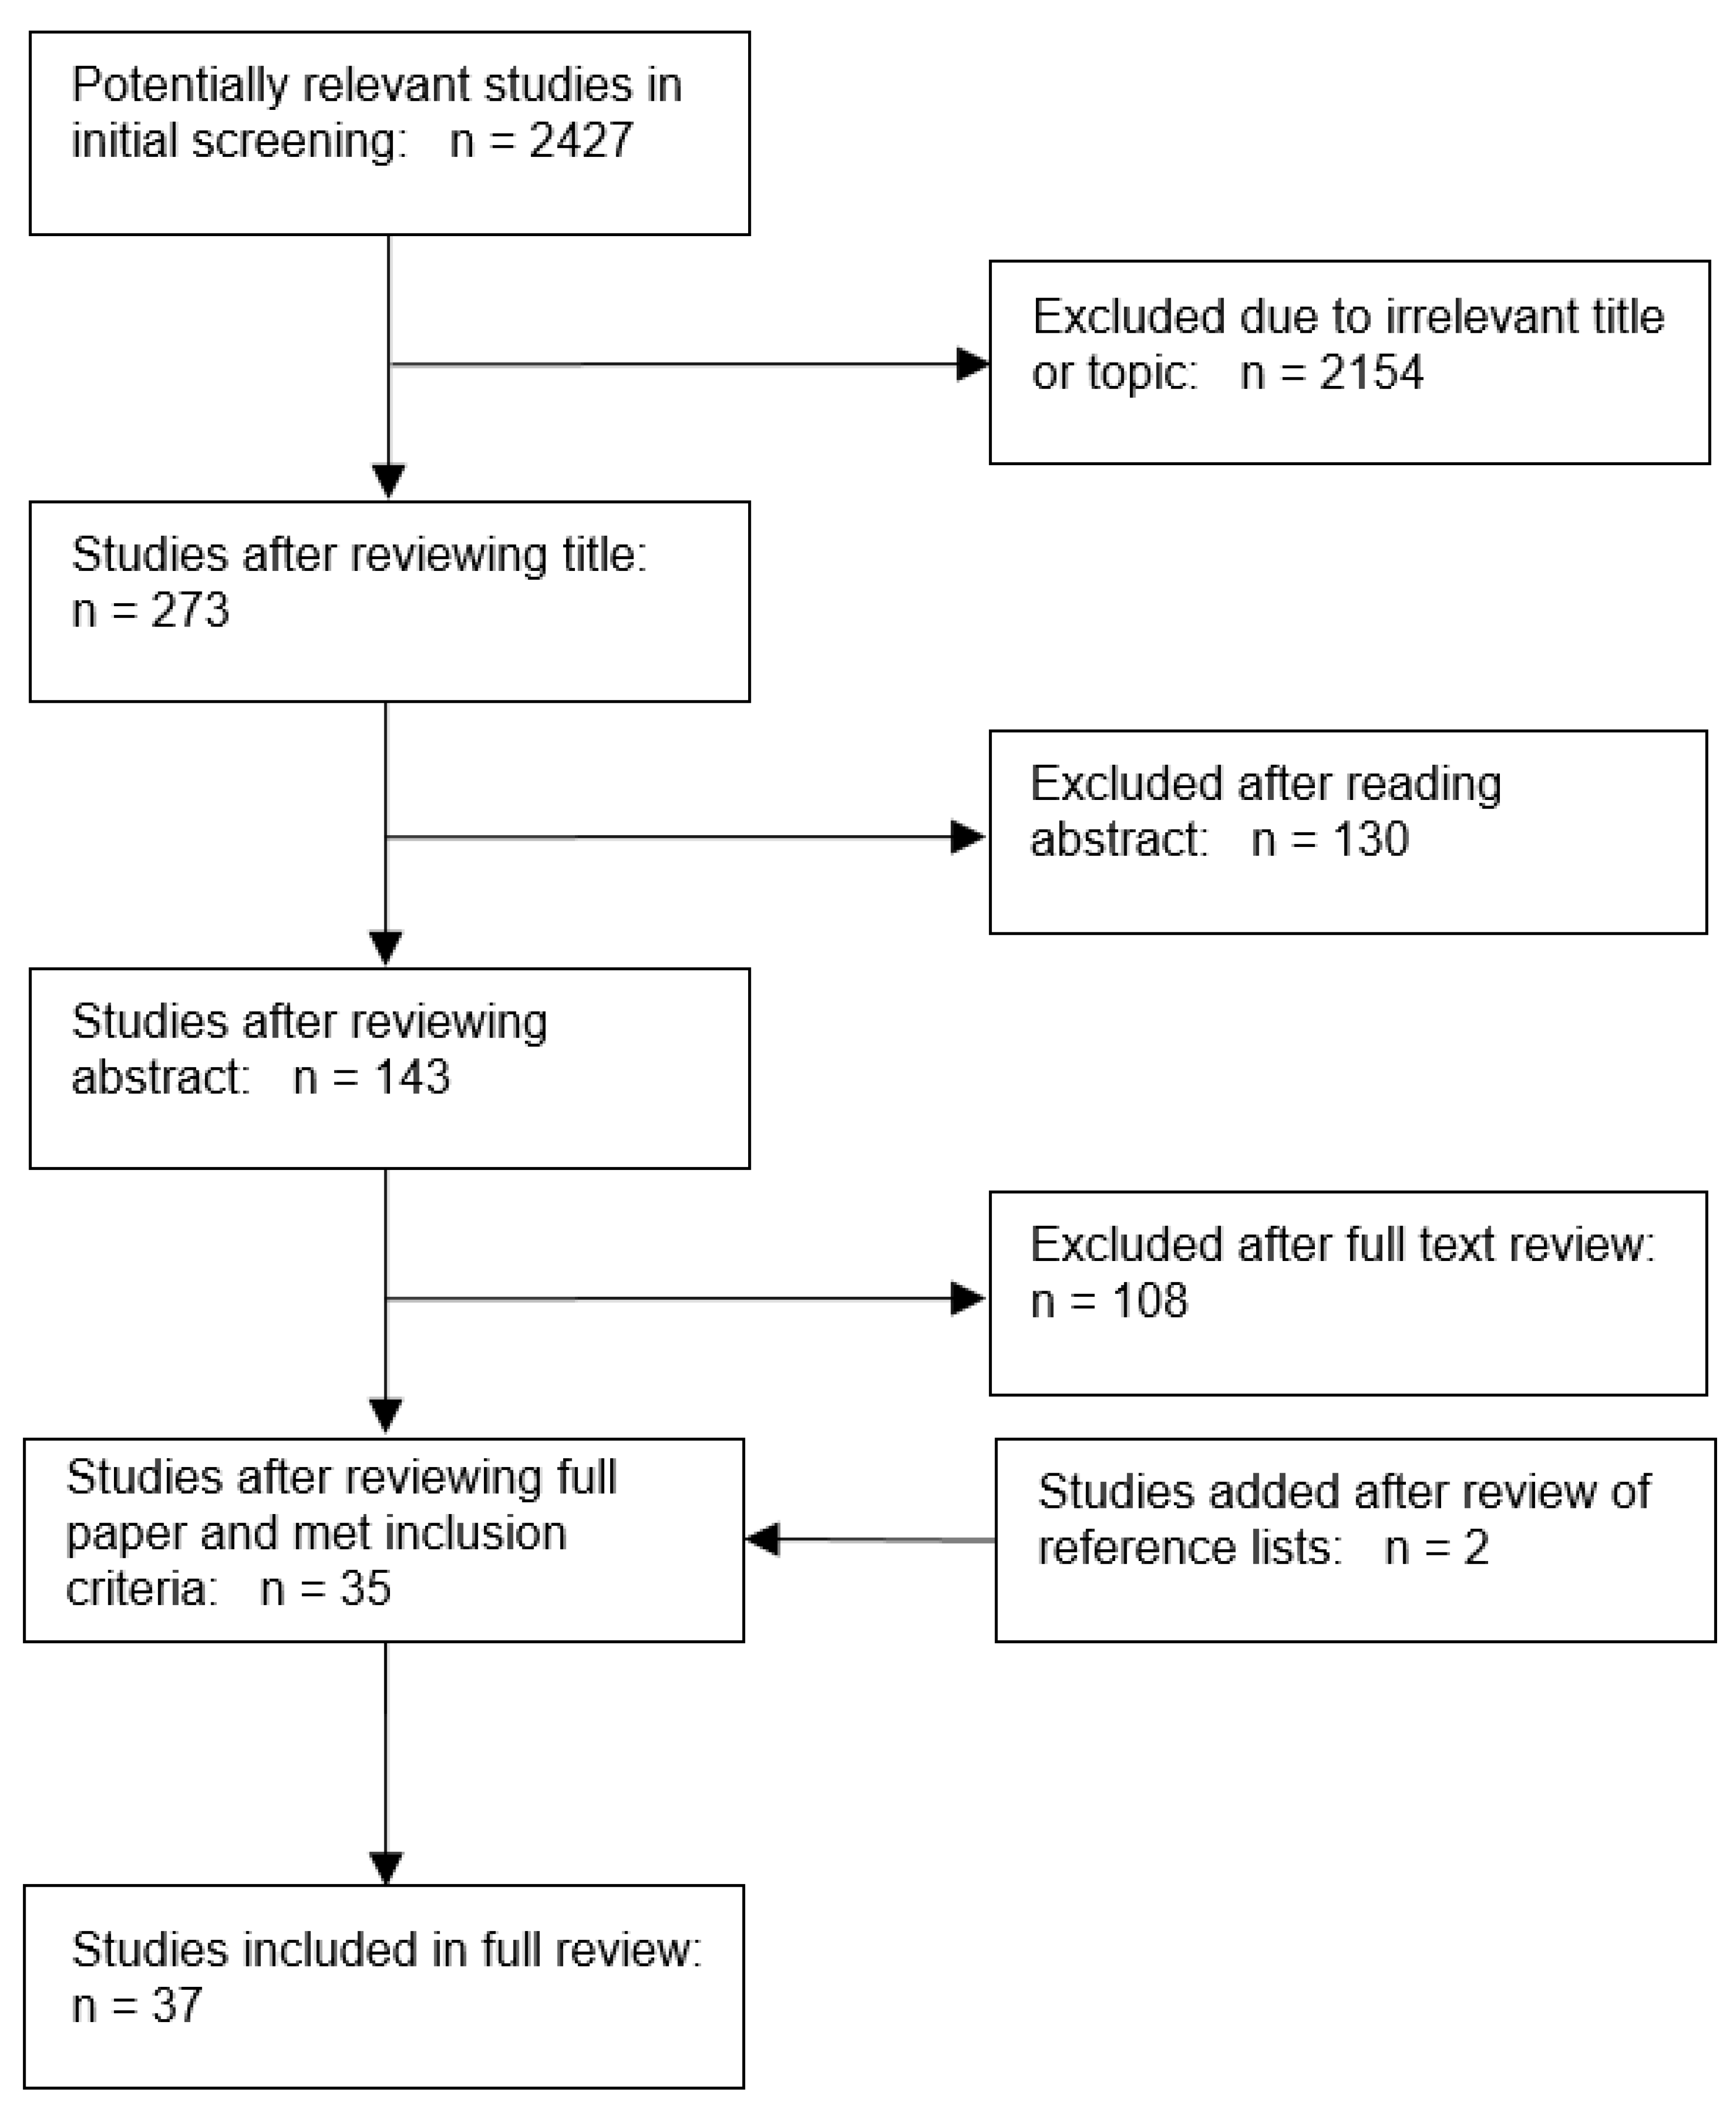
2. Methodology
3. Results
3.1. High Ambient Temperature
3.2. Sea-Level Rise, Flood Hazards and High Precipitation Events
3.3. Vector-Borne Disease and Infectious Micro-Organisms
3.4. Wildfires
4. Discussion
5. Conclusions
Author Contributions
Funding
Acknowledgments
Conflicts of Interest
References
- Blaikie, P.; Cannon, T.; Davis, I.; Wisner, B. At Risk: Natural Hazards, People’s Vulnerability and Disasters; Routledge: Abington, UK, 2005. [Google Scholar]
- IPCC. Climate Change 2014—Impacts, Adaptation and Vulnerability: Part A: Global and Sectoral Aspects: Working Group II Contribution to the IPCC Fifth Assessment Report: Volume 1: Global and Sectoral Aspects; Cambridge University Press: Cambridge, UK, 2014. [Google Scholar]
- Alwang, J.; Siegel, P.B.; Jorgensen, S.L. Vulnerability: A View from Different Disciplines; Social Protection Discussion Paper Series; World Bank: Washington, DC, USA, 2001. [Google Scholar]
- Luber, G.; Lemery, J. Global Climate Change and Human Health: From Science to Practice; John Wiley & Sons: Hoboken, NJ, USA, 2015. [Google Scholar]
- Birkmann, J. Measuring vulnerability to promote disaster-resilient societies: Conceptual frameworks and definitions. Measuring Vulnerability to Natural Hazards: Towards Disaster Resilient Societies; United Nations University Press: Tokyo, Japan, 2006; pp. 9–54. [Google Scholar]
- Füssel, H.-M. Vulnerability: A generally applicable conceptual framework for climate change research. Glob. Environ. Chang. 2007, 17, 155–167. [Google Scholar] [CrossRef]
- Füssel, H.-M.; Klein, R.J.T. Climate change vulnerability assessments: An evolution of conceptual thinking. Clim. Chang. 2006, 75, 301–329. [Google Scholar] [CrossRef]
- Gamble, J.L.; Balbus, J.; Berger, M.; Bouye, K.; Campbell, V.; Chief, K.; Conlon, K.; Crimmins, A.; Flanagan, B.; Gonzalez-Maddux, C. Chapter 9: Populations of Concern. In The Impacts of Climate Change on Human Health in the United States: A Scientific Assessment; US Global Change Research Program: Washington, DC, USA, 2016. [Google Scholar]
- Bruno Soares, M.; Gagnon, A.S.; Doherty, M.R. Conceptual elements of climate change vulnerability assessments: A review. Int. J. Clim. Chang. Strateg. Manag. 2012, 4, 6–35. [Google Scholar] [CrossRef]
- Gubler, D.J.; Reiter, P.; Ebi, K.L.; Yap, W.; Nasci, R.; Patz, J.A. Climate variability and change in the United States: Potential impacts on vector-and rodent-borne diseases. Environ. Health Perspect. 2001, 109 (Suppl. S2), 223–233. [Google Scholar] [PubMed]
- Keim, M.E. Building human resilience: The role of public health preparedness and response as an adaptation to climate change. Am. J. Prev. Med. 2008, 35, 508–516. [Google Scholar] [CrossRef] [PubMed]
- Turner, B.L., 2nd; Kasperson, R.E.; Matson, P.A.; McCarthy, J.J.; Corell, R.W.; Christensen, L.; Eckley, N.; Kasperson, J.X.; Luers, A.; Martello, M.L.; et al. A framework for vulnerability analysis in sustainability science. Proc. Natl. Acad. Sci. USA 2003, 100, 8074–8079. [Google Scholar] [CrossRef]
- Preston, B.L.; Brooke, C.; Measham, T.G.; Smith, T.F.; Gorddard, R. Igniting change in local government: Lessons learned from a bushfire vulnerability assessment. Mitig. Adapt. Strateg. Glob. Chang. 2009, 14, 251–283. [Google Scholar] [CrossRef]
- Eriksen, S.H.; Kelly, P.M. Developing credible vulnerability indicators for climate adaptation policy assessment. Mitig. Adapt. Strateg. Glob. Chang. 2007, 12, 495–524. [Google Scholar] [CrossRef]
- Manangan, A.P.; Uejio, C.K.; Saha, S.; Schramm, P.J.; Marinucci, G.D.; Hess, J.J.; Luber, G. Assessing Health Vulnerability to Climate Change: A Guide for Health Departments; CDC Stacks Public Health Publications: Atlanta, GA, USA, 2014.
- Safran, C.; Bloomrosen, M.; Hammond, W.E.; Labkoff, S.; Markel-Fox, S.; Tang, P.C.; Detmer, D.E.; Expert, P. Toward a national framework for the secondary use of health data: An American Medical Informatics Association White Paper. J. Am. Med Inform. Assoc. Jamia 2007, 14, 1–9. [Google Scholar] [CrossRef]
- O’Brien, K.; Leichenko, R.; Kelkar, U.; Venema, H.; Aandahl, G.; Tompkins, H.; Javed, A.; Bhadwal, S.; Barg, S.; Nygaard, L. Mapping vulnerability to multiple stressors: Climate change and globalization in India. Glob. Environ. Chang. 2004, 14, 303–313. [Google Scholar] [CrossRef]
- Johnson, D.P.; Stanforth, A.; Lulla, V.; Luber, G. Developing an applied extreme heat vulnerability index utilizing socioeconomic and environmental data. Appl. Geogr. 2012, 35, 23–31. [Google Scholar] [CrossRef]
- Johnson, D.P.; Wilson, J.S.; Luber, G.C. Socioeconomic indicators of heat-related health risk supplemented with remotely sensed data. Int. J. Health Geogr. 2009, 8, 57. [Google Scholar] [CrossRef] [PubMed]
- Maier, G.; Grundstein, A.; Jang, W.; Li, C.; Naeher, L.P.; Shepherd, M. Assessing the performance of a vulnerability index during oppressive heat across Georgia, United States. Weather Clim. Soc. 2014, 6, 253–263. [Google Scholar] [CrossRef]
- Reid, C.E.; O’Neill, M.S.; Gronlund, C.J.; Brines, S.J.; Brown, D.G.; Diez-Roux, A.V.; Schwartz, J. Mapping community determinants of heat vulnerability. Environ. Health Perspect. 2009, 117, 1730–1736. [Google Scholar] [CrossRef] [PubMed]
- Hess, J.J.; Malilay, J.N.; Parkinson, A.J. Climate change: The importance of place. Am. J. Prev. Med. 2008, 35, 468–478. [Google Scholar] [CrossRef] [PubMed]
- Luber, G.; McGeehin, M. Climate change and extreme heat events. Am. J. Prev. Med. 2008, 35, 429–435. [Google Scholar] [CrossRef] [PubMed]
- Ebi, K.L.; Helmer, M.; Vainio, J. The health impacts of climate change: Getting started on a new theme. Prehospital Disaster Med. 2008, 23, s60–s64. [Google Scholar] [CrossRef] [PubMed]
- De Sherbinin, A. Climate change hotspots mapping: What have we learned? Clim. Chang. 2014, 123, 23–37. [Google Scholar] [CrossRef]
- English, P.B.; Sinclair, A.H.; Ross, Z.; Anderson, H.; Boothe, V.; Davis, C.; Ebi, K.; Kagey, B.; Malecki, K.; Shultz, R.; et al. Environmental health indicators of climate change for the United States: Findings from the State Environmental Health Indicator Collaborative. Environ. Health Perspect. 2009, 117, 1673–1681. [Google Scholar] [CrossRef]
- U.S. Environmental Protection Agency. Mapping the Vulnerability of Human Health to Extreme Heat in the United States; U.S. Environmental Protection Agency (USEPA): Washington, DC, USA, 2018.
- Tricco, A.C.; Lillie, E.; Zarin, W.; O’Brien, K.K.; Colquhoun, H.; Levac, D.; Moher, D.; Peters, M.D.J.; Horsley, T.; Weeks, L.; et al. PRISMA Extension for Scoping Reviews (PRISMA-ScR): Checklist and Explanation. Ann. Intern. Med. 2018, 169, 467–473. [Google Scholar] [CrossRef]
- Braveman, P.A.; Cubbin, C.; Egerter, S.; Williams, D.R.; Pamuk, E. Socioeconomic disparities in health in the United States: What the patterns tell us. Am. J. Public Health 2010, 100 (Suppl. S1), S186–S196. [Google Scholar] [CrossRef] [PubMed]
- Martin, L.G.; Schoeni, R.F.; Andreski, P.M. Trends in health of older adults in the United States: Past, present, future. Demography 2010, 47 (Suppl. S1), S17–S40. [Google Scholar] [CrossRef] [PubMed]
- Aubrecht, C.; Ozceylan, D. Identification of heat risk patterns in the U.S. National Capital Region by integrating heat stress and related vulnerability. Environ. Int. 2013, 56, 65–77. [Google Scholar] [CrossRef] [PubMed]
- Boumans, R.J.M.; Phillips, D.L.; Victery, W.; Fontaine, T.D. Developing a model for effects of climate change on human health and health–environment interactions: Heat stress in Austin, Texas. Urban Clim. 2014, 8, 78–99. [Google Scholar] [CrossRef]
- Bradford, K.; Abrahams, L.; Hegglin, M.; Klima, K. A Heat Vulnerability Index and Adaptation Solutions for Pittsburgh, Pennsylvania. Environ. Sci. Technol. 2015, 49, 11303–11311. [Google Scholar] [CrossRef] [PubMed]
- Burton, C.; Cutter, S.L. Levee failures and social vulnerability in the Sacramento-San Joaquin Delta area, California. Nat. Hazards Rev. 2008, 9, 136–149. [Google Scholar] [CrossRef]
- Chow, W.T.L.; Chuang, W.-C.; Gober, P. Vulnerability to extreme heat in metropolitan Phoenix: Spatial, temporal, and demographic dimensions. Prof. Geogr. 2012, 64, 286–302. [Google Scholar] [CrossRef]
- Chuang, W.C.; Gober, P. Predicting hospitalization for heat-related illness at the census-tract level: Accuracy of a generic heat vulnerability index in Phoenix, Arizona (USA). Environ. Health Perspect. 2015, 123, 606–612. [Google Scholar] [CrossRef]
- Cleckner, H.; Allen, T. Dasymetric mapping and spatial modeling of mosquito vector exposure, Chesapeake, Virginia, USA. Isprs Int. J. Geo. Inf. 2014, 3, 891–913. [Google Scholar] [CrossRef]
- Gaither, C.; Goodrick, S.; Murphy, B.; Poudyal, N. An exploratory spatial analysis of social vulnerability and smoke plume dispersion in the US South. Forests 2015, 6, 1397–1421. [Google Scholar] [CrossRef]
- Harlan, S.L.; Declet-Barreto, J.H.; Stefanov, W.L.; Petitti, D.B. Neighborhood effects on heat deaths: Social and environmental predictors of vulnerability in Maricopa County, Arizona. Environ. Health Perspect. 2013, 121, 197–204. [Google Scholar] [CrossRef] [PubMed]
- Hattis, D.; Ogneva-Himmelberger, Y.; Ratick, S. The spatial variability of heat-related mortality in Massachusetts. Appl. Geogr. 2012, 33, 45–52. [Google Scholar] [CrossRef]
- Heaton, M.J.; Sain, S.R.; Greasby, T.A.; Uejio, C.K.; Hayden, M.H.; Monaghan, A.J.; Boehnert, J.; Sampson, K.; Banerjee, D.; Nepal, V.; et al. Characterizing urban vulnerability to heat stress using a spatially varying coefficient model. Spat. Spatio Tempor. Epidemiol. 2014, 8, 23–33. [Google Scholar] [CrossRef] [PubMed]
- Holt, A.C.; Salkeld, D.J.; Fritz, C.L.; Tucker, J.R.; Gong, P. Spatial analysis of plague in California: Niche modeling predictions of the current distribution and potential response to climate change. Int. J. Health Geogr. 2009, 8, 38. [Google Scholar] [CrossRef]
- Hondula, D.M.; Davis, R.E.; Leisten, M.J.; Saha, M.V.; Veazey, L.M.; Wegner, C.R. Fine-scale spatial variability of heat-related mortality in Philadelphia County, USA, from 1983–2008: A case-series analysis. Environ. Health A Glob. Access Sci. Source 2012, 11, 16. [Google Scholar] [CrossRef] [PubMed]
- Hondula, D.M.; Davis, R.E.; Saha, M.V.; Wegner, C.R.; Veazey, L.M. Geographic dimensions of heat-related mortality in seven U.S. cities. Environ. Res. 2015, 138, 439–452. [Google Scholar] [CrossRef]
- Huang, G.; Zhou, W.; Cadenasso, M.L. Is everyone hot in the city? Spatial pattern of land surface temperatures, land cover and neighborhood socioeconomic characteristics in Baltimore, MD. J. Environ. Manag. 2011, 92, 1753–1759. [Google Scholar] [CrossRef]
- Johnson, D.P.; Webber, J.J.; Urs Beerval Ravichandra, K.; Lulla, V.; Stanforth, A.C. Spatiotemporal variations in heat-related health risk in three Midwestern US cities between 1990 and 2010. Geocarto Int. 2014, 29, 65–84. [Google Scholar] [CrossRef]
- Klein-Rosenthal, J.; Kinney, P.L.; Metzger, K.B. Intra-urban vulnerability to heat-related mortality in New York City, 1997–2006. Health Place 2014, 30, 45–60. [Google Scholar] [CrossRef]
- Kovach, M.M.; Konrad Ii, C.E.; Fuhrmann, C.M. Area-level risk factors for heat-related illness in rural and urban locations across North Carolina, USA. Appl. Geogr. 2015, 60, 175–183. [Google Scholar] [CrossRef]
- Liu, H.; Weng, Q. Enhancing temporal resolution of satellite imagery for public health studies: A case study of West Nile Virus outbreak in Los Angeles in 2007. Remote Sens. Environ. 2012, 117, 57–71. [Google Scholar] [CrossRef]
- Liu, H.; Behr, J.G.; Diaz, R. Population vulnerability to storm surge flooding in coastal Virginia, USA. Integr Environ. Assess. Manag. 2016, 12, 500–509. [Google Scholar] [CrossRef] [PubMed]
- Maantay, J.; Maroko, A.; Culp, G. Using Geographic Information Science to Estimate Vulnerable Urban Populations for Flood Hazard and Risk Assessment in New York City. In Geospatial Techniques in Urban Hazard and Disaster Analysis; Springer: Berlin/Heidelberg, Germany, 2009; pp. 71–97. [Google Scholar]
- Madrigano, J.; Ito, K.; Johnson, S.; Kinney, P.L.; Matte, T. A Case-Only Study of Vulnerability to Heat Wave-Related Mortality in New York City (2000–2011). Environ. Health Perspect. 2015, 123, 672–678. [Google Scholar] [CrossRef] [PubMed]
- Martinich, J.; Neumann, J.; Ludwig, L.; Jantarasami, L. Risks of sea level rise to disadvantaged communities in the United States. Mitig. Adapt. Strateg. Glob. Chang. 2013, 18, 169–185. [Google Scholar] [CrossRef]
- Mendez-Lazaro, P.; Muller-Karger, F.E.; Otis, D.; McCarthy, M.J.; Rodriguez, E. A heat vulnerability index to improve urban public health management in San Juan, Puerto Rico. Int. J. Biometeorol. 2018, 62, 709–722. [Google Scholar] [CrossRef] [PubMed]
- Prudent, N.; Houghton, A.; Luber, G. Assessing climate change and health vulnerability at the local level: Travis County, Texas. Disasters 2016, 40, 740–752. [Google Scholar] [CrossRef] [PubMed]
- Shriber, J.; Conlon, K.C.; Benedict, K.; McCotter, O.Z.; Bell, J.E. Assessment of Vulnerability to Coccidioidomycosis in Arizona and California. Int. J. Environ. Res. Public Health 2017, 14, 680. [Google Scholar] [CrossRef] [PubMed]
- Uejio, C.K.; Wilhelmi, O.V.; Golden, J.S.; Mills, D.M.; Gulino, S.P.; Samenow, J.P. Intra-urban societal vulnerability to extreme heat: The role of heat exposure and the built environment, socioeconomics, and neighborhood stability. Health Place 2011, 17, 498–507. [Google Scholar] [CrossRef]
- Wang, C.; Yarnal, B. The vulnerability of the elderly to hurricane hazards in Sarasota, Florida. Nat. Hazards 2012, 63, 349–373. [Google Scholar] [CrossRef]
- Weber, S.; Sadoff, N.; Zell, E.; de Sherbinin, A. Policy-relevant indicators for mapping the vulnerability of urban populations to extreme heat events: A case study of Philadelphia. Appl. Geogr. 2015, 63, 231–243. [Google Scholar] [CrossRef]
- Wilson, B.; Chakraborty, A. Mapping vulnerability to extreme heat events: Lessons from metropolitan Chicago. J. Environ. Plan. Manag. 2019, 62, 1065–1088. [Google Scholar] [CrossRef]
- Wisconsin Department of Health Services. Wisconsin Heat Vulnerability Index. 2014. Available online: https://www.dhs.wisconsin.gov/publications/p0/p00882.pdf (accessed on 15 November 2018).
- Zhang, F.; Lee, J.; Liang, S.; Shum, C.K. Cyanobacteria blooms and non-alcoholic liver disease: Evidence from a county level ecological study in the United States. Environ. Health A Glob. Access Sci. Source 2015, 14, 41. [Google Scholar] [CrossRef]
- Neumann, J.; Hudgens, D.; Herter, J.; Martinich, J. The economics of adaptation along developed coastlines. Wiley Interdiscip. Rev. Clim. Chang. 2011, 2, 89–98. [Google Scholar] [CrossRef]
- Neumann, J.E.; Hudgens, D.E.; Herter, J.; Martinich, J. Assessing sea-level rise impacts: A GIS-based framework and application to coastal New Jersey. Coast. Manag. 2010, 38, 433–455. [Google Scholar] [CrossRef]
- Bonham-Carter, G.F. Geographic Information Systems for Geoscientists: Modelling with GIS; Elsevier: Amsterdam, The Netherlands, 2014. [Google Scholar]
- Tsoukalas, L.H.; Uhrig, R.E. Fuzzy and Neural Approaches in Engineering; John Wiley & Sons, Inc.: Hoboken, NJ, USA, 1996. [Google Scholar]
- Zadeh, L.A. Fuzzy sets. Inf. Control 1965, 8, 338–353. [Google Scholar] [CrossRef]
- De Sherbinin, A.; Apotsos, A.; Chevrier, J. Mapping the future: Policy applications of climate vulnerability mapping in West Africa. Geogr. J. 2017, 183, 414–425. [Google Scholar] [CrossRef]
- Preston, B.L.; Yuen, E.J.; Westaway, R.M. Putting vulnerability to climate change on the map: A review of approaches, benefits, and risks. Sustain. Sci. 2011, 6, 177–202. [Google Scholar] [CrossRef]
- Elliott, P.; Wartenberg, D. Spatial epidemiology: Current approaches and future challenges. Environ. Health Perspect. 2004, 112, 998–1006. [Google Scholar] [CrossRef]
- Kok, M.T.J.; Lüdeke, M.K.B.; Sterzel, T.; Lucas, P.L.; Walter, C.; Janssen, P.; Soysa, I.D. Quantitative Analysis of Patterns of Vulnerability to Global Environmental Change; Netherlands Environmental Assessment Agency (PBL): Hague, The Netherlands, 2010; p. 92. [Google Scholar]


| Study | Location | Exposure | Measures of Exposure, Sensitivity, and Adaptive Capacity | Measure/Assessment of Health Vulnerability |
|---|---|---|---|---|
| Aubrecht and Özceylan (2013) [31] | Washington Metropolitan Area (National Capital Region) | High ambient temperature | Exposure (environmental) variables: GHCN (Global Historical Climatology Network); U.S. Geological Survey (USGS) National Land Cover Database 2006 Sensitivity and/or Adaptive Capacity variables: U.S. Census and the American Community Survey (ACS) and U.S. Geological Survey (USGS) National Land Cover Database |
|
| Boumans et al. (2014) [32] | Travis County, Texas | High ambient temperature | Exposure (environmental) variables: U.S. Geological Survey (USGS) National Land Cover Database 2001; Bjerknes Centre for Climate Research-Bergen Climate Model Version 2 Sensitivity and/or Adaptive Capacity variables: U.S. Census |
|
| Bradford et al. (2015) [33] | Pittsburg, Pennsylvania | High ambient temperature | Exposure (environmental) variables: U.S. Geological Survey (USGS) National Land Cover Database Sensitivity and/or Adaptive Capacity variables: U.S. American Community Survey (2008–2012); Behavioral Risk Factor Surveillance System; Allegheny County Tax Property Office |
|
| Burton and Cutter (2008) [34] | The Sacramento - San Joaquin Delta | Flood hazard | Exposure (environmental) variables: FEMA’s Hazus MH 2 flood model Sensitivity and/or Adaptive Capacity variables: U.S. Census and the American Community Survey (ACS) |
|
| Chow et al. (2012) [35] | Phoenix, Arizona | High ambient temperature | Exposure (environmental) variables: Temperature data from 37 local meteorological stations. Landsat ETM+ data Sociodemographic variables: U.S. Census |
|
| Chuang and Gober (2015) [36] | Phoenix, Arizona | High ambient temperature | Exposure (environmental) variables: NASA Land Processes Distributed Active Archive Center Sensitivity and/or Adaptive Capacity variables: Arizona Department of Health Services’ hospital discharge databases for 2004 and 2005; U.S. Census; Maricopa County Assessor’s Office |
|
| Cleckner and Allen (2014) [37] | Chesapeake, Virginia | Vector-borne disease | Exposure (environmental) variables: NOAA’s Coastal Change Analysis Program; Mosquito abundance values (Sutherest et al. 2004, Cleckner et al. 2011) Sensitivity and/or Adaptive Capacity variables: U.S. Census; City of Chesapeake IT Department |
|
| Gaither et al. (2015) [38] | Southern, US (13 States) | Wildfires | Exposure (environmental) variables: NOAA’s Hazard Mapping System (HMS); Southern Forest Futures Assessment and Climate Change Adaptation and Mitigation Management Options Sensitivity and/or Adaptive Capacity variables: U.S. Census |
|
| Harlan et al. (2013) [39] | Maricopa County, Arizona | High ambient temperature | Exposure (environmental) variables: Landsat ETM+ data—NASA Sensitivity and/or Adaptive Capacity variables: U.S. Census; Tax Assessor’s 2010 parcel registry; Maricopa County Department of Public Health |
|
| Hattis et al. (2012) [40] | Massachusetts | High ambient temperature | Exposure (environmental) variables: NOAA’s National Climate Data Center Sensitivity and/or Adaptive Capacity variables: U.S. Census; Massachusetts Department of Public Health’s Registry of Vital Records and Statistics |
|
| Heaton et al. (2014) [41] | Houston, Texas | High ambient temperature | Exposure (environmental) variables: Noah LSM—High Resolution Land Data Assimilation System Sensitivity and/or Adaptive Capacity variables: U.S. Census; Texas Department of State Health Services; Harris County Appraisal District |
|
| Holt et al. (2009) [42] | California | Vector-borne disease | Exposure (environmental) variables: California Department of Health and the United States Department of Agriculture/Wildlife Services; Worldclim bioclimatic variables Sensitivity and/or Adaptive Capacity variables: California Department of Public Health |
|
| Hondula et al. (2012) [43] | Philadelphia County, Pennsylvania | High ambient temperature | Exposure (environmental) variables: Landsat ETM+ data—NASA; Zoning and Land Use data (PASDA) Sensitivity and/or Adaptive Capacity variables: U.S. Census; NHGIS (National Historical Geographic Information System) |
|
| Hondula et al. (2015) [44] | Atlanta, Boston, Minneapolis-St. Paul, Philadelphia, Phoenix, Seattle, St. Louis | High ambient temperature | Exposure (environmental) variables: NOAA National Climatic Data Center; U.S. Geological Survey (USGS) National Land Cover Database Sensitivity and/or Adaptive Capacity variables: U.S. Census; NHGIS (National Historical Geographic Information System) |
|
| Huang et al. (2011) [45] | Gwynns Falls Watershed, Baltimore Counties, Maryland | High ambient temperature | Exposure (environmental) variables: Landsat ETM+ data—NASA Sensitivity and/or Adaptive Capacity variables: U.S. Census; Applied Geographic Solution’s “CrimeRisk” database for total crime index |
|
| Johnson et al. (2009) [19] | Philadelphia, Pennsylvania | High ambient temperature | Exposure (environmental) variables: Landsat TM 5 data—NASA; U.S. Geological Survey (USGS) National Land Cover Database Sensitivity and/or Adaptive Capacity variables: U.S. Census; Pennsylvania Department of Health |
|
| Johnson et al. (2012) [18] | Chicago, Illinois | High ambient temperature | Exposure (environmental) variables: Landsat TM 5 data—NASA; U.S. Geological Survey (USGS) National Land Cover Database Sensitivity and/or Adaptive Capacity variables: U.S. Census; Illinois State Vital Records Department |
|
| Johnson et al. (2013) [46] | Chicago, Illinois; Dayton, Ohio; Indianapolis, Indiana | High ambient temperature | Exposure (environmental) variables: Landsat TM 5 data—NASA; U.S. Geological Survey (USGS) National Land Cover Database Sensitivity and/or Adaptive Capacity variables: U.S. Census; NASA’s Research Opportunities in Space and Earth Sciences (ROSES)—heat mortality |
|
| Klein-Rosenthal et al. (2014) [47] | New York, New York | High ambient temperature | Exposure (environmental) variables: Landsat 7 ETM—NASA; U.S. Forest Service Sensitivity and/or Adaptive Capacity variables: U.S. Census; NYC DOHMH Office of Vital Statistics; NYC Dept. of City Planning; NYC Dept. of Housing Preservation & Development; NYC Dept. of Finance |
|
| Kovach et al. (2015) [48] | North Carolina | High ambient temperature | Exposure (environmental) variables: USDA-NASS Cropland Data Layer; U.S. Geological Survey (USGS) National Land Cover Database Sensitivity and/or Adaptive Capacity variables: U.S. Census; North Carolina Disease Event Tracking and Epidemiologic Tool |
|
| Liu and Weng (2012) [49] | Los Angeles County, California | Vector-borne disease | Exposure (environmental) variables: NASA—Terra ASTER and MODIS; U.S. Geological Survey Digital Elevation Model Sensitivity and/or Adaptive Capacity variables: California Department of Public Health; UC Davis Center for Vector-borne Diseases; California Department of Food and Agriculture; Mosquito and Vector Control Association of California. |
|
| Liu et al. (2015) [50] | Gloucester, Isle of Wight, Matthews, and York Counties, Virginia | Flood hazard | Exposure (environmental) variables: U.S. Army Corps of Engineers SLOSH model; U.S. Geological Survey National Elevation Dataset (NED) Sensitivity and/or Adaptive Capacity variables: Household vulnerability survey (Random sample) |
|
| Maantay et al. (2010) [51] | New York, New York | Flood hazard | Exposure (environmental) variables: FEMA Q3 100-year floodplain Sensitivity and/or Adaptive Capacity variables: U.S. Census; NYS SPARCS FEMA Q3 100-year floodplain—flood hazard |
|
| Madrigano et al. (2015) [52] | New York, New York | High ambient temperature | Exposure (environmental) variables: NOAA—National Climatic Data Center; Landsat TB data—NASA Sensitivity and/or Adaptive Capacity variables: U.S. Census; NYC DOHMH Office of Vital Statistics; NYC Department of City Planning |
|
| Maier et al. (2014) [20] | Georgia | High ambient temperature | Exposure (environmental) variables: NOAA—National Climatic Data Center; Landsat TB data—NASA Sensitivity and/or Adaptive Capacity variables: U.S. Census; CDC Behavioral Risk Factor Surveillance System; University of Georgia Natural Resources Spatial Analysis Lab; National Center for Health Statistics |
|
| Manangan et al. (2014) [15] | Georgia | High ambient temperature | Exposure (environmental) variables: U.S. Geological Survey (USGS) National Land Cover Database; CDC National Environmental Health Tracking program Sensitivity and/or Adaptive Capacity variables: U.S. Census; Centers for Medicare and Medicaid Services; Homeland Security Infrastructure Program |
|
| Martinich et al. (2012) [53] | Coastline of continental United States | Flood hazard | Exposure (environmental) variables: Sea level rise, National Coastal Property Model—EPA Sensitivity and/or Adaptive Capacity variables: U.S. Census and the American Community Survey (ACS) |
|
| Méndez-Lázaro et al. (2018) [54] | San Juan, Puerto Rico | High ambient temperature | Exposure (environmental) variables: USGS Landsat 8 Operational Land Imager—Thermal Infrared Sensor Puerto Rico Terrestrial Gap Analysis Project—USDA Sensitivity and/or Adaptive Capacity variables: U.S. Census and the American Community Survey (ACS) |
|
| Prudent et al. (2016) [55] | Travis County, Texas | High ambient temperature & Flood Hazard | Exposure (environmental) variables: Landsat 5 & 7 ETM—NASA; Impervious surfaces—USGS; FEMA Q3 100-year floodplain; Low-water crossing—Austin, TX Watershed Department Sensitivity and/or Adaptive Capacity variables: U.S. Census; Texas Department of State Health Services |
|
| Reid et al. (2009) [21] | United States | High ambient temperature | Exposure (environmental) variables: U.S. Geological Survey (USGS) National Land Cover Database Sensitivity and/or Adaptive Capacity variables: U.S. Census; CDC Behavioral Risk Factor Surveillance System; American Housing Survey |
|
| Shriber et al. (2017) [56] | Arizona & California | Infectious micro-organism | Exposure (environmental) variables: Multi-Resolution Land Characteristics Consortium (2011); Skin Test (Edwards & Palmer 1957) Sensitivity and/or Adaptive Capacity variables: U.S. Census; CDC BRFSS; National Cancer Institute; American Hospital Association; HRSA Area Health Resource File |
|
| Uejio et al. (2011) [57] | Philadelphia, Pennsylvania and Phoenix, Arizona | High ambient temperature | Exposure (environmental) variables: NASA’s ASTER (Advanced Space-borne Thermal Emission and Reflection Radiometer) Sensitivity and/or Adaptive Capacity variables: U.S. Census |
|
| Wang and Yarnal (2012) [58] | Sarasota, Florida | Flood hazard | Exposure (environmental) variables: U.S. Army Corps of Engineers SLOSH model; FEMA flood insurance rate maps Sensitivity and/or Adaptive Capacity variables: U.S. Census and the American Community Survey (ACS) |
|
| Weber et al. (2015) [59] | Philadelphia, Pennsylvania | High ambient temperature | Exposure (environmental) variables: NOAA National Climatic Data Center; NASA Moderate Resolution Imaging Spectroradiometer (MODIS) Sensitivity and/or Adaptive Capacity variables: U.S. Census |
|
| Wilson and Chakraborty (2018) [60] | Chicago, Illinois | High ambient temperature | Exposure (environmental) variables: NASA Moderate Resolution Imaging Spectroradiometer (MODIS) Sensitivity and/or Adaptive Capacity variables: U.S. Census; Neighborhood Change Database—Geolytics; |
|
| Wisconsin Department of Health Services (2014) [61] | Milwaukee, Wisconsin | High ambient temperature | Exposure (environmental) variables: Oregon State/ U.S. Geological Survey (USGS)—Parameter-elevation Regressions on Independent Slopes Model (PRISM) and National Land Cover Database; EPA Air Quality Index Sensitivity and/or Adaptive Capacity variables: U.S. Census; Wisconsin Department of Health Services; Milwaukee County Behavioral Health Division; Wisconsin Division Long Term Care |
|
| Zhang et al. (2015) [62] | United States | Infectious micro-organism | Exposure (environmental) variables: NASA The Medium Resolution Imaging Spectrometer (MERIS) Sensitivity and/or Adaptive Capacity variables: U.S. Census; CDC’s Wide-ranging Online Data for Epidemiologic Research |
|
© 2019 by the authors. Licensee MDPI, Basel, Switzerland. This article is an open access article distributed under the terms and conditions of the Creative Commons Attribution (CC BY) license (http://creativecommons.org/licenses/by/4.0/).
Share and Cite
Schmeltz, M.T.; Marcotullio, P.J. Examination of Human Health Impacts Due to Adverse Climate Events Through the Use of Vulnerability Mapping: A Scoping Review. Int. J. Environ. Res. Public Health 2019, 16, 3091. https://doi.org/10.3390/ijerph16173091
Schmeltz MT, Marcotullio PJ. Examination of Human Health Impacts Due to Adverse Climate Events Through the Use of Vulnerability Mapping: A Scoping Review. International Journal of Environmental Research and Public Health. 2019; 16(17):3091. https://doi.org/10.3390/ijerph16173091
Chicago/Turabian StyleSchmeltz, Michael T., and Peter J. Marcotullio. 2019. "Examination of Human Health Impacts Due to Adverse Climate Events Through the Use of Vulnerability Mapping: A Scoping Review" International Journal of Environmental Research and Public Health 16, no. 17: 3091. https://doi.org/10.3390/ijerph16173091
APA StyleSchmeltz, M. T., & Marcotullio, P. J. (2019). Examination of Human Health Impacts Due to Adverse Climate Events Through the Use of Vulnerability Mapping: A Scoping Review. International Journal of Environmental Research and Public Health, 16(17), 3091. https://doi.org/10.3390/ijerph16173091