1. Introduction
Soil salinization is a severe land degradation process which results in severe impairment to plant/crop growth and development, reducing agricultural productivity. The condition is usually found in arid, semi-arid regions, and along coastal soils, presenting serious risk to regional economies and the environment. Nearly 9.5 × 10
7 hectares of area worldwide are estimated to be salt-affected, which is more than 7% of the Earth’s continental surface [
1]. In addition, soil salinization is expected to increase as the human population increases and the industry develops in the future [
2]. Thus, it is very important to identify salt-affected areas and determine their composition, to enable remediation of saline and saline-sodic soils.
Due to the ability of remote sensing techniques, remote sensing has been widely used to identify salt-affected soil, map saline areas, and estimate salinity levels [
3]. Several studies have indicated that saline soils have distinctive spectral features in the near-infrared and shortwave-infrared regions. Taylor et al. [
4] studied spectral features of saline soils and found strong reflection peaks at 800 nm and absorption valleys at 980, 1170, 1450, and 1900 nm. Farifteh et al. [
5] recorded similar reflectance measurements for salt-affected soils. Their results showed significant correlations between soil EC and spectral measurements, indicating that similarity between sample spectra decreased as the salt concentration increased. Weng et al. [
6] quantitatively analyzed the relationship between spectral characteristics and salinity of saline soils, and found that for soil with high NaCl and MgCl
2 content, there was a negative correlation between salinity and spectral reflectance, from 1931 nm to 2123 nm, and a positive relationship from 2153 nm to 2254 nm. Nawar et al. [
7] took the differentiated and declustered spectral reflectance of saline soils in the El-Tina Plain, Egypt, as spectral parameters, and calculated the correlation coefficient between the difference index (DI), the normalized difference index (NDI), and the ratio index (RI) of the DI and NDI parameters and EC. The results showed that the first-order differential form of reflectance had the greatest correlation with EC at 1843 nm and 1918 nm, with an
R2 of 0.65. Moreira et al. [
8] amended soil to provide samples of a range of salinity using NaCl, MgCl
2, and CaCl
2. They measured the spectral features of the amended soil and found absorption bands of 1470, 1750, and 2200 nm, characteristic of salinity. Their study also showed the spectral reflectance decreased with the CaCl
2 and MgCl
2, while NaCl-amended soil showed a reverse trend.
Srivastava et al. [
9] developed robust reflectance spectral models for rapid assessment of soil salinity in the salt-affected areas of Indo-Gangetic plains of Haryana using VNIR (visible-near infrared) reflectance spectroscopy. The spectral models explained more than 80% of EC variability in EC, and additional salinity-related properties. Zhang et al. [
10] developed a soil salt content model using the fractional-order derivatives of field-measured spectral data paired with ground measurements. They found that there was a significant correlation between single band reflectance spectra and soil salt content. As the derivative order increased, reflectance values first increased, and then decreased, with a peak
R-value of 0.525 in the 1.2-order derivative.
Dehaan and Taylor [
11] used reflectance spectroscopy for recognition and classification of saline soil. The study related vegetation with irrigation-induced salinization, for characterizing and mapping the spatial distribution of salinization. Zhang et al. [
12] combined spectral technology with multivariant statistical analysis to determine the reflectance spectral features of saline soil. They constructed quantitative regression models that considered the eliminated influence from instrument errors and other external background factors. Yang et al. [
13] presented a similarity-based prediction approach to map soil salinity, and developed powerful environmental predictors for the Huanghe River Delta region in China. Their results showed that a similarity-based prediction approach was a viable alternative to other methods for mapping soil salinity, especially for mapping areas with limited observation data. Wang and Jia [
14] integrated multisensor remote sensing data with a field survey to analyze processes of soil salinization in a semi-arid area in China from 1979 to 2009. Their results showed that the area of salt-affected soils increased by 0.28% per year with remarkable acceleration increase. Wang et al. [
15] combined the arid fraction integrated index (AFII) and salinity index (SI), and developed an operational model to estimate the surface soil salt content. Their results indicate that the model can provide information on soil salinity with exponential relationships between soil salinity and the model with
R2 > 0.86 and RMSE < 6.86. Additional spectral analysis techniques, such as spectral mixture analysis, were also used to predict soil salinity [
16,
17,
18]. The statistical techniques of single variable linear regression, polynomial regression, principle component regression, partial least square regression (PLSR), artificial neural networks (ANN), and multiple adaptive regression splines (MARS), have also been used to recognize soils with different salinity levels, and illustrate the relationships between soil spectral reflectance and soil properties [
19,
20,
21,
22,
23,
24,
25].
Desiccation cracking of saline-sodic soils is a very common surface soil phenomenon after precipitation. Cracking during soil drying is controlled by physical properties, including soil suction, tensile stress, shear strength, tensile strength, and specific surface energy [
26,
27,
28,
29,
30,
31]. In most cases, these physical properties are dependent on clay content and clay species. Soil salinity also alters soil cracking properties to a great extent. After a series of studies on 32 saline-alkali soils, Smith et al. [
32] determined the relationship between the cation exchange capacity of the soils and their linear expansion coefficient (COLE), with a correlation coefficient up to 0.81. Ren et al. [
33,
34] extracted the textural features of crack patterns, and quantitatively analyzed the relationship between texture feature and salinity of saline-sodic soils. Zhang et al. [
35] conducted desiccation tests of saline-sodic soils in the laboratory to analyze the effects of NaCl content on their cracking behavior during water evaporation. They showed that as the NaCl content increased, the crack intensity factor value and the crack length decreased. Shokri et al. [
36] and Zhang et al. [
37] studied the effects of salt content on the diffuse double layer (DDL) of saline soils. They found that DDL plays a very important role in controlling the shrinking and cracking process of saline soils during drying. Since desiccation crack changes the surface conditions of saline-sodic soils in Songnen Plain, and further influences the radiative transfer process of spectral reflectance and the area scattering within the cracks, various crack conditions of soils with different salinity levels may, therefore, affect the spectral response of soils to a certain extent. In most laboratory studies, traditional spectral measurements are used to examine soil samples after grinding over 2 mm sieve, but rarely take into account the natural conditions of soil surface of saline-sodic soils which develop cracks during drying. In this study, laboratory cracking experiments were carried out in order to examine, characterize, and compare the spectral response of saline-sodic soils, with and without desiccation cracks, and then regression models were developed for prediction of their saline-sodic properties.
2. Materials and Methods
2.1. Study Sites
The Songnen Plain contains one of the three areas in the world with the largest area of saline-sodic soils. The main salt components of NaHCO
3 and Na
2CO
3 make the salt-affected soils in Songnen Plain saline-sodic in nature [
38]. The saline-sodic soils generally have a similar clay-loam texture, with the original mineral of quartz and feldspar, and secondary mineral of illite/smectite formation, which have the characteristic of forming cracks when drying [
39]. However, the cracking process usually occurred on the soil surface, since the saline soil layer at the depth of 20–80 cm is a typical columnar deposition, which has poor water infiltration properties and prevents downward movement of salt [
40,
41,
42,
43]. In this study, 17 soil samples were therefore obtained, from 0 to 20 cm. All the soil samples were collected using a spade within a very narrow area of Da’an City, Songnen Plain, west of Jilin Province, China (123°47’35’’ E to 123°59’55’’ E, 45°29’30’’ N to 45°36’26’’ N). The soil samples were air-dried (temperature of 25 °C, humidity of 35%), ground, passed through a 2 mm sieve, and then divided into three subsamples for independent analysis. The first subsamples were prepared for measurement of soil properties in the laboratory; the second subsamples were prepared as the cracked soil samples undergoing the desiccation cracking test for spectral collection; the third subsamples were completely dried in an oven, and prepared as the comparative soil samples (soil particle size of 2 mm) for spectral collection.
2.2. Soil Property Measurement
All chemical properties of the soil samples were analyzed in a laboratory. The main ions of interest, Na+, K+, Ca2+, Mg2+, Cl−, HCO3−, and CO32− were extracted using a water extract with a soil–water ratio of 1:5. The Na+ and K+ were measured using a flame photometer; Ca2+ and Mg2+ were analyzed using the EDTA complexometric titration method; Cl− was measured by the AgNO3 titration method; CO32− and HCO3− were measured using the double indicator neutralization method. The soil pH and EC were analyzed with the potentiostatic method and conductometry respectively, using soil suspensions with a soil–water ratio of 1:5. The particle size distributions of the soil samples were also determined using laser diffraction analysis method.
2.3. Desiccation Cracking Test
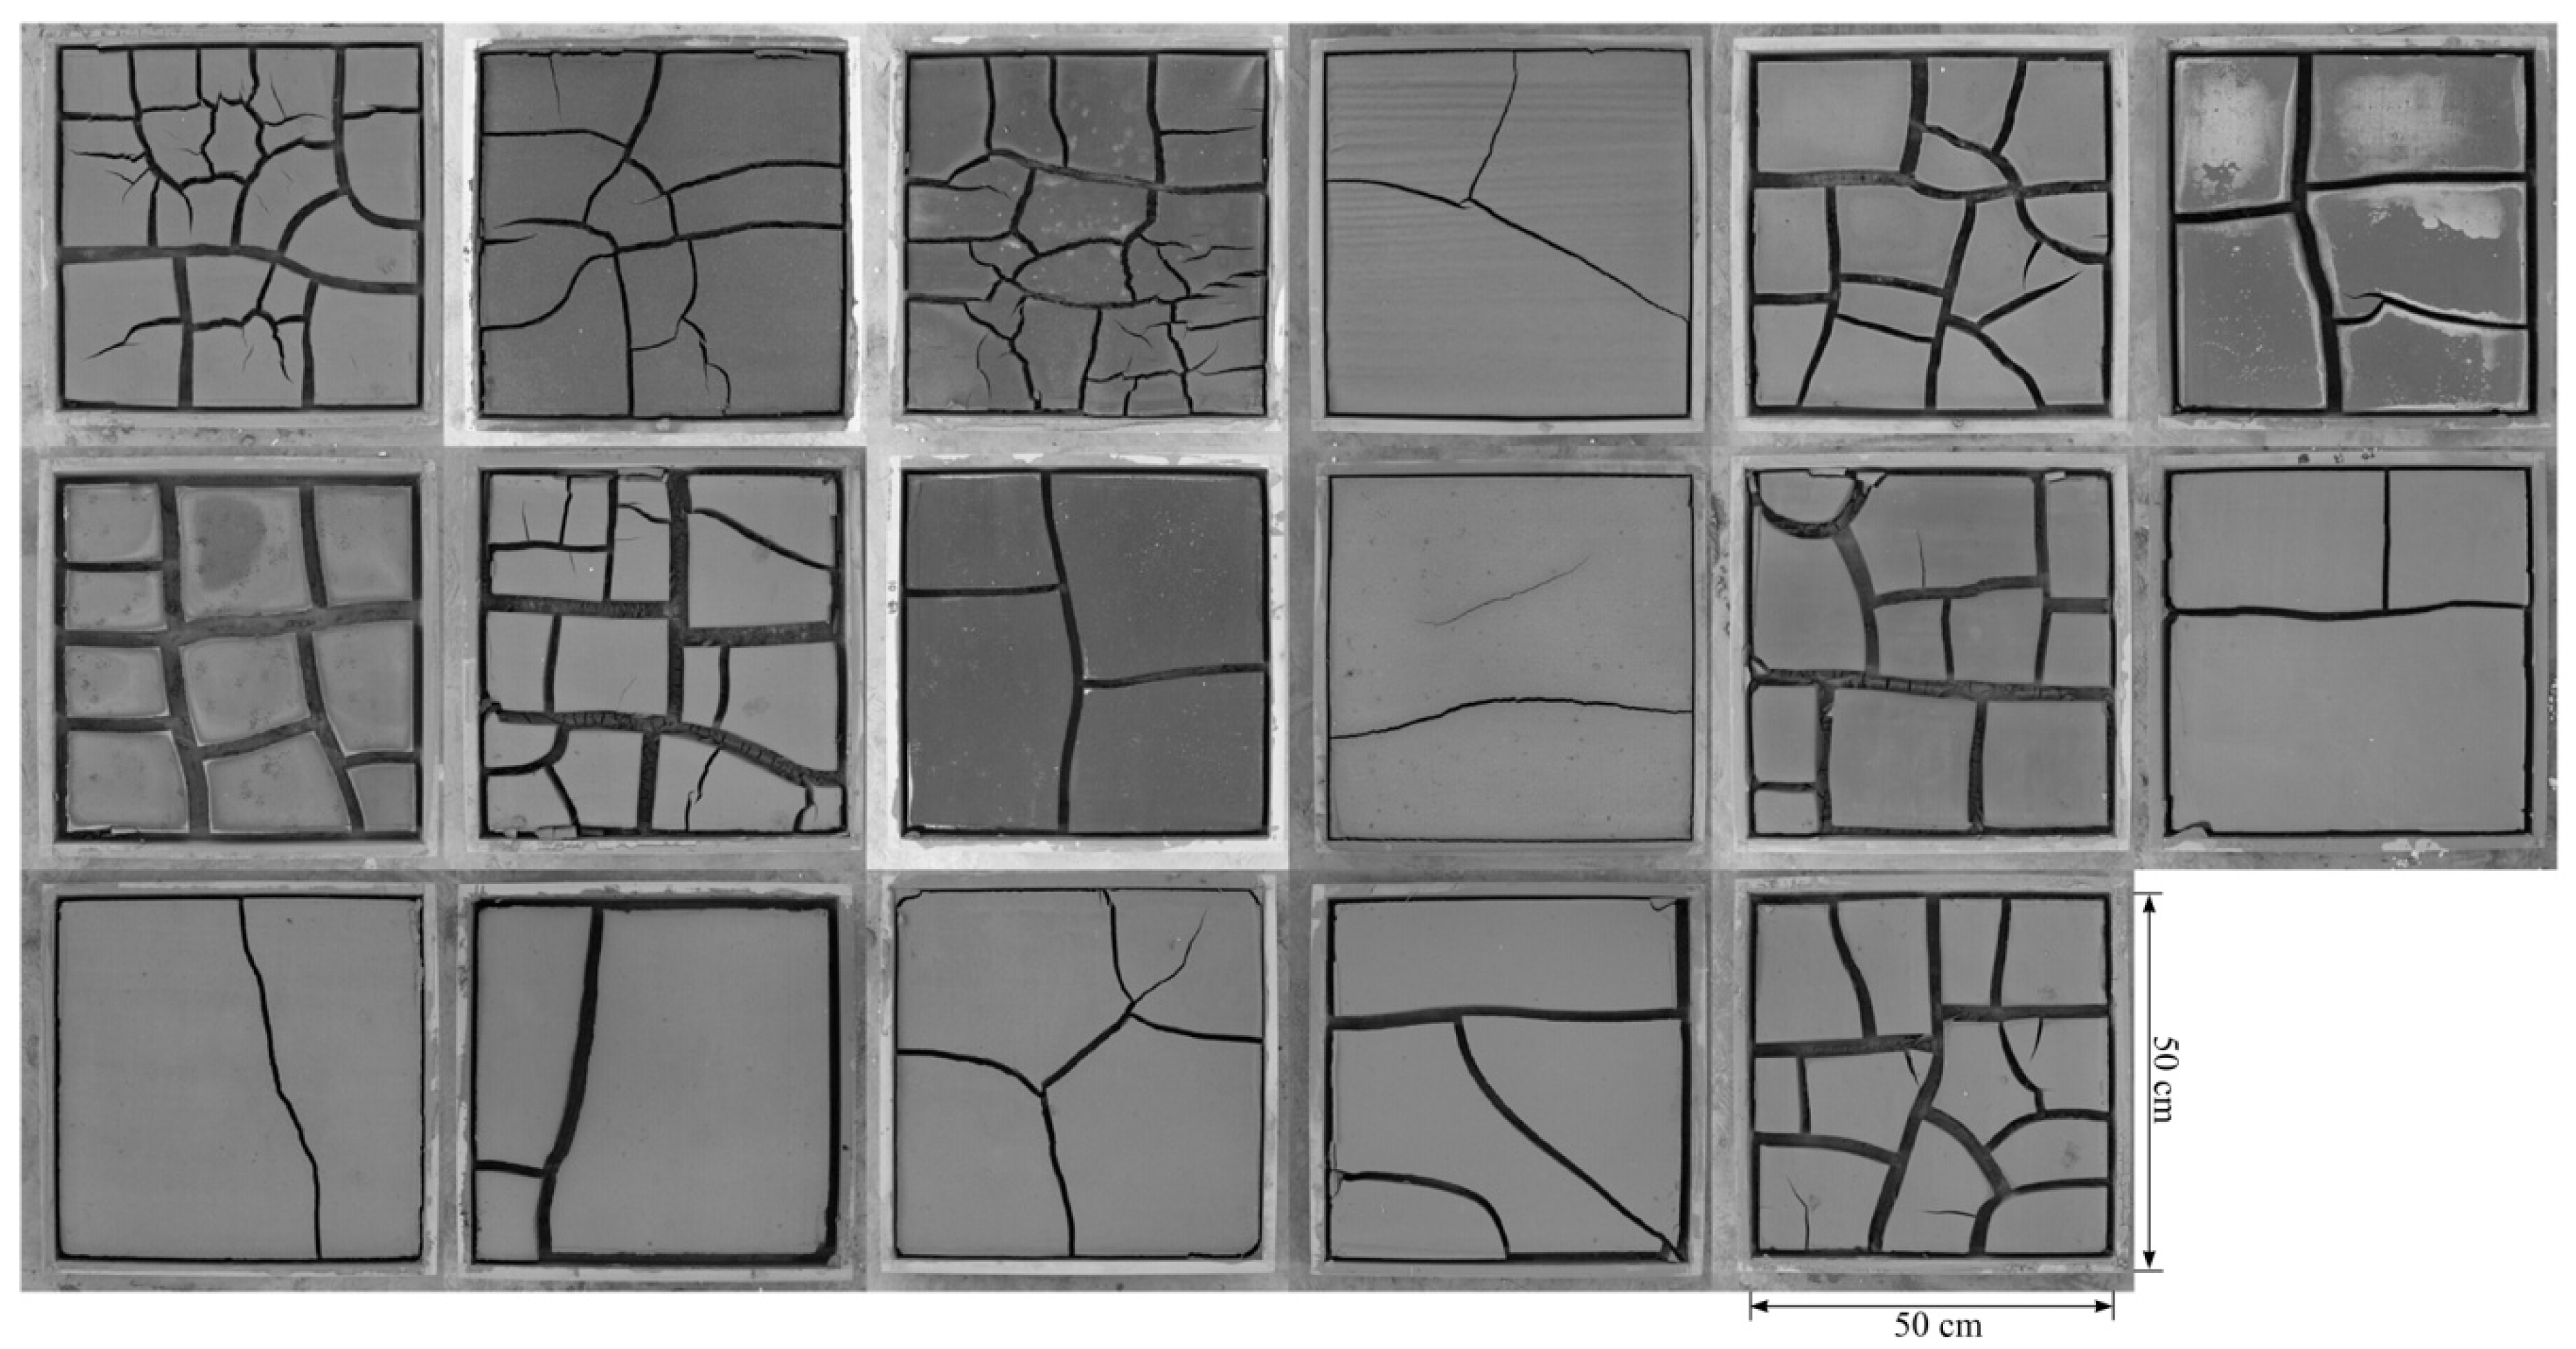
In order to produce crack patterns in the laboratory, saturated slurries were prepared with 80% gravimetric water content. The soils were slurried by hand-mixing, and were poured individually into a box with a size of 50 cm × 50 cm × 3 cm, and the surface was smoothed with a spatula. Afterwards, the soil samples were subjected to controlled laboratory conditions (temperature of 25 °C, humidity of 35% and pressure of 101 kPa) from 11 September 2014 to 3 October 2014, until the desiccation cracking process was completed (all weights of the samples stabilized,
Figure 1), and the final water content of all the cracked soil samples were then measured.
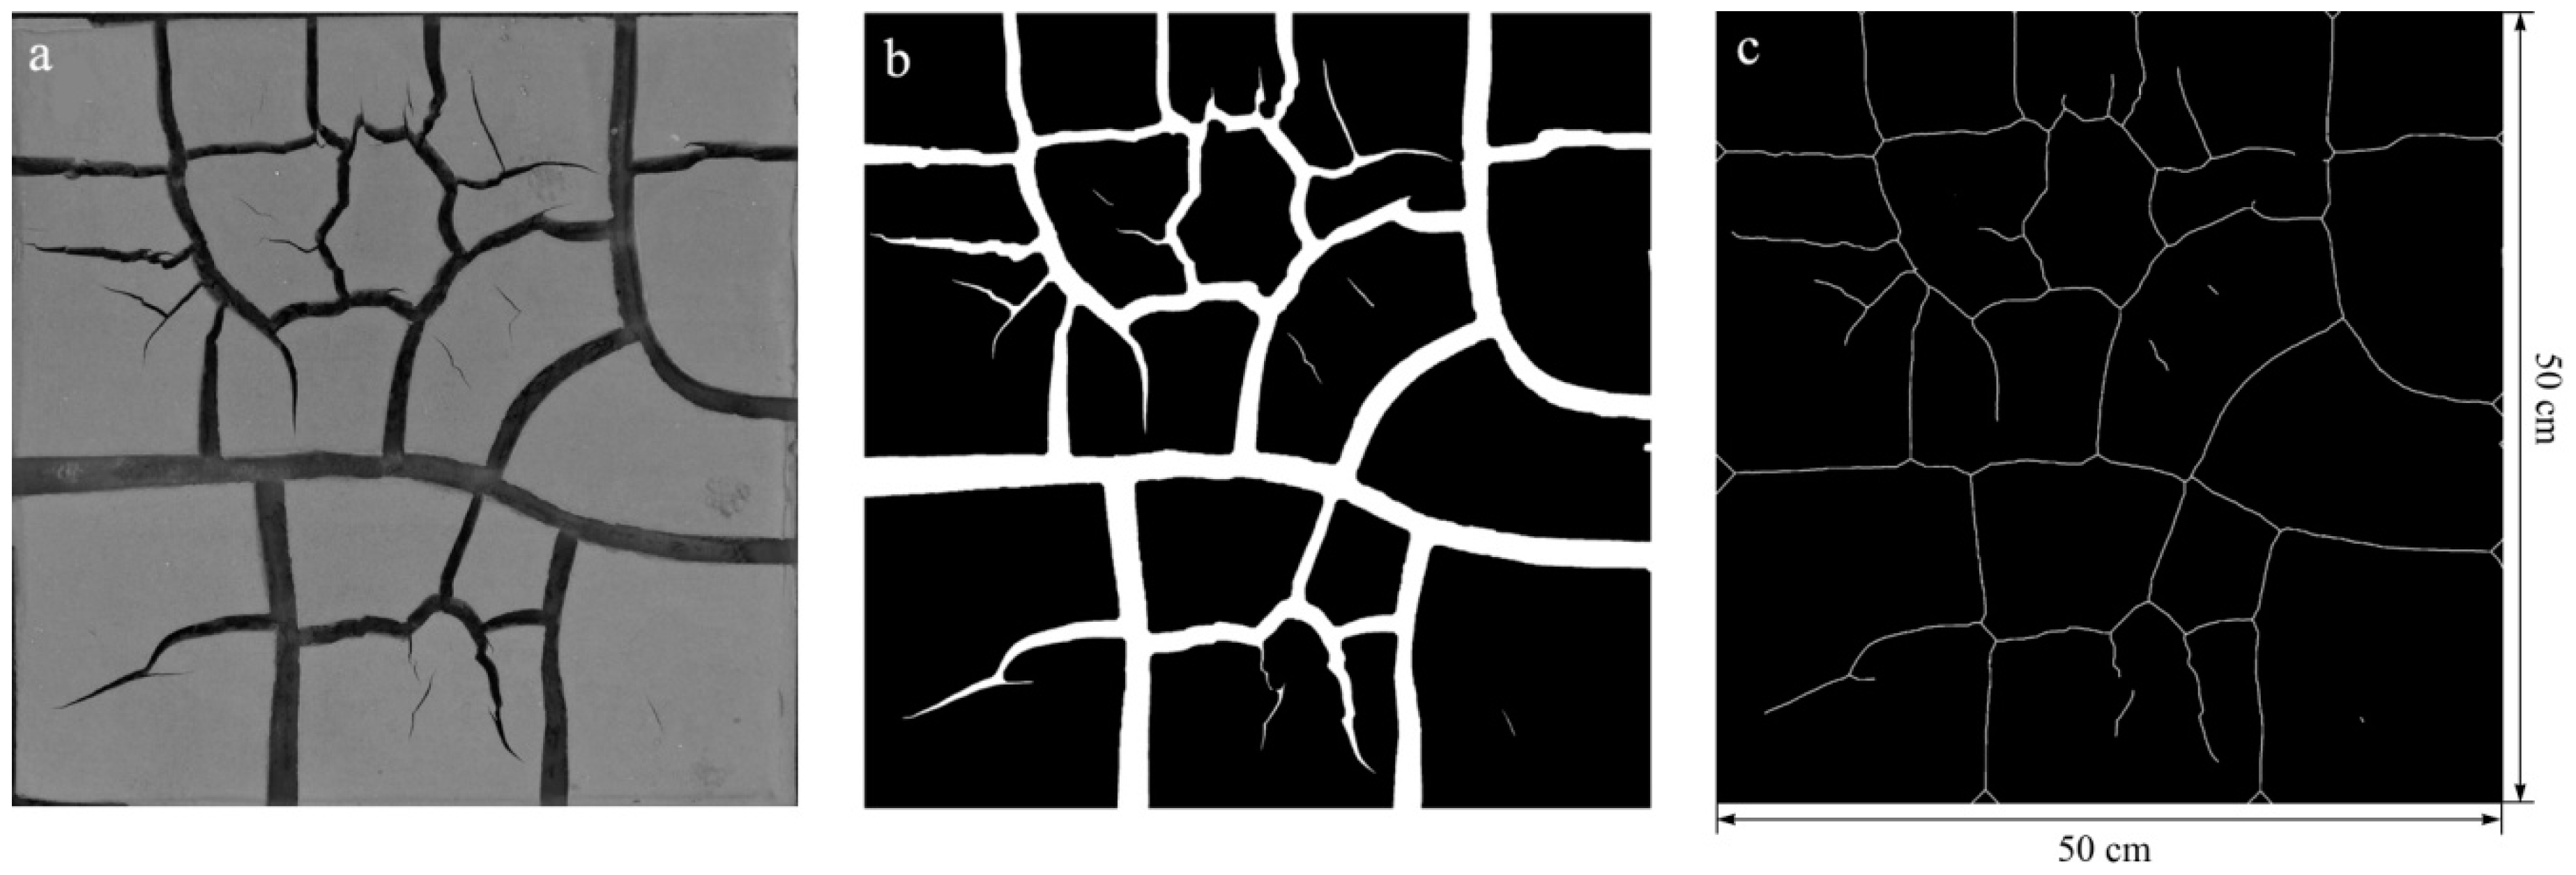
A digital camera was installed on a fixed experimental platform to determine the morphologies of the cracked soil samples, and a standard colorimetric plate was used to calibrate the white balance of the camera to reduce the effect of changes in the photographic environment. Digital image processing was then used to extract the characteristics of crack patterns, and the procedure is shown in
Figure 2. First, the color photo was cropped and converted to a grayscale image (
Figure 2a). Second, the grayscale image was segmented into cracks (white areas) and aggregates (black areas) using a gray threshold after binarization (
Figure 2b). Third, a skeletonization algorithm was utilized to repeatedly remove pixels from the boundaries of the cracks, until one-pixel-wide skeletons remained (
Figure 2c). After that, the crack length (CL) was determined by counting pixels based on the binary skeletons of the crack patterns, the crack area (CA) was extracted by computing the number of white pixels representing them, and the crack ratio (CR) was also calculated to quantify the cracking extent.
2.4. Spectral Measurements and Comparative Analysis
In order to obtain the spectral characteristics, an SVC HR-1024 hand-held spectrometer was used in this experiment. This spectrometer is sensitive to wavelengths between 350 and 2500 nm, and includes three separate detectors; the VNIR (350–1000 nm); the SWIR1 (short-wave infrared 1, 1000–1850 nm); and the SWIR2 (short-wave infrared 2, 1850–2500 nm). The sampling intervals were 1.5 nm with a spectral resolution of 3.5 nm, 3.6 nm with a spectral resolution of 6.5 nm, and 2.5 nm with a spectral resolution of 6.5 nm, for wavelengths 350–1000 nm, 1000–1850 nm, and 1850–2500 nm, respectively.
In this investigation, specific spectral measurements were based on both the cracked soil samples and the comparative soil samples. For the cracked soil samples, a fiber optic with a 25° field of view was held on a fixed platform 1 m above the ground (corresponding to a circle field with a diameter of 45 cm), a 50 cm × 50 cm rectangle region was then determined on the ground to make the center of this region coincide with the lens centerline projection of the fiber optic to ensure that both the zenith angle and the azimuth angle were same for all the cracked soil samples. After that, each cracked soil sample was placed in the rectangle region for spectral measurement. For the 2 mm comparative soil samples, a 4° field of view was chosen 20 cm vertically above the samples. Note that the comparative samples were put separately into the same aluminum boxes with an inner diameter of 10 cm and a depth of 2 cm. For each spectral measurement, 10 readings of spectral reflectance were taken, and the mean of all spectral reflectance was calculated as the actual reflectance of the sample, in order to average out the difference caused by instrument noise. A standard white panel was also measured before each measurement as calibration. In order to diminish the noise of the equipment and reduce the data dimensions, all the spectral reflectance of soil samples was resampled at 10 nm. The reflectance ranges of 1350–1420 nm, 1800–1920 nm, and 2360–2500 nm were cut off for all the spectral measurements, due to the effects of water absorption bands. Considering the sensitivity to the spectral variations and the background noise of reflectance, typical mathematical transformations of reflectance, including the square root (R1/2) and the logarithm (LgR), were computed in this study, and they were then treated together with reflectance as spectral parameters in this study. The spectral reflectance characteristics of soil samples with different crack extents were then analyzed and compared with that of the 2 mm comparative soil samples. Afterwards, the correlation coefficients between the Na+, salinity, pH, EC, and spectral parameters were computed through the whole bandwidth for all the cracked soil samples and the comparative soil samples.
4. Discussion
Table 4 shows the correlation coefficient matrix between the soil parameters of interest (Na
+, salinity, pH, and EC) in this investigation, and indicates that the salinity and EC increase with Na
+ concentration, since Na
+ was the main cation in these soils.
Table 5 provides the correlation coefficients between the main soil properties and crack parameters. The results showed that the correlations were high between CL and saline properties. At correlation coefficients greater than 0.52, the correlations between CA, CR, and soil properties were also quite high.
Table 5 also indicates that the soil salinity dominated the extent of cracking propagation (CL, CA, and CR) for the soils. This is because all soil samples were saturated, with a water content of 80% at the onset of the study, combined water films were formed, generally, due to the interaction soil colloidal particles and exchangeable cations (especially Na
+, with its large hydrolytic radius in this study) during the desiccation cracking process, and the thickness of the combined water films increase with soil salinity. The formed water films dispersed the cementation between the clays and increased the spacing of soil particles, resulting in reduced cohesive strength, which reflects the tensile strength between soil colloidal particles, and also reduced the internal friction angles between soil particles which reflect the soil shear strength [
44]. On the other hand, the salt solution among soil particles can be regarded as a lubricant, and further decreases the internal friction angles between soil particles [
45,
46].
Table 6 shows the gravimetric water content of cracked soil samples after air-drying, where the mean value of final water content was 2.04 %. This indicates that the slight effects of water absorption caused the overall reflectance of cracked soil samples to be lower than those comparative soil samples completely dried in an oven. However, the small variance of the final water content indicates the decrease of reflectance by water absorption was nearly equal for all the cracked soil samples, which means that soil water content was not the factor that caused variation in spectral response in this study.
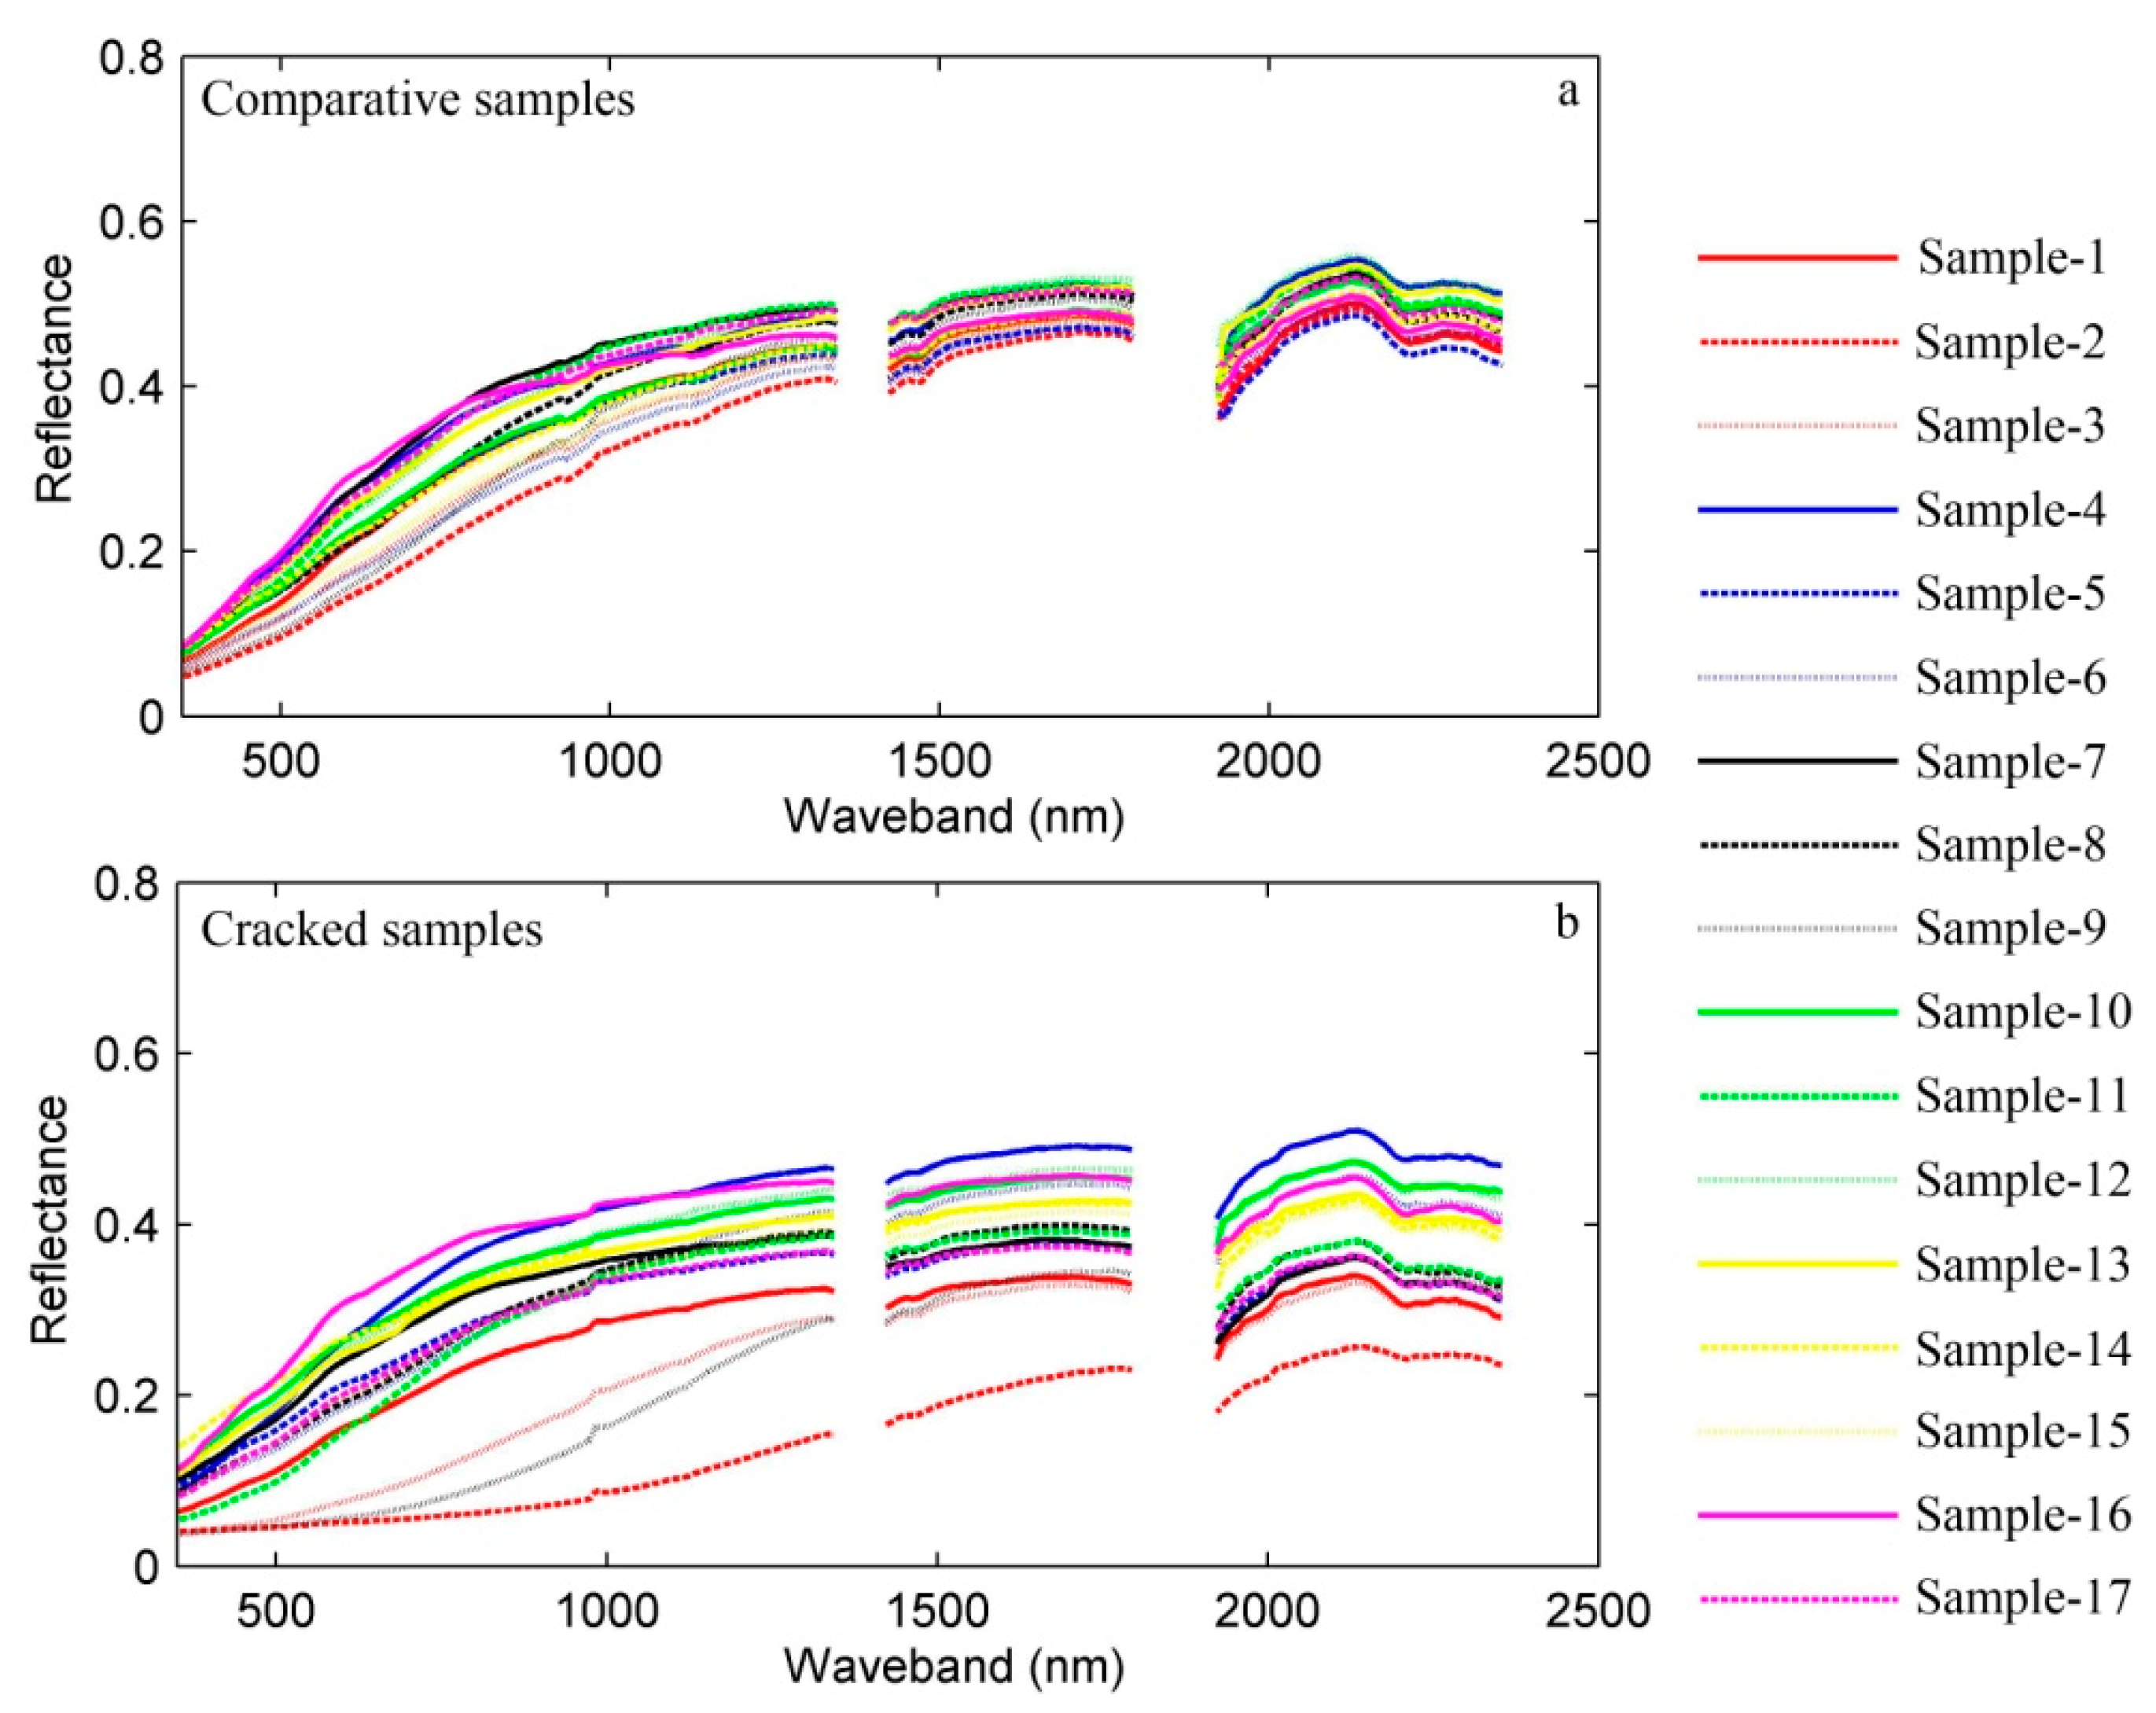
Figure 3 shows that the variations among reflectance curves of all the cracked soil samples were more apparent than those of the comparative soil samples. This is because the salt crystals present on cracked soil sample surfaces—after the drying process—varied, which means that the spectral response to these salt crystals were different among the cracked soil samples.
Table 5 indicates that soil salinity leads to an increase of crack extent. The area scattering on soil surface and volume scattering within crack regions strengthened with the increasing relative surface roughness and the complexity of surface morphology determined by the crack extent, which reduced the energy reflected to the spectrometer, and thus enhanced the spectral differences between different cracked soil samples. In addition, the area and volume scattering from the cracked soil samples were also reasons for their lower overall reflectance than the comparative soil samples.
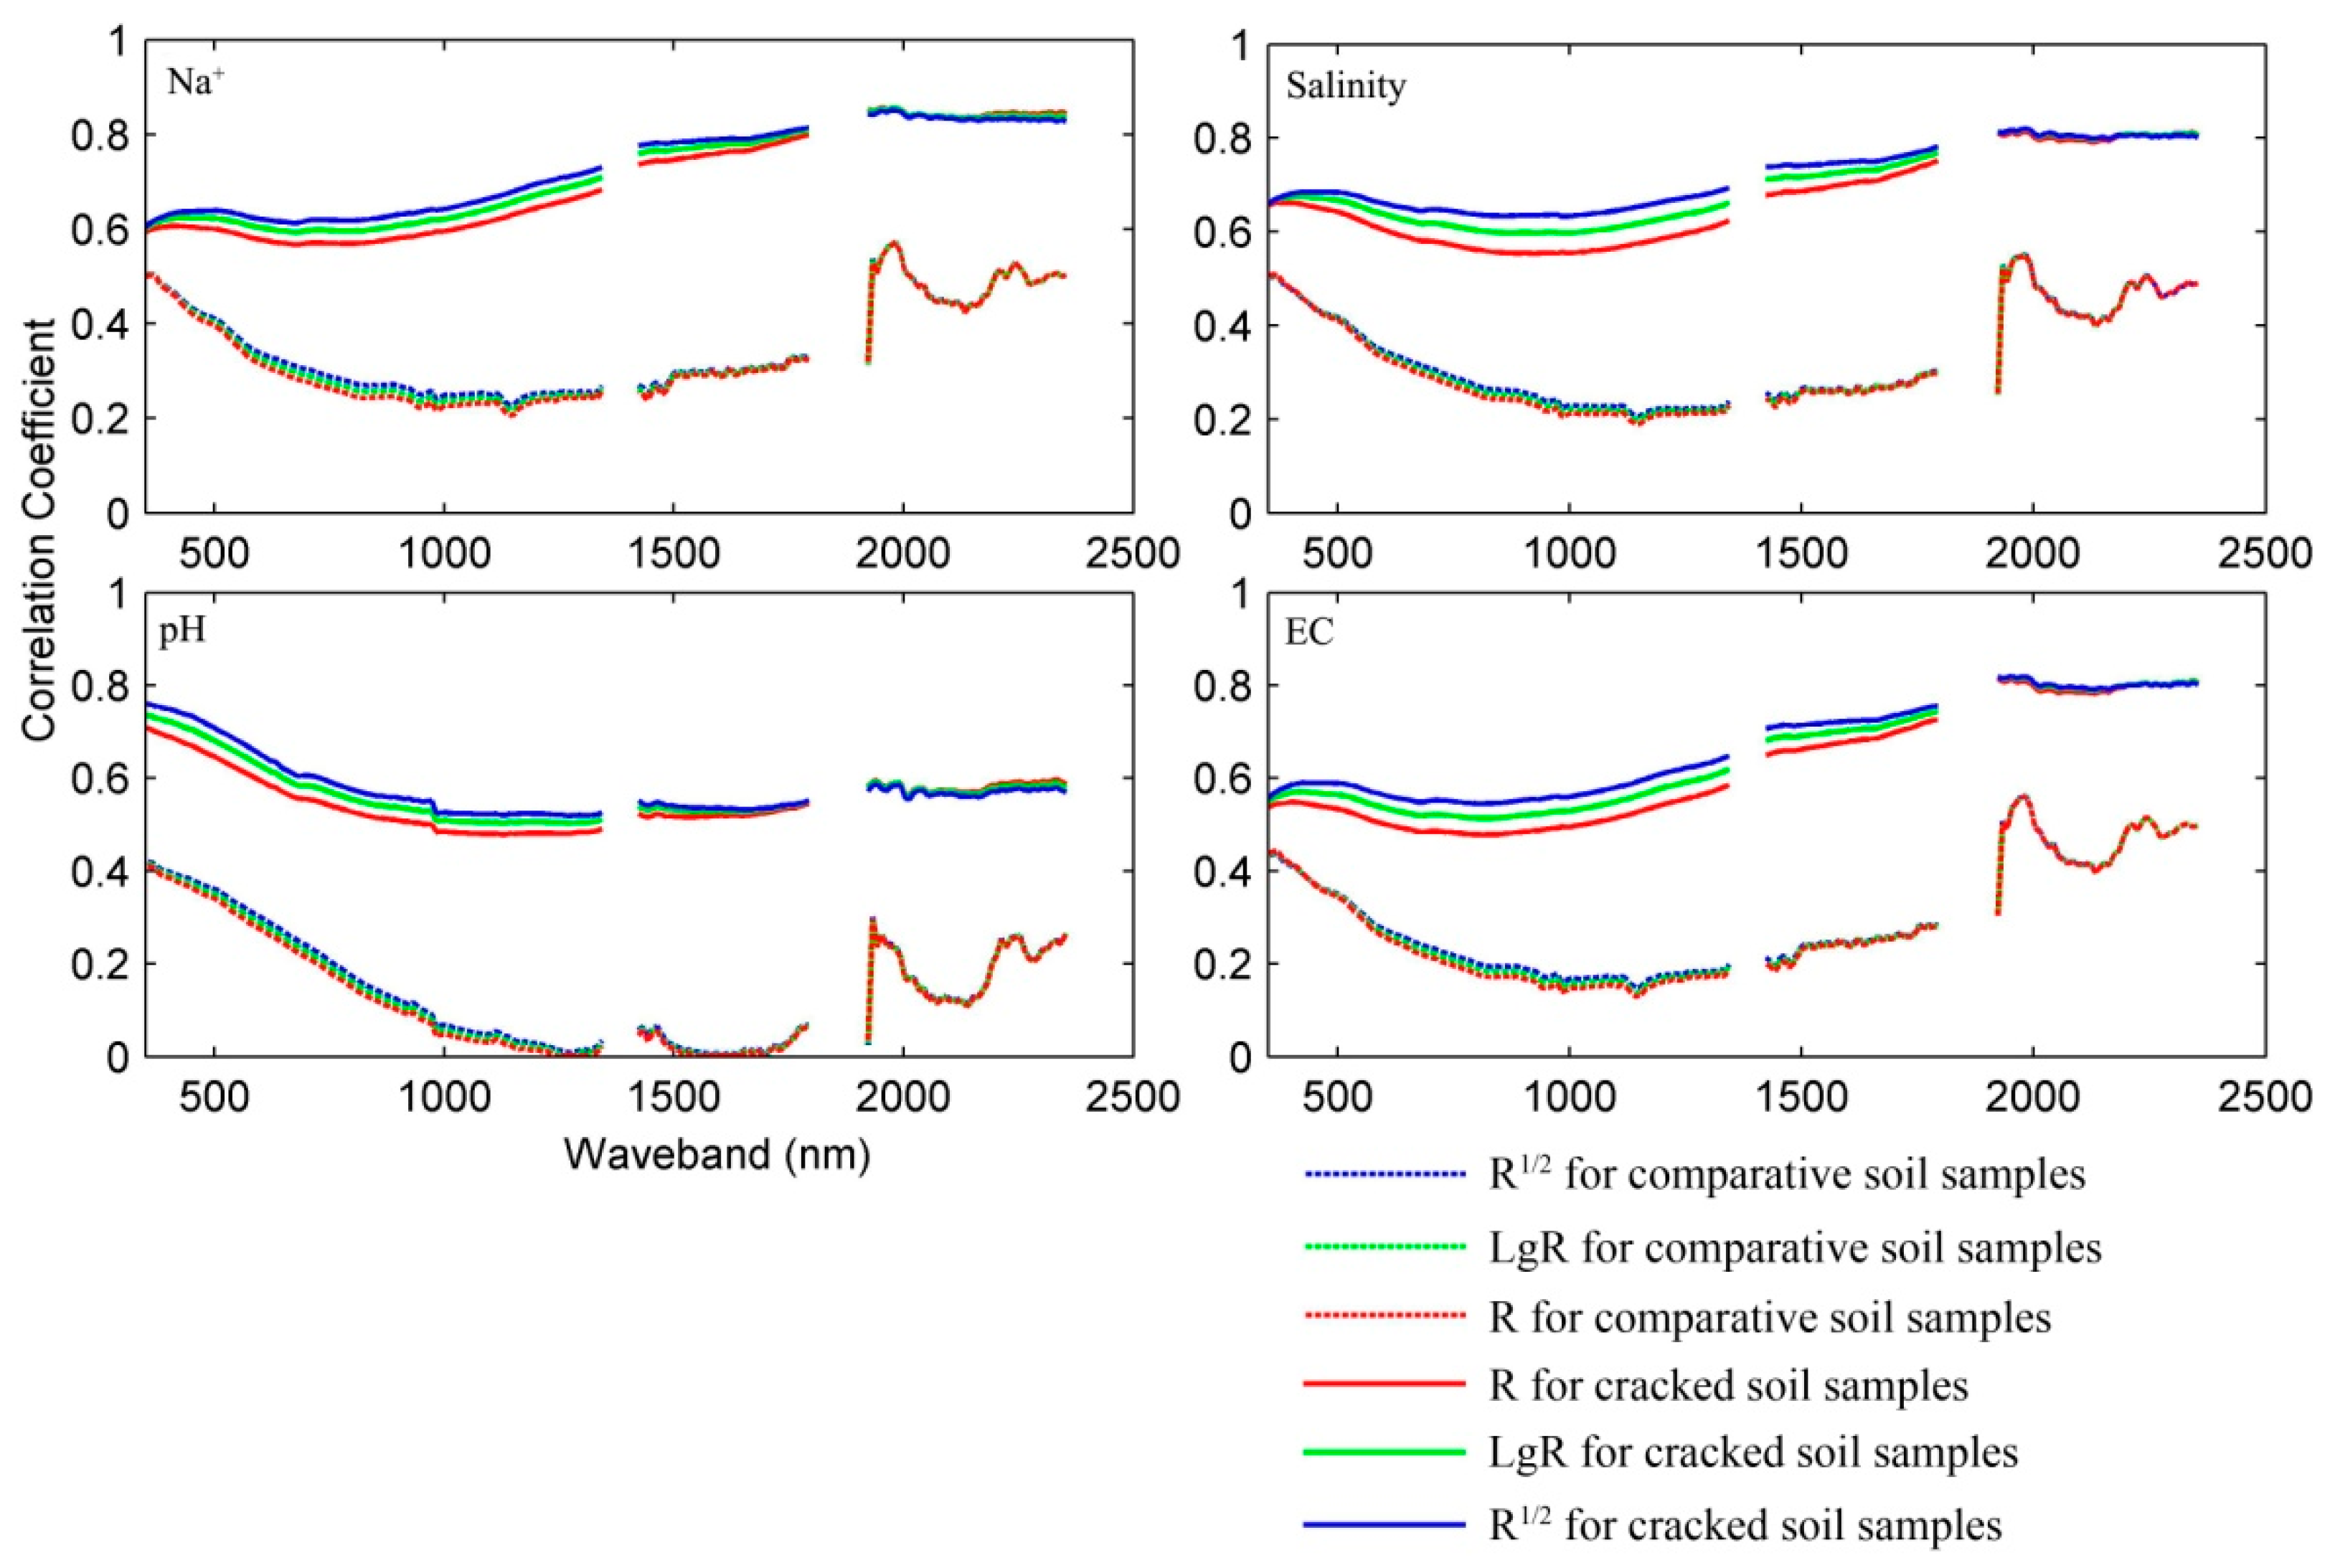
For the cracked soil samples, the correlation analysis results between spectral parameters and the main soil properties were better, and the spectral response were closer to the salt minerals compared with those of the comparative soil samples. This is because salt crystals formed at the surface and cracks of the cracked soil samples during desiccation, and that the salt crystal content increased with salinity. The spectral characteristics were, therefore, more apparent for the cracked soil samples than the comparative dried soil samples in near-infrared and shortwave-infrared regions above 1420 nm, which contain the most crucial information [
47,
48] for the salt minerals in this study. For pH, the relatively poor correlation analysis results are probably due to the incomplete hydrolysis of HCO
3− and CO
32−. Thus, the relationships between pH and spectral parameters were generally not significant above 1420 nm, but were more important in visible regions compared to Na
+, salinity, and EC.
In order to generate improved prediction of Na
+, salinity, pH, and EC, the optimum spectral parameter, the corresponding wavelength and the correlation coefficient (
R-value) for each soil property was extracted from the correlograms for spectral parameters of the cracked soil samples and the comparative soil samples.
Table 7 indicates the optimal
R-value derived from cracked soil samples is obviously higher than that derived from the comparative soil samples. For Na
+, salinity, and EC, the diagnostic wavelength was 1983 nm while, for pH, the diagnostic wavelength was 363 nm. The
R1/2 was selected as the optimal spectral parameter, since it enhanced small variations in spectral reflectance, and was less sensitive to the spectral variations of sunlight and skylight. Also,
R1/2 tended to eliminate background noise. The single-variable linear regression model for each soil property was, therefore, established and shown in
Figure 5, indicating good prediction of the soil properties of interest in this study.


