Antimicrobial Peptide Arenicin-1 Derivative Ar-1-(C/A) as Complement System Modulator

 , , , ,
  , ,
, , 

Abstract
1. Introduction
2. Results
3. Discussion
4. Materials and Methods
4.1. Arenicin Peptides
4.2. Serum and Erythrocytes
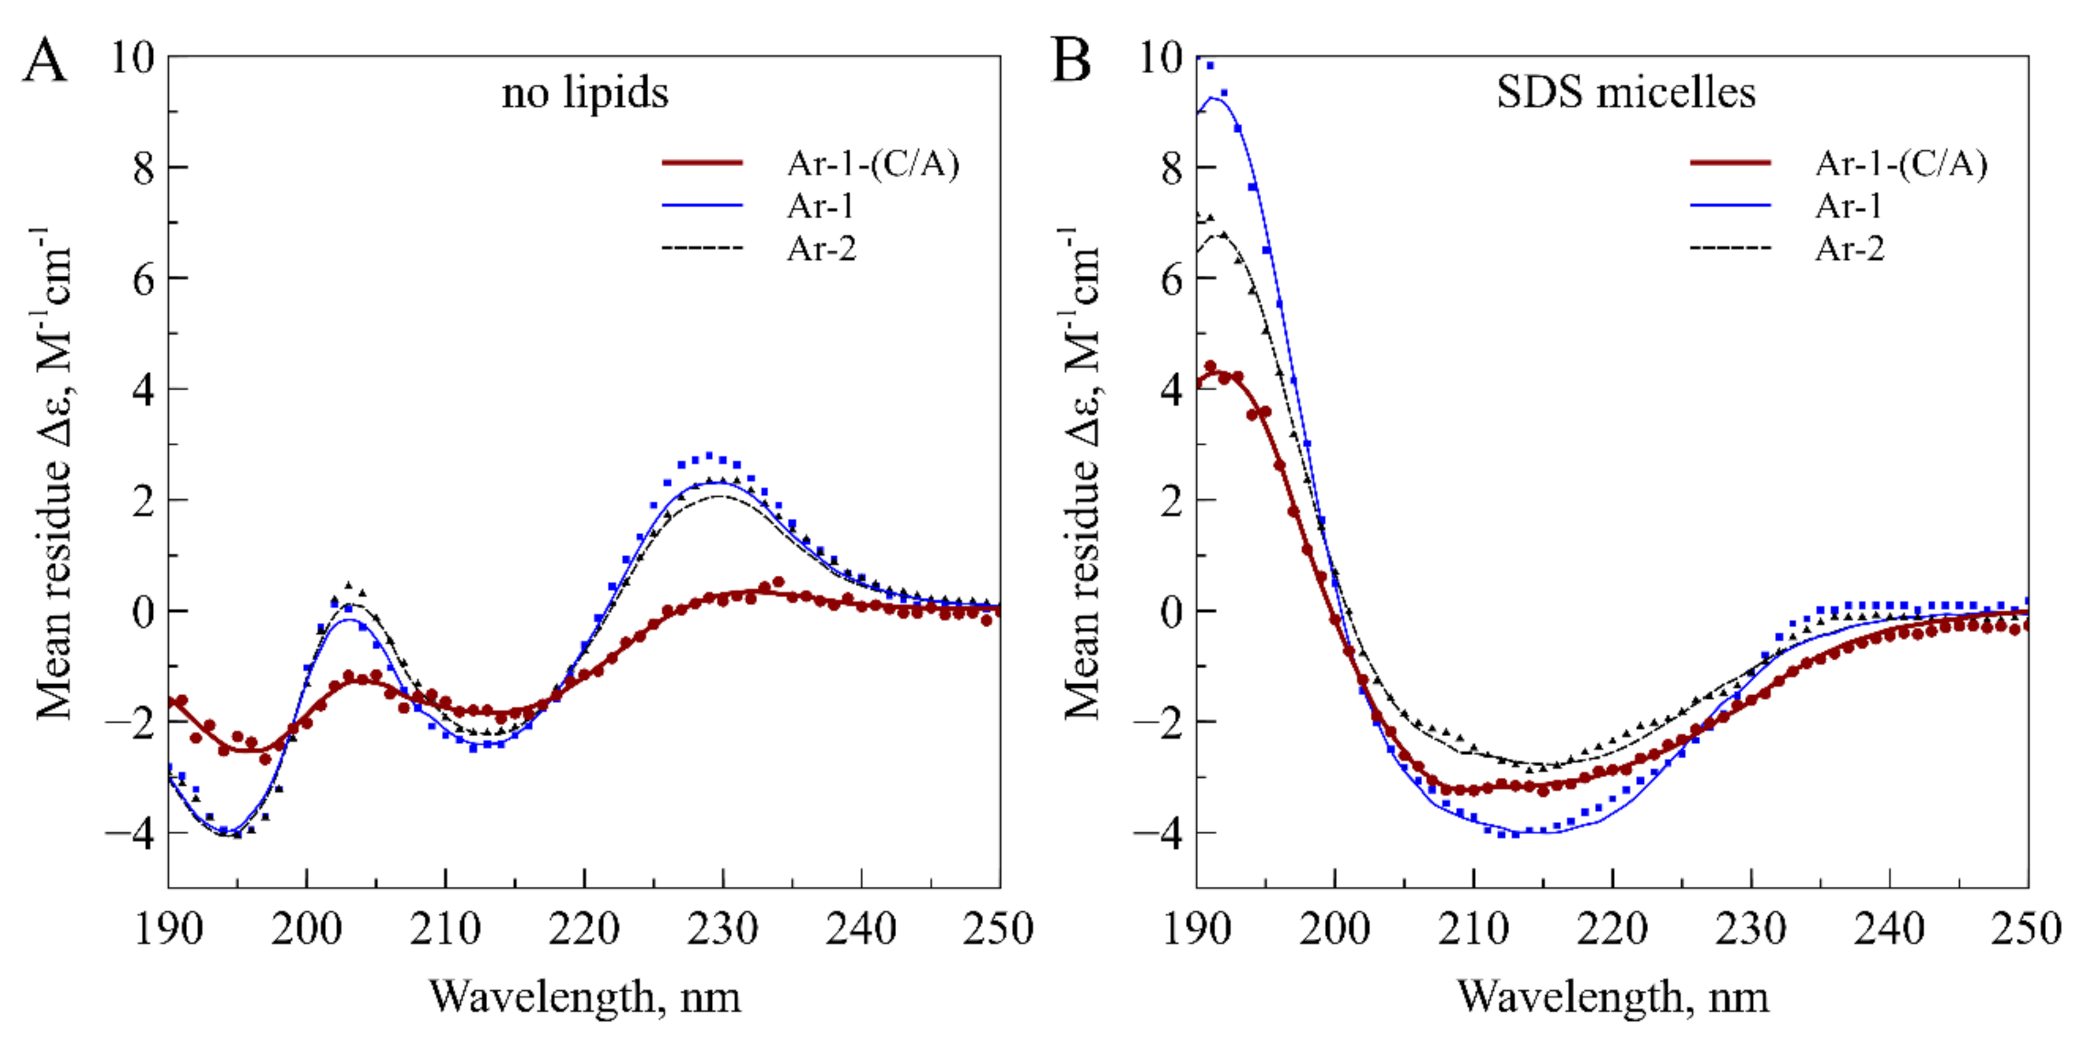
4.3. Circular Dichroism Spectroscopy
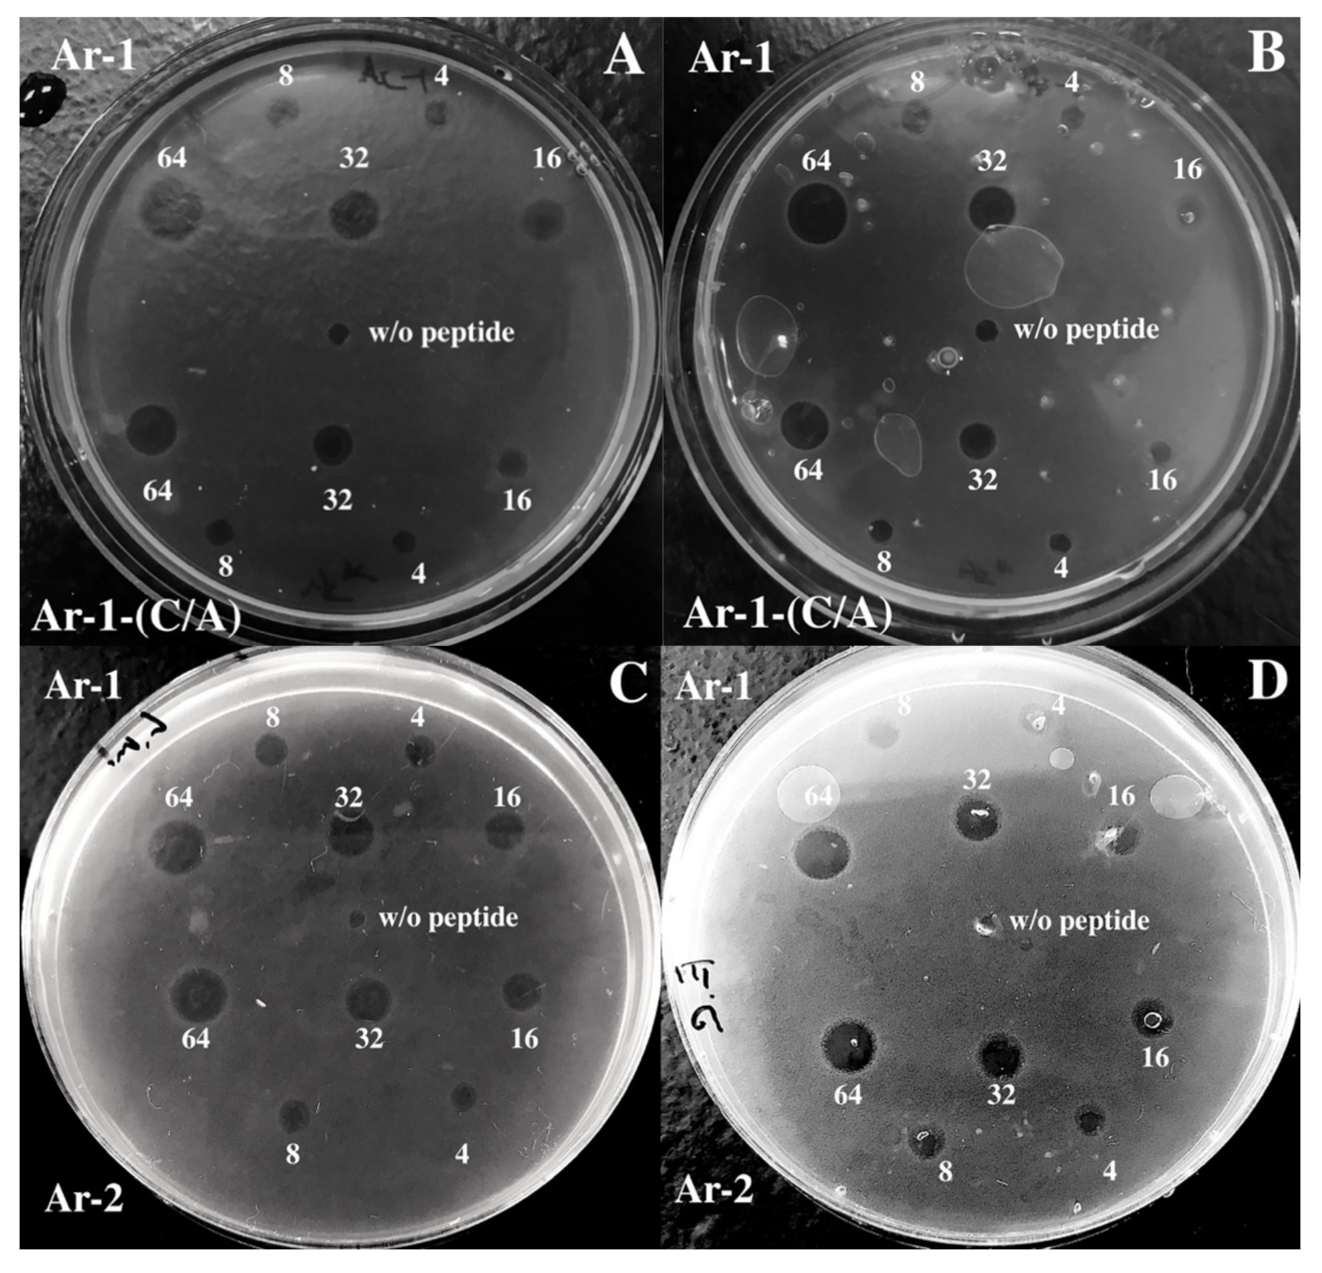
4.4. Antimicrobial Assay
4.5. Hemolytic Activity of Peptides
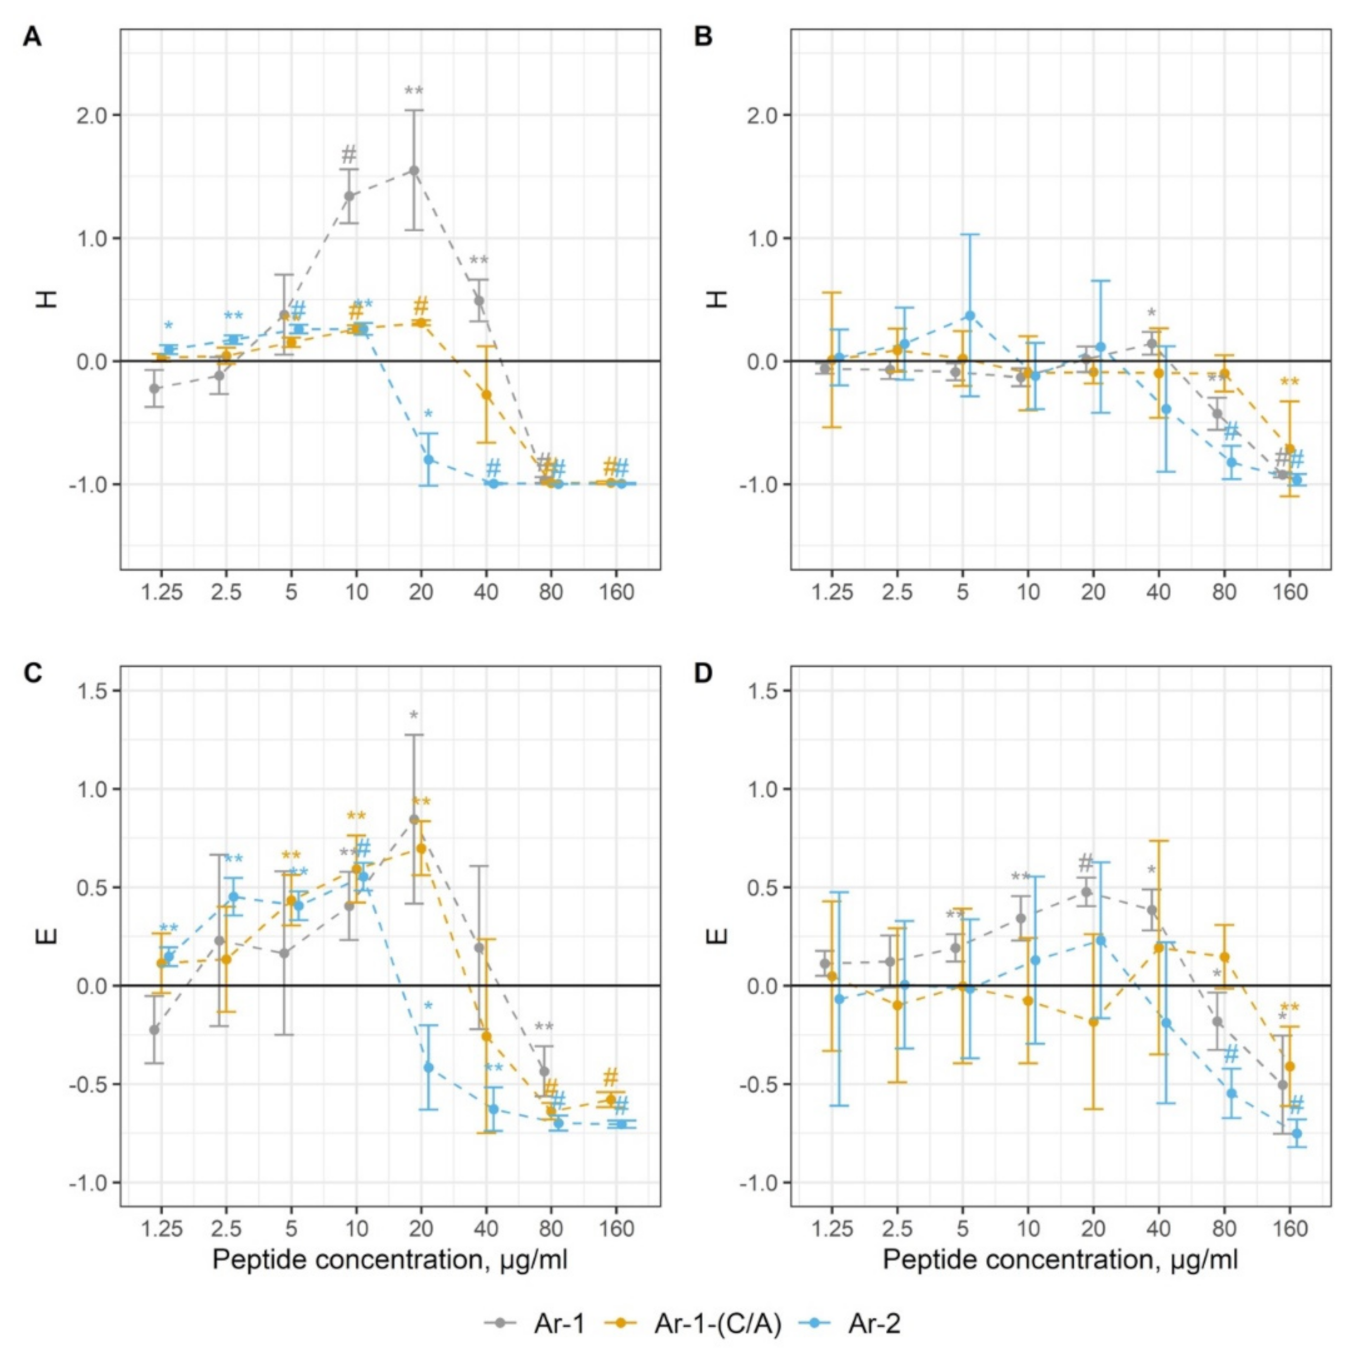
4.6. Complement Activation
4.7. Statistical Analysis
Author Contributions
Funding
Acknowledgments
Conflicts of Interest
References
- Niyonsaba, F.; Hirata, M.; Ogawa, H.; Nagaoka, I. Epithelial cell-derived antibacterial peptides human beta-defensins and cathelicidin: Multifunctional activities on mast cells. Curr. Drug Targets Inflamm. Allergy 2003, 2, 224–231. [Google Scholar] [CrossRef] [PubMed]
- Yang, D.; Chertov, O.; Bykovskaia, S.N.; Chen, Q.; Buffo, M.J.; Shogan, J.; Anderson, M.; Schröder, M.J.; Wang, M.; Howard, O.M.Z.; et al. β-Defensins: Linking innate and adaptive immunity through dendritic and T cell CCR6. Science 1999, 286, 525–528. [Google Scholar] [CrossRef] [PubMed]
- Yang, D.; Chen, Q.; Chertov, O.; Oppenheim, J.J. Human neutrophil defensins selectively chemoattract naive T and immature dendritic cells. J. Leukoc. Biol. 2000, 68, 9–14. [Google Scholar] [CrossRef]
- Territo, M.C.; Ganz, T.; Selsted, M.E.; Lehrer, R. Monocyte-chemotactic activity of defensins from human neutrophils. J. Clin. Investig. 1989, 84, 2017–2020. [Google Scholar] [CrossRef] [PubMed]
- Chavakis, T.; Cines, D.B.; Rhee, J.-S.; Liang, O.D.; Schubert, U.; Hammes, H.-P.; Higazi, A.A.-R.; Nawroth, P.P.; Preissner, K.T.; Bdeiret, K. Regulation of neovascularization by human neutrophil peptides (α-defensins): A link between inflammation and angiogenesis. FASEB J. 2004, 18, 1306–1308. [Google Scholar] [CrossRef]
- Oono, T.; Shirafuji, Y.; Huh, W.K.; Akiyama, H.; Iwatsuki, K. Effects of human neutrophil peptide-1 on the expression of interstitial collagenase and type I collagen in human dermal fibroblasts. Arch. Dermatol. Res. 2002, 294, 185–189. [Google Scholar] [CrossRef]
- Umnyakova, E.S.; Zharkova, M.S.; Berlov, M.N.; Shamova, O.V.; Kokryakov, V.N. Human antimicrobial peptides in autoimmunity. Autoimmunity 2020, 53, 137–147. [Google Scholar] [CrossRef] [PubMed]
- Zharkova, M.S.; Orlov, D.S.; Golubeva, O.Y.; Chakchir, O.B.; Eliseev, I.E.; Grinchuk, T.M.; Shamova, O.V. Application of antimicrobial peptides of the innate immune system in combination with conventional antibiotics-a novel way to combat antibiotic resistance? Front. Cell Infect. Microbiol. 2019, 9, 128. [Google Scholar] [CrossRef] [PubMed]
- Mahlapuu, M.; Håkansson, J.; Ringstad, L.; Björn, C. Antimicrobial peptides: An emerging category of therapeutic agents. Front. Cell Infect. Microbiol. 2016, 6, 1–12. [Google Scholar] [CrossRef]
- Umnyakova, E.S.; Kudryavtsev, I.V.; Grudinina, N.A.; Balandin, S.V.; Bolosov, I.A.; Panteleev, P.V.; Filatenkova, T.A.; Orlov, D.S.; Tsvetkova, E.V.; Ovchinnikova, T.V.; et al. Internalization of antimicrobial peptide acipensin 1 into human tumor cells. Med. Immunol. 2016, 18, 575–582. [Google Scholar] [CrossRef][Green Version]
- Chessa, C.; Bodet, C.; Jousselin, C.; Wehbe, M.; Lévêque, N.; Garcia, M. Antiviral and immunomodulatory properties of antimicrobial peptides produced by human keratinocytes. Front. Microbiol. 2020, 11, 1155. [Google Scholar] [CrossRef] [PubMed]
- Prohászka, Z.; Német, K.; Csermely, P.; Hudecz, F.; Mezõ, G.; Füst, G. Defensins purified from human granulocytes bind c1q and activate the classical complement pathway like the transmembrane glycoprotein gp41 of HIV- 1. Mol. Immunol. 1997, 34, 809–816. [Google Scholar] [CrossRef]
- van den Berg, R.H.; Faber-Krol, M.C.; van Wetering, S.; Hiemstra, P.S.; Daha, M.R. Inhibition of activation of the classical pathway of complement by human neutrophil defensins. Blood 1998, 92, 3898–3903. [Google Scholar] [CrossRef] [PubMed]
- Groeneveld, T.W.L.; Ramwadhdoebé, T.H.; Trouw, L.A.; van den Ham, D.L.; van der Borden, V.; Drijfhout, J.W.; Hiemstra, P.S.; Daha, M.R.; Roos, A. Human neutrophil peptide-1 inhibits both the classical and the lectin pathway of complement activation. Mol. Immunol. 2007, 44, 3608–3614. [Google Scholar] [CrossRef]
- Panyutich, A.V.; Szold, O.; Poon, P.H.; Tseng, Y.; Ganz, T. Identification of defensin binding to C1 complement. FEBS Lett. 1994, 356, 169–173. [Google Scholar] [CrossRef]
- Chen, J.; Xu, X.-M.; Underhill, C.B.; Yang, S.; Wang, L. Tachyplesin activates the classical complement pathway to kill tumor cells. Cancer Res. 2005, 65, 4614–4622. [Google Scholar] [CrossRef]
- Berlov, M.N.; Umnyakova, E.S.; Leonova, T.S.; Milman, B.L.; Krasnodembskaya, A.D.; Ovchinnikova, T.V.; Kokryakov, V.N. Interaction of arenicin-1 with C1q protein. Russ. J. Bioorganic. Chem. 2015, 41, 597–601. [Google Scholar] [CrossRef]
- Umnyakova, E.S.; Gorbunov, N.P.; Zhakhov, A.V.; Krenev, I.A.; Ovchinnikova, T.V.; Kokryakov, V.N.; Berlov, M.N. Modulation of human complement system by antimicrobial peptide arenicin-1 from Arenicola marina. Mar. Drugs 2018, 16, 480. [Google Scholar] [CrossRef]
- Merle, N.S.; Church, S.E.; Fremeaux-Bacchi, V.; Roumenina, L.T. Complement system part I – molecular mechanisms of activation and regulation. Front. Immunol. 2015, 6, 262. [Google Scholar] [CrossRef]
- Schröder-Braunstein, J.; Kirschfink, M. Complement deficiencies and dysregulation: Pathophysiological consequences, modern analysis, and clinical management. Mol. Immunol. 2019, 114, 299–311. [Google Scholar] [CrossRef]
- Ovchinnikova, T.V.; Aleshina, G.M.; Balandin, S.V.; Krasnosdembskaya, A.D.; Markelov, M.L.; Frolova, E.I.; Leonova, Y.F.; Tagaev, A.A.; Krasnodembsky, E.G.; Kokryakov, V.N. Purification and primary structure of two isoforms of arenicin, a novel antimicrobial peptide from marine polychaeta Arenicola marina. FEBS Lett. 2004, 577, 209–214. [Google Scholar] [CrossRef] [PubMed]
- Berlov, M.N.; Maltseva, A.L. Immunity of the lugworm Arenicola marina: Cells and molecules. Invertebr. Surviv. J. 2016, 13, 247–256. [Google Scholar] [CrossRef]
- Panteleev, P.V.; Bolosov, I.A.; Balandin, S.V.; Ovchinnikova, T.V. Design of antimicrobial peptide arenicin analogs with improved therapeutic indices. J. Pep. Sci. 2014, 21, 105–113. [Google Scholar] [CrossRef] [PubMed]
- Ovchinnikova, T.V.; Shenkarev, Z.O.; Nadezhdin, K.D.; Balandin, S.V.; Zhmak, M.N.; Kudelina, I.A.; Finkina, E.I.; Arseniev, A.S. Recombinant expression, synthesis, purification, and solution structure of arenicin. Biochem. Biophys. Res. Commun. 2007, 360, 156–162. [Google Scholar] [CrossRef] [PubMed]
- Shenkarev, Z.O.; Balandin, S.V.; Trunov, K.I.; Paramonov, A.S.; Sukhanov, S.V.; Barsukov, L.I.; Arseniev, A.S.; Ovchinnikova, T.V. Molecular mechanism of action of β-Hairpin antimicrobial peptide arenicin: Oligomeric structure in dodecylphosphocholine micelles and pore formation in planar lipid bilayers. Biochemistry 2011, 50, 6255–6265. [Google Scholar] [CrossRef] [PubMed]
- Panteleev, P.V.; Myshkin, M.Y.; Shenkarev, Z.O.; Ovchinnikova, T.V. Dimerization of the antimicrobial peptide arenicin plays a key role in the cytotoxicity but not in the antibacterial activity. Biochem. Biophys. Res. Commun. 2017, 482, 1320–1326. [Google Scholar] [CrossRef]
- Micsonai, A.; Wien, F.; Kernya, L.; Lee, Y.H.; Goto, Y.; Réfrégiers, M.; Kardos, J. Accurate secondary structure prediction and fold recognition for circular dichroism spectroscopy. Proc. Natl. Acad. Sci. USA 2015, 112, E3095–E3103. [Google Scholar] [CrossRef]
- Micsonai, A.; Wien, F.; Bulyáki, E.; Kun, J.; Moussong, É.; Lee, Y.H.; Goto, Y.; Réfrégiers, M.; Kardos, J. BeStSel: A web server for accurate protein secondary structure prediction and fold recognition from the circular dichroism spectra. Nucleic Acids Res. 2018, 46, W315–W322. [Google Scholar] [CrossRef]
- Orlov, D.S.; Shamova, O.V.; Eliseev, I.E.; Zharkova, M.S.; Chakchir, O.B.; Antcheva, N.; Zachariev, S.; Panteleev, P.V.; Kokryakov, V.N.; Ovchinnikova, T.V.; et al. Redesigning arenicin-1, an antimicrobial peptide from the marine polychaeta Arenicola marina, by strand rearrangement or branching, substitution of specific residues, and backbone linearization or cyclization. Mar. Drugs 2019, 17, 376. [Google Scholar] [CrossRef]
- Ovchinnikova, T.V.; Shenkarev, Z.O.; Balandin, S.V.; Nadezhdin, K.D.; Paramonov, A.S.; Arseniev, A.S.; Kokryakov, V.N. Molecular insight into mechanism of antimicrobial action of the β-hairpin peptide arenicin: Specific oligomerization in detergent micelles. Biopolymers 2008, 89, 455–464. [Google Scholar] [CrossRef]
- Lee, J.-U.; Kang, D.-I.; Zhu, W.L.; Shin, S.Y.; Hahm, K.-S.; Kim, Y. Solution structures and biological functions of the antimicrobial peptide, arenicin-1, and its linear derivative. Pept. Sci. 2006, 88, 208–216. [Google Scholar] [CrossRef] [PubMed]
- Andrä, J.; Jakovkin, I.; Grötzinger, J.; Hecht, O.; Krasnosdembskaya, A.D.; Goldmann, T.; Thomas Gutsmann, T.; Leippe, M.; Andrä, J. Structure and mode of action of the antimicrobial peptide arenicin. Biochem. J. 2008, 410, 113–122. [Google Scholar] [CrossRef] [PubMed]
- Umnyakova, E.S.; Krenev, I.A.; Legkovoy, S.V.; Sokolov, A.V.; Rogacheva, O.N.; Ovchinnikova, T.V.; Kokryakov, V.N.; Berlov, M.N. The interaction of arenicin-1 with C3b complement protein. Med. Acad. J. 2019, 19, 187–188. [Google Scholar] [CrossRef]
- Capila, I.; Linhardt, J.R. Heparin-protein interactions. Angew. Chem. Int. Ed. 2002, 41, 390–412. [Google Scholar] [CrossRef]
- Yu, H.; Muñoz, E.M.; Edens, R.E.; Linhardt, R.J. Heparin regulation of the complement system. Chem. Biol. Heparin Heparan Sulfate 2005, 313–343. [Google Scholar] [CrossRef]
- Zaferani, A.; Talsma, D.; Richter, M.K.S.; Daha, M.R.; Navis, G.J.; Seelen, M.A.; van den Born, J. Heparin/heparan sulphate interactions with complement—A possible target for reduction of renal function loss? Nephrol. Dial. Transplant. 2014, 29, 515–522. [Google Scholar] [CrossRef]
- Khandelwal, S.; Johnson, A.M.; Liu, J.; Keire, D.; Sommers, C.; Ravi, J.; Lee, G.M.; Lambris, J.D.; Reis, E.S.; Arepally, G.M. Novel Immunoassay for Complement Activation by PF4/Heparin Complexes. Thromb. Haemost. 2018, 118, 1484–1487. [Google Scholar] [CrossRef]
- Ricklin, D.; Lambris, J.D. Complement in immune and inflammatory disorders: Pathophysiological mechanisms. J. Immunol. 2013, 190, 3831–3838. [Google Scholar] [CrossRef]
- Lehrer, R.I.; Rosenman, M.; Harwig, S.S.; Jackson, R.; Eisenhauer, P. Ultrasensitive assays for endogenous antimicrobial polypeptides. J. Immunol. Methods 1991, 137, 167–173. [Google Scholar] [CrossRef]


| Peptide | α-Helix, % | β-Sheet, % | Turn, % | Other, % | NRMSD | |||||
|---|---|---|---|---|---|---|---|---|---|---|
| Regular | Distorted | Antiparallel | Parallel | |||||||
| Left-Twisted | Relaxed | Right-Twisted | ||||||||
| Ar-1-(C/A) | aqueous solution | 1.5 | 45.2 | 9.0 | 44.2 | 0.034 | ||||
| 0.0 | 1.5 | 1.4 | 12.2 | 23.8 | 7.8 | |||||
| SDS micelles | 11.8 | 22.5 | 11.9 | 53.7 | 0.015 | |||||
| 6.5 | 5.4 | 0.0 | 9.1 | 5.0 | 8.4 | |||||
| Ar-1 | aqueous solution | 0.0 | 66.0 | 0.0 | 34.0 | 0.034 | ||||
| 0.0 | 0.0 | 3.6 | 24.0 | 38.4 | 0.0 | |||||
| SDS micelles | 15.5 | 41.7 | 8.3 | 34.5 | 0.018 | |||||
| 15.5 | 0.0 | 4.5 | 22.9 | 14.3 | 0.0 | |||||
| Ar-2 | aqueous solution | 0.0 | 67.4 | 0.0 | 32.6 | 0.027 | ||||
| 0.0 | 0.0 | 3.9 | 24.6 | 38.9 | 0.0 | |||||
| SDS micelles | 7.8 | 44.8 | 11.7 | 35.7 | 0.016 | |||||
| 7.5 | 0.4 | 5.0 | 22.9 | 16.8 | 0.0 | |||||
| Peptide | Modulation of Human Complement System | MHC | MIC | ||||
|---|---|---|---|---|---|---|---|
| Classical Pathway | Alternative Pathway | E. coli | L. monocytogenes | ||||
| Hemolysis | C3a | Hemolysis | C3a | ||||
| Ar-1 | ↑3.6—14.5 ↓29 | ↑3.6—7.2 ↓29 | ↑14.5 ↓29–58 | ↑1.8—14.5 ↓29—58 | 2.9 ± 1.2 | 3.3 | 2.2 |
| Ar-2 | ↑0.5—3.6 ↓7.2—57.7 | ↑0.5—3.6 ↓7.2—57.7 | ↑no ↓28.8—57.7 | ↑no ↓28.8—57.7 | 1.8 ± 0.9 | 1.7 | 2.0 |
| Ar-1-(C/A) | ↑1.9—7.4 ↓29.7—59.3 | ↑1.9—7.4 ↓29.7—59.3 | ↑no ↓59.3 | ↑no ↓59.3 | 11.1 ± 2.3 | 4.0 | 3.6 |
Publisher’s Note: MDPI stays neutral with regard to jurisdictional claims in published maps and institutional affiliations. |
© 2020 by the authors. Licensee MDPI, Basel, Switzerland. This article is an open access article distributed under the terms and conditions of the Creative Commons Attribution (CC BY) license (http://creativecommons.org/licenses/by/4.0/).
Share and Cite
Krenev, I.A.; Umnyakova, E.S.; Eliseev, I.E.; Dubrovskii, Y.A.; Gorbunov, N.P.; Pozolotin, V.A.; Komlev, A.S.; Panteleev, P.V.; Balandin, S.V.; Ovchinnikova, T.V.; et al. Antimicrobial Peptide Arenicin-1 Derivative Ar-1-(C/A) as Complement System Modulator. Mar. Drugs 2020, 18, 631. https://doi.org/10.3390/md18120631
Krenev IA, Umnyakova ES, Eliseev IE, Dubrovskii YA, Gorbunov NP, Pozolotin VA, Komlev AS, Panteleev PV, Balandin SV, Ovchinnikova TV, et al. Antimicrobial Peptide Arenicin-1 Derivative Ar-1-(C/A) as Complement System Modulator. Marine Drugs. 2020; 18(12):631. https://doi.org/10.3390/md18120631
Chicago/Turabian StyleKrenev, Ilia A., Ekaterina S. Umnyakova, Igor E. Eliseev, Yaroslav A. Dubrovskii, Nikolay P. Gorbunov, Vladislav A. Pozolotin, Alexei S. Komlev, Pavel V. Panteleev, Sergey V. Balandin, Tatiana V. Ovchinnikova, and et al. 2020. "Antimicrobial Peptide Arenicin-1 Derivative Ar-1-(C/A) as Complement System Modulator" Marine Drugs 18, no. 12: 631. https://doi.org/10.3390/md18120631
APA StyleKrenev, I. A., Umnyakova, E. S., Eliseev, I. E., Dubrovskii, Y. A., Gorbunov, N. P., Pozolotin, V. A., Komlev, A. S., Panteleev, P. V., Balandin, S. V., Ovchinnikova, T. V., Shamova, O. V., & Berlov, M. N. (2020). Antimicrobial Peptide Arenicin-1 Derivative Ar-1-(C/A) as Complement System Modulator. Marine Drugs, 18(12), 631. https://doi.org/10.3390/md18120631