The results of the descriptive analysis show that the average age of women with FECD is approximately 71 years with a deviation ±9.428 years and a median age of 72 years. The youngest age among women with FECD is 54 years, and the oldest is 85 years. The average age of men with FECD is approximately 75 years (75, 44 years) with a deviation ±6.928 years and a median age of 75, 50 years. The youngest age among men with FECD is 65 years, and the oldest is 88 years.
3.2. Corneal Densitometry
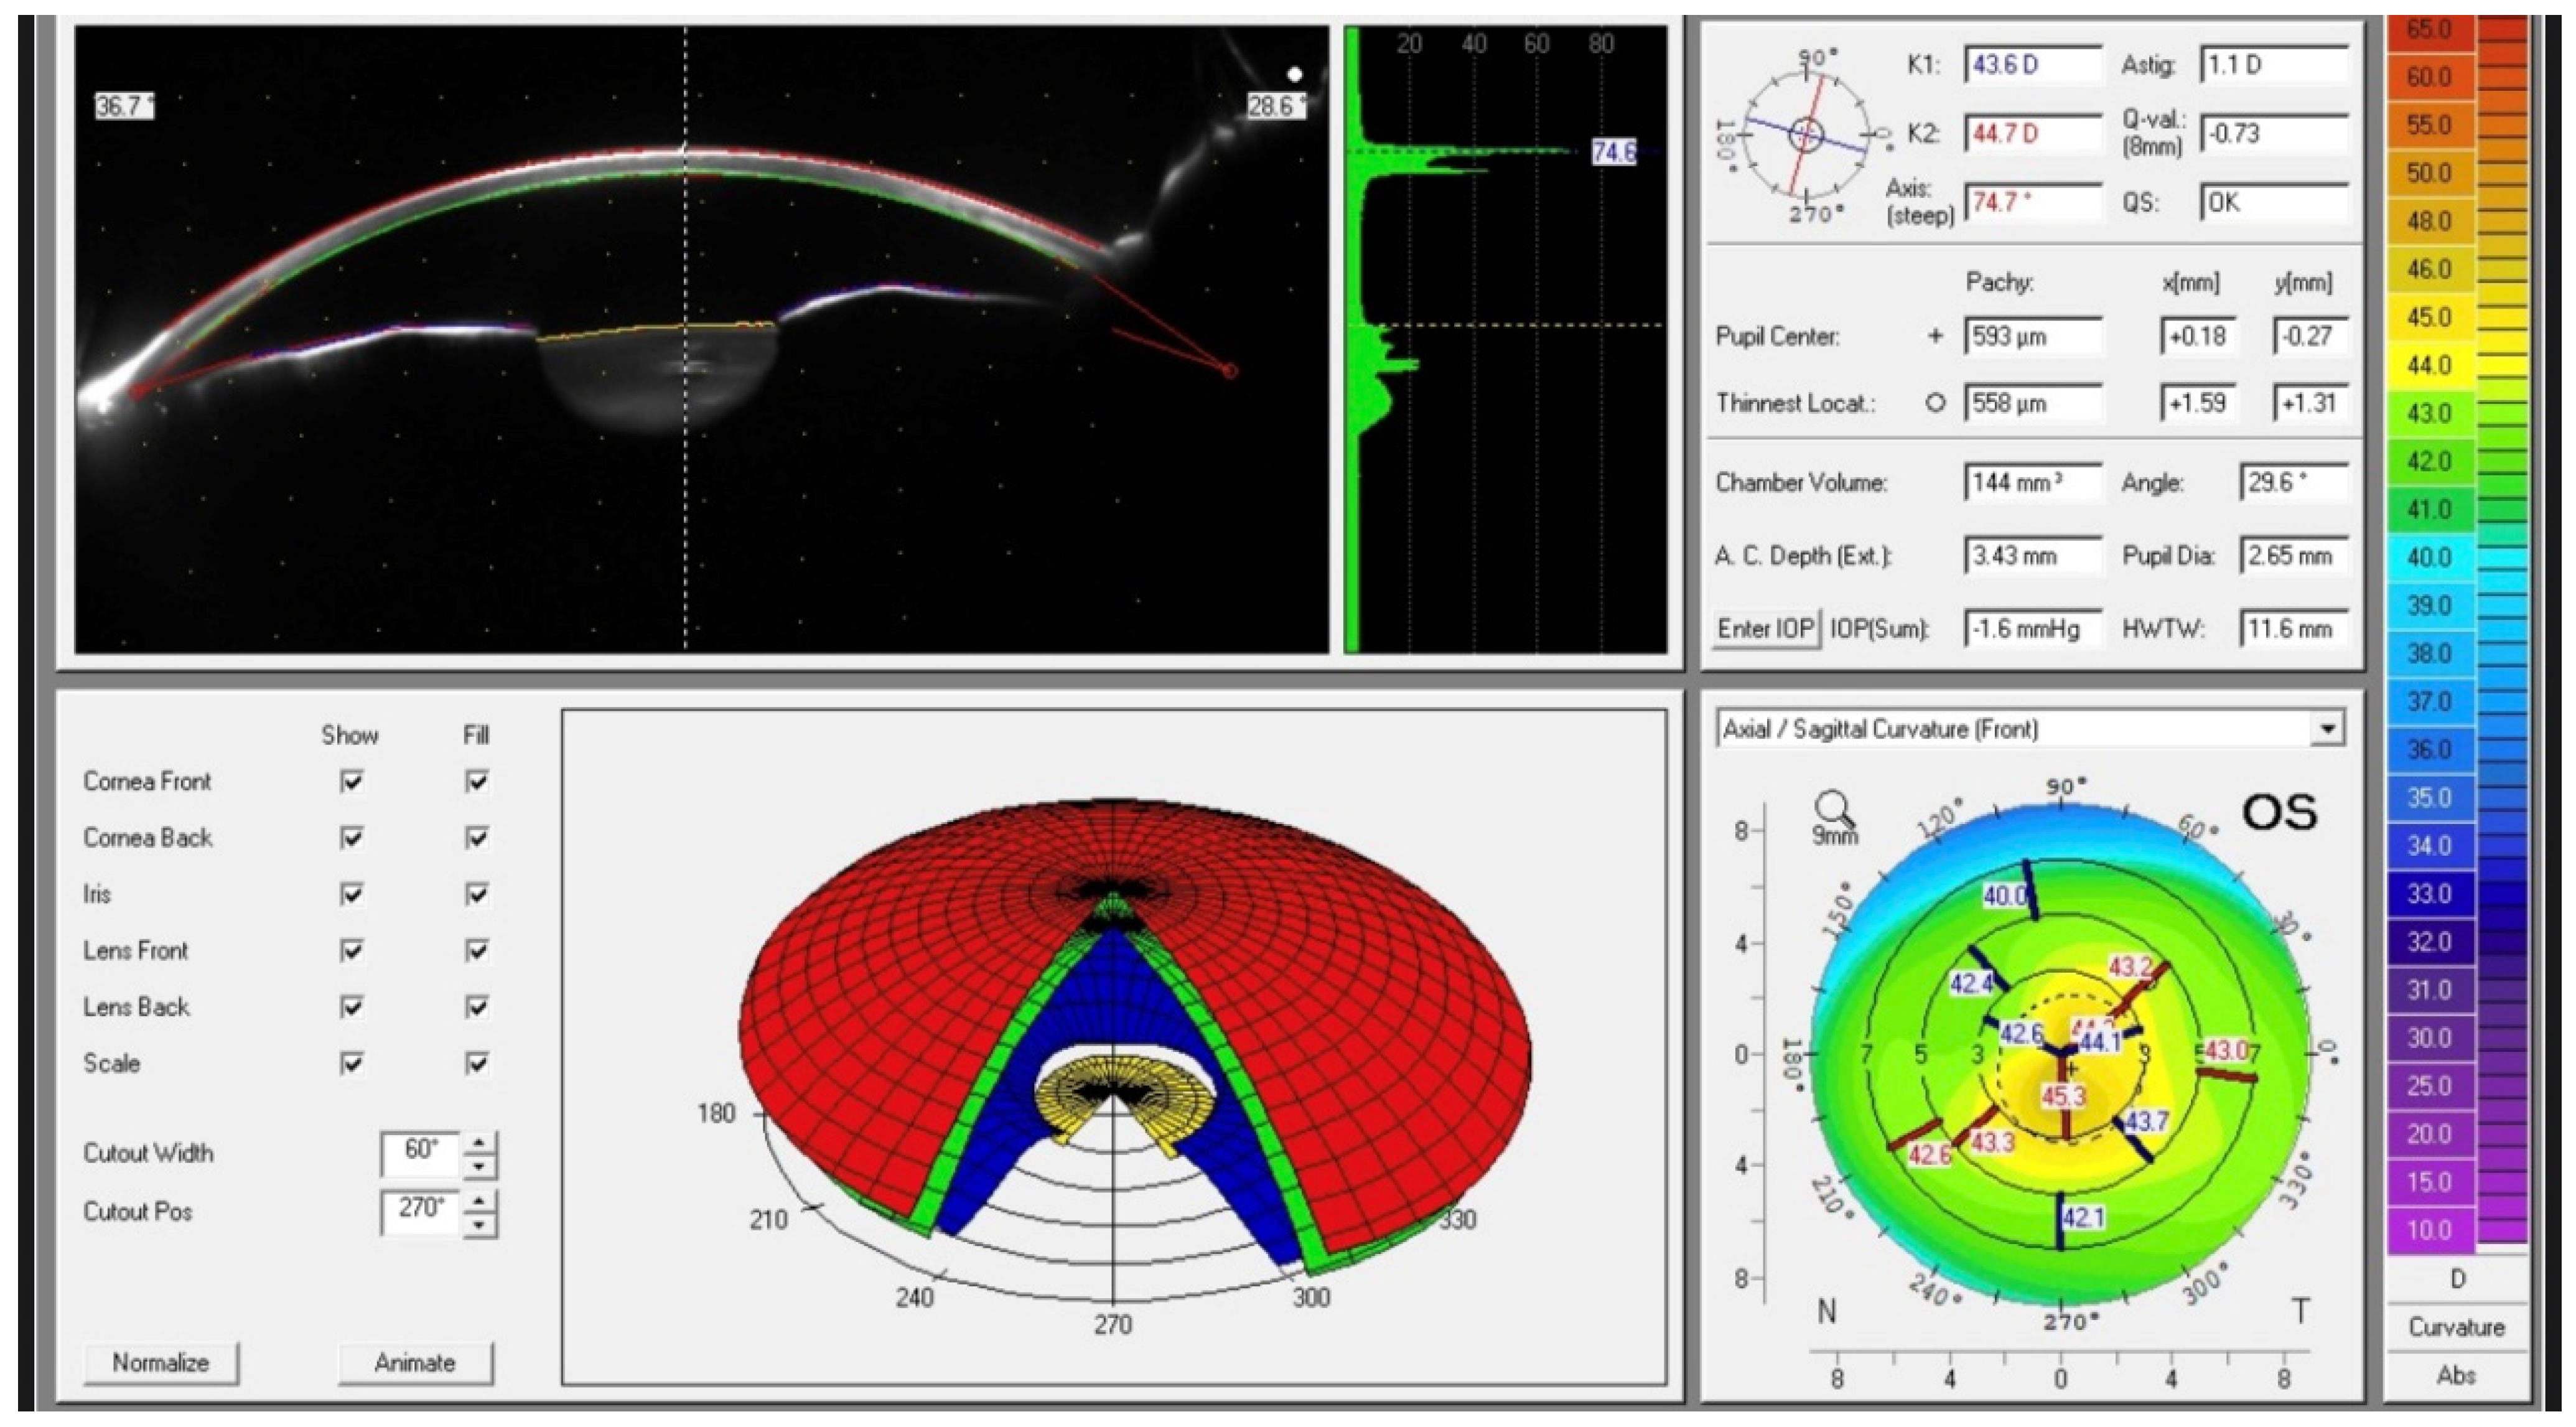
With the help of the Pentacam Scheimpflug tomograph, we were able to quantitatively determine corneal opacity as an optical index for corneal health, since backward light scattering in a normal cornea is minimal. The software (version 6.10r56) divides the cornea into 4 concentric radial zones (the first, central zone—with a d 2 mm; second—ring from 2 mm to 6 mm; third—from 6 mm to 10 mm; fourth—from 10 mm to 12 mm) and into 3 layers (anterior layer—120 µm, posterior layer—60 µm, and central layer, which does not have a fixed thickness but is determined by subtracting the two known layers from the total thickness of the cornea).
We compared the obtained mean values in the different zones and layers between the various age subgroups and the respective controls. The results are presented in following tables (
Table 2). Detailed numerical datasets are additionally provided in
Supplementary Tables S1–S4.
In the 50–59 age subgroup, the mean corneal densitometry value for the entire 12 mm diameter zone was 20.138 + 2.2659 for FECD patients and 16.900 + 0.7071 for female controls, demonstrating statistical significance (
p = 0.005). When considered by radial zones, in FECD patients and controls, densitometry values were lowest in the paracentral radial zone (15.725 + 0.9192 and 15.800 + 0.4243, respectively), followed by the central zone and highest in the periphery (28.363 + 4.5356 and 19.350 + 1.2021, respectively). No statistically significant difference was found between the densitometric values of the central 2 mm zone and the surrounding 2–6 mm ring (One-Way ANOVA,
p = 0.165). The values for the 6–10 and 10–12 mm zones in patients with FECD were significantly higher compared to the other two zones (
p < 0.001). When the cornea was divided into layers, the highest degree of backscatter was observed in the anterior layer (26.463 + 3.2802), with the value being significantly higher than the central and posterior layers (
p < 0.001). The results obtained in the table show statistical significance in terms of backscatter in the central and posterior part of the 0–2 mm zone in favor of the controls (
p = 0.005 and 0.040). In patients with FECD, a statistically significant increase in backscatter was found in the last 2 zones and in all layers compared to the controls (
Table 3).
In the subgroup of women aged 60–69, the mean corneal densitometry value for the entire 12 mm diameter zone was 20.550 + 1.8509 for patients with FECD and 20.467 + 2.0146 for female controls, with no statistical significance. When considered by radial zones, in patients with FECD and controls, the densitometric mean values were lowest in the paracentral zone (2–6 mm) (16.188 + 1.9874 and 15.617 + 1.2828, respectively), followed by the central and highest in the periphery (28.675 + 3.5596 and 29.517 + 3.1815, respectively). There was no statistically significant difference between the densitometric values of the central 2 mm zone and the surrounding 2–6 mm ring (One-Way ANOVA,
p = 0.083). The values for the 6–10 and 10–12 mm zones in patients with FECD were significantly higher than the other two zones (
p < 0.001). The data were similar in control patients. Layer-wise, the highest degree of backscatter was observed in the anterior layer (26.525 + 3.3435), with the value being significantly higher than the central and posterior layers (
p < 0.001). In controls, the backscatter was again higher in the anterior layer, but here
p = 0.004 for the 6–10 mm zone and 0.001 for the 10–12 mm zone. The results in the table show a statistically significant increase in backscatter in the posterior part of the 0–2 mm zone (
p < 0.001). In the radial zone, 6–10 mm, a significant difference was found in the posterior layer (
p = 0.011). In the remaining zones and layers, no statistically significant differences were found between patients with FECD and controls (
Table 4).
In the subgroup of women aged 70–79, the mean corneal densitometry value for the entire 12 mm diameter zone was 25.175 + 4.5714 for patients with FECD and 24.700 + 2.6005 for female controls, with no statistical significance between the two groups. When considered by radial zones, for patients with FECD and controls, the densitometric mean values were lowest in the central zone for patients with FECD (17.275 + 1.4017) and in the radial zone 2–6 mm for controls (16.662 + 1.4928) and highest in the periphery (35.063 + 4.7118 and 36.163 + 8.8880). There was no statistically significant difference between the densitometric values of the central 2 mm zone and the surrounding 2–6 mm ring (One-Way ANOVA,
p = 0.547). The values for the 6–10 and 10–12 mm zones in patients with FECD were significantly higher than the other two zones (
p < 0.001). The data were similar in control patients. When the densitometric values were divided by layer, the highest degree of backscatter was observed in the anterior layer (33.833 + 6.6833), with the value being significantly higher than the central and posterior layers (
p < 0.001). In controls, this pattern was maintained. The results in the table show a statistically significant increase in backscatter in the posterior part of the 0–2 mm zone (
p = 0.047). In the radial zone, 10–12 mm, a significant difference was found in the posterior layer (
p < 0.001) in favor of the controls. In the remaining zones and layers, no statistically significant difference was found between patients with FECD and controls (
Table 5).
In the subgroup of women aged 80–89, the mean corneal densitometry value for the entire 12 mm diameter zone was 24.057 + 4.2583 for patients with FECD and 22.660 + 4.8454 for female controls, with no statistical significance between the two groups. When considered by radial zones, in patients with FECD and controls, the densitometric mean values were lowest in the 2–6 mm zone (18.550 + 2.4140 and 16.290 + 1.3203, respectively), followed by the central, and highest in the periphery (30.586 + 8.0551 and 33.250 + 11.8778, respectively). There was no statistically significant difference between the densitometric values of the central 2 mm zone and the surrounding 2–6 mm ring. The values for the 6–10 and 10–12 mm zones in patients with FECD were significantly higher than the other two zones (
p < 0.001). The data were similar in control patients. When the densitometry values were divided by layer, the highest degree of backscatter was observed in the anterior layer (32.271 + 6.0982), with the value being significantly higher than the central and posterior layers (
p < 0.001). In controls, this pattern was preserved. The results obtained in the table show a statistically significant increase in backscatter in the 0–2 mm and 2–6 mm zones in all parameters except the posterior layer, although a significant progression was observed in the posterior layer in these zones in patients with FECD compared to controls. In 10–12 mm, a significant difference in backscatter in the anterior layer (
p < 0.016) was established in favor of controls. In the remaining zones and layers, no statistically significant difference was found between patients with FECD and controls (
Table 6).
We compared the values obtained from densitometry between patients with FECD from age subgroups 50–59 years and 80–89 years. As a test value, we used the average values of patients aged 50–59 years. In the central 2 mm zone, statistical significance of the parameter in the anterior and central zones was established. In radial zones 2–6 mm and 6–10 mm, a clinically significant increase in the parameter was observed. Regarding corneal densitometry for the entire zone with a diameter of 12 mm, it is seen that a statistically significant increase in backscatter of light was established in all three layers (
Table 7).
In the age subgroup (men) 60–69 years, the mean value of corneal densitometry for the entire area with a diameter of 12 mm was 18.750 + 0.7895 for patients with FECD and 22.890 + 2.5826 for male controls, with statistical significance being demonstrated but in favor of controls. There was a significant increase in the backscatter of the entire cornea in male controls compared to those with FECD (
p = 0.002). If we compare the same age subgroup of female patients with FECD and controls, a statistically significant difference was also found in this indicator (
p = 0.020 and
p = 0.016, respectively). When considered by radial zones, in FECD patients and controls, densitometric values were lowest in the paracentral radial zone (16.275 + 0.4031 and 16.040 + 1.2756, respectively), followed by the central zone and highest in the periphery (10–12 mm radial zone) (24.775 + 4.1210 and 34.450 + 6.6958, respectively), similar to women of the same age group. There was no statistically significant difference between the densitometric values of the central 2 mm zone and the surrounding 2–6 mm and 6–10 mm radial rings. The mean value for the 10–12 mm zone in FECD patients was statistically significantly higher compared to the central and paracentral zones (
p = 0.038;
p = 0.026) but not for the 6–10 mm radial zone (
p = 0.064). In contrast to women of the same age subgroup, the backscatter of light in the two peripheral radial zones was statistically significantly higher than the central and paracentral zones. When the densitometry values were divided by layer, the highest degree of backscatter was observed in the anterior layer (24.425 + 1.0210), the value being significantly higher than the central (
p = 0.001) and posterior layers (
p < 0.001), while in the controls,
p < 0.001 for the central and posterior layers. The results obtained in the table show statistical significance in terms of backscatter in all layers in the radial zones 6–10 mm and 10–12 mm of the zone 0–2 mm of the controls, while in the central and paracentral zones, no clinically significant difference was found between the two subgroups (
Table 8).
In the subgroup of men aged 70–79, the mean corneal densitometry value for the entire 12 mm diameter area was 27.162 + 4.0415 for patients with FECD and 25.356 + 2.4895 for male controls, with no statistical significance between the two groups (
p = 0.247). If we compare with women from the same age subgroup, in patients with FECD and controls, no statistically significant difference was found in this indicator (
p = 0.207 and
p = 0.452, respectively). When considered by radial zones, in FECD patients and controls, the densitometric mean values were lowest in the central zone for FECD patients (19.325 + 1.4400) and in the radial zone 2–6 mm for controls (17.856 + 1.4152) and highest in the zone 6–10 mm for FECD patients (34.313 + 8.6062) and the peripheral zone for controls (38.333 + 11.7546). In contrast to men, in women with FECD, the highest degree of backscatter was observed, similar to controls, in the peripheral 10–12 mm zone. There was no statistically significant difference between the densitometric values of the central 2 mm zone and the surrounding 2–6 mm ring (One-Way ANOVA,
p = 0.154) in men with FECD. The values for the 6–10 and 10–12 mm zones in patients with FECD were significantly higher compared to the other two zones (for the 6–10 mm zone—
p = 0.002 and
p = 0.003, respectively compared to the central 0–2 mm and 2–6 mm zones; for the 10–12 mm zone
p = 0.001). The data were similar in the control patients (
p = 0.001). When the densitometry values were divided by layer, the highest degree of backscatter was observed in the anterior layer (37.788 + 6.7198), the value being significantly higher than the central (
p = 0.001) and posterior layers (
p < 0.001). In the controls, this pattern was preserved (
p < 0.001). The results in the table show a statistically significant increase in backscatter in the central and posterior parts of the 0–2 mm zone (
p = 0.001 and
p = 0.004). In radial zone 6–10 mm, a statistically significant increase in backscatter was found in all layers. In radial zone 10–12 mm, a significant difference was found in the central layer (
p = 0.020) in favor of the controls. In the remaining zones and layers, no statistically significant difference was found between patients with FECD and controls (
Table 9).
In the subgroup of men aged 80–89, the mean corneal densitometry value for the entire 12 mm diameter area was 26.700 + 4.5233 for patients with FECD and 30.450 + 6.0973 for male controls, with no statistical significance between the two groups (
p = 0.098). If we compare with women from the same age subgroup, in patients with FECD and controls, no statistically significant difference was found in this indicator (
p = 0.212 and
p = 0.084, respectively). When considered by radial zones, in patients with FECD and controls, densitometric mean values were lowest in the radial zone 2–6 mm (21.000 + 3.5777 and 22.750 + 7.3178, respectively) and highest in the peripheral zone 10–12 mm (33.717 + 3.2382 and 41.600 + 9.8718, respectively). Similar findings were found in women of the same age subgroup. There was no statistically significant difference between densitometric values of the central 2 mm zone and the surrounding 2–6 mm ring in men with FECD and controls. The values for the 6–10 and 10–12 mm zones in patients with FECD were significantly higher compared to the other two zones, being statistically significant for the 6–10 mm zone compared to the 2–6 mm zone (
p = 0.015) and for the 10–12 mm zone compared to the central and paracentral 2–6 mm zones (
p = 0.001 and
p < 0.001, respectively). In controls, the values were also statistically significantly increased (for the 6–10 mm zone
p = 0.16 and
p = 0.13, and for the 10–12 mm zone
p = 0.36 and
p = 0.032, respectively, compared to the central 0–2 mm and radial 2–6 mm zones). When densitometry values were divided by layer, the highest degree of backscatter was observed in the anterior layer (37.600 + 7.0759), with the value being significantly higher than the central (
p = 0.005) and posterior layers (
p = 0.001). In the controls, this pattern was violated, with
p = 0.079 when compared to the central layer and
p = 0.030 when compared to the posterior layer. The results obtained in the table show a statistically significant increase in backscatter in the anterior and central part of the 6–10 mm zone (
p = 0.015 and
p = 0.027) and the 10–12 mm zone (
p = 0.004 and
p = 0.001) in favor of the controls. We did not find a statistically significant increase in backscatter in the remaining layers and zones (
Table 10).
In both female patients with FECD and male patients in age subgroups 60–69 and 80–89, we compared the values obtained from densitometry to determine the presence of progression in the degree of backscattering in the different layers and zones of the corneas. As a test value, we used the average values of patients aged 60–69. In the central 2 mm zone, statistical significance of the parameter was established in the anterior and posterior zones but not in the central part, although an increase in the degree of backscattering was also seen in it. In the remaining radial zones, we observed a clinically significant increase in the parameter, with the exception of the posterior part in radial zone 10–12 mm, where the value was borderline.
When comparing densitometry results in men and women in the 80–89 age subgroup, statistical significance was demonstrated only for the factor corneal backscatter in the most peripheral radial zone (10–12 mm) (p = 0.027).
When analyzing densitograms of women with FECD aged 50–59, it was found that 21.4% (3 eyes) of the examined eyes had a mild posterior spinous hump, corresponding to backscatter at the level of Descemet’s membrane. 78.6% (11 eyes) of the examined eyes showed a “high-backed chair” pattern on the densitogram.
In the analysis of densitograms of women with FECD aged 60–69, it was found that in 71.4% (10 eyes) of the examined eyes, a mild posterior spicule was observed, and 28.6% (4 eyes) of the examined eyes showed a “high-backed chair” pattern on the densitogram.
In the next age group (70–79 years) of women with FECD, densitograms of 18 eyes showed that in only 27.8% (5 eyes) of the examined eyes, the densitogram showed a “high-backed chair” pattern. The remaining 72.2% were conditionally divided into those with a lower posterior spicule, corresponding to that in the previous groups (38.9% of the examined eyes) and densitograms with more pronounced backscatter from Descemet’s membrane (33% of the examined eyes).
In the last age group (80–89 years) of women with FECD, densitograms of 16 eyes were analyzed. It was found that 6.25% (1 eye) had a “high-backed chair” pattern. Of the remaining 93.75%, 31.25% (5 eyes) had a low posterior spicule, and the remaining 50% had a strong backscatter from Descemet’s membrane, corresponding to a “hammock” pattern in the densitogram.
As can be seen from the results presented so far, with advancing age in patients with FECD, the backscatter of light from Descemet’s membrane gradually increased, and the densitogram gradually changed from a “high-backed chair” pattern to a “hammock” pattern.
In the analysis of densitograms of men with FECD aged 60–69 years, it was found that 25% (2 eyes) of the examined eyes showed a barely noticeable posterior spinous hump, corresponding to backscatter at the level of Descemet’s membrane, and 75% (6 eyes) of the examined eyes showed a “high-backed chair” pattern on the densitogram.
In the subgroup of men with FECD aged 70–79 years, from the densitograms of 16 eyes, it was found that only 12.5% (2 eyes) of the examined eyes showed a “high-backed chair” pattern. The remaining 87.5% were divided into a group with a lower posterior spinous hump, corresponding to that of the previous group (62.5% of the examined eyes), and a group with a more pronounced backscatter from the side of Descemet’s membrane on the densitogram (25% of the examined eyes).
In the last age group (80–89 years) of men with FECD, densitograms of 8 eyes were analyzed. When analyzing the data in this subgroup, no densitogram with a “high-backed chair” pattern was detected, unlike the corresponding group in women with FECD. In 25% (2 eyes), a low posterior spicule was observed, and in the remaining 75%, a strongly pronounced backscatter from the Descemet’s membrane, corresponding to a “hammock” densitogram pattern.
As a summary of the results obtained from corneal tomography, we can say that a significant increase in the backscatter of light was observed in all layers of the cornea, with the strongest in the anterior layer, followed by the central and posterior layers. Also, an increase in densitometry values was observed with advancing age in both controls and patients with FECD, with the latter being more pronounced. From the results obtained, if we compare the progression between women and men with FECD by age, it was striking that it was more pronounced in men. When analyzing the densitograms, it was also striking that with advancing age, a posterior peak gradually appeared from a “high-backed chair” pattern, corresponding to the damaged Descemet’s membrane (DM), as this peak increased and the densitogram took on the appearance of a “two-humped camel” (
Figure 1). This change was again more pronounced in men.