

The Effects of 8-Week Hydrogen-Rich Water Consumption on Appetite, Body Composition, Sleep Quality, and Circulating Glucagon-like Peptide-1 in Obese Men and Women (HYDRAPPET): A Randomized Controlled Trial
 , , , , and
Abstract
1. Introduction
2. Materials and Methods
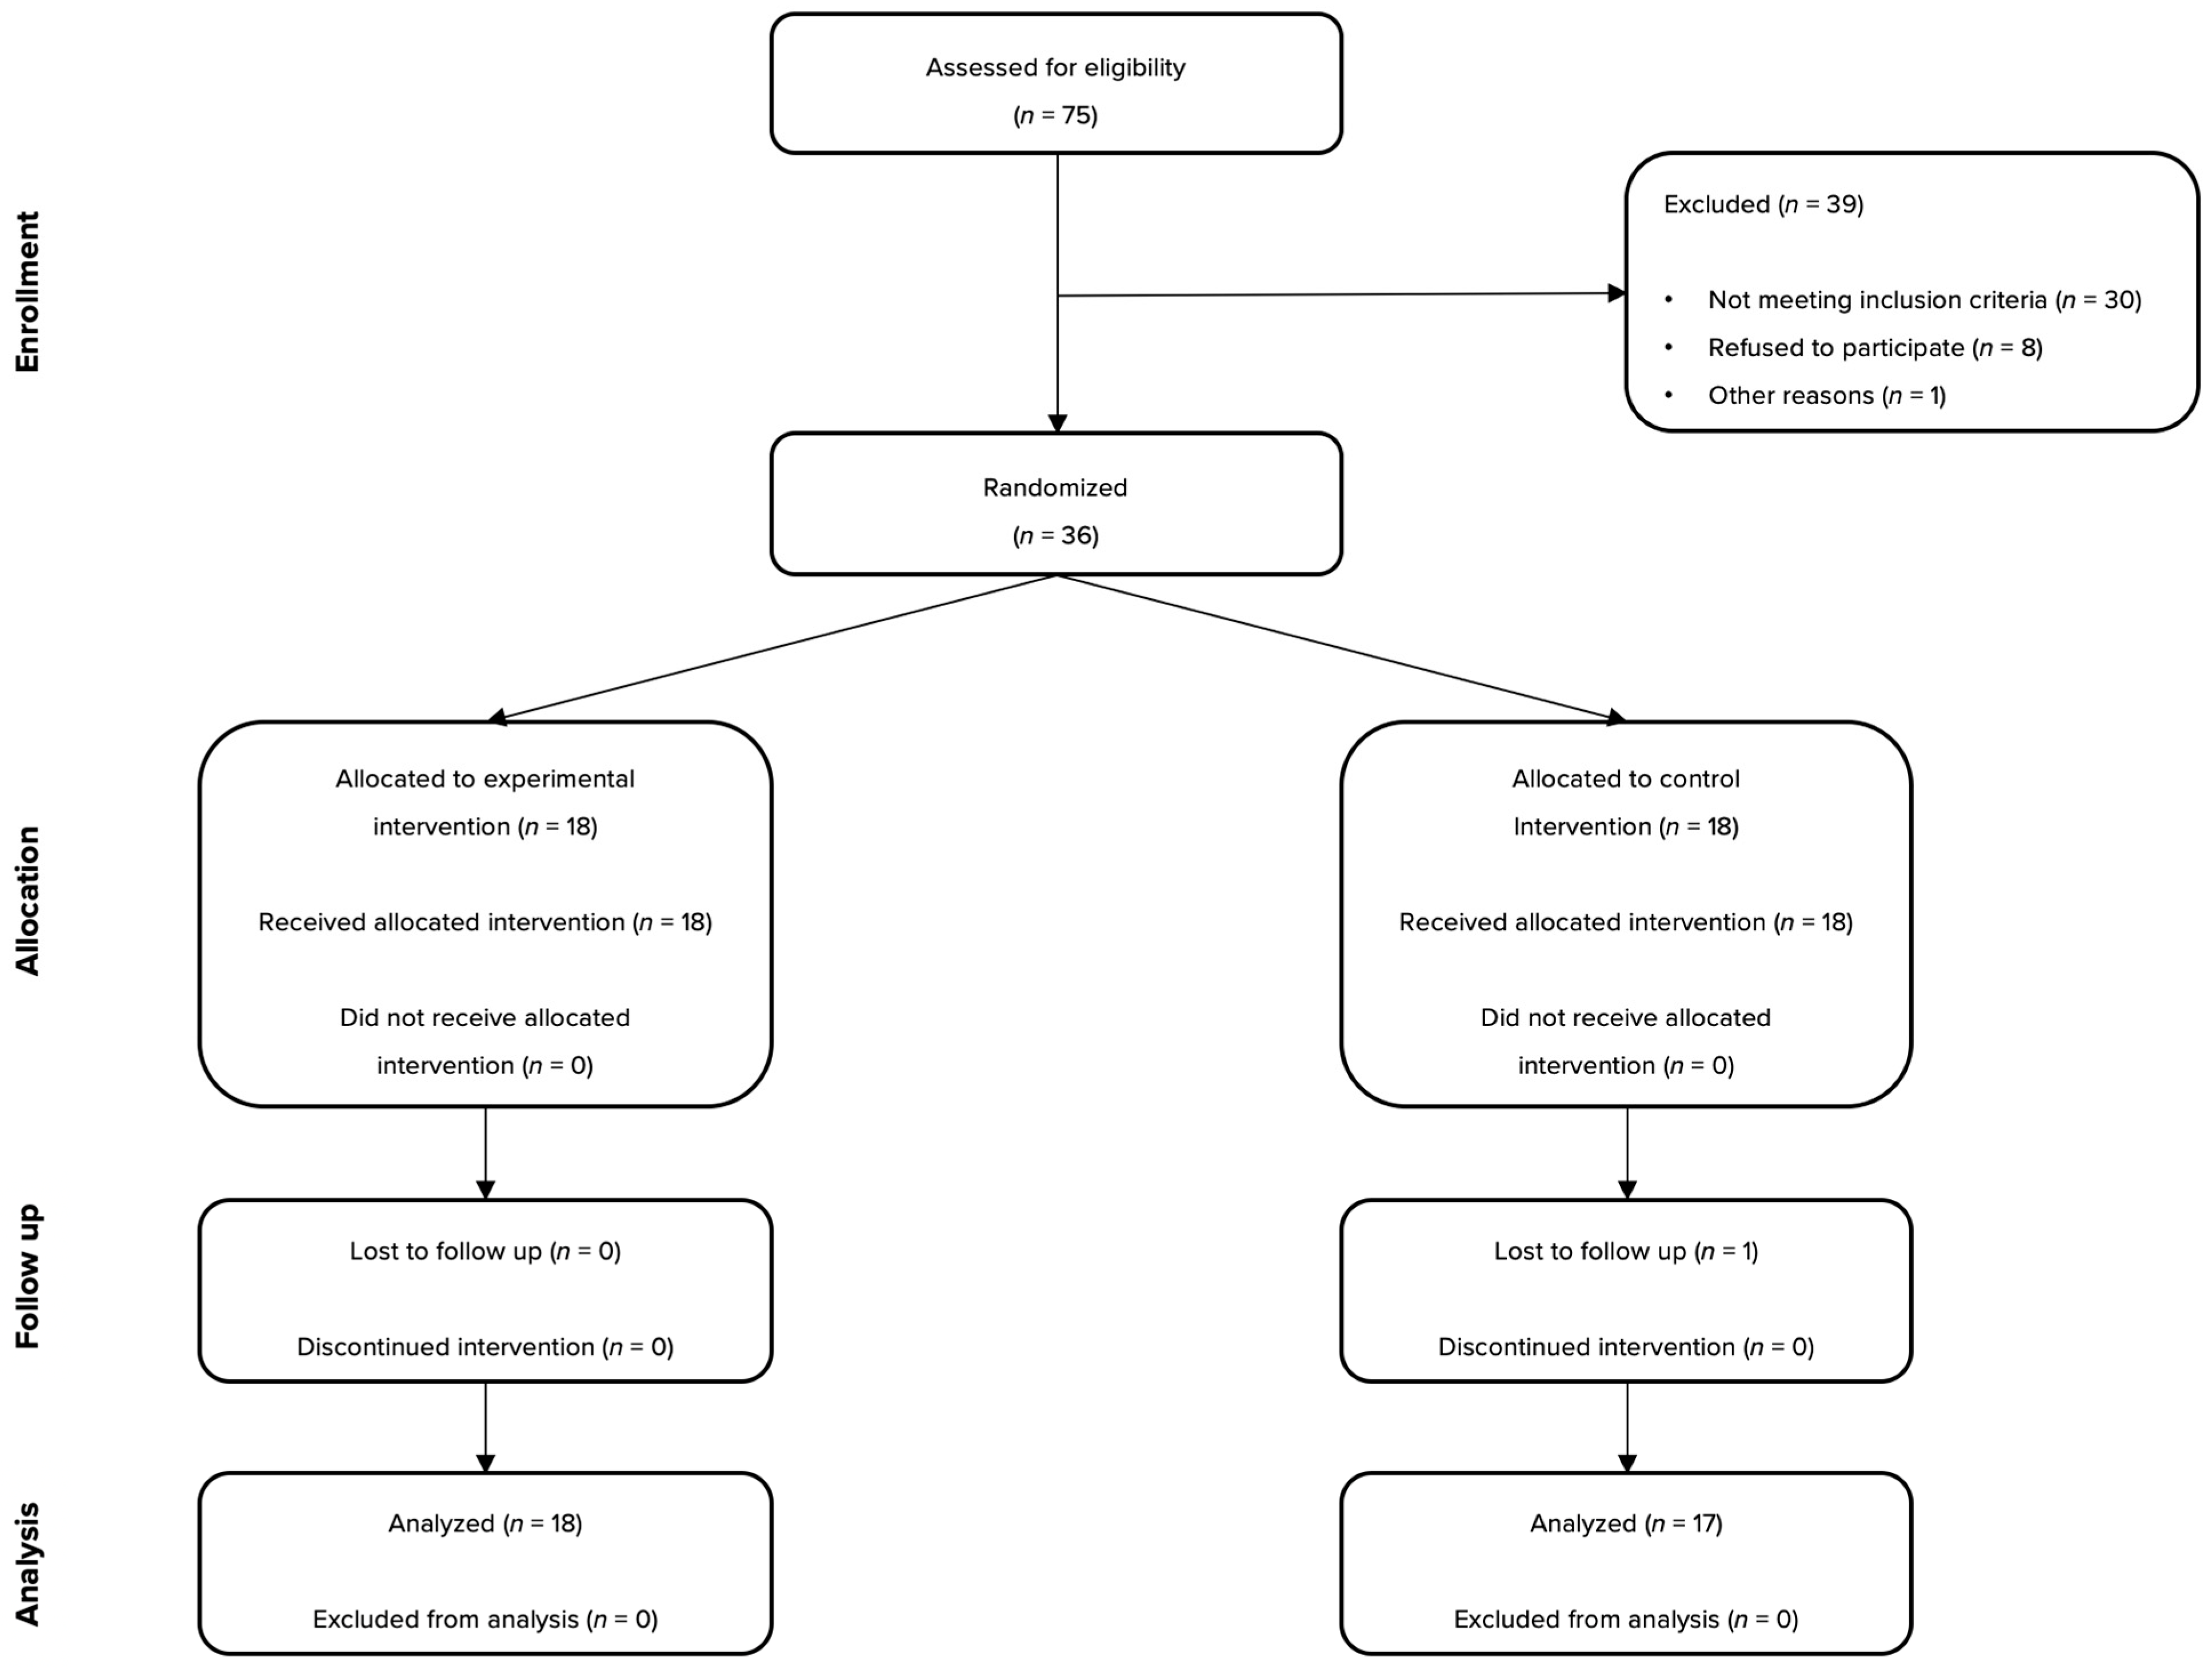
2.1. Participants
2.2. Interventions
2.3. Outcomes
2.4. Statistical Analyses
3. Results
4. Discussion
5. Conclusions
Author Contributions
Funding
Institutional Review Board Statement
Informed Consent Statement
Data Availability Statement
Acknowledgments
Conflicts of Interest
References
- Nakao, A.; Toyoda, Y.; Sharma, P.; Evans, M.; Guthrie, N. Effectiveness of hydrogen rich water on antioxidant status of subjects with potential metabolic syndrome-an open label pilot study. J. Clin. Biochem. Nutr. 2010, 46, 140–149. [Google Scholar] [CrossRef] [PubMed]
- Song, G.; Li, M.; Sang, H.; Zhang, L.; Li, X.; Yao, S.; Yu, Y.; Zong, C.; Xue, Y.; Qin, S. Hydrogen-rich water decreases serum LDL-cholesterol levels and improves HDL function in patients with potential metabolic syndrome. J. Lipid Res. 2013, 54, 1884–1893. [Google Scholar] [CrossRef] [PubMed]
- LeBaron, T.W.; Singh, R.B.; Fatima, G.; Kartikey, K.; Sharma, J.P.; Ostojic, S.M.; Gvozdjakova, A.; Kura, B.; Noda, M.; Mojto, V.; et al. The effects of 24-week, high-concentration hydrogen-rich water on body composition, blood lipid profiles and inflammation biomarkers in men and women with metabolic syndrome: A randomized controlled trial. Diabetes Metab. Syndr. Obes. 2020, 13, 889–896. [Google Scholar] [CrossRef] [PubMed]
- Kajiyama, S.; Hasegawa, G.; Asano, M.; Hosoda, H.; Fukui, M.; Nakamura, N.; Kitawaki, J.; Imai, S.; Nakano, K.; Ohta, M.; et al. Supplementation of hydrogen-rich water improves lipid and glucose metabolism in patients with type 2 diabetes or impaired glucose tolerance. Nutr. Res. 2008, 28, 137–143. [Google Scholar] [CrossRef] [PubMed]
- Asada, R.; Tazawa, K.; Sato, S.; Miwa, N. Effects of hydrogen-rich water prepared by alternating-current-electrolysis on antioxidant activity, DNA oxidative injuries, and diabetes-related markers. Med. Gas. Res. 2020, 10, 114–121. [Google Scholar] [CrossRef] [PubMed]
- Korovljev, D.; Stajer, V.; Ostojic, J.; LeBaron, T.W.; Ostojic, S.M. Hydrogen-rich water reduces liver fat accumulation and improves liver enzyme profiles in patients with non-alcoholic fatty liver disease: A randomized controlled pilot trial. Clin. Res. Hepatol. Gastroenterol. 2019, 43, 688–693. [Google Scholar] [CrossRef] [PubMed]
- Kura, B.; Szantova, M.; LeBaron, T.W.; Mojto, V.; Barancik, M.; Szeiffova Bacova, B.; Kalocayova, B.; Sykora, M.; Okruhlicova, L.; Tribulova, N.; et al. Biological effects of hydrogen water on subjects with NAFLD: A randomized, placebo-controlled trial. Antioxidants 2022, 11, 1935. [Google Scholar] [CrossRef] [PubMed]
- Sumbalová, Z.; Kucharská, J.; Rausová, Z.; Gvozdjáková, A.; Szántová, M.; Kura, B.; Mojto, V.; Slezák, J. The effect of adjuvant therapy with molecular hydrogen on endogenous coenzyme q10 levels and platelet mitochondrial bioenergetics in patients with non-alcoholic fatty liver disease. Int. J. Mol. Sci. 2023, 24, 12477. [Google Scholar] [CrossRef] [PubMed]
- Wu, F.; Ma, J.; Xue, J.; Jiang, X.; Liu, J.; Zhang, J.; Xue, Y.; Liu, B.; Qin, S. Effects of hydrogen-rich water on blood uric acid in patients with hyperuricemia: A randomized placebo-controlled trial. Heliyon 2024, 10, e36401. [Google Scholar] [CrossRef] [PubMed]
- Korovljev, D.; Trivic, T.; Drid, P.; Ostojic, S.M. Molecular hydrogen affects body composition, metabolic profiles, and mitochondrial function in middle-aged overweight women. Ir. J. Med. Sci. 2018, 187, 85–89. [Google Scholar] [CrossRef] [PubMed]
- Korovljev, D.; Javorac, D.; Todorovic, N.; Ranisavljev, M. The effects of 12-week hydrogen-rich water intake on body composition, short-chain fatty acids turn- over, and brain metabolism in overweight adults: A randomized controlled trial. Curr. Top. Nutraceutical Res. 2023, 21, 235–241. [Google Scholar] [CrossRef]
- Xie, F.; Song, Y.; Yi, Y.; Jiang, X.; Ma, S.; Ma, C.; Li, J.; Zhanghuang, Z.; Liu, M.; Zhao, P.; et al. Therapeutic potential of molecular hydrogen in metabolic diseases from bench to bedside. Pharmaceuticals 2023, 16, 541. [Google Scholar] [CrossRef] [PubMed]
- Chen, Y.; Wei, Y.; Tang, W. The role of hydrogen in the prevention and treatment of coronary atherosclerotic heart disease. Eur. J. Pharmacol. 2024, 972, 176586. [Google Scholar] [CrossRef] [PubMed]
- Russell, G. Theoretical evaluation of the biological activity of hydrogen. Med. Gas Res. 2025, 15, 266–275. [Google Scholar] [CrossRef] [PubMed]
- Ostojic, S.M. Hydrogen as a potential therapeutic in obesity: Targeting the brain. Trends Endocrinol. Metab. 2021, 32, 191–193. [Google Scholar] [CrossRef] [PubMed]
- Korovljev, D.; Todorovic, N.; Ranisavljev, M.; Andjelic, B.; Kladar, N.; Stajer, V.; Ostojic, S.M. Hydrogen-rich water upregulates fecal propionic acid levels in overweight adults. Nutrition 2023, 116, 112200. [Google Scholar] [CrossRef] [PubMed]
- Meule, A. Twenty years of the food cravings questionnaires: A comprehensive review. Curr. Addict. Rep. 2020, 7, 30–43. [Google Scholar] [CrossRef]
- Kolotkin, R.L.; Williams, V.S.L.; Ervin, C.M.; Williams, N.; Meincke, H.H.; Qin, S.; von Huth Smith, L.; Fehnel, S.E. Validation of a new measure of quality of life in obesity trials: Impact of Weight on Quality of Life-Lite Clinical Trials Version. Clin. Obes. 2019, 9, e12310. [Google Scholar] [CrossRef] [PubMed]
- Buysse, D.J.; Reynolds, C.F., 3rd; Monk, T.H.; Berman, S.R.; Kupfer, D.J. The Pittsburgh Sleep Quality Index: A new instrument for psychiatric practice and research. Psychiatry Res. 1989, 28, 193–213. [Google Scholar] [CrossRef] [PubMed]
- Yao, L.; Davidson, E.A.; Shaikh, M.W.; Forsyth, C.B.; Prenni, J.E.; Broeckling, C.D. Quantitative analysis of short-chain fatty acids in human plasma and serum by GC-MS. Anal. Bioanal. Chem. 2022, 414, 4391–4399. [Google Scholar] [CrossRef] [PubMed]
- Matsumoto, A.; Yamafuji, M.; Tachibana, T.; Nakabeppu, Y.; Noda, M.; Nakaya, H. Oral ‘hydrogen water’ induces neuroprotective ghrelin secretion in mice. Sci. Rep. 2013, 3, 3273. [Google Scholar] [CrossRef] [PubMed]
- Zheng, W.; Ji, X.; Zhang, Q.; Du, W.; Wei, Q.; Yao, W. Hydrogen-rich water and lactulose protect against growth suppression and oxidative stress in female piglets fed Fusarium toxins contaminated diets. Toxins 2018, 10, 228. [Google Scholar] [CrossRef] [PubMed]
- Steinert, R.E.; Mueller, M.; Serra, M.; Lehner-Sigrist, S.; Frost, G.; Gero, D.; Gerber, P.A.; Bueter, M. Effect of inulin on breath hydrogen, postprandial glycemia, gut hormone release, and appetite perception in RYGB patients: A prospective, randomized, cross-over pilot study. Nutr. Diabetes 2024, 14, 9. [Google Scholar] [CrossRef] [PubMed]
- McCarty, M.F. Potential ghrelin-mediated benefits and risks of hydrogen water. Med. Hypotheses 2015, 84, 350–355. [Google Scholar] [CrossRef] [PubMed]
- Kamimura, N.; Nishimaki, K.; Ohsawa, I.; Ohta, S. Molecular hydrogen improves obesity and diabetes by inducing hepatic FGF21 and stimulating energy metabolism in db/db mice. Obesity 2011, 19, 1396–1403. [Google Scholar] [CrossRef] [PubMed]
- Iio, A.; Ito, M.; Itoh, T.; Terazawa, R.; Fujita, Y.; Nozawa, Y.; Ohsawa, I.; Ohno, K.; Ito, M. Molecular hydrogen attenuates fatty acid uptake and lipid accumulation through downregulating CD36 expression in HepG2 cells. Med. Gas Res. 2013, 3, 6. [Google Scholar] [CrossRef] [PubMed]
- Xiao, L.; Miwa, N. Hydrogen-rich water prevents dehydration-induced cellular oxidative stress and cell death in human skin keratinocytes. Hydrogen 2022, 3, 62–71. [Google Scholar] [CrossRef]
- Hou, C.; Peng, Y.; Qin, C.; Fan, F.; Liu, J.; Long, J. Hydrogen-rich water improves cognitive impairment gender-dependently in APP/PS1 mice without affecting Aβ clearance. Free. Radic. Res. 2018, 52, 1311–1322. [Google Scholar] [CrossRef] [PubMed]
- Chambers, E.S.; Morrison, D.J.; Frost, G. Control of appetite and energy intake by SCFA: What are the potential underlying mechanisms? Proc. Nutr. Soc. 2015, 74, 328–336. [Google Scholar] [CrossRef] [PubMed]
- Tian, Z.; Zhuang, X.; Luo, M.; Yin, W.; Xiong, L. The propionic acid and butyric acid in serum but not in feces are increased in patients with diarrhea-predominant irritable bowel syndrome. BMC Gastroenterol. 2020, 20, 73. [Google Scholar] [CrossRef] [PubMed]
- Ostojic, S.M. Does drinking water rich in hydrogen gas revive brain hypometabolism in neurodegeneration by SCFAs upregulation? Eur. J. Clin. Nutr. 2021, 75, 212–213. [Google Scholar] [CrossRef] [PubMed]
- Xie, F.; Jiang, X.; Yi, Y.; Liu, Z.J.; Ma, C.; He, J.; Xun, Z.M.; Wang, M.; Liu, M.Y.; Mawulikplimi Adzavon, Y.; et al. Different effects of hydrogen-rich water intake and hydrogen gas inhalation on gut microbiome and plasma metabolites of rats in health status. Sci. Rep. 2022, 12, 7231. [Google Scholar] [CrossRef] [PubMed]
- Liang, B.; Shi, L.; Du, D.; Li, H.; Yi, N.; Xi, Y.; Cui, J.; Li, P.; Kang, H.; Noda, M.; et al. Hydrogen-rich water ameliorates metabolic disorder via modifying gut microbiota in impaired fasting glucose patients: A randomized controlled study. Antioxidants 2023, 12, 1245. [Google Scholar] [CrossRef] [PubMed]
- Shah, M.; Vella, A. Effects of GLP-1 on appetite and weight. Rev. Endocr. Metab. Disord. 2014, 15, 181–187. [Google Scholar] [CrossRef] [PubMed]
- Kuhre, R.E.; Deacon, C.F.; Holst, J.J.; Petersen, N. What Is an L-Cell and How Do We Study the Secretory Mechanisms of the L-Cell? Front. Endocrinol. 2021, 12, 694284. [Google Scholar] [CrossRef] [PubMed]
- Weinberg Sibony, R.; Segev, O.; Dor, S.; Raz, I. Overview of oxidative stress and inflammation in diabetes. J. Diabetes 2024, 16, e70014. [Google Scholar] [CrossRef] [PubMed]
- Christensen, P.; Meinert Larsen, T.; Westerterp-Plantenga, M.; Macdonald, I.; Martinez, J.A.; Handjiev, S.; Poppitt, S.; Hansen, S.; Ritz, C.; Astrup, A.; et al. Men and women respond differently to rapid weight loss: Metabolic outcomes of a multi-centre intervention study after a low-energy diet in 2500 overweight, individuals with pre-diabetes (PREVIEW). Diabetes Obes. Metab. 2018, 20, 2840–2851. [Google Scholar] [CrossRef] [PubMed]
- Susanto, A.; Burk, J.; Hocking, S.; Markovic, T.; Gill, T. Differences in weight loss outcomes for males and females on a low-carbohydrate diet: A systematic review. Obes. Res. Clin. Pract. 2022, 16, 447–456. [Google Scholar] [CrossRef] [PubMed]
- Todorovic, N.; Fernández-Landa, J.; Santibañez, A.; Kura, B.; Stajer, V.; Korovljev, D.; Ostojic, S.M. The Effects of Hydrogen-Rich Water on Blood Lipid Profiles in Clinical Populations: A Systematic Review and Meta-Analysis. Pharmaceuticals 2023, 16, 142. [Google Scholar] [CrossRef] [PubMed]
- Beccuti, G.; Pannain, S. Sleep and obesity. Curr. Opin. Clin. Nutr. Metab. Care 2011, 14, 402–412. [Google Scholar] [CrossRef] [PubMed]
- Vincent, S.M.; Madani, M.; Dikeman, D.; Golden, K.; Crocker, N.; Jackson, C.; Wimmer, S.P.; Dover, M.; Tucker, A.; Ghiani, C.A.; et al. Hydrogen-rich water improves sleep consolidation and enhances forebrain neuronal activation in mice. Sleep Adv. 2023, 5, zpad057. [Google Scholar] [CrossRef] [PubMed]
- Wu, F.; Liang, T.; Liu, Y.; Wang, C.; Sun, Y.; Wang, B. Effects of perioperative hydrogen inhalation on brain edema and prognosis in patients with glioma: A single-center, randomized controlled study. Front. Neurol. 2024, 15, 1413904. [Google Scholar] [CrossRef] [PubMed]
- Todorovic, N.; Zanini, D.; Stajer, V.; Korovljev, D.; Ostojic, J.; Ostojic, S.M. Hydrogen-rich water and caffeine for alertness and brain metabolism in sleep-deprived habitual coffee drinkers. Food Sci. Nutr. 2021, 9, 5139–5145. [Google Scholar] [CrossRef] [PubMed]
- Helgesen, E.H.; Ulevåg, R.; Solheim, T.S.; Thronæs, M.; Jakobsen, G.; Løhre, E.T.; Balstad, T.R.; Vagnildhaug, O.M. Appetite Loss in Patients with Advanced Cancer Treated at an Acute Palliative Care Unit. Curr. Oncol. 2024, 31, 6061–6072. [Google Scholar] [CrossRef] [PubMed]
- Gould, A.L.; Davies, G.M.; Alemao, E.; Yin, D.D.; Cook, J.R. Cholesterol reduction yields clinical benefits: Meta-analysis including recent trials. Clin. Ther. 2007, 29, 778–794. [Google Scholar] [CrossRef] [PubMed]

| Mean ± SD | Min–Max | |
|---|---|---|
| Age (years) | 42.1 ± 13.2 | 20–62 |
| Female (%) | 66.7 | - |
| Weight (kg) | 89.2 ± 17.6 | 61.6–141.1 |
| Body mass index (kg/m2) | 30.8 ± 4.2 | 24.0–42.1 |
| Waist circumference (cm) | 94.7 ± 11.6 | 74.0–122.5 |
| Body fat percentage (%) | 34.4 ± 7.0 | 25.0–47.5 |
| Blood glucose (mmol/L) | 5.47 ± 0.60 | 4.61–7.39 |
| Total cholesterol (mmol/L) | 5.33 ± 1.01 | 3.58–7.20 |
| LDL cholesterol (mmol/L) | 3.26 ± 0.90 | 1.87–5.44 |
| HDL cholesterol (mmol/L) | 1.46 ± 0.44 | 0.86–2.85 |
| Triglycerides (mmol/L) | 1.51 ± 1.43 | 0.59–8.67 |
| Group | Baseline | Follow-Up | Delta | 95% CI | p † | Cohen’s d | p ‡ | ηp2 | |
|---|---|---|---|---|---|---|---|---|---|
| Intense desire to eat | |||||||||
| Total | HRW CON | 12.9 ± 4.4 12.2 ± 3.4 | 11.2 ± 4.5 11.5 ± 2.9 | 1.8 ± 3.0 0.6 ± 3.4 | 0.3–3.3 −1.1–2.4 | 0.01 0.22 | 0.38 0.22 | 0.30 | 0.07 |
| Female | HRW CON | 13.7 ± 4.3 11.4 ± 3.9 | 11.5 ± 4.0 11.2 ± 3.1 | 2.2 ± 2.7 0.2 ± 4.1 | 0.5–3.9 −2.6–3.0 | 0.01 0.44 | 0.53 0.06 | 0.26 | 0.12 |
| Male | HRW CON | 11.3 ± 4.5 13.7 ± 1.6 | 10.3 ± 5.9 12.2 ± 2.5 | 1.0 ± 3.5 1.5 ± 1.4 | −2.7–4.7 0.0–3.0 | 0.26 0.02 | 0.19 0.72 | 0.70 | 0.03 |
| Anticipation of positive reinforcement from eating | |||||||||
| Total | HRW CON | 11.8 ± 4.0 11.3 ± 3.2 | 10.6 ± 4.4 10.6 ± 2.4 | 1.2 ± 2.7 0.6 ± 2.5 | −0.1–2.5 −0.7–1.9 | 0.04 0.15 | 0.28 0.25 | 0.64 | 0.01 |
| Female | HRW CON | 12.4 ± 3.8 10.1 ± 3.0 | 11.5 ± 4.3 10.2 ± 2.6 | 0.9 ± 3.1 −0.1 ± 2.4 | −1.1–2.9 −1.7–1.5 | 0.16 0.45 | 0.22 0.04 | 0.53 | 0.04 |
| Male | HRW CON | 10.7 ± 4.3 13.5 ± 2.5 | 8.8 ± 4.4 11.5 ± 1.8 | 1.8 ± 1.8 2.0 ± 2.3 | −0.1–3.7 −0.4–4.4 | 0.03 0.04 | 0.44 0.92 | 0.88 | 0.01 |
| Expectation of relief from negative emotional states through eating | |||||||||
| Total | HRW CON | 11.1 ± 4.4 9.5 ± 2.8 | 10.0 ± 3.5 9.6 ± 2.8 | 1.1 ± 2.1 −0.1 ± 2.5 | 0.1–2.1 −1.4–1.2 | 0.02 0.46 | 0.28 0.04 | 0.16 | 0.12 |
| Female | HRW CON | 11.6 ± 4.1 9.7 ± 2.9 | 10.4 ± 3.4 10.2 ± 2.7 | 1.2 ± 2.4 −0.5 ± 3.0 | −0.3–2.7 −2.5–1.5 | 0.06 0.31 | 0.32 0.18 | 0.19 | 0.17 |
| Male | HRW CON | 10.3 ± 5.2 9.2 ± 2.9 | 9.3 ± 3.9 8.5 ± 3.0 | 1.0 ± 1.7 0.7 ± 1.4 | −0.8–2.8 −0.8–2.2 | 0.10 0.14 | 0.22 0.24 | 0.66 | 0.04 |
| Lack of control over eating behaviors | |||||||||
| Total | HRW CON | 10.5 ± 4.1 10.0 ± 2.7 | 9.6 ± 4.1 9.8 ± 2.7 | 0.9 ± 2.8 0.2 ± 2.2 | −0.5–2.3 −0.9–1.3 | 0.09 0.38 | 0.22 0.07 | 0.41 | 0.04 |
| Female | HRW CON | 11.3 ± 3.8 9.8 ± 3.1 | 10.1 ± 3.7 10.0 ± 3.1 | 1.2 + 3.1 −0.2 ± 1.9 | −0.8–3.2 −1.5–1.1 | 0.11 0.38 | 0.32 0.07 | 0.17 | 0.18 |
| Male | HRW CON | 9.0 ± 4.6 10.3 ± 2.1 | 8.5 ± 4.9 9.5 ± 2.1 | 0.5 ± 2.4 0.8 ± 2.9 | −2.0–3.0 −2.2–3.8 | 0.32 0.25 | 0.11 0.38 | 0.82 | 0.01 |
| Cravings as a physiological state | |||||||||
| Total | HRW CON | 11.8 ± 2.9 10.4 ± 3.6 | 9.5 ± 4.3 10.5 ± 2.6 | 2.3 ± 3.3 −0.1 ± 3.2 | 0.7–3.9 −1.7–1.5 | <0.01 0.47 | 0.63 0.03 | 0.05 | 0.22 |
| Female | HRW CON | 11.7 ± 3.0 10.4 ± 3.8 | 9.2 ± 3.7 10.9 ± 2.8 | 2.5 ± 3.3 −0.5 ± 3.7 | 0.4–4.6 −3.0–2.0 | 0.01 0.32 | 0.74 0.15 | 0.05 | 0.33 |
| Male | HRW CON | 11.8 ± 3.1 10.5 ± 3.5 | 10.0 ± 5.6 9.7 ± 2.3 | 1.8 ± 3.6 0.8 ± 1.8 | −2.0–5.6 −1.1–2.7 | 0.13 0.16 | 0.40 0.27 | 0.47 | 0.11 |
| Total score | |||||||||
| Total | HRW CON | 58.2 ± 17.1 53.3 ± 12.7 | 50.8 ± 18.9 52.0 ± 11.0 | 7.4 ± 5.6 1.3 ± 10.0 | 4.6–10.2 −3.8–6.4 | <0.01 0.29 | 0.41 0.11 | 0.05 | 0.21 |
| Female | HRW CON | 60.7 ± 16.0 51.3 ± 14.1 | 52.7 ± 17.1 52.4 ± 11.8 | 8.0 ± 4.5 −1.1 ± 11.0 | 5.1–10.9 −8.5–6.3 | <0.01 0.37 | 0.48 0.09 | 0.03 | 0.41 |
| Male | HRW CON | 53.1 ± 19.6 57.1 ± 9.6 | 46.9 ± 23.5 51.3 ± 10.1 | 6.2 ± 7.8 5.8 ± 6.4 | −2.0–14.4 −0.9–12.5 | 0.06 0.04 | 0.29 0.59 | 0.89 | 0.01 |
| Group | Baseline | Follow-Up | Delta | 95% CI | p † | Cohen’s d | p ‡ | ηp2 | |
|---|---|---|---|---|---|---|---|---|---|
| Weight (kg) | |||||||||
| Total | HRW CON | 90.0 ± 19.3 88.3 ± 16.5 | 89.4 ± 19.0 88.2 ± 17.1 | 0.6 ± 2.0 0.0 ± 1.3 | −0.4–1.6 −0.7–0.7 | 0.26 0.46 | 0.03 0.01 | 0.41 | 0.04 |
| Female | HRW CON | 81.7 ± 13.5 79.8 ± 13.6 | 81.8 ± 13.2 79.7 ± 13.9 | −0.2 ± 1.4 0.1 ± 1.5 | −1.1–0.7 −0.9–1.1 | 0.36 0.44 | 0.01 0.01 | 0.77 | 0.01 |
| Male | HRW CON | 106.7 ± 19.1 103.9 ± 9.2 | 104.7 ± 20.6 103.9 ± 9.4 | 2.0 ± 2.4 0.0 ± 0.7 | −0.5–4.5 −0.7–0.7 | 0.05 0.44 | 0.10 0.00 | 0.07 | 0.52 |
| Body mass index (kg/m2) | |||||||||
| Total | HRW CON | 30.9 ± 4.3 30.4 ± 4.5 | 30.9 ± 4.4 30.2 ± 3.9 | 0.0 ± 0.8 0.2 ± 1.1 | −0.4–0.4 −0.4–0.8 | 0.49 0.21 | 0.01 0.05 | 0.34 | 0.06 |
| Female | HRW CON | 30.4 ± 3.8 29.5 ± 5.3 | 30.5 ± 3.8 29.1 ± 4.3 | −0.1 ± 0.7 0.3 ± 1.3 | −0.5–0.3 −0.6–1.2 | 0.26 0.22 | 0.03 0.08 | 0.44 | 0.06 |
| Male | HRW CON | 32.0 ± 5.2 32.1 ± 2.2 | 31.7 ± 5.7 32.0 ± 2.3 | 0.3 ± 1.1 0.0 ± 0.4 | −0.9–1.5 −0.4–0.4 | 0.27 0.41 | 0.06 0.04 | 0.54 | 0.08 |
| Waist circumference (cm) | |||||||||
| Total | HRW CON | 96.0 ± 12.5 93.4 ± 11.2 | 96.0 ± 12.7 93.3 ± 11.6 | 0.0 ± 3.0 0.1 ± 2.4 | −1.5–1.5 −1.1–1.3 | 0.49 0.46 | 0.01 0.06 | 0.82 | 0.01 |
| Female | HRW CON | 91.2 ± 10.9 88.6 ± 9.7 | 91.5 ± 11.2 88.8 ± 9.3 | −0.3 ± 2.3 −0.2 ± 2.0 | −1.8–1.2 −1.5–1.1 | 0.35 0.39 | 0.03 0.02 | 0.82 | 0.01 |
| Male | HRW CON | 105.4 ± 10.2 102.0 ± 9.2 | 105.0 ± 11.5 101.5 ± 11.5 | 0.5 ± 4.4 0.5 ± 3.2 | −4.1–5.1 −2.9–3.9 | 0.41 0.36 | 0.04 0.05 | 0.99 | 0.00 |
| Fat mass (%) | |||||||||
| Total | HRW CON | 35.0 ± 6.9 33.2 ± 7.2 | 34.6 ± 8.6 33.4 ± 6.8 | 0.4 ± 3.5 −0.2 ± 2.3 | −1.3–2.1 −1.4–1.0 | 0.31 0.40 | 0.05 0.02 | 0.53 | 0.03 |
| Female | HRW CON | 38.1 ± 4.4 36.8 ± 5.2 | 38.2 ± 6.3 36.7 ± 4.8 | 0.0 ± 3.7 0.1 ± 2.1 | −2.4–2.4 −1.3–1.5 | 0.48 0.45 | 0.02 0.02 | 0.46 | 0.06 |
| Male | HRW CON | 28.8 ± 7.0 26.7 ± 5.1 | 27.5 ± 8.6 27.2 ± 5.7 | 1.3 ± 3.0 −0.6 ± 2.9 | −1.8–4.4 −3.6–2.4 | 0.17 0.33 | 0.17 0.09 | 0.23 | 0.27 |
| Fat free mass (kg) | |||||||||
| Total | HRW CON | 60.0 ± 13.5 59.2 ± 14.3 | 59.8 ± 13.3 58.9 ± 14.1 | 0.2 ± 2.9 0.3 ± 2.4 | −1.2–1.6 −0.9–1.5 | 0.38 0.30 | 0.02 0.02 | 0.74 | 0.01 |
| Female | HRW CON | 52.5 ± 8.6 49.8 ± 6.0 | 53.2 ± 7.4 49.8 ± 6.3 | 0.2 ± 3.3 0.0 ± 1.5 | −1.9–2.3 −1.0–1.0 | 0.40 0.46 | 0.09 0.00 | 0.50 | 0.05 |
| Male | HRW CON | 75.0 ± 7.2 76.3 ± 6.5 | 74.9 ± 8.7 75.4 ± 6.6 | 0.1 ± 2.3 0.9 ± 3.6 | −2.3–2.5 −2.9–4.7 | 0.44 0.27 | 0.01 0.14 | 0.60 | 0.06 |
| Muscle mass (kg) | |||||||||
| Total | HRW CON | 26.8 ± 8.2 27.2 ± 8.4 | 26.7 ± 8.2 27.1 ± 8.2 | 0.1 ± 1.1 0.1 ± 1.0 | −0.4–0.6 −0.4–0.6 | 0.41 0.30 | 0.10 0.01 | 0.70 | 0.01 |
| Female | HRW CON | 21.5 ± 2.9 21.5 ± 2.6 | 21.5 ± 2.1 21.6 ± 2.8 | 0.0 ± 1.3 −0.1 ± 0.5 | −0.8–0.8 −0.4–0.2 | 0.46 0.32 | 0.00 0.04 | 0.51 | 0.05 |
| Male | HRW CON | 37.3 ± 3.7 37.7 ± 3.1 | 37.2 ± 4.3 37.2 ± 3.3 | 0.1 ± 0.8 0.5 ± 1.5 | −0.7–0.9 −1.2–2.1 | 0.39 0.23 | 0.03 0.16 | 0.52 | 0.09 |
| Total body water (L) | |||||||||
| Total | HRW CON | 45.6 ± 10.3 45.7 ± 10.6 | 45.3 ± 9.4 45.4 ± 10.5 | 0.3 ± 3.6 0.3 ± 2.7 | −1.5–2.1 −1.1–1.7 | 0.36 0.36 | 0.03 0.02 | 0.97 | 0.01 |
| Female | HRW CON | 40.3 ± 7.6 38.9 ± 5.5 | 39.8 ± 4.3 39.0 ± 6.0 | 0.6 ± 4.2 −0.1 ± 1.5 | −2.1–3.1 −1.1–0.9 | 0.32 0.39 | 0.08 0.02 | 0.59 | 0.03 |
| Male | HRW CON | 56.1 ± 5.9 58.0 ± 5.0 | 56.3 ± 6.6 57.1 ± 5.0 | −0.2 ± 2.2 0.5 ± 3.6 | −2.5–2.1 −3.3–4.3 | 0.41 0.38 | 0.03 0.18 | 0.58 | 0.07 |
| Intracellular water (L) | |||||||||
| Total | HRW CON | 25.3 ± 6.5 25.3 ± 6.9 | 25.3 ± 6.2 25.5 ± 6.7 | 0.1 ± 2.2 −0.2 ± 2.5 | −1.0–1.2 −1.5–1.1 | 0.45 0.38 | 0.01 0.03 | 0.78 | 0.01 |
| Female | HRW CON | 21.7 ± 4.3 20.7 ± 3.1 | 21.5 ± 2.5 21.4 ± 3.6 | 0.3 ± 2.5 −0.7 ± 2.0 | −1.3–1.9 −2.0–0.6 | 0.35 0.15 | 0.06 0.21 | 0.69 | 0.02 |
| Male | HRW CON | 32.5 ± 3.2 33.9 ± 3.1 | 32.9 ± 3.7 33.2 ± 3.2 | −0.4 ± 1.4 0.7 ± 3.2 | −1.9–1.1 −2.7–4.1 | 0.28 0.31 | 0.11 0.22 | 0.52 | 0.09 |
| Extracellular water (L) | |||||||||
| Total | HRW CON | 20.3 ± 3.9 20.1 ± 3.7 | 20.0 ± 3.3 20.0 ± 3.7 | 0.2 ± 1.5 0.1 ± 0.9 | −0.5–0.9 −0.4–0.6 | 0.25 0.28 | 0.07 0.04 | 0.98 | 0.01 |
| Female | HRW CON | 18.6 ± 3.3 17.9 ± 2.3 | 18.3 ± 1.9 17.8 ± 2.5 | 0.3 ± 1.7 0.1 ± 0.8 | −0.8–1.4 −0.4–0.6 | 0.28 0.38 | 0.11 0.04 | 0.61 | 0.03 |
| Male | HRW CON | 23.5 ± 2.8 24.2 ± 2.0 | 23.4 ± 3.0 23.9 ± 1.9 | 0.1 ± 1.2 0.2 ± 1.2 | −1.2–1.4 −1.1–1.5 | 0.39 0.33 | 0.03 0.15 | 0.87 | 0.01 |
| Protein mass (L) | |||||||||
| Total | HRW CON | 9.4 ± 3.8 9.8 ± 3.5 | 9.5 ± 3.5 9.7 ± 3.4 | −0.1 ± 0.8 0.2 ± 1.0 | −0.5–0.3 −0.3–0.7 | 0.28 0.27 | 0.03 0.04 | 0.33 | 0.06 |
| Female | HRW CON | 7.0 ± 1.5 7.7 ± 1.9 | 7.3 ± 1.0 7.5 ± 1.7 | −0.3 ± 0.8 0.2 ± 1.1 | −0.8–0.2 −0.5–0.9 | 0.12 0.30 | 0.24 0.11 | 0.50 | 0.05 |
| Male | HRW CON | 14.0 ± 2.1 13.6 ± 1.8 | 13.8 ± 2.7 13.5 ± 1.7 | 0.3 ± 0.7 0.1 ± 0.6 | −0.4–1.0 −0.5–0.7 | 0.19 0.38 | 0.08 0.06 | 0.77 | 0.02 |
| Mineral mass (L) | |||||||||
| Total | HRW CON | 3.6 ± 1.2 3.7 ± 1.1 | 3.6 ± 1.1 3.7 ± 1.0 | −0.1 ± 0.3 0.1 ± 0.4 | −0.2–0.0 −0.1–0.3 | 0.26 0.28 | 0.04 0.05 | 0.32 | 0.06 |
| Female | HRW CON | 2.9 ± 0.6 3.2 ± 0.8 | 3.0 ± 0.4 3.1 ± 0.7 | −0.1 ± 0.3 0.1 ± 0.5 | −0.3–0.1 −0.2–0.4 | 0.12 0.28 | 0.20 0.13 | 0.37 | 0.08 |
| Male | HRW CON | 4.9 ± 0.8 4.8 ± 0.6 | 4.8 ± 1.0 4.8 ± 0.6 | 0.1 ± 0.2 0.0 ± 0.2 | −0.1–0.3 −0.2–0.2 | 0.19 0.48 | 0.11 0.00 | 0.50 | 0.10 |
| Total body calcium (kg) | |||||||||
| Total | HRW CON | 1.2 ± 0.3 1.2 ± 0.3 | 1.2 ± 0.3 1.2 ± 0.3 | 0.0 ± 0.1 0.0 ± 0.5 | 0.0–0.0 −0.3–0.3 | 0.39 0.38 | 0.01 0.01 | 0.94 | 0.01 |
| Female | HRW CON | 1.0 ± 0.1 1.0 ± 0.1 | 1.0 ± 0.1 1.0 ± 0.1 | 0.0 ± 0.1 0.0 ± 0.3 | −0.1–0.1 −0.2–0.2 | 0.37 0.27 | 0.00 0.00 | 0.72 | 0.01 |
| Male | HRW CON | 1.6 ± 0.2 1.6 ± 0.1 | 1.6 ± 0.2 1.6 ± 0.2 | 0.0 ± 0.1 0.0 ± 0.1 | −0.1–0.1 −0.1–0.1 | 0.47 0.27 | 0.00 0.00 | 0.53 | 0.08 |
| Glycogen mass (kg) | |||||||||
| Total | HRW CON | 531 ± 126 538 ± 129 | 530 ± 123 534 ± 128 | 1.3 ± 25.9 3.7 ± 21.6 | −11.6–14.2 −7.4–14.8 | 0.41 0.24 | 0.01 0.03 | 0.60 | 0.02 |
| Female | HRW CON | 456 ± 64 454 ± 52 | 455 ± 45 453 ± 58 | 1.3 ± 28.8 1.0 ± 13.7 | −17.0–19.6 −8.2–10.2 | 0.44 0.41 | 0.02 0.02 | 0.39 | 0.07 |
| Male | HRW CON | 682 ± 66 694 ± 59 | 680 ± 79 685 ± 60 | 1.3 ± 21.1 8.7 ± 32.7 | −20.8–23.4 −25.6–43.0 | 0.44 0.27 | 0.03 0.15 | 0.60 | 0.06 |
| Group | Baseline | Follow-Up | Delta | 95% CI | p † | Cohen’s d | p ‡ | ηp2 | |
|---|---|---|---|---|---|---|---|---|---|
| Physical function (score) | |||||||||
| Total | HRW CON | 70.2 ± 16.2 79.4 ± 24.0 | 77.2 ± 14.3 82.5 ± 25.9 | −7.0 ± 13.0 −3.1 ± 9.2 | −13.5–−0.5 −7.8–1.6 | 0.02 0.09 | 0.46 0.12 | 0.30 | 0.07 |
| Female | HRW CON | 68.9 ± 17.5 75.4 ± 28.0 | 78.3 ± 15.6 80.8 ± 28.9 | −9.4 ± 12.2 −5.4 ± 8.6 | −17.2–−1.6 −11.2–0.4 | 0.01 0.03 | 0.57 0.19 | 0.42 | 0.07 |
| Male | HRW CON | 72.7 ± 14.2 86.7 ± 14.0 | 75.0 ± 12.2 85.6 ± 21.5 | −2.3 ± 14.3 1.1 ± 9.5 | −17.3–12.7 −8.9–11.1 | 0.36 0.39 | 0.17 0.06 | 0.61 | 0.06 |
| Self-esteem (score) | |||||||||
| Total | HRW CON | 68.7 ± 28.4 67.0 ± 27.4 | 72.8 ± 22.5 72.5 ± 27.5 | −4.1 ± 10.3 −5.5 ± 8.8 | −9.2–1.0 −10.0–−1.0 | 0.05 0.01 | 0.16 0.20 | 0.67 | 0.01 |
| Female | HRW CON | 62.5 ± 31.7 64.0 ± 31.2 | 69.6 ± 26.4 67.9 ± 32.2 | −7.1 ± 10.1 −3.9 ± 8.7 | −13.5–−0.7 −9.7–1.9 | 0.02 0.08 | 0.24 0.12 | 0.14 | 0.05 |
| Male | HRW CON | 81.0 ± 15.8 72.6 ± 20.9 | 79.1 ± 11.3 81.0 ± 14.9 | 1.9 ± 8.6 −8.3 ± 8.9 | −7.1–10.9 −17.6–1.0 | 0.31 0.04 | 0.14 0.46 | <0.01 | 0.87 |
| Sexual life (score) | |||||||||
| Total | HRW CON | 78.8 ± 21.7 88.6 ± 26.3 | 84.0 ± 19.3 91.5 ± 24.7 | −5.2 ± 12.0 −2.9 ± 14.2 | −11.2–0.8 −10.2–4.4 | 0.04 0.20 | 0.25 0.11 | 0.51 | 0.03 |
| Female | HRW CON | 74.5 ± 22.2 82.4 ± 31.5 | 81.8 ± 21.4 86.9 ± 30.2 | −7.3 ± 13.8 −4.5 ± 17.7 | −16.1–1.5 −16.4–7.4 | 0.05 0.21 | 0.34 0.15 | 0.34 | 0.03 |
| Male | HRW CON | 87.5 ± 19.4 100.0 ± 0.0 | 88.5 ± 15.0 100.0 ± 0.0 | −1.0 ± 6.1 0.0 ± 0.0 | −7.4–5.4 0.0–0.0 | 0.35 0.99 | 0.06 0.00 | 0.69 | 0.03 |
| Public distress (score) | |||||||||
| Total | HRW CON | 95.3 ± 7.8 92.1 ± 22.5 | 95.6 ± 9.8 92.4 ± 24.0 | −0.3 ± 4.0 −0.3 ± 4.5 | −2.3–1.7 −2.1–1.5 | 0.39 0.40 | 0.03 0.01 | 0.99 | 0.01 |
| Female | HRW CON | 95.0 ± 9.0 89.1 ± 28.2 | 95.0 ± 11.9 89.5 ± 29.8 | 0.0 ± 4.8 −0.5 ± 5.2 | −3.0–3.0 −4.0–3.0 | 0.50 0.39 | 0.00 0.01 | 0.99 | 0.02 |
| Male | HRW CON | 95.8 ± 4.9 97.5 ± 6.1 | 96.7 ± 4.1 97.5 ± 4.2 | −0.8 ± 2.0 0.0 ± 3.2 | −2.9–1.3 −3.4–3.4 | 0.18 0.50 | 0.20 0.00 | 0.61 | 0.06 |
| Work (score) | |||||||||
| Total | HRW CON | 94.4 ± 9.3 91.5 ± 24.8 | 91.3 ± 10.9 91.9 ± 24.1 | 3.1 ± 11.0 −0.4 ± 4.6 | −2.4–8.6 −2.8–2.0 | 0.12 0.36 | 0.31 0.02 | 0.18 | 0.11 |
| Female | HRW CON | 97.9 ± 4.1 88.1 ± 31.1 | 90.6 ± 11.5 89.2 ± 29.9 | 7.3 ± 9.5 −1.1 ± 3.8 | 1.3–13.3 −3.7–1.5 | 0.01 0.17 | 0.85 0.04 | 0.57 | 0.37 |
| Male | HRW CON | 87.5 ± 13.1 97.9 ± 3.2 | 92.7 ± 7.3 97.0 ± 5.1 | −5.2 ± 9.2 1.0 ± 6.0 | −14.9–4.5 −5.3–7.3 | 0.11 0.35 | 0.49 0.21 | 0.18 | 0.33 |
| Total scores (score) | |||||||||
| Total | HRW CON | 80.9 ± 13.1 83.7 ± 22.9 | 84.1 ± 12.5 86.2 ± 23.2 | −3.2 ± 5.4 −2.4 ± 5.2 | −5.9–−0.5 −5.1–0.3 | 0.01 0.04 | 0.25 0.11 | 0.69 | 0.01 |
| Female | HRW CON | 78.9 ± 14.1 79.8 ± 28.0 | 82.9 ± 14.3 82.9 ± 28.4 | −4.1 ± 5.8 −3.1 ± 6.3 | −7.8–−0.4 −7.2–1.1 | 0.02 0.07 | 0.28 0.11 | 0.66 | 0.02 |
| Male | HRW CON | 84.9 ± 10.7 91.0 ± 6.7 | 86.4 ± 8.5 92.2 ± 6.5 | −1.5 ± 4.6 −1.2 ± 2.3 | −6.3–3.3 −3.6–1.2 | 0.23 0.12 | 0.16 0.18 | 0.88 | 0.01 |
| Group | Baseline | Follow-Up | Delta | 95% CI | p † | Cohen’s d | p ‡ | ηp2 | |
|---|---|---|---|---|---|---|---|---|---|
| Subjective sleep quality | |||||||||
| Total | HRW CON | 1.7 ± 0.8 1.8 ± 0.9 | 0.7 ± 0.7 1.2 ± 0.7 | 1.0 ± 0.8 0.6 ± 0.8 | 0.6–1.4 0.2–1.0 | <0.01 <0.01 | 1.33 0.74 | 0.05 | 0.21 |
| Female | HRW CON | 1.8 ± 0.7 1.7 ± 0.8 | 0.6 ± 0.7 1.0 ± 0.6 | 1.3 ± 0.9 0.7 ± 0.6 | 0.7–1.9 0.3–1.1 | <0.01 <0.01 | 1.71 0.99 | 0.14 | 0.21 |
| Male | HRW CON | 1.5 ± 0.8 1.8 ± 1.2 | 1.0 ± 0.6 1.5 ± 0.5 | 0.5 ± 0.5 0.3 ± 1.0 | 0.0–1.0 −0.7–1.3 | 0.04 0.23 | 0.71 0.45 | 0.61 | 0.06 |
| Sleep latency | |||||||||
| Total | HRW CON | 1.6 ± 1.4 1.5 ± 1.3 | 0.9 ± 1.3 0.7 ± 0.9 | 0.7 ± 1.6 0.8 ± 1.1 | −0.1–1.5 0.2–1.4 | 0.05 0.01 | 0.52 0.72 | 0.91 | 0.00 |
| Female | HRW CON | 1.9 ± 1.5 1.3 ± 0.8 | 0.8 ± 1.3 0.5 ± 0.7 | 1.1 ± 1.6 0.7 ± 0.8 | 0.1–2.1 0.2–1.2 | 0.02 0.01 | 0.78 1.06 | 0.64 | 0.02 |
| Male | HRW CON | 1.0 ± 1.1 1.8 ± 1.8 | 1.3 ± 1.0 1.0 ± 1.3 | −0.3 ± 1.4 0.8 ± 1.7 | −1.9–1.3 −1.0–2.6 | 0.29 0.14 | 0.29 0.51 | 0.34 | 0.18 |
| Sleep duration | |||||||||
| Total | HRW CON | 0.8 ± 0.8 1.1 ± 1.2 | 0.8 ± 0.6 0.8 ± 0.9 | −0.1 ± 0.9 0.4 ± 0.7 | −0.5–0.3 0.0–0.8 | 0.40 0.03 | 0.00 0.28 | 0.07 | 0.20 |
| Female | HRW CON | 0.9 ± 0.9 1.2 ± 1.1 | 0.7 ± 0.7 0.6 ± 0.5 | 0.3 ± 1.0 0.5 ± 0.8 | −0.3–0.9 0.0–1.0 | 0.19 0.03 | 0.25 0.70 | 0.52 | 0.04 |
| Male | HRW CON | 0.5 ± 0.5 0.8 ± 1.3 | 1.2 ± 0.4 1.0 ± 1.4 | −0.7 ± 0.5 0.2 ± 0.5 | −1.2–−0.2 −0.3–0.7 | 0.01 0.99 | 1.54 0.15 | 0.07 | 0.60 |
| Sleep efficiency | |||||||||
| Total | HRW CON | 0.1 ± 0.2 0.4 ± 0.8 | 0.1 ± 0.3 0.5 ± 0.8 | −0.1 ± 0.5 −0.1 ± 0.6 | −0.3–0.1 −0.4–0.2 | 0.29 0.22 | 0.00 0.13 | 0.77 | 0.01 |
| Female | HRW CON | 0.1 ± 0.3 0.2 ± 0.3 | 0.2 ± 0.4 0.2 ± 0.4 | 0.1 ± 0.5 0.0 ± 0.6 | −0.2–0.4 −0.4–0.4 | 0.29 0.50 | 0.28 0.00 | 0.99 | 0.00 |
| Male | HRW CON | 0.0 ± 0.0 0.7 ± 1.2 | 0.0 ± 0.0 1.2 ± 1.1 | 0.0 ± 0.0 −0.3 ± 0.5 | 0.0–0.0 −0.8–0.2 | 0.99 0.09 | 0.00 0.43 | 0.18 | 0.40 |
| Sleep disturbance | |||||||||
| Total | HRW CON | 1.2 ± 0.5 1.3 ± 0.8 | 0.9 ± 0.5 1.2 ± 0.6 | 0.2 ± 0.5 0.1 ± 0.5 | 0.0–0.4 −0.2–0.4 | 0.05 0.17 | 0.60 0.14 | 0.54 | 0.02 |
| Female | HRW CON | 1.3 ± 0.5 1.3 ± 0.7 | 1.1 ± 0.5 1.3 ± 0.6 | 0.3 ± 0.6 0.0 ± 0.4 | −0.1–0.7 −0.3–0.3 | 0.10 0.50 | 0.40 0.00 | 0.19 | 0.16 |
| Male | HRW CON | 0.8 ± 0.4 1.3 ± 1.0 | 0.7 ± 0.5 1.0 ± 0.6 | 0.2 ± 0.4 0.3 ± 0.5 | −0.2–0.6 −0.2–0.8 | 0.18 0.09 | 0.22 0.36 | 0.61 | 0.06 |
| Use of sleep medication | |||||||||
| Total | HRW CON | 0.2 ± 0.7 0.4 ± 1.0 | 0.5 ± 1.0 0.4 ± 0.9 | −0.3 ± 0.8 0.0 ± 0.6 | −0.7–0.1 −0.3–0.3 | 0.07 0.50 | 0.35 0.00 | 0.24 | 0.09 |
| Female | HRW CON | 0.3 ± 0.9 0.4 ± 1.0 | 0.6 ± 1.0 0.3 ± 0.9 | −0.3 ± 0.7 0.1 ± 0.3 | −0.7–0.1 −0.1–0.3 | 0.05 0.17 | 0.32 0.11 | 0.05 | 0.33 |
| Male | HRW CON | 0.2 ± 0.4 0.5 ± 1.2 | 0.2 ± 0.4 0.7 ± 1.0 | 0.0 ± 0.0 −0.2 ± 1.0 | 0.0–0.0 −1.2–0.8 | 0.99 0.35 | 0.00 0.18 | 0.70 | 0.03 |
| Daytime dysfunction | |||||||||
| Total | HRW CON | 1.4 ± 0.7 1.1 ± 1.1 | 0.8 ± 0.5 0.6 ± 0.9 | 0.6 ± 0.9 0.5 ± 0.9 | 0.2–1.0 0.1–0.9 | 0.01 0.02 | 0.99 0.50 | 0.71 | 0.01 |
| Female | HRW CON | 1.4 ± 0.8 1.0 ± 1.1 | 0.8 ± 0.6 0.5 ± 0.9 | 0.6 ± 0.9 0.5 ± 1.1 | 0.0–1.2 −0.2–1.2 | 0.02 0.11 | 0.85 0.50 | 0.84 | 0.00 |
| Male | HRW CON | 1.3 ± 0.5 1.3 ± 1.2 | 0.7 ± 0.5 0.7 ± 0.8 | 0.7 ± 1.0 0.7 ± 0.5 | −0.3–1.7 0.2–1.2 | 0.09 0.01 | 1.20 0.59 | 0.99 | 0.00 |
| Total score | |||||||||
| Total | HRW CON | 6.9 ± 2.5 7.5 ± 4.9 | 4.8 ± 2.2 5.2 ± 4.1 | 2.2 ± 3.3 2.2 ± 2.5 | 0.6–3.8 0.9–3.5 | 0.01 <0.01 | 0.89 0.51 | 0.92 | 0.00 |
| Female | HRW CON | 7.8 ± 2.6 7.0 ± 3.2 | 4.8 ± 2.6 4.5 ± 3.1 | 3.0 ± 3.7 2.5 ± 2.1 | 0.6–5.4 1.1–3.9 | 0.01 <0.01 | 1.15 0.79 | 0.77 | 0.01 |
| Male | HRW CON | 5.3 ± 1.2 8.3 ± 7.3 | 4.8 ± 1.3 6.7 ± 5.6 | 0.5 ± 1.6 1.7 ± 3.3 | −1.2–2.2 −1.8–5.2 | 0.24 0.14 | 0.40 0.25 | 0.51 | 0.09 |
| Group | Baseline | Follow-Up | Delta | 95% CI | p † | Cohen’s d | p ‡ | ηp2 | |
|---|---|---|---|---|---|---|---|---|---|
| GLP-1 (pg/mL) | |||||||||
| Total | HRW CON | 69.3 ± 50.7 80.6 ± 70.5 | 86.2 ± 65.4 78.1 ± 51.2 | −16.9 ± 40.1 2.4 ± 37.0 | −36.8–3.0 −16.6–21.4 | 0.05 0.40 | 0.29 0.04 | 0.05 | 0.20 |
| Female | HRW CON | 60.9 ± 47.3 70.2 ± 75.6 | 88.5 ± 70.7 74.2 ± 61.2 | −27.6 ± 43.2 −4.0 ± 30.4 | −55.0–−0.2 −16.4–24.4 | 0.02 0.34 | 0.36 0.21 | 0.09 | 0.25 |
| Male | HRW CON | 86.6 ± 56.7 99.6 ± 61.7 | 81.4 ± 59.7 85.4 ± 28.5 | 5.2 ± 22.2 14.1 ± 47.8 | −18.1–28.5 −36.1–64.3 | 0.30 0.25 | 0.09 0.29 | 0.58 | 0.07 |
| Acetic acid (µg/mL) | |||||||||
| Total | HRW CON | 3.35 ± 1.01 3.11 ± 0.72 | 3.03 ± 0.85 2.76 ± 0.64 | 0.32 ± 1.05 0.35 ± 0.90 | −0.31–0.95 −0.09–0.79 | 0.11 0.06 | 0.34 0.52 | 0.95 | <0.01 |
| Female | HRW CON | 3.12 ± 0.76 3.10 ± 0.52 | 2.73 ± 0.52 2.87 ± 0.47 | 0.39 ± 0.92 0.23 ± 0.70 | −0.16–0.94 −0.21–0.67 | 0.09 0.16 | 0.60 0.46 | 0.65 | 0.02 |
| Male | HRW CON | 3.81 ± 1.34 3.14 ± 1.06 | 3.63 ± 1.11 2.55 ± 0.90 | 0.18 ± 1.35 0.59 ± 1.23 | −1.30–1.76 | 0.38 0.15 | 0.14 0.60 | 0.43 | 0.13 |
| Propionic acid (µg/mL) | |||||||||
| Total | HRW CON | 0.37 ± 0.20 0.31 ± 0.07 | 0.23 ± 0.05 0.22 ± 0.05 | 0.14 ± 0.20 0.09 ± 0.09 | 0.04–0.24 0.05–0.13 | 0.01 <0.01 | 0.91 1.51 | 0.30 | 0.07 |
| Female | HRW CON | 0.30 ± 0.09 0.31 ± 0.06 | 0.23 ± 0.05 0.23 ± 0.03 | 0.07 ± 0.11 0.08 ± 0.08 | 0.01–0.13 0.04–0.12 | 0.02 <0.01 | 0.99 1.64 | 0.89 | <0.01 |
| Male | HRW CON | 0.50 ± 0.31 0.32 ± 0.09 | 0.24 ± 0.03 0.21 ± 0.07 | 0.26 ± 0.30 0.11 ± 0.11 | −0.02–0.54 0.01–0.21 | 0.04 0.03 | 1.20 1.35 | 0.20 | 0.31 |
| Butyric acid (µg/mL) | |||||||||
| Total | HRW CON | 1.52 ± 0.49 1.42 ± 0.45 | 1.03 ± 0.29 0.97 ± 0.26 | 0.49 ± 0.48 0.45 ± 0.56 | 0.22–0.76 0.19–0.71 | <0.01 <0.01 | 1.96 1.22 | 0.72 | 0.01 |
| Female | HRW CON | 1.45 ± 0.26 1.39 ± 0.31 | 1.10 ± 0.30 1.00 ± 0.27 | 0.35 ± 0.29 0.39 ± 0.42 | 0.11–0.59 0.13–0.65 | <0.01 0.01 | 1.60 1.36 | 0.91 | <0.01 |
| Male | HRW CON | 1.66 ± 0.79 1.48 ± 0.67 | 0.90 ± 0.23 0.93 ± 0.25 | 0.75 ± 0.69 0.55 ± 0.81 | 0.01–1.51 −0.10–1.20 | 0.02 0.08 | 2.79 1.09 | 0.58 | 0.07 |
| Breath hydrogen (ppm) | |||||||||
| Total | HRW CON | 34 ± 29 29 ± 31 | 28 ± 30 26 ± 26 | 6 ± 45 3 ± 42 | −16–28 −19–25 | 0.28 0.38 | 0.21 0.10 | 0.76 | 0.01 |
| Female | HRW CON | 36 ± 32 21 ± 24 | 23 ± 18 27 ± 32 | 14 ± 41 6 ± 38 | −12–40 −20–32 | 0.14 0.31 | 0.52 0.21 | 0.26 | 0.13 |
| Male | HRW CON | 30 ± 24 44 ± 38 | 39 ± 45 24 ± 15 | 9 ± 52 20 ± 47 | −46–64 −29–69 | 0.35 0.18 | 0.24 0.67 | 0.47 | 0.11 |
| Glucose (mmol/L) | |||||||||
| Total | HRW CON | 5.60 ± 0.56 5.38 ± 0.66 | 5.63 ± 0.66 5.46 ± 0.96 | −0.03 ± 0.42 −0.09 ± 0.47 | −0.24–0.18 −0.33–0.15 | 0.39 0.23 | 0.05 0.10 | 0.87 | <0.01 |
| Female | HRW CON | 5.60 ± 0.63 5.28 ± 0.81 | 5.64 ± 0.77 5.50 ± 1.16 | −0.05 ± 0.50 −0.22 ± 0.49 | −0.37–0.27 −0.55–0.11 | 0.38 0.08 | 0.07 0.22 | 0.43 | 0.07 |
| Male | HRW CON | 5.60 ± 0.43 5.55 ± 0.25 | 5.60 ± 0.39 5.40 ± 0.46 | 0.00 ± 0.24 0.16 ± 0.34 | −0.25–0.25 −0.20–0.52 | 0.49 0.16 | 0.01 0.42 | 0.39 | 0.15 |
| Total cholesterol (mmol/L) | |||||||||
| Total | HRW CON | 5.63 ± 1.14 5.05 ± 0.79 | 5.31 ± 1.13 5.16 ± 0.86 | 0.32 ± 0.44 −0.11 ± 0.55 | 0.10–0.54 −0.39–0.17 | <0.01 0.20 | 0.28 0.14 | 0.02 | 0.31 |
| Female | HRW CON | 5.49 ± 1.23 5.08 ± 0.69 | 5.27 ± 1.20 5.37 ± 0.73 | 0.21 ± 0.46 −0.29 ± 0.56 | −0.08–0.50 −0.67–0.09 | 0.07 0.06 | 0.18 0.40 | 0.04 | 0.35 |
| Male | HRW CON | 5.91 ± 0.96 5.00 ± 0.99 | 5.39 ± 1.06 4.79 ± 1.03 | 0.52 ± 0.37 0.21 ± 0.38 | 0.13–0.91 −0.19–0.61 | 0.01 0.12 | 0.51 0.20 | 0.16 | 0.35 |
| LDL cholesterol (mmol/L) | |||||||||
| Total | HRW CON | 3.45 ± 1.06 3.08 ± 0.73 | 3.16 ± 1.03 3.15 ± 0.61 | 0.28 ± 0.53 −0.07 ± 0.48 | 0.02–0.54 −0.32–0.18 | 0.02 0.29 | 0.28 0.10 | 0.04 | 0.24 |
| Female | HRW CON | 3.21 ± 0.99 3.02 ± 0.69 | 3.02 ± 0.98 3.26 ± 0.56 | 0.20 ± 0.52 −0.21 ± 0.47 | −0.13–0.53 −0.53–0.11 | 0.11 0.08 | 0.20 0.38 | 0.08 | 0.30 |
| Male | HRW CON | 4.04 ± 1.11 3.18 ± 0.85 | 3.45 ± 1.17 2.96 ± 0.71 | 0.49 ± 0.57 0.22 ± 0.32 | −0.11–1.09 −0.12–0.56 | 0.06 0.08 | 0.52 0.28 | 0.30 | 0.26 |
| HDL cholesterol (mmol/L) | |||||||||
| Total | HRW CON | 1.57 ± 0.52 1.34 ± 0.31 | 1.51 ± 0.52 1.32 ± 0.34 | 0.07 ± 0.15 0.02 ± 0.14 | 0.00–0.14 −0.05–0.09 | 0.04 0.29 | 0.13 0.06 | 0.30 | 0.07 |
| Female | HRW CON | 1.74 ± 0.56 1.40 ± 0.36 | 1.65 ± 0.57 1.39 ± 0.39 | 0.09 ± 0.14 0.00 ± 0.16 | 0.00–0.18 −0.11–0.11 | 0.02 0.46 | 0.16 0.01 | 0.30 | 0.11 |
| Male | HRW CON | 1.24 ± 0.07 1.24 ± 0.19 | 1.22 ± 0.20 1.19 ± 0.17 | 0.02 ± 0.18 0.05 ± 0.13 | −01.7–0.21 −0.09–0.19 | 0.41 0.21 | 0.12 0.26 | 0.68 | 0.04 |
| Triglycerides (mmol/L) | |||||||||
| Total | HRW CON | 1.41 ± 0.85 1.63 ± 1.95 | 1.43 ± 0.63 1.92 ± 2.58 | −0.02 ± 0.67 −0.28 ± 0.76 | −0.35–0.31 −0.67–0.11 | 0.46 0.07 | 0.02 0.12 | 0.46 | 0.04 |
| Female | HRW CON | 1.17 ± 0.20 1.83 ± 2.46 | 1.35 ± 0.62 2.19 ± 3.19 | −0.18 ± 0.51 −0.37 ± 0.91 | −0.50–0.14 −0.98–0.24 | 0.12 0.11 | 0.39 0.13 | 0.43 | 0.06 |
| Male | HRW CON | 1.90 ± 1.40 1.28 ± 0.45 | 1.59 ± 0.67 1.41 ± 0.61 | 0.31 ± 0.87 −0.13 ± 0.34 | −0.60–1.22 −0.49–0.23 | 0.21 0.20 | 0.28 0.24 | 0.13 | 0.40 |
Disclaimer/Publisher’s Note: The statements, opinions and data contained in all publications are solely those of the individual author(s) and contributor(s) and not of MDPI and/or the editor(s). MDPI and/or the editor(s) disclaim responsibility for any injury to people or property resulting from any ideas, methods, instructions or products referred to in the content. |
© 2025 by the authors. Published by MDPI on behalf of the Lithuanian University of Health Sciences. Licensee MDPI, Basel, Switzerland. This article is an open access article distributed under the terms and conditions of the Creative Commons Attribution (CC BY) license (https://creativecommons.org/licenses/by/4.0/).
Share and Cite
Todorovic, N.; Baltic, S.; Nedeljkovic, D.; Kuzmanovic, J.; Korovljev, D.; Javorac, D.; Bijelic, K.; Kladar, N.; Tarnava, A.; Ostojic, S.M. The Effects of 8-Week Hydrogen-Rich Water Consumption on Appetite, Body Composition, Sleep Quality, and Circulating Glucagon-like Peptide-1 in Obese Men and Women (HYDRAPPET): A Randomized Controlled Trial. Medicina 2025, 61, 1299. https://doi.org/10.3390/medicina61071299
Todorovic N, Baltic S, Nedeljkovic D, Kuzmanovic J, Korovljev D, Javorac D, Bijelic K, Kladar N, Tarnava A, Ostojic SM. The Effects of 8-Week Hydrogen-Rich Water Consumption on Appetite, Body Composition, Sleep Quality, and Circulating Glucagon-like Peptide-1 in Obese Men and Women (HYDRAPPET): A Randomized Controlled Trial. Medicina. 2025; 61(7):1299. https://doi.org/10.3390/medicina61071299
Chicago/Turabian StyleTodorovic, Nikola, Sonja Baltic, David Nedeljkovic, Jovan Kuzmanovic, Darinka Korovljev, Dejan Javorac, Katarina Bijelic, Nebojsa Kladar, Alex Tarnava, and Sergej M. Ostojic. 2025. "The Effects of 8-Week Hydrogen-Rich Water Consumption on Appetite, Body Composition, Sleep Quality, and Circulating Glucagon-like Peptide-1 in Obese Men and Women (HYDRAPPET): A Randomized Controlled Trial" Medicina 61, no. 7: 1299. https://doi.org/10.3390/medicina61071299
APA StyleTodorovic, N., Baltic, S., Nedeljkovic, D., Kuzmanovic, J., Korovljev, D., Javorac, D., Bijelic, K., Kladar, N., Tarnava, A., & Ostojic, S. M. (2025). The Effects of 8-Week Hydrogen-Rich Water Consumption on Appetite, Body Composition, Sleep Quality, and Circulating Glucagon-like Peptide-1 in Obese Men and Women (HYDRAPPET): A Randomized Controlled Trial. Medicina, 61(7), 1299. https://doi.org/10.3390/medicina61071299