Article

Comparing Frailty Status Among Clusters Identified Based on EQ-5D-5L Dimensions in Older Patients with Chronic Low Back Pain

1
Department of Anesthesiology and Pain Medicine, Anesthesia and Pain Research Institute, Yonsei University College of Medicine, Seoul 03722, Republic of Korea
2
Department of Preventive Medicine, Yonsei University College of Medicine, Seoul 03722, Republic of Korea
*
Author to whom correspondence should be addressed.
Medicina 2025, 61(7), 1217; https://doi.org/10.3390/medicina61071217
Submission received: 9 June 2025 / Revised: 30 June 2025 / Accepted: 2 July 2025 / Published: 3 July 2025
(This article belongs to the Special Issue New Frontiers in Spine Surgery and Spine Disorders)

Abstract

Background and Objectives: In the present study, distinct subgroups of older adults with chronic low back pain (LBP) were identified using cluster analysis based on the five dimensions of the EQ-5D-5L. Using detailed profiles of how chronic LBP affects various facets of health-related quality of life (HRQoL), differences in frailty levels across these subgroups were investigated in this study. Materials and Methods: This retrospective study included patients ≥ 60 years of age who visited the pain clinic at a tertiary hospital between March 2022 and February 2023. HRQoL was assessed using the EQ-5D-5L, and frailty was evaluated via the Frailty Phenotype Questionnaire. Hierarchical cluster analysis using the WARD method with squared Euclidean distance was conducted on the EQ-5D-5L dimensions to identify subgroups. Differences in frailty, demographics, and clinical data across clusters were analyzed. Results: Among 837 older adults with chronic LBP, four distinct clusters were identified based on a cluster analysis of the EQ-5D-5L dimensions. Cluster 1 exhibited high levels of pain/discomfort and anxiety/depression, and cluster 2 had severe mobility limitations and pain/discomfort but low anxiety/depression. Cluster 3 showed balanced scores across all dimensions, and cluster 4 had severe pain/discomfort but good mobility. Significant differences were observed among the clusters in pain intensity, EQ Visual Analogue Scale (EQ-VAS) and EQ-5D-5L index scores, and frailty status. Cluster 1 had the highest pain scores and lowest EQ-VAS, and frailty was most prevalent in cluster 2 (28.5%) and least in cluster 4 (13.3%). Conclusions: The results of the present study emphasize the complexity of chronic LBP in older adults by identifying distinct clusters. Cluster analysis identified four unique profiles, with significant frailty differences across the clusters. These findings emphasize the importance of personalized management strategies tailored to specific patient profiles to enhance treatment effectiveness and improve frailty status.

1. Introduction

Low back pain (LBP) is a prevalent issue affecting all age groups globally and has become the leading cause of disability worldwide [1]. A significant proportion of patients develop chronic LBP, affecting approximately 23% of individuals and severely affecting their functional ability and quality of life [2,3,4]. Older adults with chronic LBP often experience exacerbated psychosocial dysfunction, increased self-reported disability, and reduced physical capacity [5].
Health-related quality of life (HRQoL) is a multifaceted concept that encompasses an individual’s functioning and perceived well-being across physical, mental, and social aspects [6]. The HRQoL is used to evaluate how physical limitations, pain, and discomfort affect daily activities, social interactions, and psychological health [7]. The EQ-5D-5L is a crucial tool for measuring HRQoL and assesses five specific dimensions: mobility, self-care, usual activities, pain/discomfort, and anxiety/depression [8]. Responses to such instruments can vary widely among patients with chronic LBP, reflecting the complex interplay of biophysical, psychological, and social factors that affect individuals differently [1]. Thus, identifying homogenous subgroups using machine learning algorithms is crucial for tailoring treatment and improving care quality [9].
Frailty, a critical concept in geriatrics, is defined as a clinical syndrome characterized by reduced physiological reserves and increased vulnerability to stressors, often manifesting as weakness, fatigue, and unintentional weight loss [10]. This condition significantly increases the risk of adverse health outcomes in older adults [11]. A strong association between frailty and HRQoL has been highlighted in recent studies [12,13], with previous research [14] further demonstrating this relationship in older adults with chronic LBP.
Comparing frailty within clusters based on specific HRQoL dimensions is essential for understanding how various aspects of a patient’s life affect their frailty status. Classifying chronic LBP patients using the EQ-5D-5L helps identify distinct subgroups with varying physical and psychological profiles. When comparing frailty across these clusters, how specific HRQoL dimensions, such as mobility limitations, severe pain, or high anxiety, correlate with frailty can be determined. Understanding how frailty differs across various HRQoL profiles will provide important insights into personalized treatment strategies and interventions. This comparison enhances research by reducing heterogeneity and improving treatment efficacy and leads to more targeted and effective patient care [15].
In the present study, cluster analysis was performed on older patients with chronic LBP based on the five dimensions of the EQ-5D-5L to identify distinct subgroups. Subsequently, differences in frailty status among the subgroups were investigated.

2. Materials and Methods

2.1. Ethics and Consent

This retrospective cross-sectional study was reviewed and approved by the Institutional Review Board of Yonsei University Health System, Seoul, Republic of Korea (approval number 4-2024-0727, dated 1 August 2024). Due to the retrospective and observational nature of this study, the Institutional Review Board waived the requirement for obtaining informed consent from patients.

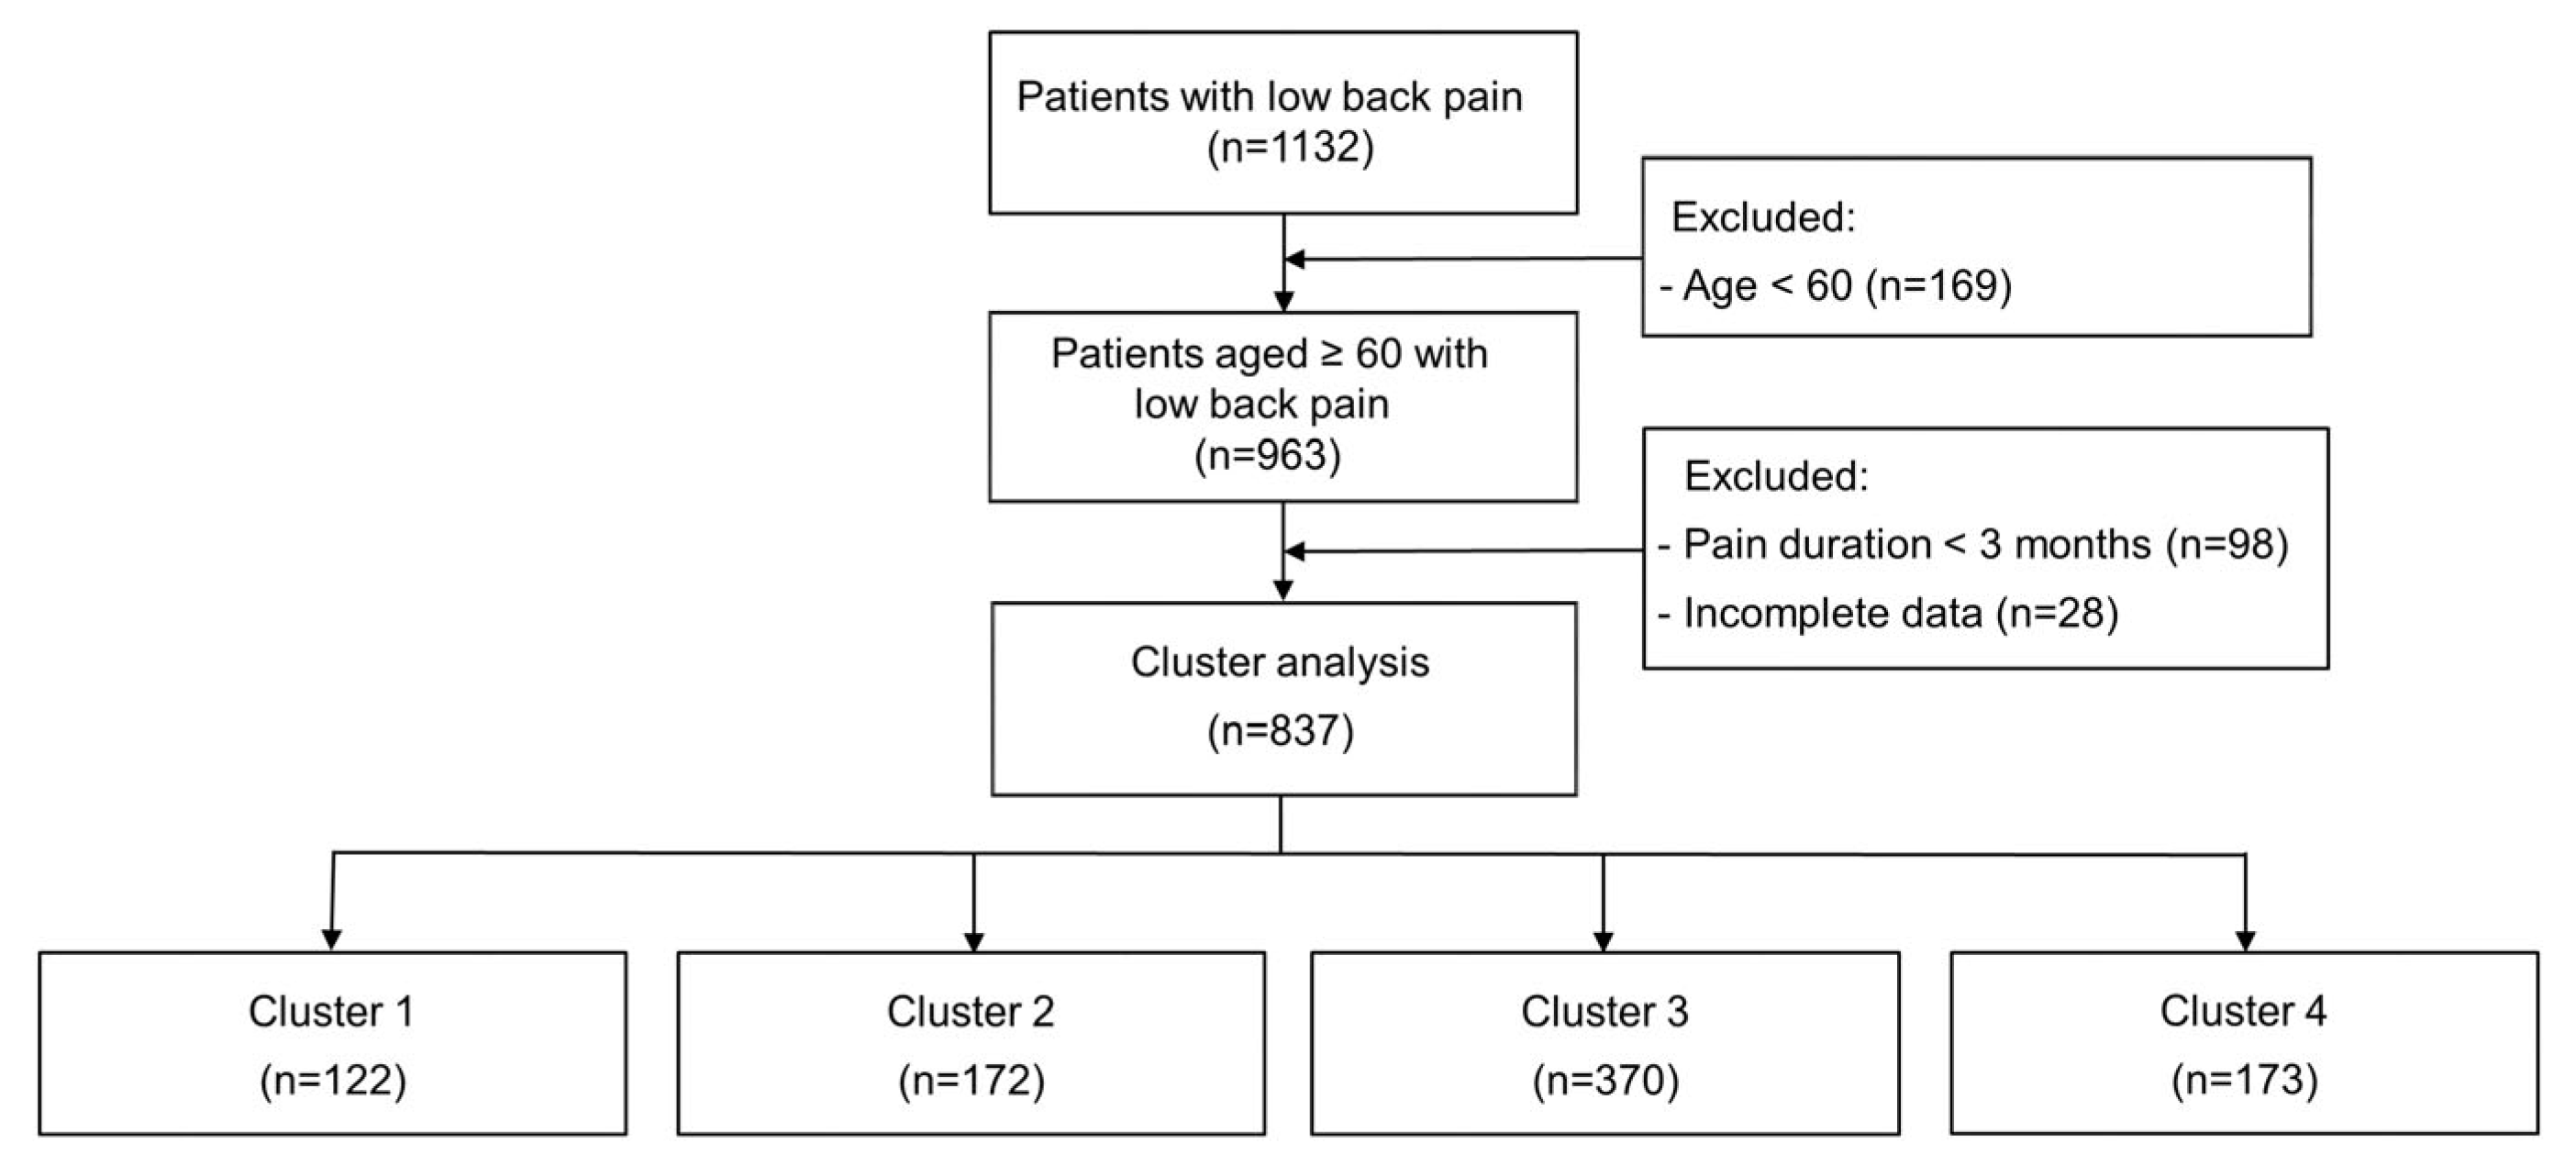
2.2. Study Population

The patients enrolled in this study were subjects who first visited the pain clinic at Severance Hospital, a leading tertiary hospital in Korea, between March 2022 and February 2023. Patients ≥ 60 years of age with complaints of LBP were included in the study. Patients with acute pain within the past 3 months and subjects with incomplete electronic medical records were excluded.

2.3. Evaluation of HRQoL

HRQoL was assessed at the pain clinic during the first patient visit using the EQ-5D-5L tool. Created by the EuroQol Group, the EQ-5D-5L is accessible in 102 languages on the EuroQol website (http://www.euroqol.org (accessed on 1 July 2025)) and consists of two parts: the EQ-5D descriptive system and the EQ Visual Analogue Scale (EQ-VAS).
The EQ-5D descriptive system comprises five dimensions: mobility, self-care, usual activities, pain/discomfort, and anxiety/depression. Each dimension has five levels ranging from no problem to an extreme problem. The EQ-VAS allows individuals to assess their overall health on a scale from 0 to 100, where 0 signifies the worst possible health and 100 represents the best possible health. In addition, social index values for EQ-5D-5L health states among the Korean population were established using the composite time trade-off method, as outlined in a prior study [16].

2.4. Frailty Screening

Frailty screening was performed during the first patient visit to the pain clinic for pain management. Frailty was assessed using the Frailty Phenotype Questionnaire [17] which includes five components:
  • Fatigue: Participants receive 1 point if they report feeling that everything they did was a lot of effort for more than 3 days a week in the past week, otherwise 0 points.
  • Resistance: Participants receive 1 point if they have difficulty climbing 10 stairs without assistance, otherwise 0 points.
  • Ambulation: Participants receive 1 point if they report any difficulty walking around a 400 m playground track, otherwise 0 points.
  • Inactivity: Participants receive 1 point if they do not engage in moderate or vigorous physical activity in the past 7 days, otherwise 0 points.
  • Unintentional weight loss: Participants receive 1 point if they lost 4.5 kg or more unintentionally in the past year, otherwise 0 points.
Based on the Fried frailty phenotype assessment, individuals scoring 0 were classified as robust, 1–2 as pre-frail, and 3 or higher as frail.

2.5. Patient Demographics and Clinical Data Measurements

Patient demographics and pain-related data were collected from electronic medical records during the initial outpatient clinic visit. Demographic information included age, sex, body mass index (BMI), diagnosed comorbidities (hypertension, diabetes mellitus, cancer, mental health disorders, and osteopenia/osteoporosis), and previous spinal surgery history. In addition, the pain-related data collected included baseline pain scores using the Numeric Rating Scale (NRS), pain duration, opioid use for ≥1 month prior to the visit, and the presence of sleep disturbances. Pain severity was categorized based on NRS scores as follows: mild (1–3), moderate (4–6), or severe (7–10) [18].

2.6. Statistical Analysis

Continuous variables were presented as mean ± standard deviation (SD), and categorical variables were tabulated as numbers (percentage). The normality of distribution was assessed using the Shapiro–Wilk test. Differences among the cluster groups were analyzed using the one-way analysis of variance, Chi-squared, and Kruskal–Wallis tests. Bonferroni’s multiple comparison or Chi-squared post hoc tests were used to determine intergroup differences when significant differences were found. Statistical Package for the Social Sciences, version 28.0 (IBM Corp, Armonk, NY, USA), was used for data analysis. A p-value < 0.05 was considered statistically significant.

2.7. Cluster Analysis

Hierarchical cluster analysis was conducted to subgroup patients based on the relevance of the EQ-5D-5L dimensions. To standardize individual perceptions, an alternative score was calculated by subtracting the average value of each of the five dimensions. In this alternative scoring method, values > 0 indicate more pronounced problems compared to the individual average perception and values < 0 indicate less intense problems.
The hierarchical WARD method with squared Euclidean distance was utilized for clustering. This method was chosen due to its ability to minimize within-cluster variance and its suitability for exploratory subgroup identification, especially when combined with dendrogram-based visual inspection. The analysis was performed using Python version 3.8.15 with Scikit-learn version 1.0.2. Essential clusters were defined using a cut-off point of approximately 10% of the total cases. A four-cluster solution was selected to maintain the significant differences identified using agglomerative clustering. Hierarchical clustering resulted in four distinct clusters that met our predefined criteria.
Validation and case reorganization were conducted using k-means cluster analysis, confirming consistent results. Although EQ-5D-5L dimensions are ordinal, we applied within-individual centering and standardization to treat the adjusted scores as continuous variables, justifying the use of squared Euclidean distance. EQ-VAS was not included in the clustering algorithm but was used post hoc to compare health status across clusters.

3. Results

From March 2022 to February 2023, among the 1132 LBP patients who visited the pain clinic, 837 patients ≥ 60 years of age with chronic LBP were included in the study after excluding subjects who met the exclusion criteria (Figure 1).
The demographic profiles and pain-related data of the enrolled participants are detailed in Table 1. The mean age of the patients was 72.01 years, with females comprising over 50% of the group. The median BMI was 22.89 kg/m2. Hypertension was reported in 251 patients, diabetes mellitus in 146, cancer in 130, mental health problems in 107, and osteopenia/osteoporosis in 104. In addition, 197 patients (23.5%) had a history of spine surgery. A total of 5.5% of patients reported mild pain (NRS 1–3), 39.3% reported moderate pain (NRS 4–6), and 55.2% reported severe pain (NRS 7–10). The median duration of pain was 12 months. Approximately 30% of patients reported using opioids and experiencing sleep disturbances. The most commonly reported EQ-5D-5L dimension at levels > 2 was pain/discomfort (70.1%), followed by mobility (51.8%), usual activities (29.6%), anxiety/depression (25.6%), and self-care (17.2%). The mean EQ-VAS score was 61.87 and the mean EQ-5D-5L index score was 0.63. The frailty status of the patients included 244 (29.2%) classified as robust, 409 (48.9%) as pre-frail, and 184 (22.0%) as frail.
A cluster analysis was conducted using the EQ-5D-5L questionnaire to subgroup patients based on the relevance of the dimensions, resulting in four distinct clusters (Figure 2). Cluster 1 included patients with high levels of pain/discomfort and anxiety/depression but generally good self-care abilities. Cluster 2 consisted of patients who experienced severe mobility limitations and pain/discomfort but exhibited low levels of anxiety/depression. Cluster 3 included patients with similar scores across all dimensions, indicating a generally balanced condition without extreme issues in any particular area. Cluster 4 consisted of patients suffering from severe pain/discomfort but who maintained good mobility and relatively low levels of anxiety/depression.
A comparison was conducted to examine the differences in patient characteristics and pain-related data among the four clusters (Table 2). No significant differences were found in age, BMI, and comorbid medical conditions across the clusters. However, a significant difference was found in the proportion of female patients, with cluster 2 having the lowest proportion (57.0%) compared to cluster 1 (70.5%), cluster 3 (69.7%), and cluster 4 (69.4%) (p = 0.017).
Severity distribution differed significantly, with clusters 1 and 2 showing higher proportions of severe pain and lower proportions of mild pain compared to clusters 3 and 4 (p < 0.001). A trend towards longer pain duration was observed in cluster 3 (median: 24 months) but without statistical significance (p = 0.050). No significant differences were observed in opioid usage and sleep disturbance among the clusters.
Patients in cluster 1 reported significantly lower EQ-VAS scores (56.80 ± 18.53) compared to the other clusters (p = 0.005). Furthermore, clusters 1 and 2 had a lower EQ-5D-5L index (0.55 ± 0.18 and 0.55 ± 0.17, respectively) compared to clusters 3 and 4, indicating a poorer overall health status (p < 0.001). In addition, the proportion of frail patients was highest in cluster 2 (28.5%) and lowest in cluster 4 (13.3%; p < 0.001; Figure 3).

4. Discussion

In the present study, homogeneous subgroups were identified based on the five dimensions of the EQ-5D-5L among older patients with chronic LBP. In addition, differences in frailty status and other relevant factors within the subgroups were examined. In the study, four distinct clusters of these patients were identified based on their EQ-5D-5L dimensions and significant differences in frailty status were observed.
Patients in cluster 1 experienced high levels of pain/discomfort and anxiety/depression and had lower EQ-VAS scores and elevated frailty, indicating that significant mental strain is associated with increased frailty. Cluster 2 was characterized by severe mobility limitations and significant pain/discomfort and exhibited the highest levels of frailty, indicating a close relationship between severe mobility limitations, high pain scores, and increased frailty. In contrast, patients in cluster 4, despite experiencing severe pain and discomfort, maintained good mobility and reported lower levels of anxiety and depression. In addition, cluster 4 had the lowest level of frailty among all clusters. Patients in cluster 3 had balanced scores across all EQ-5D-5L dimensions, indicating a relatively stable condition and higher overall health. In cluster 3, maintaining current health through pain management and preventive care was important to avoid the further progression of frailty.
Due to the multifactorial nature of chronic LBP, various approaches to identify subgroups of patients have been examined in previous studies [19,20,21,22]. Results have shown that tailoring treatments to specific subgroups based on their clinical presentations can lead to improved clinical outcomes, increased overall health benefits, and cost savings [21,22]. The research in the present study extends this work by examining the association between frailty and the subgroups identified using cluster analysis of the EQ-5D-5L dimensions. Frailty is a multidimensional and dynamic condition influenced by both physical and psychosocial factors [10]. In a systematic review regarding transitions between frailty states, approximately 43% of individuals were shown to experience at least one transition, encompassing both deterioration and improvement [23]. Therefore, implementing personalized interventions tailored to subgroups identified based on cluster analysis can modify the frailty status by enhancing the independence, physical functioning, and cognitive health of individuals [24].
In the present study, severe mobility limitations, as observed in cluster 2, appeared to be closely associated with the highest levels of frailty. More than 50% of patients with chronic severe LBP experience some form of mobility or work impairment [25]. In addition, Coyle et al. [26] showed that overall frailty was significantly more prevalent in older adults with chronic LBP than in subjects without pain. These findings reinforce the role of chronic LBP in contributing to mobility limitations and frailty and emphasize the importance of physical activity interventions for patients with mobility issues [27,28]. Psychological distress, such as anxiety and depression, plays a critical role in frailty and was particularly evident in cluster 1. Both pre-frail and frail elderly individuals experienced higher levels of anxiety and depression compared to their robust counterparts [29]. Furthermore, an association between depressive symptoms and the development of frailty was reported in a large epidemiological study [30]. Therefore, effective management of frailty in this subgroup experiencing psychological distress necessitates addressing psychosocial factors, including social support and coping strategies. Chronic pain often impairs mobility, leading to social isolation and increased emotional distress [31]. However, as observed in cluster 4, despite experiencing severe chronic pain, individuals who maintained good mobility and low levels of psychological distress experienced a relatively low level of frailty. This emphasizes the interrelated nature of physical activity and psychological distress [32,33] and demonstrates that promoting both physical activity and psychological recovery can improve frailty status in elderly patients with chronic LBP [34,35]. Examining frailty in relation to these clusters revealed the complex, multifaceted nature of chronic LBP and provided new insights into how different health dimensions interact with frailty. This novel approach emphasizes the within-person differences in frailty among patients with chronic LBP and shows that more targeted and potentially effective management strategies are needed.
Furthermore, demographic differences, particularly between sexes, were observed across clusters. In cluster 2 in which severe pain and discomfort were reported, the proportion of females was relatively low. This is in contrast with the typically higher pain levels and more intense chronic pain experienced by female patients due to hormonal, psychological, and social factors [36]. The discrepancy may be attributed to lower serum testosterone levels in elderly males, which can contribute to limitations in physical function and mobility [37]. These findings emphasize the complex role of sex in pain experience and the need for a multidimensional pain assessment approach. Further research is necessary to explore these differences more comprehensively.
In addition, although the clusters differed in HRQoL profiles and frailty levels, no significant differences were observed in opioid use or sleep disturbance. This suggests that these outcomes may be influenced by external factors such as prescribing behaviour, coping mechanisms, or comorbid conditions not fully captured by EQ-5D-5L dimensions. Further investigation is needed to clarify these interactions.
The present study had several limitations that should be considered when interpreting the findings. First, the sample was limited to Korean older adults from a specific healthcare setting which may affect the generalizability of the results. Selection bias and lack of diversity could influence the findings. However, the methodology and outcome measures used in this study are widely applicable and may serve as a reference for similar investigations in other populations. Second, the retrospective design relies on existing records, potentially leading to missing data and limiting causal inferences. Third, the EQ-5D-5L and Frailty Phenotype Questionnaire, although useful, may not capture all aspects of chronic LBP and HRQoL, and are subject to self-report bias. In addition, detailed analyses of lumbar pathology or radiological severity, which may affect symptom interpretation, are not included. However, such discrepancies between symptoms and lumbar pathology or radiological severity are common [38] and do not necessarily affect the findings.

5. Conclusions

In conclusion, the unique patterns identified using cluster analysis emphasized the complexity of chronic LBP in older adults. Chronic LBP affects physical, mental, and social aspects of life in various ways, as confirmed in the results of the present study showing significant variations in frailty levels across different subgroups. These differences emphasize the need for personalized management strategies, indicating that tailoring treatments to specific patient profiles could enhance intervention effectiveness and improve frailty status. The outcomes of various treatment options in these patient clusters should be investigated in future studies to determine their effectiveness in improving frailty, as also suggested in preliminary findings presented previously [39].

Supplementary Materials

The following supporting information can be downloaded at: https://www.mdpi.com/article/10.3390/medicina61071217/s1.

Author Contributions

Conceptualization, H.J.K. and S.H.K.; methodology, H.J.K.; software, H.J.K. and J.H.; validation, H.J.K. and H.C.K.; formal analysis, H.J.K.; investigation, H.J.K. and H.C.K.; resources, H.J.K.; data curation, J.H.; writing—original draft preparation, H.J.K.; writing—review and editing, H.J.K., H.C.K. and S.H.K.; visualization, J.H.; supervision, S.H.K.; project administration, S.H.K.; funding acquisition, H.J.K. All authors have read and agreed to the published version of the manuscript.

Funding

This study was supported by a new faculty research seed money grant of Yonsei University College of Medicine for 2025 (2025-32-0044).

Institutional Review Board Statement

This study was conducted in accordance with the Declaration of Helsinki, and approved by the Institutional Review Board of Yonsei University Health System, Seoul, South Korea (IRB No. 4-2024-0727; Approval date: 1 August 2024).

Informed Consent Statement

Informed consent was waived by the IRB of Yonsei University Health System under the ‘Waiver of Informed Consent for Retrospective Studies’ due to the study’s retrospective nature.

Data Availability Statement

The minimal dataset supporting the findings of this study is provided as Supplementary Material to the article. The full dataset contains personal health information and cannot be shared publicly due to institutional and legal restrictions. Data are available from the corresponding author upon reasonable request and with appropriate ethical approval.

Acknowledgments

The authors would like to thank C.H. Hwang for helping with the data analysis for this study.

Conflicts of Interest

The authors declare no conflicts of interest.

Abbreviations

The following abbreviations are used in this manuscript:
LBPLow back pain
HRQoLHealth-related quality of life
EQ-VASEQ Visual Analogue Scale
BMIBody mass index
NRSNumeric Rating Scale
SDStandard deviation

References

  1. Hartvigsen, J.; Hancock, M.J.; Kongsted, A.; Louw, Q.; Ferreira, M.L.; Genevay, S.; Hoy, D.; Karppinen, J.; Pransky, G.; Sieper, J.; et al. What low back pain is and why we need to pay attention. Lancet 2018, 391, 2356–2367. [Google Scholar] [CrossRef] [PubMed]
  2. Knezevic, N.N.; Candido, K.D.; Vlaeyen, J.W.S.; Van Zundert, J.; Cohen, S.P. Low back pain. Lancet 2021, 398, 78–92. [Google Scholar] [CrossRef]
  3. Semeru, G.M.; Halim, M.S. Acceptance versus catastrophizing in predicting quality of life in patients with chronic low back pain. Korean J. Pain. 2019, 32, 22–29. [Google Scholar] [CrossRef]
  4. Henschke, N.; Maher, C.G.; Refshauge, K.M.; Herbert, R.D.; Cumming, R.G.; Bleasel, J.; York, J.; Das, A.; McAuley, J.H. Prognosis in patients with recent onset low back pain in Australian primary care: Inception cohort study. BMJ 2008, 337, a171. [Google Scholar] [CrossRef]
  5. Rudy, T.E.; Weiner, D.K.; Lieber, S.J.; Slaboda, J.; Boston, R.J. The impact of chronic low back pain on older adults: A comparative study of patients and controls. Pain 2007, 131, 293–301. [Google Scholar] [CrossRef]
  6. Geigl, C.; Loss, J.; Leitzmann, M.; Janssen, C. Social factors of health-related quality of life in older adults: A multivariable analysis. Qual. Life Res. 2023, 32, 3257–3268. [Google Scholar] [CrossRef]
  7. Etxeberria, I.; Urdaneta, E.; Galdona, N. Factors associated with health-related quality of life (HRQoL): Differential patterns depending on age. Qual. Life Res. 2019, 28, 2221–2231. [Google Scholar] [CrossRef]
  8. Herdman, M.; Gudex, C.; Lloyd, A.; Janssen, M.; Kind, P.; Parkin, D.; Bonsel, G.; Badia, X. Development and preliminary testing of the new five-level version of EQ-5D (EQ-5D-5L). Qual. Life Res. 2011, 20, 1727–1736. [Google Scholar] [CrossRef]
  9. Staartjes, V.E.; Klukowska, A.M.; Stumpo, V.; Vandertop, W.P.; Schröder, M.L. Identifying clusters of objective functional impairment in patients with degenerative lumbar spinal disease using unsupervised learning. Eur. Spine J. 2024, 33, 1320–1331. [Google Scholar] [CrossRef]
  10. Hoogendijk, E.O.; Afilalo, J.; Ensrud, K.E.; Kowal, P.; Onder, G.; Fried, L.P. Frailty: Implications for clinical practice and public health. Lancet 2019, 394, 1365–1375. [Google Scholar] [CrossRef]
  11. Clegg, A.; Young, J.; Iliffe, S.; Rikkert, M.O.; Rockwood, K. Frailty in elderly people. Lancet 2013, 381, 752–762. [Google Scholar] [CrossRef] [PubMed]
  12. Masel, M.C.; Graham, J.E.; Reistetter, T.A.; Markides, K.S.; Ottenbacher, K.J. Frailty and health related quality of life in older Mexican Americans. Health Qual. Life Outcomes 2009, 7, 70. [Google Scholar] [CrossRef] [PubMed]
  13. Chang, Y.W.; Chen, W.L.; Lin, F.G.; Fang, W.H.; Yen, M.Y.; Hsieh, C.C.; Kao, T.W. Frailty and its impact on health-related quality of life: A cross-sectional study on elder community-dwelling preventive health service users. PLoS ONE 2012, 7, e38079. [Google Scholar] [CrossRef]
  14. Kim, H.J.; Jun, B.; Lee, H.W.; Kim, S.H. Influence of frailty status on the health-related quality of life in older patients with chronic low back pain: A retrospective observational study. Qual. Life Res. 2024, 33, 1905–1913. [Google Scholar] [CrossRef]
  15. Herman, P.M.; Coulter, I.D.; Hays, R.D.; Rodriguez, A.; Edelen, M.O. A Scoping Review of Chronic Low Back Pain Classification Schemes Based on Patient-Reported Outcomes. Pain. Physician 2022, 25, 471–482. [Google Scholar]
  16. Kim, S.H.; Ahn, J.; Ock, M.; Shin, S.; Park, J.; Luo, N.; Jo, M.W. The EQ-5D-5L valuation study in Korea. Qual. Life Res. 2016, 25, 1845–1852. [Google Scholar] [CrossRef]
  17. Kim, S.; Kim, M.; Jung, H.W.; Won, C.W. Development of a Frailty Phenotype Questionnaire for Use in Screening Community-Dwelling Older Adults. J. Am. Med. Dir. Assoc. 2020, 21, 660–664. [Google Scholar] [CrossRef]
  18. Krebs, E.E.; Carey, T.S.; Weinberger, M. Accuracy of the pain numeric rating scale as a screening test in primary care. J. Gen. Intern. Med. 2007, 22, 1453–1458. [Google Scholar] [CrossRef]
  19. Langenmaier, A.M.; Amelung, V.E.; Karst, M.; Krauth, C.; Püschner, F.; Urbanski, D.; Schiessl, C.; Thoma, R.; Klasen, B. Subgroups in chronic low back pain patients—A step toward cluster-based, tailored treatment in inpatient standard care: On the need for precise targeting of treatment for chronic low back pain. Ger. Med. Sci. 2019, 17, Doc09. [Google Scholar] [CrossRef]
  20. Viniol, A.; Jegan, N.; Hirsch, O.; Leonhardt, C.; Brugger, M.; Strauch, K.; Barth, J.; Baum, E.; Becker, A. Chronic low back pain patient groups in primary care—A cross sectional cluster analysis. BMC Musculoskelet. Disord. 2013, 14, 294. [Google Scholar] [CrossRef]
  21. Fritz, J.M.; Cleland, J.A.; Childs, J.D. Subgrouping patients with low back pain: Evolution of a classification approach to physical therapy. J. Orthop. Sports Phys. Ther. 2007, 37, 290–302. [Google Scholar] [CrossRef] [PubMed]
  22. Hill, J.C.; Whitehurst, D.G.; Lewis, M.; Bryan, S.; Dunn, K.M.; Foster, N.E.; Konstantinou, K.; Main, C.J.; Mason, E.; Somerville, S.; et al. Comparison of stratified primary care management for low back pain with current best practice (STarT Back): A randomised controlled trial. Lancet 2011, 378, 1560–1571. [Google Scholar] [CrossRef] [PubMed]
  23. Gill, T.M.; Gahbauer, E.A.; Allore, H.G.; Han, L. Transitions between frailty states among community-living older persons. Arch. Intern. Med. 2006, 166, 418–423. [Google Scholar] [CrossRef]
  24. Dent, E.; Martin, F.C.; Bergman, H.; Woo, J.; Romero-Ortuno, R.; Walston, J.D. Management of frailty: Opportunities, challenges, and future directions. Lancet 2019, 394, 1376–1386. [Google Scholar] [CrossRef]
  25. Feldman, D.E.; Nahin, R.L. Disability Among Persons With Chronic Severe Back Pain: Results From a Nationally Representative Population-based Sample. J. Pain. 2022, 23, 2144–2154. [Google Scholar] [CrossRef]
  26. Coyle, P.C.; Sions, J.M.; Velasco, T.; Hicks, G.E. Older Adults with Chronic Low Back Pain: A Clinical Population Vulnerable to Frailty? J. Frailty Aging 2015, 4, 188–190. [Google Scholar] [CrossRef]
  27. Otones, P.; García, E.; Sanz, T.; Pedraz, A. A physical activity program versus usual care in the management of quality of life for pre-frail older adults with chronic pain: Randomized controlled trial. BMC Geriatr. 2020, 20, 396. [Google Scholar] [CrossRef]
  28. Haider, S.; Grabovac, I.; Dorner, T.E. Effects of physical activity interventions in frail and prefrail community-dwelling people on frailty status, muscle strength, physical performance and muscle mass-a narrative review. Wien. Klin. Wochenschr. 2019, 131, 244–254. [Google Scholar] [CrossRef]
  29. Ní Mhaoláin, A.M.; Fan, C.W.; Romero-Ortuno, R.; Cogan, L.; Cunningham, C.; Kenny, R.A.; Lawlor, B. Frailty, depression, and anxiety in later life. Int. Psychogeriatr. 2012, 24, 1265–1274. [Google Scholar] [CrossRef]
  30. Woods, N.F.; LaCroix, A.Z.; Gray, S.L.; Aragaki, A.; Cochrane, B.B.; Brunner, R.L.; Masaki, K.; Murray, A.; Newman, A.B. Women’s Health Initiative Frailty: Emergence consequences in women aged 65, older in the Women’s Health Initiative Observational Study. J. Am. Med. Dir. Assoc. 2005, 53, 1321–1330. [Google Scholar] [CrossRef]
  31. Zhao, D.; Chai, S.; Gao, T.; Li, J.; Zhou, C. Physical Mobility, Social Isolation and Cognitive Function: Are There Really Gender Differences? Am. J. Geriatr. Psychiatry 2023, 31, 726–736. [Google Scholar] [CrossRef] [PubMed]
  32. Paluska, S.A.; Schwenk, T.L. Physical activity and mental health: Current concepts. Sports Med. 2000, 29, 167–180. [Google Scholar] [CrossRef]
  33. Rebar, A.L.; Duncan, M.J.; Short, C.; Vandelanotte, C. Differences in health-related quality of life between three clusters of physical activity, sitting time, depression, anxiety, and stress. BMC Public Health 2014, 14, 1088. [Google Scholar] [CrossRef]
  34. Suh, J.H.; Kim, H.; Jung, G.P.; Ko, J.Y.; Ryu, J.S. The effect of lumbar stabilization and walking exercises on chronic low back pain: A randomized controlled trial. Medicine 2019, 98, e16173. [Google Scholar] [CrossRef]
  35. Geneen, L.J.; Moore, R.A.; Clarke, C.; Martin, D.; Colvin, L.A.; Smith, B.H. Physical activity and exercise for chronic pain in adults: An overview of Cochrane Reviews. Cochrane Database Syst. Rev. 2017, 1, Cd011279. [Google Scholar] [CrossRef]
  36. Failla, M.D.; Beach, P.A.; Atalla, S.; Dietrich, M.S.; Bruehl, S.; Cowan, R.L.; Monroe, T.B. Gender Differences in Pain Threshold, Unpleasantness, and Descending Pain Modulatory Activation Across the Adult Life Span: A Cross Sectional Study. J. Pain. 2024, 25, 1059–1069. [Google Scholar] [CrossRef]
  37. Kaufman, J.M.; Lapauw, B. Role of testosterone in cognition and mobility of aging men. Andrology 2020, 8, 1567–1579. [Google Scholar] [CrossRef]
  38. Andrasinova, T.; Adamova, B.; Buskova, J.; Kerkovsky, M.; Jarkovsky, J.; Bednarik, J. Is there a Correlation Between Degree of Radiologic Lumbar Spinal Stenosis and its Clinical Manifestation? Clin. Spine Surg. 2018, 31, E403–E408. [Google Scholar] [CrossRef]
  39. Kim, J.Y.; Kim, H.J. Frailty across chronic low back pain clusters: Insights from EQ-5D-5L. In Proceedings of the 78th Korean Pain Society Meeting, Seoul, Republic of Korea, 16 November 2024. [Google Scholar]
Figure 1. Study flowchart.
Medicina 61 01217 g001
Figure 2. The distribution of the EQ-5D-5L dimensions across the four cluster groups.
Medicina 61 01217 g002
Figure 3. The distribution of frailty status categorized based on the four clusters.
Medicina 61 01217 g003
Table 1. Patient characteristics, pain-related data, and frailty status of 837 patients with chronic LBP.
VariablesTotal
(n = 837)
Patient characteristics
Age, years72.01 ± 7.14 (60–96)
Female sex, n562 (67.1)
BMI, kg/m222.89 (20.81; 25.18)
Comorbid medical disease, n
Hypertension251 (30.0)
Diabetes mellitus146 (17.4)
Cancer130 (15.5)
Mental health problems107 (12.8)
Osteopenia/osteoporosis104 (12.4)
Spine surgery history, n197 (23.5)
Pain-related data
Baseline pain score
Mild (NRS 1–3), n46 (5.5)
Moderate (NRS 4–6), n329 (39.3)
Severe (NRS 7–10), n462 (55.2)
Pain duration, months12.00 (6.00; 49.00)
Opioid usage, n284 (33.9)
Sleep disturbance, n273 (32.6)
EQ-5D-5L
Mobility, >2, n433 (51.8)
Self-care, >2, n144 (17.2)
Usual activities, >2, n248 (29.6)
Pain/discomfort, >2, n587 (70.1)
Anxiety/depression, >2, n214 (25.6)
EQ-VAS, 0–10061.87 ± 17.89 (10–100)
EQ-5D-5L index0.63 ± 0.18 (−0.08–1.00)
Frailty status, n
Robust244 (29.2)
Pre-frail409 (48.9)
Frail184 (22.0)
Values are presented as mean ± standard deviation (SD) or number of patients (%). LBP, lower back pain; BMI, body mass index; NRS, Numeric Rating Scale; EQ-VAS, EQ Visual Analogue Scale.
Table 2. Characteristic comparison of derived cluster groups.
Cluster LabelCluster 1
(n = 122)
Cluster 2
(n = 172)
Cluster 3
(n = 370)
Cluster 4
(n = 173)
p-Value
Patient characteristics
Age, years71.90 ± 6.69
(60–88)
71.86 ± 7.37
(60–91)
72.13 ± 7.21
(60–96)
71.97 ± 7.12
(60–91)
0.975
Female sex, n **86 (70.5) 298 (57.0) 1,3,4258 (69.7) 2120 (69.4) 20.017
BMI, kg/m222.62 (20.75; 24.44)23.14 (21.64; 25.35)22.89 (20.77; 25.58)22.83 (20.52; 24.85)0.141
Comorbid medical disease, n
Hypertension37 (30.3)57 (33.1)106 (28.6)51 (29.5)0.763
Diabetes mellitus15 (12.3)35 (20.3)64 (17.3)32 (18.5)0.335
Cancer19 (15.6)29 (16.9)54 (14.6)28 (16.2)0.911
Mental health problems11 (9.0)22 (12.8)49 (13.2)25 (14.5)0.561
Osteopenia/osteoporosis13 (10.7)23 (13.4)42 (11.4)26 (15.0)0.580
Spine surgery history21 (17.2)38 (22.1)96 (25.9)42 (24.3)0.245
Pain-related data
Baseline pain score
Mild (NRS 1–3), n **5 (4.1) 3,44 (2.3) 3.426 (7.0) 1,211 (6.4) 1,2<0.001
Moderate (NRS 4–6), n34 (27.9) 3,454 (31.4) 3,4162 (43.8) 1,279 (45.7) 1,2
Severe (NRS 7–10), n83 (68.0) 3,4114 (66.3) 3,4182 (49.2) 1,283 (48.0) 1,2
Pain duration, months13.50 (6.00; 60.00)12.00 (5.00; 36.00)24.00 (6.00; 60.00)12.00 (6.00; 38.00)0.050
Opioid usage, n38 (31.1)63 (36.6)123 (33.2)60 (34.7)0.777
Sleep disturbance, n51 (41.8)61 (35.5)112 (30.3)49 (28.3)0.053
EQ-5D-5L
EQ-VAS, 0–100 *56.80 ± 18.53
(10–90) 2,3,4
63.84 ± 16.16
(20–100) 1
62.01 ± 18.10
(10–100) 1
63.21 ± 18.11
(10–100) 1
0.005
EQ-5D-5L index *0.55 ± 0.18
(0.16–0.83) 3,4
0.55 ± 0.17
(0.08–0.80) 3,4
0.66 ± 0.17
(−0.08–1.00) 1,2
0.69 ± 0.15
(0.19–0.86) 1,2
<0.001
Frailty status, n **
Robust29 (23.8) 2,3,419 (11.0) 1,3,4135 (36.5) 1,2,461 (35.3) 1,2,3<0.001
Pre-frail64 (52.5) 2,3,4104 (60.5) 1,3,4152 (41.1) 1,2,489 (51.4) 1,2,3
Frail29 (23.8) 2,3,449 (28.5) 1,3,483 (22.4) 1,2,423 (13.3) 1,2,3
Values are presented as mean ± standard deviation (SD) or number of patients (%). BMI, body mass index; NRS, Numeric Rating Scale; EQ-VAS, EQ Visual Analogue Scale. * Bonferroni’s multiple comparison test (p < 0.05); ** Chi-square post hoc difference (p < 0.05). 1, vs. cluster 1; 2, vs. cluster 2; 3, vs. cluster 3; 4, vs. cluster 4.
Disclaimer/Publisher’s Note: The statements, opinions and data contained in all publications are solely those of the individual author(s) and contributor(s) and not of MDPI and/or the editor(s). MDPI and/or the editor(s) disclaim responsibility for any injury to people or property resulting from any ideas, methods, instructions or products referred to in the content.

