
Changes in the Outcome of Pediatric Patients with Acute Lymphoblastic Leukemia—Single Center, Real-Life Experience

 , , ,
, , ,
Abstract
1. Introduction
2. Materials and Methods
2.1. Specific Diagnostic and Monitoring Procedures
- Adverse prognosis = hypodiploidy/BCR::ABL1/KMT2A;
- Favorable prognosis = ETV6::RUNX1/hyperdiploidy);
- Other = identified mutations with no stratification impact;
- None = unidentified mutations by classical methods, previously described.
2.2. Treatment Protocols
- Intravenous dexamethasone used in induction, after a week of oral prednisone, to improve treatment adherence of small children by using intravenous administration instead of several tablets administered orally.
- No prophylactic use of irradiation therapy, due to logistical difficulties and no evidence-based studies showing radiotherapy benefits compared to chemotherapy.
- (1)
- T1 patients were treated according to the ALL IC BFM 2009 protocol. The stratification criteria for T1: HRG had PPR or BCR::ABL1 or KMT2A::AFF1 or hypodiploidy ≤ 44 chromosomes or D15 FCM-MRD ≥ 10% or no CR by TP1; SRG had age > 1 and <6 years; and leukocyte count at diagnosis < 20 × 109/L; and PGR and D15 FCM-MRD < 0.1% and CR on TP1; IRG were the remaining patients.
- (2)
- For T2, the treatment plan was based on the ALL AIEOP BFM 2017 protocol: HRG had PPR only in T-cell ALL or BCR::ABL1 or KMT2A::AFF1 or hypodiploidy ≤ 44 chromosomes or D15 FCM-MRD ≥ 10% or TP1 FCM-MRD ≥ 5 × 10⁻⁴; SRG D15 FCM-MRD < 0.1%; and negative FCM-MRD on TP1; IRG were the remaining patients.
2.3. Statistical Analysis
3. Results
4. Discussion
5. Conclusions
Supplementary Materials
Author Contributions
Funding
Institutional Review Board Statement
Informed Consent Statement
Data Availability Statement
Acknowledgments
Conflicts of Interest
Abbreviations
| ALL | Acute lymphoblastic leukemia |
| BFM | Berlin-Frankfurt-Münster |
| CR | Complete remission |
| CI | Confidence interval |
| CIR | Cumulative incidence of relapse |
| D15 | Day 15 |
| D33, TP1 | Day 33 |
| D78, TP2 | Day 78 |
| EOI | End of induction |
| EFS | Event-free survival |
| FCM | Flowcytometry |
| HR | Hazard ratio |
| HSCT | Hematopoietic stem cell transplant |
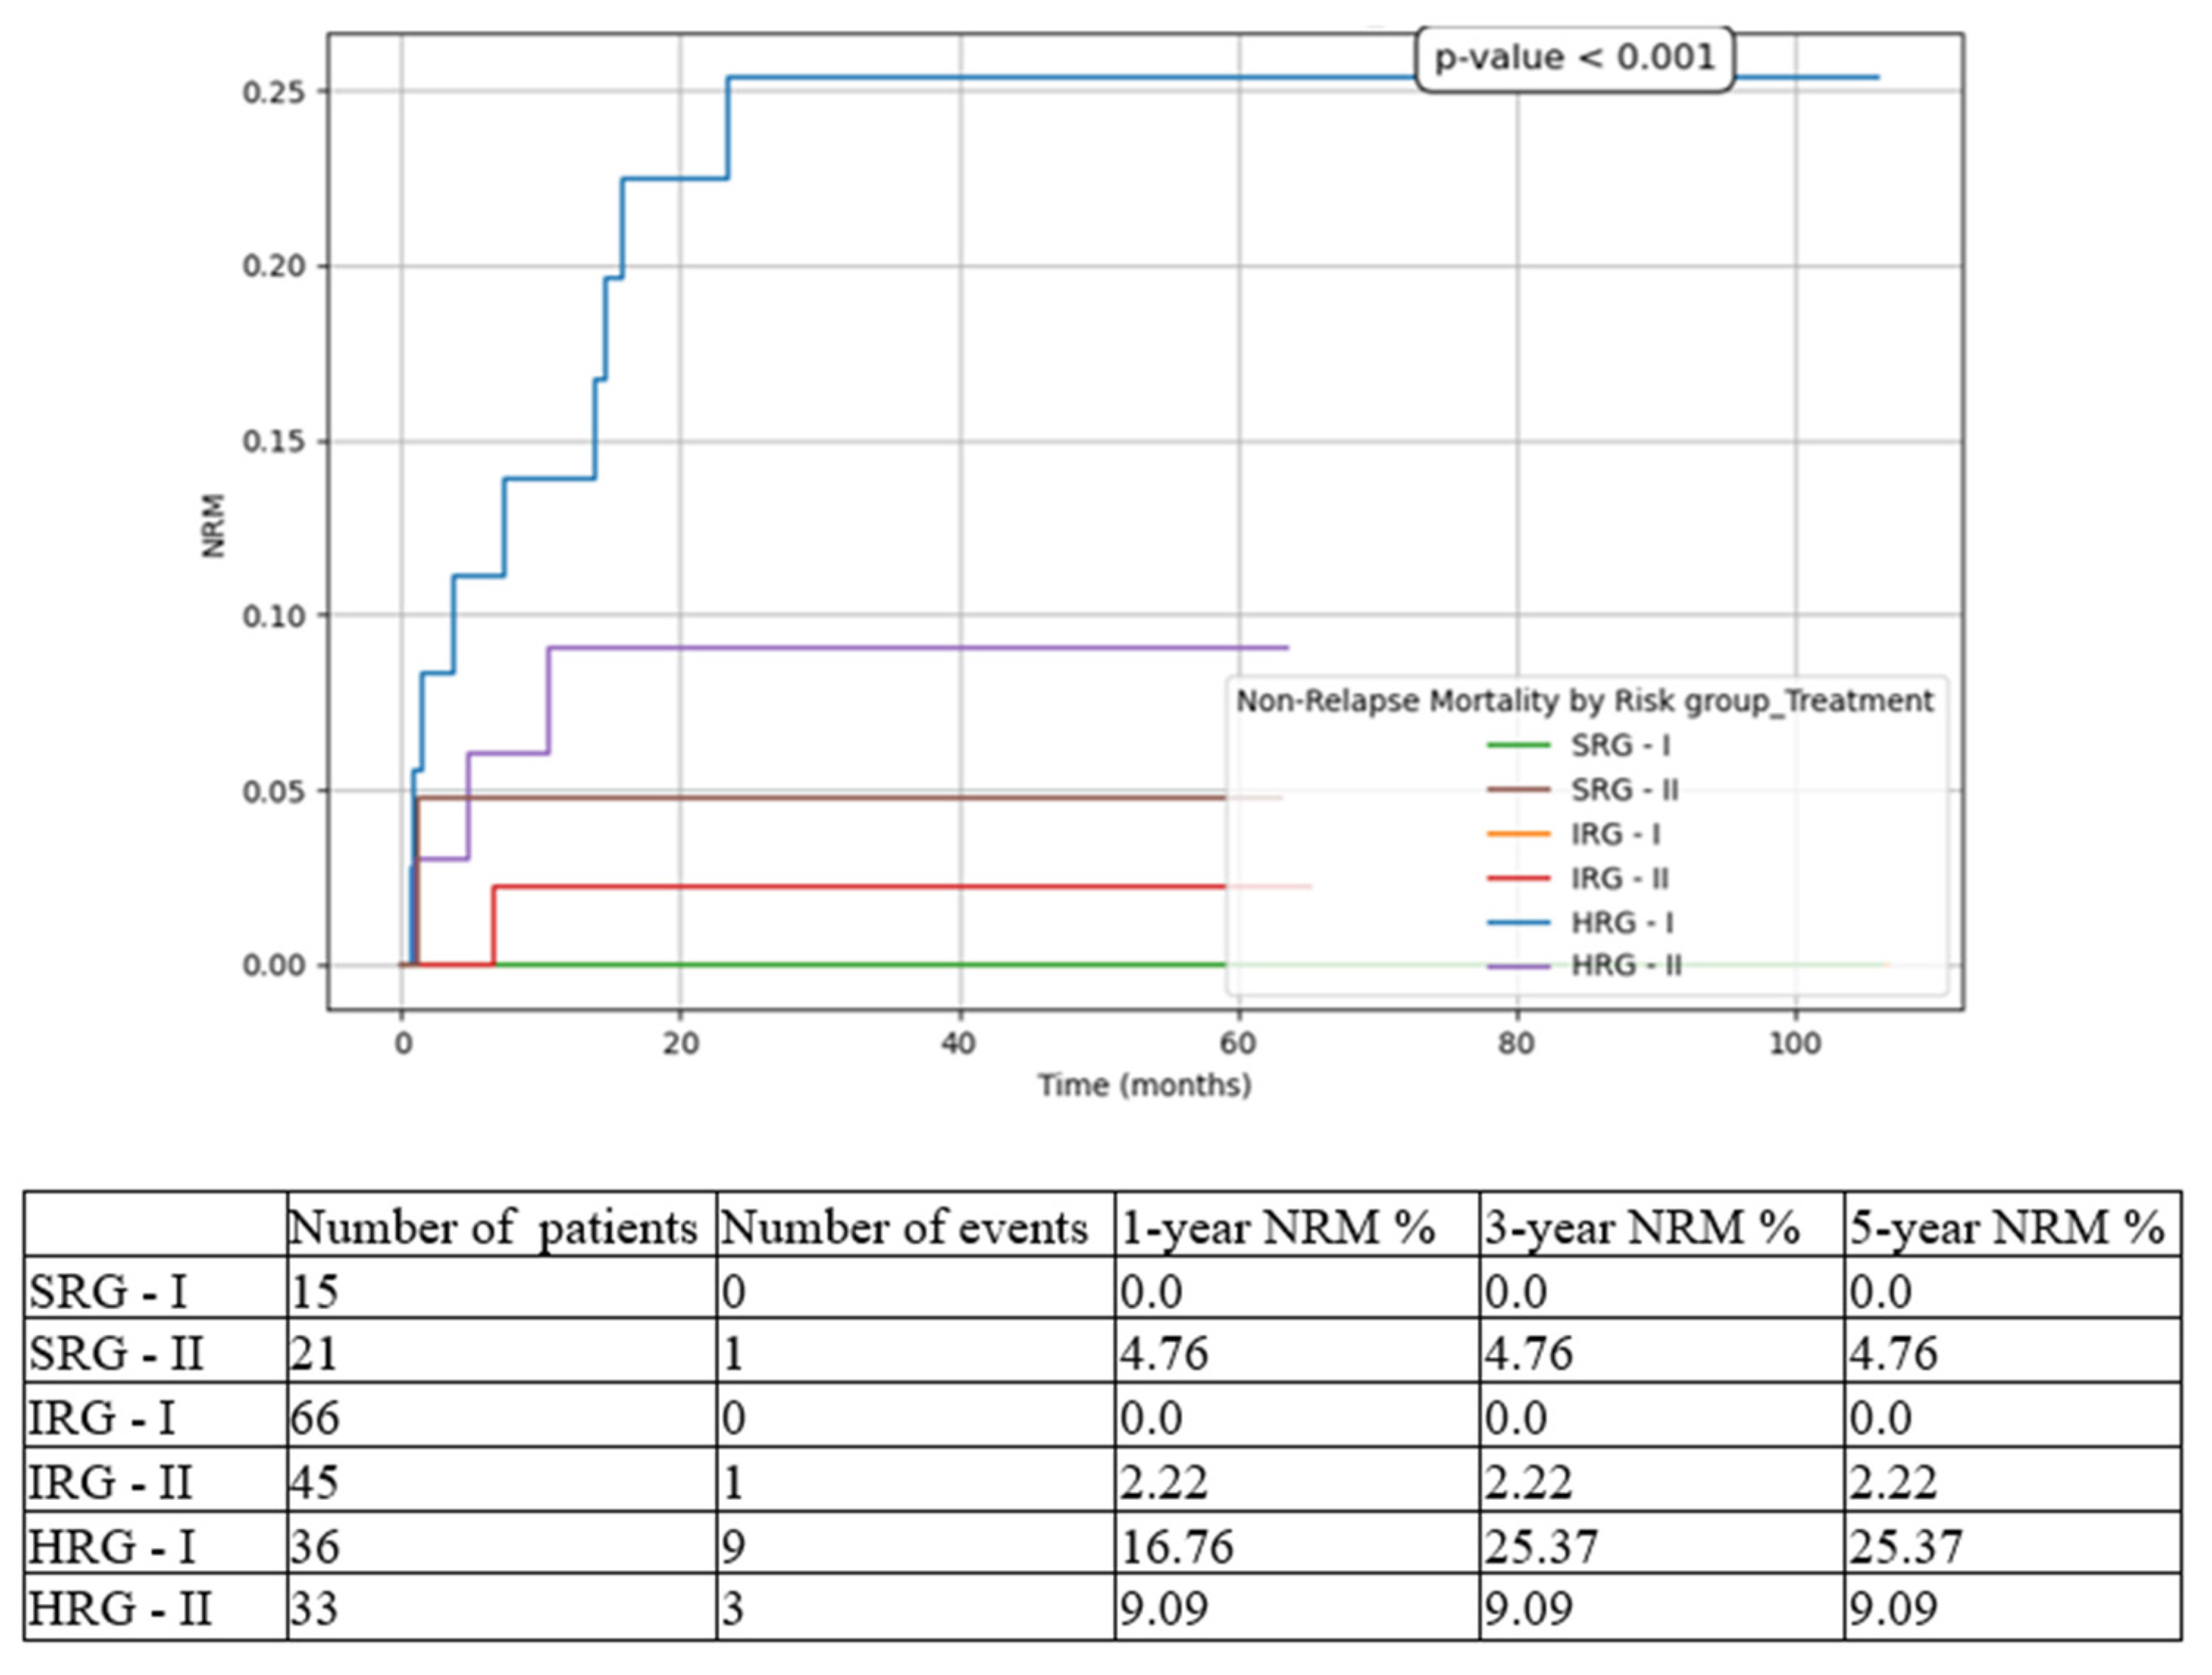
| HRG | High-risk group |
| IRG | Intermediate-risk group |
| MRD | Measurable residual disease |
| NRM | Non-relapse mortality |
| OS | Overall survival |
| PGR | Prednisone good response |
| PPR | Prednisone poor response |
| RFS | Relapse-free survival |
| SRG | Standard-risk group |
References
- Devilli, L.; Garonzi, C.; Balter, R.; Bonetti, E.; Chinello, M.; Zaccaron, A.; Vitale, V.; De Bortoli, M.; Caddeo, G.; Barett, V.; et al. Long-term and quality of survival in patients treated for acute lymphoblastic leukemia during the pediatric age. Hematol. Rep. 2021, 13, 8847. [Google Scholar] [CrossRef] [PubMed]
- Brady, S.W.; Roberts, K.G.; Gu, Z.; Shi, L.; Pounds, S.; Pei, D.; Cheng, C.; Dai, Y.; Devidas, M.; Qu, C.; et al. The genomic landscape of pediatric acute lymphoblastic leukemia. Nat. Genet. 2022, 54, 1376–1389. [Google Scholar] [CrossRef]
- Roberts, K.G.; Li, Y.; Payne-Turner, D.; Harvey, R.C.; Yang, Y.L.; Pei, D.; McCastlain, K.; Ding, L.; Lu, C.; Song, G.; et al. Targetable kinase-activating lesions in Ph-like acute lymphoblastic leukemia. N. Engl. J. Med. 2014, 371, 1005–1015. [Google Scholar] [CrossRef] [PubMed]
- Campbell, M.; Kiss, C.; Zimmermann, M.; Riccheri, C.; Kowalczyk, J.; Felice, M.S.; Kuzmanovic, M.; Kovacs, G.; Kosmidis, H.; Gonzalez, A.; et al. Childhood Acute Lymphoblastic Leukemia: Results of the Randomized Acute Lymphoblastic Leukemia Intercontinental-Berlin-Frankfurt-Münster 2009 Trial. J. Clin. Oncol. 2023, 41, 3499–3511. [Google Scholar] [CrossRef]
- Romanian Society of Pediatric Oncology and Hematology, National Registry for Pediatric Oncological and Hematological Patients. Available online: https://srohp.ro/wp-content/uploads/2024/02/RNOHP-cu-studiu-2023.pdf (accessed on 18 April 2025).
- Angiolillo, A.; Schore, R.J.; Kairalla, J.; Devidas, M.; Rabin, K.R.; Zweidler-McKay, P.A.; Borowitz, M.J.; Wood, B.L.; Carroll, A.J.; Heerema, N.A.; et al. Excellent Outcomes with Reduced Frequency of Vincristine and Dexamethasone Pulses in Children with National Cancer Institute (NCI) Standard-Risk B Acute Lymphoblastic Leukemia (SR B-ALL): A Report from Children’s Oncology Group (COG) Study AALL0932. Blood 2019, 134 (Suppl. 1), 824. [Google Scholar] [CrossRef]
- Yang, W.; Cai, J.; Shen, S.; Gao, J.; Yu, J.; Hu, S.; Jiang, H.; Fang, Y.; Liang, C.; Ju, X.; et al. Pulse therapy with vincristine and dexamethasone for childhood acute lymphoblastic leukaemia (CCCG-ALL-2015): An open-label, multicentre, randomised, phase 3, non-inferiority trial. Lancet Oncol. 2021, 22, 1322–1332. [Google Scholar] [CrossRef]
- Horn, P.R.C.B.; Ribeiro-Carvalho, M.M.; de Azevedo, A.M.B.; de Souza, A.M.; Faria, S.; Wiggers, C.; Rouxinol, S.; Schramm, M.T.; Sanches, B.S.; Duarte, N.L.; et al. Long-Term Outcomes of Childhood Acute Lymphocytic Leukemia Treated with Adapted Berlin–Frankfurt–Münster (BFM) Protocols: A Multicentric Analysis from a Developing Country. Cancers 2024, 16, 2898. [Google Scholar] [CrossRef]
- Moreira, D.C.; Gonzalez-Ramella, O.; Valenzuela, M.E.; Carillo, A.K.; Faughnan, L.; Job, G.; Chen, Y.; Villegas, C.; Irigoyen, A.E.; Urbays, R.B.; et al. Evaluation of factors leading to poor outcomes for pediatric acute lymphoblastic leukemia in Mexico: A multi-institutional report of 2,116 patients. Front. Oncol. 2023, 13, 1255555. [Google Scholar] [CrossRef] [PubMed]
- Correa, B.T.; Silva, G.S.S.; Mendes, W.J.S.; Maia, A.d.M.; Aleluia, A.C.M.; Fonseca, T.C.C.; da Guarda, C.C.; Gonçalves, M.d.S.; Aleluia, M.M. Association of the clinical profile and overall survival of pediatric patients with acute lymphoblastic leukemia. Front. Pediatr. 2023, 11, 1223889. [Google Scholar] [CrossRef]
- Duffy, C.; Graetz, D.E.; Lopez, A.M.Z.; Carrillo, A.K.; Job, G.; Chen, Y.; Devidas, M.; Leon, S.A.; Bonzi, S.A.; Flores, P.C.; et al. Retrospective analysis of outcomes for pediatric acute lymphoblastic leukemia in South American centers. Front. Oncol. 2023, 13, 1254233. [Google Scholar] [CrossRef]
- Vagharshakyan, L.; Tamamyan, G.; Avagyan, A.; Vardanyan, G.; Grigoryan, H.; Anastasiadi, M.; Krmoyan, L.; Khalatyan, I.; Hovhannisyan, S.; Marirosyan, N.; et al. ALL-280 Our Experience Treating Childhood Acute Lymphoblastic Leukemia in Armenia. Clin. Lymphoma Myeloma Leuk. 2022, 22, S200. [Google Scholar] [CrossRef]
- Chennamaneni, R.; Gundeti, S.; Konatam, M.L.; Bala, S.; Kumar, A.; Srinivas, L. Impact of cytogenetics on outcomes in pediatric acute lymphoblastic leukemia. South Asian J. Cancer 2018, 7, 263–266. [Google Scholar] [CrossRef]
- Qiu, K.Y.; Xu, H.G.; Luo, X.Q.; Mai, H.R.; Liao, N.; Yang, L.H.; Zheng, M.C.; Wan, W.Q.; Wu, X.D.; Liu, R.Y.; et al. Prognostic Value and Outcome for ETV6/RUNX1-Positive Pediatric Acute Lymphoblastic Leukemia: A Report From the South China Children’s Leukemia Group. Front. Oncol. 2021, 11, 797194. [Google Scholar] [CrossRef] [PubMed]
- Wang, Y.; Zeng, H.M.; Zhang, L.P. ETV6/RUNX1-positive childhood acute lymphoblastic leukemia in China: Excellent prognosis with improved BFM protocol. Riv. Ital. Pediatr. 2018, 44, 94. [Google Scholar] [CrossRef]
- Lee, J.K.; Kim, S.; Jang, P.S.; Chung, N.G.; Cho, B. Differing Outcomes of Patients with High Hyperdiploidy and ETV6-RUNX1 Rearrangement in Korean Pediatric Precursor B Cell Acute Lymphoblastic Leukemia. Cancer Res. Treat. 2021, 53, 567–575. [Google Scholar] [CrossRef] [PubMed]
- Sidhom, I.; Shaaban, K.; Yousedd, S.H.; Ali, N.; Gohar, S.; Rashed, W.M.; Mehanna, M.; Salem, S.; Soliman, S.; Yassin, D.; et al. Reduced-intensity therapy for pediatric lymphoblastic leukemia: Impact of residual disease early in remission induction. Blood 2021, 137, 20–28. [Google Scholar] [CrossRef]
- Pui, C.H.; Pei, D.; Raimondi, S.C.; Raimond, S.C.; Coustan-Smith, E.; Jeha, S.; Cheng, C.; Bowman, W.P.; Sandlund, J.T.; Ribeiro, R.C.; et al. Clinical impact of minimal residual disease in children with different subtypes of acute lymphoblastic leukemia treated with Response-Adapted therapy. Leukemia 2017, 31, 333–339. [Google Scholar] [CrossRef]
- Berry, D.A.; Zhou, S.; Higley, H.; Mukundan, L.; Fu, S.; Reaman, G.H.; Wood, B.L.; Kelloff, G.J.; Jessup, J.M.; Radich, J.R. Association of minimal residual disease with clinical outcome in pediatric and adult acute lymphoblastic leukemia. JAMA Oncol. 2017, 3, e170580. [Google Scholar] [CrossRef]
- Zou, P.; Zhou, M.; Wen, J.; Liao, X.; Shen, Y.; Liu, H.; Song, L.; Xiao, J. The long-term outcomes and risk factors for precursor B-cell acute lymphoblastic leukemia without specific fusion genes in Chinese children: Experiences from multiple centers. Bosn. J. Basic Med. Sci. 2022, 22, 238–246. [Google Scholar] [CrossRef]
- Yu, C.H.; Jou, S.T.; Su, Y.H.; Coustan-Smith, E.; Wu, G.; Cheng, C.N.; Lu, M.Y.; Lin, K.H.; Wu, K.H.; Chen, S.H.; et al. Clinical impact of minimal residual disease and genetic subtypes on the prognosis of childhood acute lymphoblastic leukemia. Cancer 2023, 129, 790–802. [Google Scholar] [CrossRef]
- Jinwala, P.; Patidar, R.; Bansal, S.; Bansai, S.; Asati, V.; Shrivastava, S.P.; Elhence, A.; Patel, S.; Chitalkar, P.G. Initial Experiences in Adolescents and Young Adults with T-Cell Acute Lymphoblastic Leukemia/Lymphoma Treated with the Modified BFM 2002 Protocol in a Resource-Constrained Setting. South Asian J. Cancer 2023, 12, 378–383. [Google Scholar] [CrossRef] [PubMed]
- Feng, J.; Cheng, F.W.T.; Chiang, A.K.S.; Lam, G.K.S.; Chow, T.T.W.; Ha, S.Y.; Luk, C.W.; Li, C.H.; Ling, S.C.; Yau, P.W.; et al. Outcomes of adolescents with acute lymphoblastic leukaemia. Hong Kong Med. J. 2022, 28, 204–214. [Google Scholar] [CrossRef] [PubMed]
- Jaime-Pérez, J.C.; Jiménez-Castillo, R.A.; Pinzón-Uresti, M.A.; Cantú-Rodríguez, O.G.; Herrera-Garza, J.L.; Marfil-Rivera, L.J.; Gomez-Almaguer, D. Real-world outcomes of treatment for acute lymphoblastic leukemia during adolescence in a financially restricted environment: Results at a single center in Latin America. Pediatr. Blood Cancer 2017, 64, e26396. [Google Scholar] [CrossRef]
- Demidowicz, E.; Pogorzała, M.; Łęcka, M.; Żołnowska, H.; Marjańska, A.; Kubicka, M.; Kurylo-Rafinska, B.; Czyzewshi, K.; Debski, R.; Koltan, A.; et al. Outcome of Pediatric Acute Lymphoblastic Leukemia: Sixty Years of Progress. Anticancer Res. 2019, 39, 5203–5207. [Google Scholar] [CrossRef] [PubMed]
- Kowalczyk, J.R.; Zawitkowska, J.; Lejman, M.; Drabko, K.; Samardakiewicz, M.; Matysiak, M.; Romiszewski, M.; Balwierz, W.; Ćwiklińska, M.; Kazanowska, B.; et al. Long-term treatment results of Polish pediatric and adolescent patients enrolled in the ALL IC-BFM 2002 trial. Am. J. Hematol. 2019, 94, E307–E310. [Google Scholar] [CrossRef]
- Sun, Y.; Zhang, Y.; Feng, G.; Chen, Z.; Gao, C.; Liu, S.; Zhang, R.; Zhang, H.; Zheng, X.; Gong, W.; et al. An improved advanced fragment analysis-based classification and risk stratification of pediatric acute lymphoblastic leukemia. Cancer Cell Int. 2019, 19, 110. [Google Scholar] [CrossRef]


| Total (n = 223) | T1 (n = 121) | T2 (n = 102) | p-Value | ||
|---|---|---|---|---|---|
| Gender | Female | 91 (40.8%) | 50 (41.32%) | 41 (40.20%) | 0.892 |
| Male | 132 (59.2%) | 71 (58.68%) | 61 (59.80%) | ||
| Age groups | <1 y | 2 (0.90%) | 0 (0.00%) | 2 (1.96%) | 0.301 |
| ≥1 y and <10 y | 152 (68.16%) | 83 (68.60%) | 69 (67.65%) | ||
| ≥10 y | 69 (30.94%) | 38 (31.40%) | 31 (30.39%) | ||
| Leukocyte groups | <50 × 109/L | 175 (78.47%) | 97 (80.17%) | 78 (76.47%) | 0.518 |
| ≥50 × 109/L | 48 (21.53%) | 24 (19.83%) | 24 (23.53%) | ||
| Morphology | L1 | 213 (95.51%) | 116 (95.87%) | 98 (96.08%) | 1 |
| L2 | 9 (4.03%) | 5 (4.13%) | 4 (3.92%) | ||
| Immunophenotype | B | 196 (87.89%) | 106 (87.60%) | 90 (88.24%) | 1 |
| T | 27 (12.11%) | 15 (12.40%) | 12 (11.76%) | ||
| Genetics and molecular biology | Hyperdiploidy | 23 (10.31%) | 11 (9.09%) | 12 (11.76%) | 0.305 |
| Trisomy 21 | 3 (1.34%) | 3 (2.48%) | 0 (0.00%) | ||
| KMT2A | 3 (1.34%) | 1 (0.83%) | 2 (1.96%) | ||
| TCF3::PBX1 | 12 (5.38%) | 4 (3.31%) | 8 (7.84%) | ||
| ETV6::RUNX1 | 42 (18.83%) | 23 (19.01%) | 19 (18.63%) | ||
| SIL::TAL1 | 2 (0.89%) | 0 (0.00%) | 2 (1.96%) | ||
| BCR::ABL1 | 10 (4.47%) | 7 (5.79%) | 3 (2.94%) | ||
| Other | 21 (9.41%) | 13 (10.74%) | 8 (7.84%) | ||
| None | 107 (47.98%) | 59 (48.76%) | 48 (47.05%) | ||
| Genetic risk groups | Adverse prognosis | 13 (5.82%) | 8 (6.61%) | 5 (4.90%) | 0.895 |
| Favorable prognosis | 61 (27.35%) | 31 (25.62%) | 30 (29.41%) | ||
| Other | 42 (18.83%) | 23 (19.01%) | 19 (18.62%) | ||
| None | 107 (47.98%) | 59 (48.76%) | 48 (47.06%) |
| T1 | T2 | |
|---|---|---|
| Risk stratification | SRG 12.39% | SRG 20.58% |
| IRG 54.54% | IRG 44.11% | |
| HRG 29.75% | HRG 32.35% | |
| FCM-MRD < 0.05 × 10⁻⁴ rate at EOI | 80.7% | 87.75% |
| 5-year EFS | 70.22% | 73.79% |
| 5-year CIR | 19.04% | 18.36% |
| 5-year OS | 82.54% | 88.18% |
| Death-before-EOI rate | 5.78% | 3.92% |
| Death-in-CR rate | 5.26% | 4.08% |
| 5-year NRM | 10.77% | 7.85% |
| 5-year RFS | 80.97% | 81.76% |
Disclaimer/Publisher’s Note: The statements, opinions and data contained in all publications are solely those of the individual author(s) and contributor(s) and not of MDPI and/or the editor(s). MDPI and/or the editor(s) disclaim responsibility for any injury to people or property resulting from any ideas, methods, instructions or products referred to in the content. |
© 2025 by the authors. Published by MDPI on behalf of the Lithuanian University of Health Sciences. Licensee MDPI, Basel, Switzerland. This article is an open access article distributed under the terms and conditions of the Creative Commons Attribution (CC BY) license (https://creativecommons.org/licenses/by/4.0/).
Share and Cite
Radu, L.E.; Marcu, A.D.; Bica, A.M.; Marcu, A.M.; Serbanica, A.N.; Jercan, C.G.; Jardan, C.; Popa, D.C.; Constantin, C.; Vasilescu, A.M.; et al. Changes in the Outcome of Pediatric Patients with Acute Lymphoblastic Leukemia—Single Center, Real-Life Experience. Medicina 2025, 61, 1129. https://doi.org/10.3390/medicina61071129
Radu LE, Marcu AD, Bica AM, Marcu AM, Serbanica AN, Jercan CG, Jardan C, Popa DC, Constantin C, Vasilescu AM, et al. Changes in the Outcome of Pediatric Patients with Acute Lymphoblastic Leukemia—Single Center, Real-Life Experience. Medicina. 2025; 61(7):1129. https://doi.org/10.3390/medicina61071129
Chicago/Turabian StyleRadu, Letitia E., Andra D. Marcu, Ana M. Bica, Ana M. Marcu, Andreea N. Serbanica, Cristina G. Jercan, Cerasela Jardan, Delia C. Popa, Cristina Constantin, Andrei M. Vasilescu, and et al. 2025. "Changes in the Outcome of Pediatric Patients with Acute Lymphoblastic Leukemia—Single Center, Real-Life Experience" Medicina 61, no. 7: 1129. https://doi.org/10.3390/medicina61071129
APA StyleRadu, L. E., Marcu, A. D., Bica, A. M., Marcu, A. M., Serbanica, A. N., Jercan, C. G., Jardan, C., Popa, D. C., Constantin, C., Vasilescu, A. M., Niculita, O. O., Sfetea, R., & Colita, A. (2025). Changes in the Outcome of Pediatric Patients with Acute Lymphoblastic Leukemia—Single Center, Real-Life Experience. Medicina, 61(7), 1129. https://doi.org/10.3390/medicina61071129