
An Epidemiological Study on Legionnaires’ Disease in Gyeonggi Province, Korea: Occurrence, Infection Routes, and Risk Factors for Mortality (2016–2022)


Abstract
1. Introduction
2. Materials and Methods
2.1. Case Definition
2.2. Data Source
- General characteristics (age, gender)
- Clinical characteristics
- Clinical symptoms: For confirmed and suspected cases, the medical records of individuals with a history of visits to a healthcare facility were reviewed. Those with one or more of the following clinical symptoms were classified as “Yes”: fever, chills, cough, general fatigue, headache, myalgia, arthralgia, chest pain, loss of appetite, hemoptysis, dyspnea, nausea, vomiting, consciousness disorder, diarrhea, and sore throat. Asymptomatic cases were classified as “No”. For individuals with no medical records, classification was made through interviews.
- Healthcare facility utilization history: For individuals who could be interviewed, a direct telephone interview was conducted. If communication with the patient or suspected case was impeded, the caregiver or public health center was consulted. Upon confirmation of a healthcare facility utilization history, the facility was visited for medical record review to verify the visit history, diagnosis upon admission, length of hospital stay, and reason for admission through medical records.
- Antibiotic use history: For patients and suspected cases with a healthcare facility visit history, medical records were reviewed to check the antibiotic use history. If either macrolide, quinolones, tetracycline, rifampin, or other antibiotics were used, the case was classified as “Yes”. If no antibiotics were used, it was classified as “No”.
- Complications: For patients and suspected cases with a healthcare facility visit history, medical records were reviewed to check the presence of complications. Cases with respiratory failure, renal failure, multiple organ failure, neurological deficit, lung abscess, or empyema were classified as “Yes”. Cases showing none of these symptoms were classified as “No”. Cases of missing data or uncertainties regarding the occurrence of complications at the time of the investigation were classified as “Undetermined”.
- Coinfection: For patients and suspected cases with a healthcare facility visit history, medical records were reviewed to check the presence of pathogens other than Legionella spp., as confirmed through the laboratory testing of clinical specimens. Depending on the presence or absence of such pathogens, cases were classified as “Yes” or “No”.
- Time lag between symptom onset and diagnosis: The duration from the onset of symptoms to the day of diagnosis was calculated for all patients and suspected cases.
- Hospital admission-to-diagnosis time lag: The duration from the date of hospital admission to the date of diagnosis was calculated for hospitalized patients and suspected cases.
- Mortality: For patients and suspected cases with a healthcare facility visit history, medical records were reviewed to check mortality. Depending on whether death occurred within 30 days of admission or not, cases were classified as “Yes” or “No”.
- 3.
- Risk factors
- Underlying diseases: Cases were classified as “Yes” if they had one or more of the following chronic diseases: chronic pulmonary disease (chronic obstructive pulmonary disease, asthma, tuberculosis, others), immunological disorders (autoimmune diseases, acquired immunodeficiency syndrome, others), blood disorders (aplastic anemia, others), or other chronic diseases (cancer, chronic renal failure, diabetes, others). Cases without any underlying diseases were classified as “No”.
- Alcohol consumption: Current drinkers were classified as “Yes” and former or never-drinkers as “No”. Among the current drinkers, the average amount of soju consumed daily and the frequency of drinking per week were examined.
- Smoking status: Current smokers were classified as “Yes” and former or never-smokers as “No”. Among the current smokers, the average number of cigarettes smoked per day and the duration of smoking (in years) were examined.
- 4.
- Exposure factors (infection routes)
- Community-acquired infection: This category encompasses infections that are not hospital-acquired or travel-related. These infections occur in settings where exposure to water systems is suspected, typically within 2 weeks before the onset of symptoms. Examples include workplaces, large buildings, department stores, swimming pools, and saunas. Additionally, domestic infections fall under this category, arising from continuous residence and use of home water systems within 2 weeks prior to symptom onset.
- Nosocomial infection: Classification is based on the length of hospital stay prior to the onset of Legionellosis, along with environmental investigation findings, with a focus on hospitalization within 10 days before symptom onset.
- Other: This category encompasses infections that are travel-related, occurring after an overnight stay in Korea or abroad within 2 weeks prior to symptom onset, as well as cases where the route of infection is unknown or falls outside the definitions of nosocomial or community-acquired infections.
2.3. Statistical Analysis
2.4. Ethics Statement
3. Results
3.1. Incidence of LD
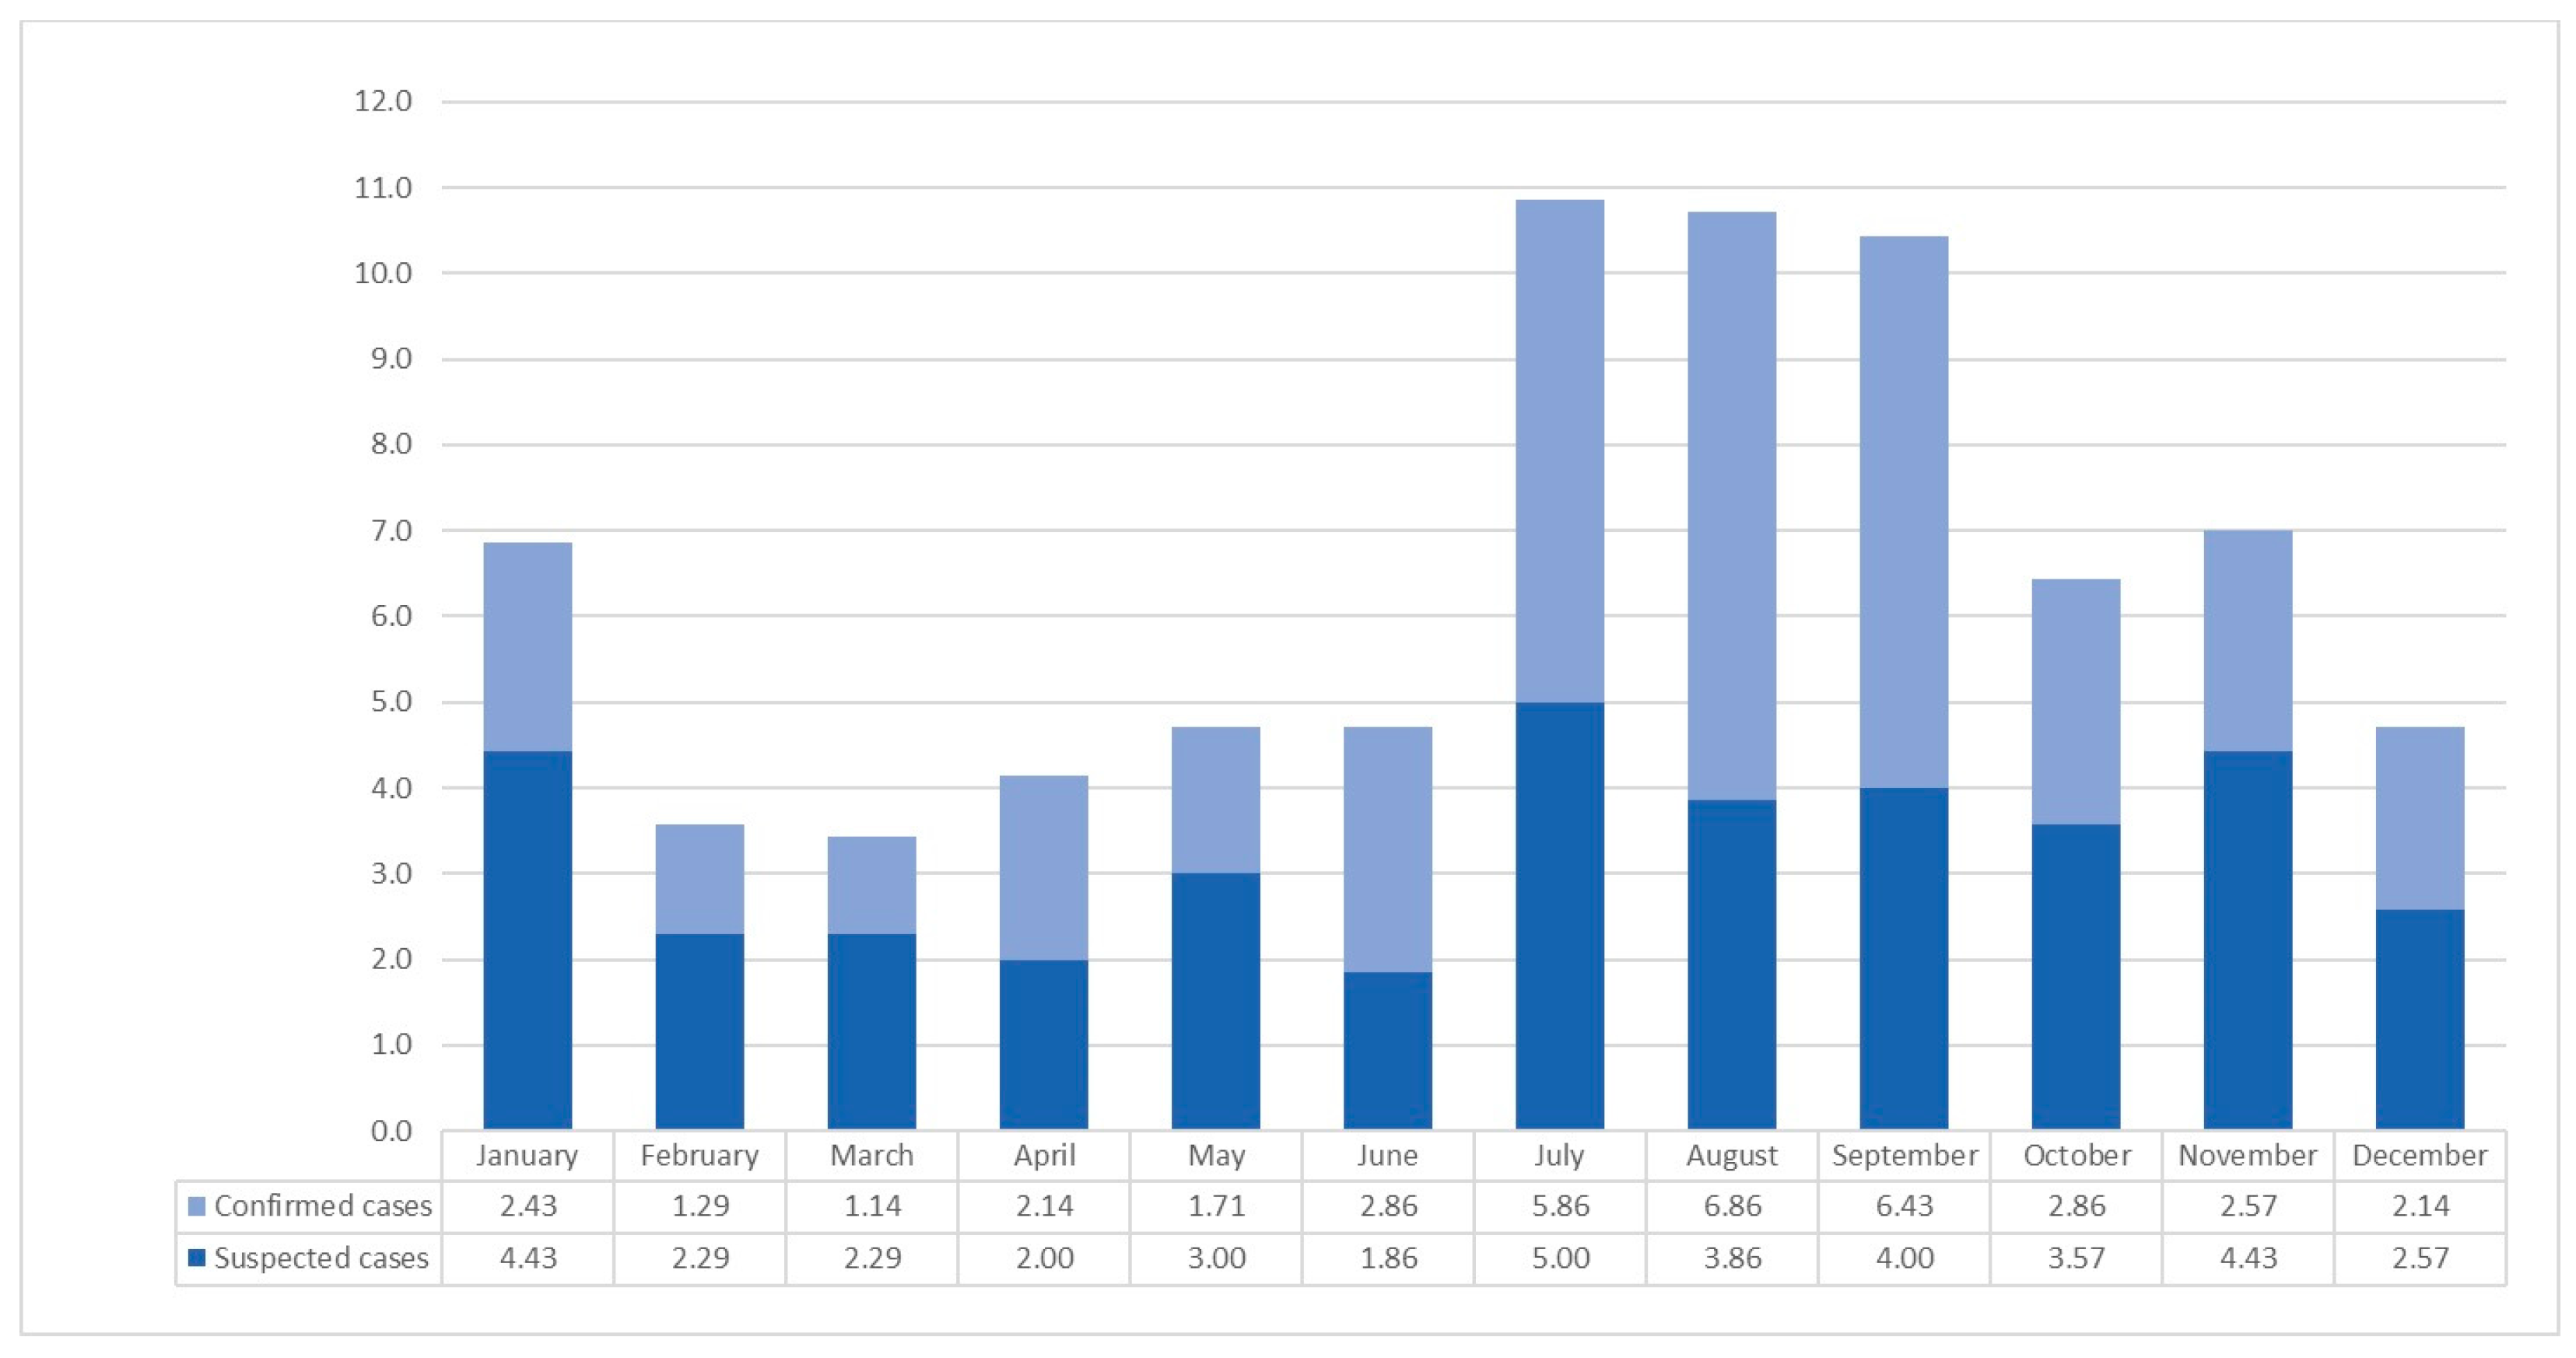
3.2. Monthly Incidence
3.3. Basic Characteristics
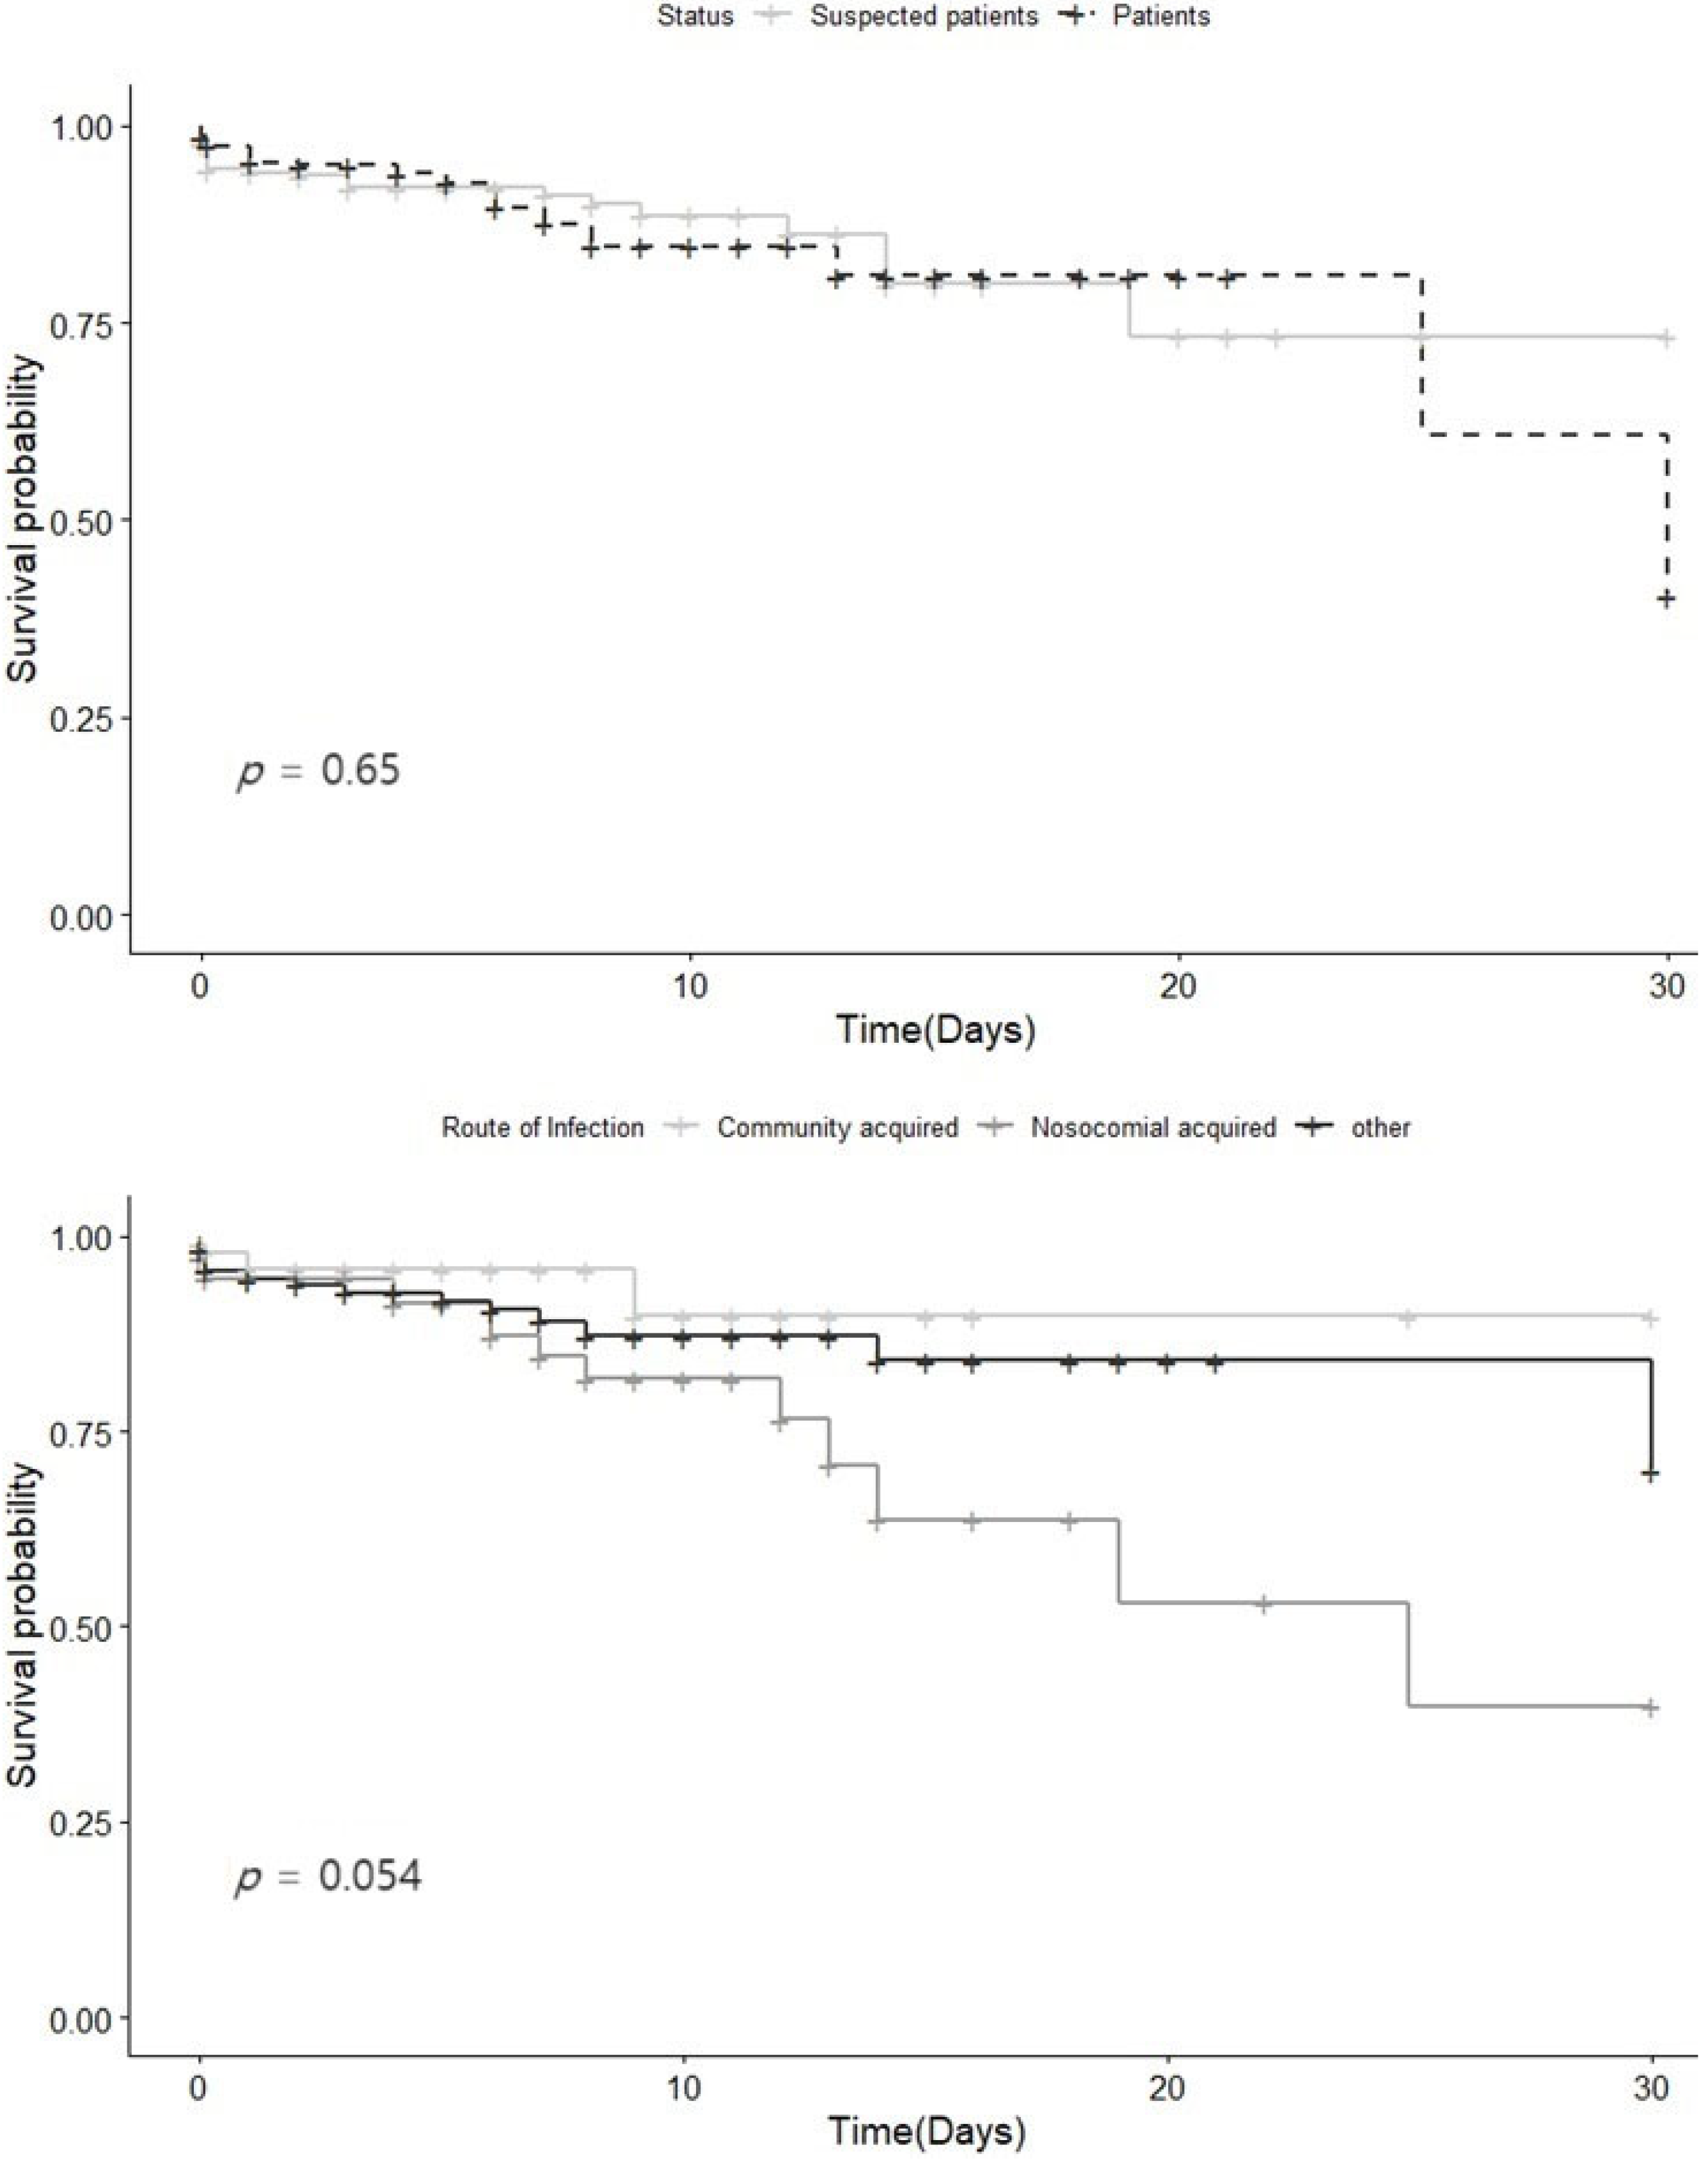
3.4. Survival Curve
3.5. Factors Associated with Survival
4. Discussion
5. Conclusions
Author Contributions
Funding
Institutional Review Board Statement
Informed Consent Statement
Data Availability Statement
Conflicts of Interest
References
- Fraser, D.W.; Tsai, T.R.; Orenstein, W.; Parkin, W.E.; Beecham, H.J.; Sharrar, R.G.; Harris, J.; Mallison, G.F.; Martin, S.M.; McDade, J.E.; et al. Legionnaires’ disease: Description of an epidemic of pneumonia. N. Engl. J. Med. 1977, 297, 1189–1197. [Google Scholar] [CrossRef]
- Hicks, L.A.; Garrison, L.E.; Nelson, G.E.; Hampton, L.M. Legionellosis—United States, 2000–2009. Am. J. Transpl. 2012, 12, 250–253. [Google Scholar]
- Wickramasekaran, R.N.; Sorvillo, F.; Kuo, T. Legionnaires’ disease and associated comorbid conditions as causes of death in the U.S., 2000–2010. Public Health Rep. 2015, 130, 222–229. [Google Scholar] [CrossRef]
- Samuelsson, J.; Payne Hallström, L.; Marrone, G.; Gomes Dias, J. Legionnaires’ disease in the EU/EEA*: Increasing trend from 2017 to 2019. Euro Surveill. 2023, 28, 2200114. [Google Scholar] [CrossRef]
- Beauté, J.; Schmid, D.; Wewalka, G.; Denis, O.; Jacquinet, S.; Piérard, D.; Quoilin, S.; Tomova, I.; Pieridou, D.; Gregoriou, I.; et al. Legionnaires’ disease in Europe, 2011 to 2015. Euro Surveill. 2017, 22, 30566. [Google Scholar] [CrossRef] [PubMed]
- Legionnaires’ Disease 2023 Guidelines (for Local Governments). Available online: https://www.kdca.go.kr/board/board.es?mid=a20507020000&bid=0019 (accessed on 6 April 2023).
- Mudali, G.; Kilgore, P.E.; Salim, A.; McElmurry, S.P.; Zervos, M. Trends in Legionnaires’ Disease-Associated Hospitalizations, United States, 2006–2010. Open Forum Infect. Dis. 2020, 7, ofaa296. [Google Scholar] [CrossRef] [PubMed]
- Phin, N.; Parry-Ford, F.; Harrison, T.; Stagg, H.R.; Zhang, N.; Kumar, K.; Lortholary, O.; Zumla, A.; Abubakar, I. Epidemiology and clinical management of Legionnaires’ disease. Lancet Infect. Dis. 2014, 14, 1011–1021. [Google Scholar] [CrossRef] [PubMed]
- Viasus, D.; Di Yacovo, S.; Garcia-Vidal, C.; Verdaguer, R.; Manresa, F.; Dorca, J.; Gudiol, F.; Carratalà, J. Community-acquired Legionella pneumophila pneumonia: A single-center experience with 214 hospitalized sporadic cases over 15 years. Medicine 2013, 92, 51–60. [Google Scholar] [CrossRef] [PubMed]
- Farnham, A.; Alleyne, L.; Cimini, D.; Balter, S. Legionnaires’ disease incidence and risk factors, New York, New York, USA, 2002–2011. Emerg Infect. Dis. 2014, 20, 1795–1802. [Google Scholar] [CrossRef] [PubMed]
- Benin, A.L.; Benson, R.F.; Besser, R.E. Trends in legionnaires disease, 1980–1998: Declining mortality and new patterns of diagnosis. Clin. Infect. Dis. 2002, 35, 1039–1046. [Google Scholar] [CrossRef] [PubMed]
- Andrea, L.; Dicpinigaitis, P.V.; Fazzari, M.J.; Kapoor, S. Legionella Pneumonia in the ICU: A Tertiary Care Center Experience over 10 Years. Crit. Care Explor. 2021, 3, e0508. [Google Scholar] [CrossRef] [PubMed]
- Jespersen, S.; Søgaard, O.S.; Schønheyder, H.C.; Fine, M.J.; Ostergaard, L. Clinical features and predictors of mortality in admitted patients with community- and hospital-acquired Legionellosis: A Danish historical cohort study. BMC Infect. Dis. 2010, 10, 124. [Google Scholar] [CrossRef]
- Neil, K.; Berkelman, R. Increasing incidence of Legionellosis in the United States, 1990–2005: Changing epidemiologic trends. Clin. Infect. Dis. 2008, 47, 591–599. [Google Scholar] [CrossRef]
- Fields, B.S.; Benson, R.F.; Besser, R.E. Legionella and Legionnaires’ disease: 25 years of investigation. Clin. Microbiol. Rev. 2002, 15, 506–526. [Google Scholar] [CrossRef] [PubMed]
- Cunha, B.A.; Burillo, A.; Bouza, E. Legionnaires’ disease. Lancet 2016, 387, 376–385. [Google Scholar] [CrossRef] [PubMed]
- Jong, B.; Hallström, L.P. European Surveillance of Legionnaires’ Disease. Curr. Issues Mol. Biol. 2021, 42, 81–96. [Google Scholar]
- Dominguez, A.; Alvarez, J.; Sabria, M.; Carmona, G.; Torner, N.; Oviedo, M.; Cayla, J.; Minguell, S.; Barrabeig, I.; Sala, M.; et al. Factors influencing the case-fatality rate of Legionnaires’ disease. Int. J. Tuberc. Lung Dis. 2009, 13, 407–412. [Google Scholar]
- Chidiac, C.; Che, D.; Pires-Cronenberger, S.; Jarraud, S.; Campèse, C.; Bissery, A.; Weinbreck, P.; Brun-Buisson, C.; Sollet, J.P.; Ecochard, R.; et al. Factors associated with hospital mortality in community-acquired Legionellosis in France. Eur. Respir. J. 2012, 39, 963–970. [Google Scholar] [CrossRef]
- Cooley, L.A.; Pondo, T.; Francois Watkins, L.K.; Shah, P.; Schrag, S.; Vugia, D.; Alden, N.; Cartter, M.; Thomas, S.S.; Ryan, P.A.; et al. Population-Based Assessment of Clinical Risk Factors for Legionnaires’ Disease. Clin. Infect. Dis. 2020, 70, 2428–2431. [Google Scholar] [CrossRef]
- Lupia, T.; Corcione, S.; Shbaklo, N.; Rizzello, B.; De Benedetto, I.; Concialdi, E.; Navazio, A.S.; Penna, M.; Brusa, M.T.; De Rosa, F.G. Legionella pneumophila Infections during a 7-Year Retrospective Analysis (2016–2022): Epidemiological, Clinical Features and Outcomes in Patients with Legionnaires’ Disease. Microorganisms 2023, 11, 498. [Google Scholar] [CrossRef]
- Dagan, A.; Epstein, D.; Mahagneh, A.; Nashashibi, J.; Geffen, Y.; Neuberger, A.; Miller, A. Community-acquired versus nosocomial Legionella pneumonia: Factors associated with Legionella-related mortality. Eur. J. Clin. Microbiol. Infect. Dis. 2021, 40, 1419–1426. [Google Scholar] [CrossRef]
- Brodhun, B.; Buchholz, U. Epidemiology of Legionnaires’ disease in Germany. Bundesgesundheitsblatt Gesundheitsforschung Gesundheitsschutz 2011, 54, 680–687. [Google Scholar] [CrossRef] [PubMed]
- Amemura-Maekawa, J.; Kura, F.; Chida, K.; Ohya, H.; Kanatani, J.I.; Isobe, J.; Tanaka, S.; Nakajima, H.; Hiratsuka, T.; Yoshino, S.; et al. Legionella pneumophila and Other Legionella Species Isolated from Legionellosis Patients in Japan between 2008 and 2016. Appl. Environ. Microbiol. 2018, 84, e00721-18. [Google Scholar] [CrossRef] [PubMed]
- Chahin, A.; Opal, S.M. Severe Pneumonia Caused by Legionella pneumophila: Differential Diagnosis and Therapeutic Considerations. Infect. Dis. Clin. N. Am. 2017, 31, 111–121. [Google Scholar] [CrossRef] [PubMed]
- El-Ebiary, M.; Sarmiento, X.; Torres, A.; Nogué, S.; Mesalles, E.; Bodí, M.; Almirall, J. Prognostic factors of severe Legionella pneumonia requiring admission to ICU. Am. J. Respir. Crit. Care Med. 1997, 156, 1467–1472. [Google Scholar] [CrossRef] [PubMed]
- Levcovich, A.; Lazarovitch, T.; Moran-Gilad, J.; Peretz, C.; Yakunin, E.; Valinsky, L.; Weinberger, M. Complex clinical and microbiological effects on Legionnaires’ disease outcone; A retrospective cohort study. BMC Infect. Dis. 2016, 16, 75. [Google Scholar] [CrossRef] [PubMed]
- Zhao, J.; Stockwell, T.; Naimi, T.; Churchill, S.; Clay, J.; Sherk, A. Association Between Daily Alcohol Intake and Risk of All-Cause Mortality: A Systematic Review and Meta-analyses. JAMA Netw. Open 2023, 6, e236185. [Google Scholar] [CrossRef] [PubMed]
- Zhang, X.; Liu, Y.; Li, S.; Lichtenstein, A.H.; Chen, S.; Na, M.; Veldheer, S.; Xing, A.; Wang, Y.; Wu, S.; et al. Alcohol consumption and risk of cardiovascular disease, cancer and mortality: A prospective cohort study. Nutr. J. 2021, 20, 13. [Google Scholar] [CrossRef]
- Paganini-Hill, A.; Kawas, C.H.; Corrada, M.M. Type of alcohol consumed, changes in intake over time and mortality: The Leisure World Cohort Study. Age Ageing 2007, 36, 203–209. [Google Scholar] [CrossRef]
- Di Castelnuovo, A.; Costanzo, S.; Bonaccio, M.; McElduff, P.; Linneberg, A.; Salomaa, V.; Männistö, S.; Moitry, M.; Ferrières, J.; Dallongeville, J.; et al. Alcohol intake and total mortality in 142,960 individuals from the MORGAM Project: A population-based study. Addiction 2022, 117, 312–325. [Google Scholar] [CrossRef]

| Cases Definition | |
|---|---|
| Confirmed cases | Persons who have clinical symptoms characteristic of legionellosis and meet the laboratory testing criteria for a confirmed diagnosis. At least one of the following three:
|
| Suspected cases | Persons who are suspected to have legionellosis based on clinical symptoms and epidemiological relevance, and presumed to be infected with Legionella based on the laboratory testing criteria for a suspected diagnosis. At least one of the following three:
|
| Characteristics | Total | Confirmed Cases | Suspected Cases | ||||||
|---|---|---|---|---|---|---|---|---|---|
| Survivors | Nonsurvivors | p-Value | Survivors | Nonsurvivors | p-Value | Survivors | Nonsurvivors | p-Value | |
| N (%) | N (%) | N (%) | N (%) | N (%) | N (%) | ||||
| Sex | |||||||||
| Male | 360 (89.33) | 43 (10.67) | 0.478 | 183 (89.71) | 21 (10.29) | 0.883 | 177 (88.94) | 22 (11.06) | 0.264 |
| Female | 128 (91.43) | 12 (8.57) | 57 (89.06) | 7 (10.94) | 71 (93.42) | 5 (6.58) | |||
| Age | |||||||||
| Mean (SD) | 67.4 | 71.6 | 0.192 | 64.8 | 68.5 | 0.032 | 70 | 74.8 | 0.003 |
| <50 | 37 (97.37) | 1 (2.63) | 22 (95.65) | 1 (4.35) | 15 (100.00) | 0 (0.00) | |||
| 50–59 | 105 (93.75) | 7 (6.25) | 68 (95.77) | 3 (4.23) | 37 (90.24) | 4 (9.76) | |||
| 60–69 | 112 (88.89) | 14 (11.11) | 54 (83.08) | 11 (16.92) | 58 (95.08) | 3 (4.92) | |||
| 70–79 | 131 (86.75) | 20 (13.25) | 57 (87.69) | 8 (12.31) | 74 (86.05) | 12 (13.95) | |||
| 80– | 103 (88.79) | 13 (11.21) | 39 (88.64) | 5 (11.36) | 64 (88.89) | 8 (11.11) | |||
| Route of infection | |||||||||
| Nosocomial infection | 59 (79.73) | 15 (20.27) | 0.001 | 30 (78.95) | 8 (21.05) | 0.026 | 29 (80.56) | 7 (19.44) | 0.070 |
| Community infection | 257 (93.45) | 18 (6.55) | 121 (93.80) | 8 (6.20) | 136 (93.15) | 10 (6.85) | |||
| Others | 172 (88.66) | 22 (11.34) | 89 (88.12) | 12 (11.88) | 83 (89.25) | 10 (10.75) | |||
| Current alcohol drinking | |||||||||
| No | 375 (88.03) | 51 (11.97) | 0.006 | 161 (86.56) | 25 (13.44) | 0.016 | 214 (89.17) | 26 (10.83) | 0.221 |
| Yes | 113 (96.58) | 4 (3.42) | 79 (96.34) | 3 (3.66) | 34 (97.14) | 1 (2.86) | |||
| Current smoking status | |||||||||
| No | 343 (89.32) | 41 (10.68) | 0.510 | 145 (86.83) | 22 (13.17) | 0.061 | 198 (91.24) | 19 (8.76) | 0.252 |
| Yes | 145 (91.19) | 14 (8.81) | 95 (94.06) | 6 (5.94) | 50 (86.21) | 8 (13.79) | |||
| Comorbidities | |||||||||
| Diabetes | 162 (90.50) | 17 (9.50) | 1 | 103 (90.35) | 11 (9.65) | 1 | 59 (90.77) | 6 (9.23) | 1 |
| Cancer | 114 (84.44) | 21 (15.56) | 46 (80.70) | 11 (19.30) | 68 (87.18) | 10 (12.82) | |||
| Renal failure | 66 (84.62) | 12 (15.38) | 38 (90.48) | 4 (9.52) | 28 (77.78) | 8 (22.22) | |||
| Immunosuppressive medication | 85 (89.47) | 10 (10.53) | 40 (88.89) | 5 (11.11) | 45 (90.00) | 5 (10.00) | |||
| Transplantation | 22 (91.67) | 2 (8.33) | 16 (100.00) | 0 (0.00) | 6 (75.00) | 2 (25.00) | |||
| Others | 366 (90.59) | 38 (9.41) | 167 (89.78) | 19 (10.22) | 199 (91.28) | 19 (8.72) | |||
| Any of ≥1 comorbidities | 431 (89.23) | 52 (10.77) | 203 (88.26) | 27 (11.74) | 228 (90.12) | 25 (9.88) | |||
| Symptoms | |||||||||
| Fever | 379 (91.55) | 35 (8.45) | 0.059 | 200 (90.50) | 21 (9.50) | 0.238 | 179 (92.75) | 14 (7.25) | 0.150 |
| Cough | 292 (90.68) | 30 (9.32) | 138 (90.79) | 14 (9.21) | 154 (90.59) | 16 (9.41) | |||
| Dyspnea | 235 (84.84) | 42 (15.16) | 105 (84.00) | 20 (16.00) | 130 (85.53) | 22 (14.47) | |||
| Others | 381 (90.07) | 42 (9.93) | 191 (89.25) | 23 (10.75) | 190 (90.91) | 19 (9.09) | |||
| Any of ≥1 symptoms | 485 (89.98) | 54 (10.02) | 239 (89.51) | 28 (10.49) | 246 (90.44) | 26 (9.56) | |||
| Admission to clinics | |||||||||
| No | 10 (100.00) | 0 (0.00) | 0.609 | 3 (100.00) | 0 (0.00) | 1 | 7 (100.00) | 0 (0.00) | 1 |
| Yes | 478 (89.68) | 55 (10.32) | 237 (89.43) | 28 (10.57) | 241 (89.93) | 27 (10.07) | |||
| Admission to intensive care unit (n = 497) | |||||||||
| No | 320 (94.96) | 17 (5.04) | <0.001 | 152 (94.41) | 9 (5.59) | <0.001 | 168 (95.45) | 8 (4.55) | <0.001 |
| Yes | 126 (78.75) | 34 (21.25) | 66 (79.52) | 17 (20.48) | 60 (77.92) | 17 (22.08) | |||
| Prescription of antibiotics (n = 507) | |||||||||
| No | 12 (100.00) | 0 (0.00) | 0.620 | 4 (100.00) | 0 (0.00) | 1 | 8 (100.00) | 0 (0.00) | 1 |
| Yes | 444 (89.70) | 51 (10.30) | 219 (89.39) | 26 (10.61) | 225 (90.00) | 25 (10.00) | |||
| Dual infection (n = 503) | |||||||||
| No | 321 (91.71) | 29 (8.29) | 0.022 | 172 (91.01) | 17 (8.99) | 0.062 | 149 (92.55) | 12 (7.45) | 0.118 |
| Yes | 130 (84.97) | 23 (15.03) | 46 (82.14) | 10 (17.86) | 84 (86.60) | 13 (13.40) | |||
| Days from symptom onset to diagnosis | |||||||||
| Mean (SD) | 14.3 | 8.6 | 18.4 | 6.1 | 13.7 | 11.1 | |||
| Median (IQR) | 7 | 6 | 6 | 4 | 8 | 6 | |||
| <5 days | 130 | 22 | 83 | 15 | 47 | 7 | |||
| ≥5 days | 358 | 33 | 157 | 13 | 201 | 20 | |||
| Days from diagnosis to admission among patients who were admitted to clinics (N = 533) | |||||||||
| Mean (SD) | 4.99 | 5.67 | 3.86 | 4.57 | 6.10 | 6.81 | |||
| Median (IQR) | 3 | 3 | 2 | 1.5 | 4 | 4 | |||
| <3 days | 203 | 23 | 135 | 17 | 68 | 6 | |||
| ≥3 days | 275 | 32 | 102 | 11 | 173 | 21 | |||
| Duration of admission among patients who were admitted to clinics (N = 533) | |||||||||
| Mean (SD) | 11.06 | 8.80 | 9.46 | 9.17 | 12.63 | 8.40 | |||
| Median (IQR) | 8 | 6 | 7 | 6 | 9 | 5 | |||
| <7 days | 151 | 30 | 88 | 16 | 63 | 14 | |||
| ≥7 days | 327 | 25 | 149 | 12 | 178 | 13 | |||
| Duration of antibiotics prescription among who were ever prescribed to antibiotics (N = 492) | |||||||||
| Mean (SD) | 11.32 | 7.70 | 9.03 | 8.12 | 13.54 | 7.28 | |||
| Median (IQR) | 9 | 5 | 8 | 5 | 10 | 4 | |||
| <7 days | 142 | 30 | 83 | 15 | 59 | 15 | |||
| ≥7 days | 300 | 20 | 134 | 10 | 166 | 10 | |||
| Characteristics | Univariate Analysis | Multivariate Analysis | ||||
|---|---|---|---|---|---|---|
| HR | 95% CI | p-Value | HR | 95% CI | p-Value | |
| Sex | ||||||
| Male | 1 | 1 | ||||
| Female | 0.81 | 0.43–1.54 | 0.53 | 0.54 | 0.27–1.10 | 0.09 |
| Age | ||||||
| 1 year increment | 1.02 | 1.00–1.04 | 0.12 | 1.01 | 1.00–1.03 | 0.22 |
| Route of infection | ||||||
| Community infection | 1 | 1 | ||||
| Nosocomial infection | 3.10 | 1.12–8.56 | <0.001 | 5.23 | 1.72–15.94 | 0.004 |
| Others | 1.81 | 0.71–4.62 | 0.029 | 2.53 | 0.97–7.14 | 0.06 |
| Current alcohol drinking | ||||||
| No | 1 | 1 | ||||
| Yes | 0.27 | 0.10–0.74 | 0.011 | 0.17 | 0.06–0.57 | 0.003 |
| Current smoking status | ||||||
| No | 1 | 1 | ||||
| Yes | 0.93 | 0.51–1.72 | 0.93 | 1.65 | 0.80–3.37 | 0.17 |
| Comorbidities 1 | ||||||
| No | 1 | 1 | ||||
| Yes | 1.66 | 0.60–4.60 | 0.33 | 0.90 | 0.29–2.79 | 0.86 |
| Dual infection | ||||||
| No | 1 | 1 | ||||
| Yes | 1.61 | 0.93–2.79 | 0.10 | 1.66 | 0.93–2.97 | 0.09 |
| Days from symptom onset to diagnosis | ||||||
| Per 1 day increment | 1.00 | 0.97–1.02 | 0.57 | 1.00 | 0.97–1.02 | 0.61 |
| Days from diagnosis to admission | ||||||
| No admission | 1 | 1 | ||||
| 1–3 days | 11.03 | 4.02–30.21 | <0.005 | 4.39 | 1.29–14.90 | 0.02 |
| 3 days or more | 0.93 | 0.53–1.63 | 0.79 | 1.05 | 0.57–1.93 | 0.89 |
| Duration of antibiotic use | ||||||
| <3 days | 1 | 1 | ||||
| ≥3 days | 0.34 | 0.19–0.61 | <0.001 | 0.17 | 0.08–0.39 | <0.005 |
| Complications | ||||||
| No | 1 | 1 | ||||
| Yes | 4.40 | 2.19–8.86 | <0.005 | 5.46 | 2.64–11.28 | <0.005 |
| Undetermined | 5.14 | 1.60–16.54 | 0.006 | 4.86 | 1.42–16.67 | 0.01 |
Disclaimer/Publisher’s Note: The statements, opinions and data contained in all publications are solely those of the individual author(s) and contributor(s) and not of MDPI and/or the editor(s). MDPI and/or the editor(s) disclaim responsibility for any injury to people or property resulting from any ideas, methods, instructions or products referred to in the content. |
© 2024 by the authors. Licensee MDPI, Basel, Switzerland. This article is an open access article distributed under the terms and conditions of the Creative Commons Attribution (CC BY) license (https://creativecommons.org/licenses/by/4.0/).
Share and Cite
Noh, H.-D.; Oh, J.; Park, K.-H.; Park, B. An Epidemiological Study on Legionnaires’ Disease in Gyeonggi Province, Korea: Occurrence, Infection Routes, and Risk Factors for Mortality (2016–2022). Medicina 2024, 60, 227. https://doi.org/10.3390/medicina60020227
Noh H-D, Oh J, Park K-H, Park B. An Epidemiological Study on Legionnaires’ Disease in Gyeonggi Province, Korea: Occurrence, Infection Routes, and Risk Factors for Mortality (2016–2022). Medicina. 2024; 60(2):227. https://doi.org/10.3390/medicina60020227
Chicago/Turabian StyleNoh, Hae-Deun, Jeonghyeon Oh, Kun-Hee Park, and Boyoung Park. 2024. "An Epidemiological Study on Legionnaires’ Disease in Gyeonggi Province, Korea: Occurrence, Infection Routes, and Risk Factors for Mortality (2016–2022)" Medicina 60, no. 2: 227. https://doi.org/10.3390/medicina60020227
APA StyleNoh, H.-D., Oh, J., Park, K.-H., & Park, B. (2024). An Epidemiological Study on Legionnaires’ Disease in Gyeonggi Province, Korea: Occurrence, Infection Routes, and Risk Factors for Mortality (2016–2022). Medicina, 60(2), 227. https://doi.org/10.3390/medicina60020227