
Optimal Indocyanine Green Dosage for Repetitive Angiography for Laparoscopic Colorectal Surgery

 , , , , and
Abstract
1. Introduction
2. Materials and Methods
2.1. Patients
2.2. Sample Size Calculation
2.3. ICG Dosage Protocol
2.4. Fluorescence Image Processing
2.5. Quantitative Perfusion Analysis
2.6. Outcomes
2.7. Statistics
3. Results
3.1. Patients
3.2. Quantitative Perfusion Parameters
4. Discussion
5. Conclusions
Author Contributions
Funding
Institutional Review Board Statement
Informed Consent Statement
Data Availability Statement
Acknowledgments
Conflicts of Interest
Abbreviations
| NIR | near-infrared |
| ICG | indocyanine green |
| FI | fluorescence intensity |
| ASA | American Society of Anesthesiologists |
| SMA | superior mesenteric artery |
| MCA | middle colic artery |
| ICA | ileocolic artery |
| ROI | region of interest |
| RGB | red, green, and blue color channels |
| ENV | endoscopic near-infrared visualization |
| AI | artificial intelligence |
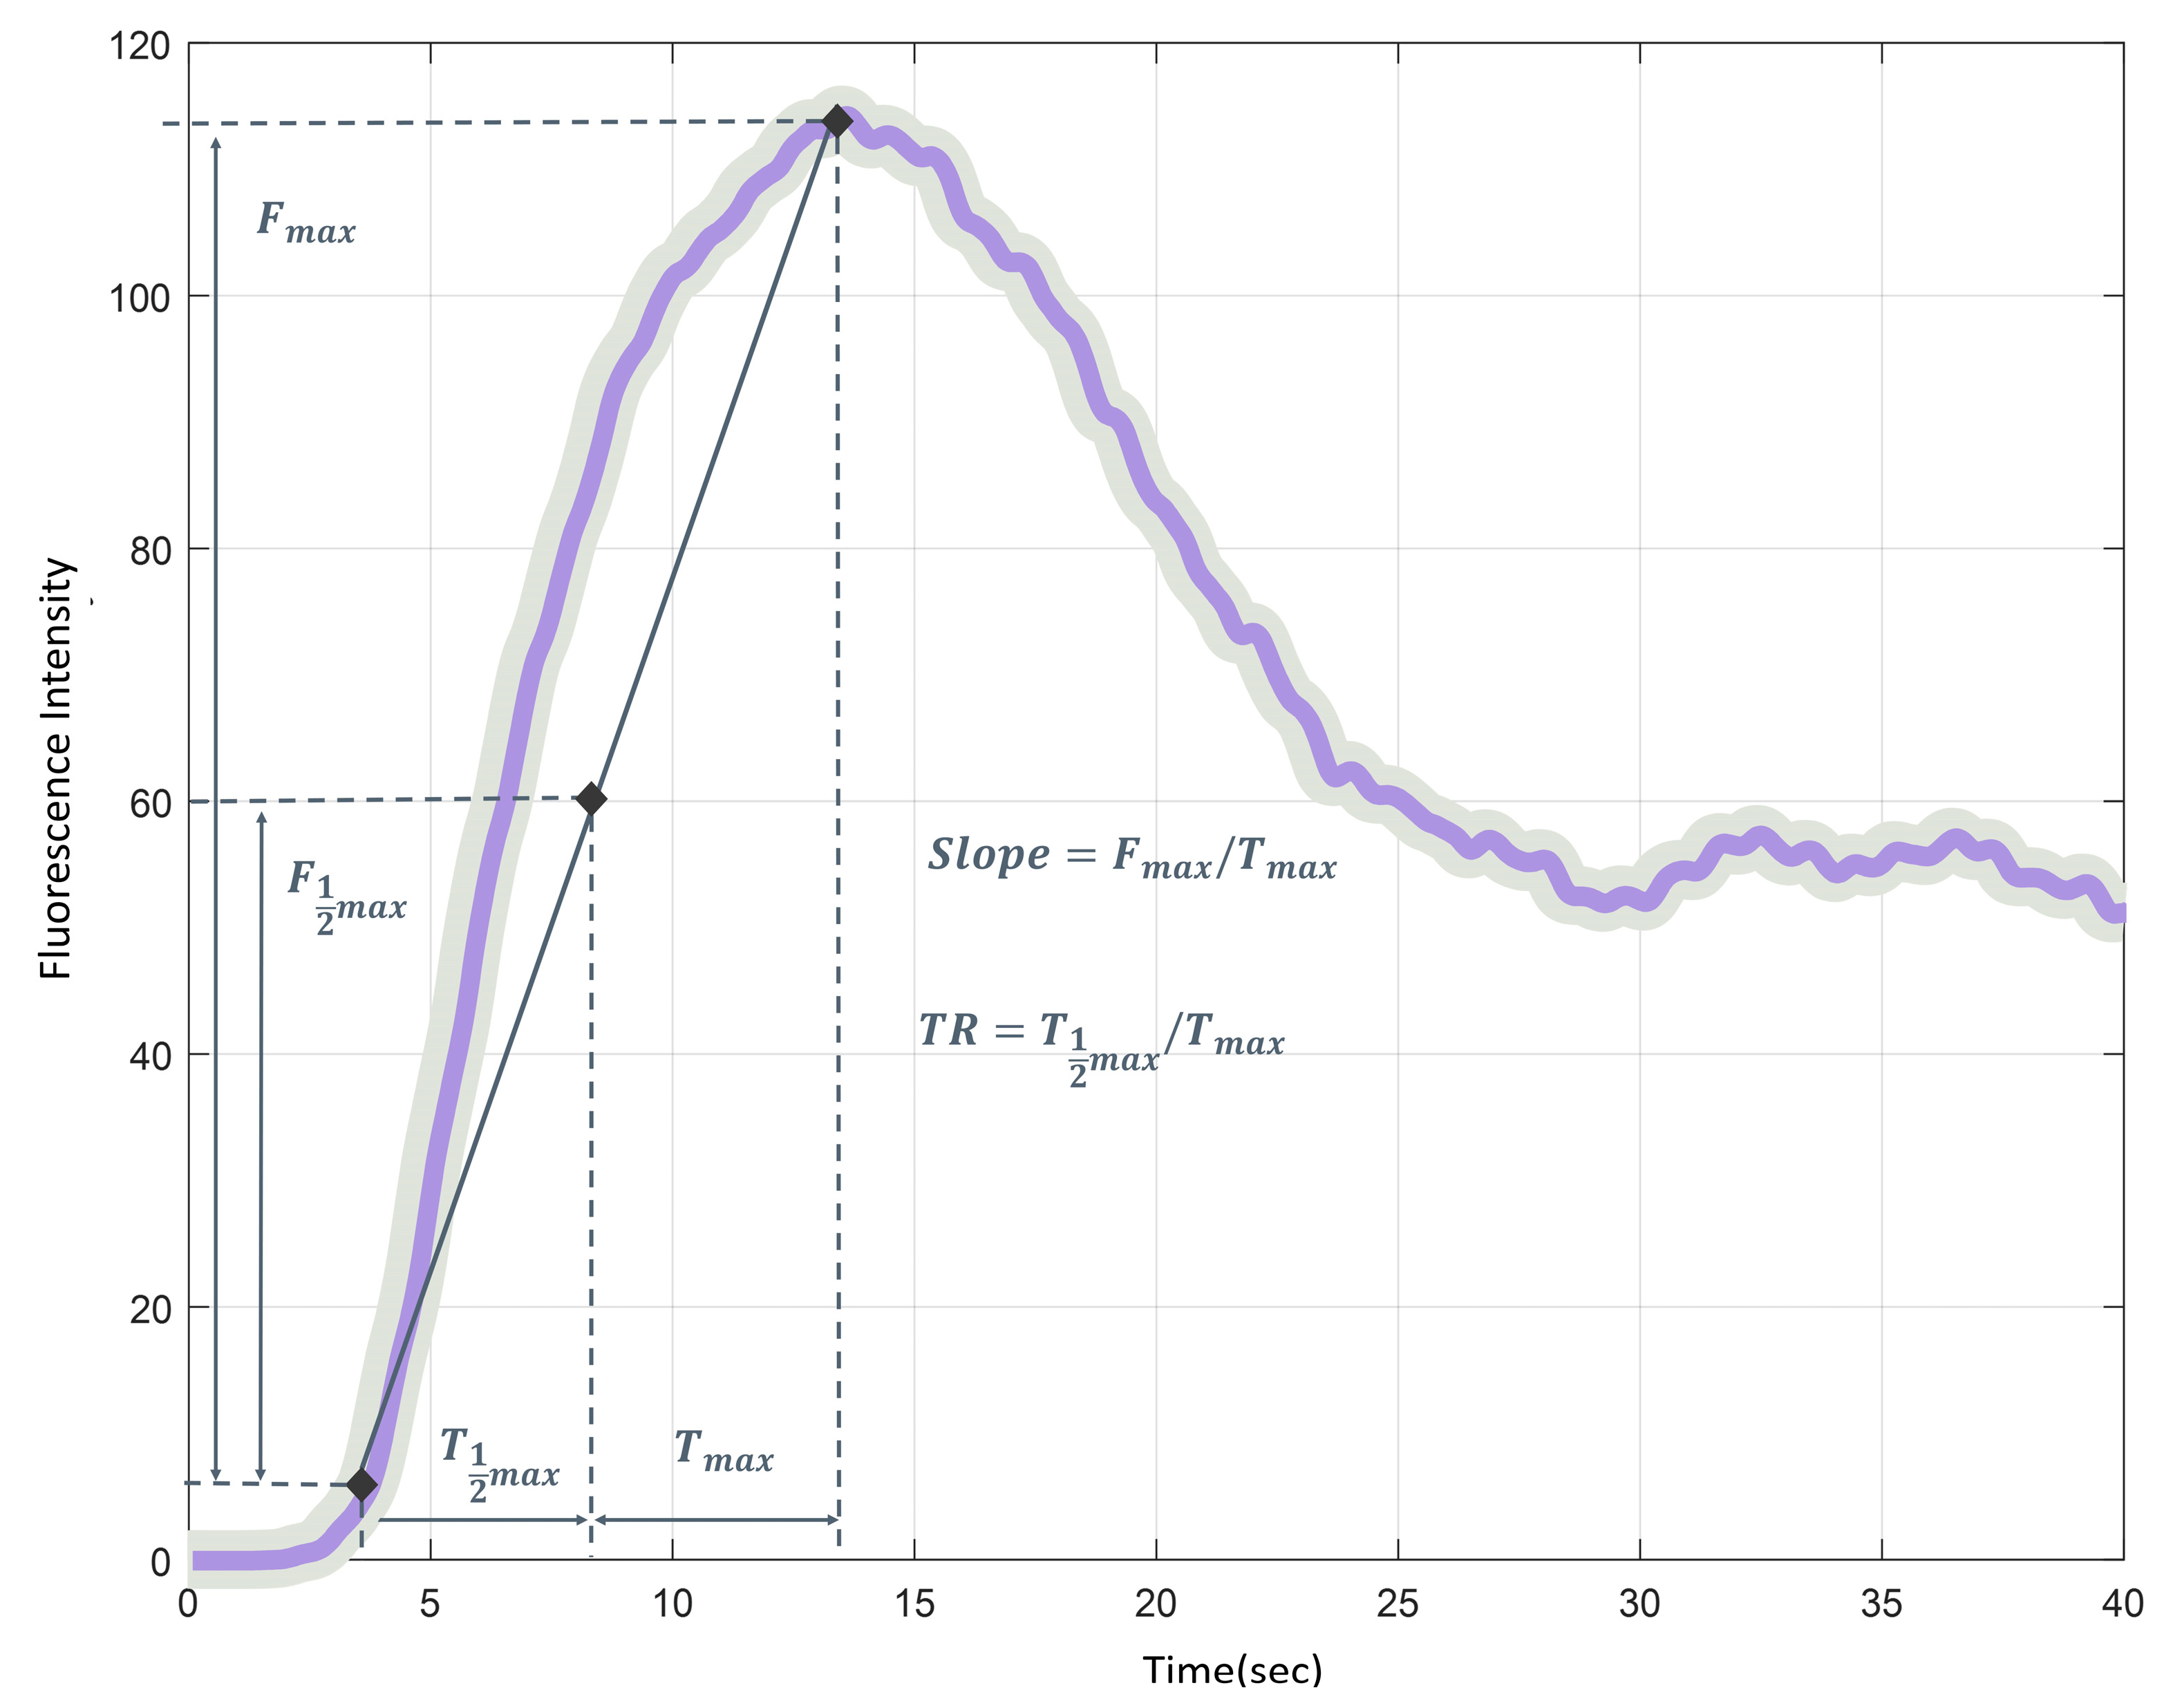
| T1/2MAX | time to reach half of the maximum FI |
| TMAX | time taken to reach the maximum FI |
| TR | perfusion time ratio (T1/2MAX/TMAX), the ratio of fluorescence expression time |
| F1/2MAX | half of maximum FI |
| FMAX | maximum brightness of FI |
| Slope | (FMAX/TMAX), the slope of the rising curve from the initial to maximum FI |
| ANOVA | analysis of variance |
| BMI | body mass index |
References
- Shah, M.F.; Naeem, A.; Haq, I.U.; Riaz, S.; Shakeel, O.; Panteleimonitis, S.; Khattak, S.; Syed, A.A.; Parvaiz, A. Laparoscopy offers better clinical outcomes and long-term survival in patients with right colon cancer: Experience from national cancer center. Ann. Coloproctol. 2022, 38, 223–229. [Google Scholar] [CrossRef] [PubMed]
- Kim, M.H.; Park, S.; Yi, N.; Kang, B.; Park, I.J. Colorectal cancer mortality trends in the era of cancer survivorship in Korea: 2000–2020. Ann. Coloproctol. 2022, 38, 343–352. [Google Scholar] [CrossRef] [PubMed]
- Son, G.M.; Kim, T.U.; Yun, M.S.; Kim, C.; Lee, I.Y.; Park, S.B.; Shin, D.H.; Ha, G.W. Effect of Fluorescence Lymph Node Mapping on Improving Diagnostic Values of CT D3 Lymph Node Staging for Right-Sided Colon Cancer. Cancers 2024, 16, 3496. [Google Scholar] [CrossRef]
- Son, G.M.; Yun, M.S.; Lee, I.Y.; Im, S.B.; Kim, K.H.; Park, S.B.; Kim, T.U.; Shin, D.H.; Nazir, A.M.; Ha, G.W. Clinical Effectiveness of Fluorescence Lymph Node Mapping Using ICG for Laparoscopic Right Hemicolectomy: A Prospective Case-Control Study. Cancers 2023, 15, 4927. [Google Scholar] [CrossRef]
- Son, G.M.; Kim, T.U.; Park, B.S.; Jung, H.J.; Lee, S.S.; Yoon, J.U.; Lee, J.W. Colonic hypoperfusion following ligation of the inferior mesenteric artery in rectosigmoid colon cancer patients. Ann. Surg. Treat. Res. 2019, 97, 74–82. [Google Scholar] [CrossRef]
- Kitaguchi, D.; Ito, M. Optimal anastomotic technique in rectal surgery to prevent anastomotic leakage. Ann. Coloproctol. 2023, 39, 97–105. [Google Scholar] [CrossRef]
- Re, A.D.; Tooza, S.; Diab, J.; Karam, C.; Sarofim, M.; Ooi, K.; Turner, C.; Kozman, D.; Blomberg, D.; Morgan, M. Outcomes following anastomotic leak from rectal resections, including bowel function and quality of life. Ann. Coloproctol. 2023, 39, 395–401. [Google Scholar] [CrossRef]
- Keshvari, A.; Badripour, A.; Keramati, M.R.; Kazemeini, A.; Behboudi, B.; Fazeli, M.S.; Rahimpour, E.; Ghaffari, P.; Tafti, S.M.A. Introduction of a handmade vacuum-assisted sponge drain for the treatment of anastomotic leakage after low anterior rectal resection. Ann. Coloproctol. 2022, 38, 230–234. [Google Scholar] [CrossRef]
- Son, G.M.; Kwon, M.S.; Kim, Y.; Kim, J.; Kim, S.H.; Lee, J.W. Quantitative analysis of colon perfusion pattern using indocyanine green (ICG) angiography in laparoscopic colorectal surgery. Surg. Endosc. 2019, 33, 1640–1649. [Google Scholar] [CrossRef]
- Larsen, P.O.; Nerup, N.; Andersen, J.; Dohrn, N.; Klein, M.F.; Brisling, S.; Salomon, S.; Andersen, P.V.; Möller, S.; Svendsen, M.B.S.; et al. Anastomotic perfusion assessment with indocyanine green in robot-assisted low-anterior resection, a multicenter study of interobserver variation. Surg. Endosc. 2023, 37, 3602–3609. [Google Scholar] [CrossRef]
- Son, G.M.; Ahn, H.M.; Lee, I.Y.; Ha, G.W. Multifunctional Indocyanine Green Applications for Fluorescence-Guided Laparoscopic Colorectal Surgery. Ann. Coloproctol. 2021, 37, 133–140. [Google Scholar] [CrossRef] [PubMed]
- Lucarini, A.; Guida, A.M.; Orville, M.; Panis, Y. Indocyanine green fluorescence angiography could reduce the risk of anastomotic leakage in rectal cancer surgery: A systematic review and meta-analysis of randomized controlled trials. Color. Dis. 2024, 26, 408–416. [Google Scholar] [CrossRef] [PubMed]
- Watanabe, J.; Takemasa, I.; Kotake, M.; Noura, S.; Kimura, K.; Suwa, H.; Tei, M.; Takano, Y.; Munakata, K.; Matoba, S.; et al. Blood Perfusion Assessment by Indocyanine Green Fluorescence Imaging for Minimally Invasive Rectal Cancer Surgery (EssentiAL trial): A Randomized Clinical Trial. Ann. Surg. 2023, 278, e688–e694. [Google Scholar] [CrossRef] [PubMed]
- Faber, R.A.; Meijer, R.P.J.; Droogh, D.H.M.; Jongbloed, J.J.; Bijlstra, O.D.; Boersma, F.; Braak, J.P.B.M.; Meershoek-Klein Kranenbarg, E.; Putter, H.; Holman, F.A.; et al. Indocyanine green near-infrared fluorescence bowel perfusion assessment to prevent anastomotic leakage in minimally invasive colorectal surgery (AVOID): A multicentre, randomised, controlled, phase 3 trial. Lancet Gastroenterol. Hepatol. 2024, 9, 924–934. [Google Scholar] [CrossRef] [PubMed]
- Jafari, M.D.; Pigazzi, A.; McLemore, E.C.; Mutch, M.G.; Haas, E.; Rasheid, S.H.; Wait, A.D.; Paquette, I.M.; Bardakcioglu, O.; Safar, B.; et al. Perfusion Assessment in Left-Sided/Low Anterior Resection (PILLAR III): A Randomized, Controlled, Parallel, Multicenter Study Assessing Perfusion Outcomes With PINPOINT Near-Infrared Fluorescence Imaging in Low Anterior Resection. Dis. Colon Rectum 2021, 64, 995–1002. [Google Scholar] [CrossRef]
- Alekseev, M.; Rybakov, E.; Khomyakov, E.; Zarodnyuk, I.; Shelygin, Y. Intraoperative fluorescence angiography as an independent factor of anastomotic leakage and a nomogram for predicting leak for colorectal anastomoses. Ann. Coloproctol. 2022, 38, 380–386. [Google Scholar] [CrossRef]
- Ahn, H.M.; Son, G.M.; Lee, I.Y.; Shin, D.H.; Kim, T.K.; Park, S.B.; Kim, H.W. Optimal ICG dosage of preoperative colonoscopic tattooing for fluorescence-guided laparoscopic colorectal surgery. Surg. Endosc. 2022, 36, 1152–1163. [Google Scholar] [CrossRef]
- Goncalves, L.N.; van den Hoven, P.; van Schaik, J.; Leeuwenburgh, L.; Hendricks, C.H.F.; Verduijn, P.S.; van der Bogt, K.E.A.; van Rijswijk, C.S.P.; Schepers, A.; Vahrmeijer, A.L.; et al. Perfusion Parameters in Near-Infrared Fluorescence Imaging with Indocyanine Green: A Systematic Review of the Literature. Life 2021, 11, 433. [Google Scholar] [CrossRef]
- Zarrinpar, A.; Dutson, E.P.; Mobley, C.; Busuttil, R.W.; Lewis, C.E.; Tillou, A.; Cheaito, A.; Hines, O.J.; Agopian, V.G.; Hiyama, D.T. Intraoperative Laparoscopic Near-Infrared Fluorescence Cholangiography to Facilitate Anatomical Identification: When to Give Indocyanine Green and How Much. Surg. Innov. 2016, 23, 360–365. [Google Scholar] [CrossRef]
- Rother, U.; Gerken, A.L.H.; Karampinis, I.; Klumpp, M.; Regus, S.; Meyer, A.; Apel, H.; Krämer, B.K.; Hilgers, K.; Lang, W.; et al. Dosing of indocyanine green for intraoperative laser fluorescence angiography in kidney transplantation. Microcirculation 2017, 24, e12392. [Google Scholar] [CrossRef]
- Park, S.H.; Park, H.M.; Baek, K.R.; Ahn, H.M.; Lee, I.Y.; Son, G.M. Artificial intelligence based real-time microcirculation analysis system for laparoscopic colorectal surgery. World J. Gastroenterol. 2020, 26, 6945–6962. [Google Scholar] [CrossRef] [PubMed]
- Gan, Y.X.; Yang, Z.L.; Pan, Y.X.; Ou-Yang, L.Y.; Tang, Y.H.; Zhang, Y.J.; Chen, M.S.; Xu, L. Change of indocyanine green clearance ability and liver function after transcatheter intra-arterial therapies and its impact on outcomes of resectable hepatocellular carcinoma, a retrospective cohort study. Int. J. Surg. 2024, 110, 2832–2844. [Google Scholar] [CrossRef] [PubMed]
- Borg, L.; Portelli, M.; Testa, L.; Andrejevic, P. The use of indocyanine green for colorectal anastomoses: A systematic review and meta-analysis. Ann. R. Coll. Surg. Engl. 2024. [Google Scholar] [CrossRef] [PubMed]
- Ahn, H.M.; Son, G.M.; Lee, I.Y.; Park, S.H.; Kim, N.S.; Baek, K.R. Optimization of indocyanine green angiography for colon perfusion during laparoscopic colorectal surgery. Color. Dis. 2021, 23, 1848–1859. [Google Scholar] [CrossRef] [PubMed]
- Jung, J.M.; Park, I.J.; Park, E.J.; Son, G.M. Image-Guided Surgery Study Group of Korean Society of Coloproctology. Fluorescence-guided colorectal surgery: Applications, clinical results, and protocols. Ann. Surg. Treat. Res. 2023, 105, 252–263. [Google Scholar] [CrossRef]
- Cassinotti, E.; Al-Taher, M.; Antoniou, S.A.; Arezzo, A.; Baldari, L.; Boni, L.; Bonino, M.A.; Bouvy, N.D.; Brodie, R.; Carus, T.; et al. European Association for Endoscopic Surgery (EAES) consensus on Indocyanine Green (ICG) fluorescence-guided surgery. Surg. Endosc. 2023, 37, 1629–1648. [Google Scholar] [CrossRef]
- Chen, Z.R.; Zeng, Q.T.; Shi, N.; Han, H.W.; Chen, Z.H.; Zou, Y.P.; Zhang, Y.P.; Wu, F.; Xu, L.Q.; Jin, H.S. Laboratory scoring system to predict hepatic indocyanine green clearance ability during fluorescence imaging-guided laparoscopic hepatectomy. World J. Gastrointest. Surg. 2023, 15, 1442–1453. [Google Scholar] [CrossRef]
- Atmodiwirjo, P.; Ramadan, M.R.; Sapphira, E.; Djohan, M.; Ralena, N.A.; Amanda, N.F. Fluorescence Intensity between Standard versus Diluted Indocyanine Green to Evaluate Flap Perfusion in Rats. Plast. Reconstr. Surg. Glob. Open 2024, 12, e5948. [Google Scholar] [CrossRef]
- Keller, N.B.; Stapler, S.M.; Shanker, B.A.; Cleary, R.K. Anaphylactic Shock to Intravenous Indocyanine Green During a Robotic Right Colectomy. Am. Surg. 2023, 89, 6407–6409. [Google Scholar] [CrossRef]
- Son, G.M.; Nazir, A.M.; Yun, M.S.; Lee, I.Y.; Im, S.B.; Kwak, J.Y.; Park, S.H.; Baek, K.R.; Gockel, I. The Safe Values of Quantitative Perfusion Parameters of ICG Angiography Based on Tissue Oxygenation of Hyperspectral Imaging for Laparoscopic Colorectal Surgery: A Prospective Observational Study. Biomedicines 2023, 11, 2029. [Google Scholar] [CrossRef]


| n | Initial Dose | Second Dose | Total Dose | |
|---|---|---|---|---|
| Group 1 | 3 | 0.01 mg/kg | 0.2 mg/kg | 0.21 mg/kg |
| Group 2 | 3 | 0.02 mg/kg | 0.2 mg/kg | 0.22 mg/kg |
| Group 3 | 3 | 0.03 mg/kg | 0.2 mg/kg | 0.23 mg/kg |
| Group 4 | 3 | 0.04 mg/kg | 0.2 mg/kg | 0.24 mg/kg |
| Group 5 | 3 | 0.05 mg/kg | 0.2 mg/kg | 0.25 mg/kg |
| Clinical Variables | n (%) | |
|---|---|---|
| Age (yr) | mean ± SD | 67.1 ± 11.7 |
| Sex | male | 11 (73.3) |
| female | 4 (26.7) | |
| BMI (kg/m2) | mean ± SD | 24.1 ± 3.5 |
| ASA score | 1 | 5 (33.3) |
| 2 | 10 (66.7) | |
| Hypertension | positive | 7 (46.7) |
| Diabetes mellitus | positive | 1 (6.7) |
| Smoking | positive | 3 (20.0) |
| Cardiovascular disease | positive | 2 (13.3) |
| Chronic liver disease | positive | 0 |
| Pathologic stage | I | 7 (46.6) |
| II | 4 (26.7) | |
| III | 4 (26.7) | |
| Anastomotic complication | positive | 0 |
| Reoperation | positive | 0 |
| Ileus | positive | 1 (6.7) |
| Variables | Group 1 (n = 450) | Group 2 (n = 450) | Group 3 (n = 450) | Group 4 (n = 450) | Group 5 (n = 450) | p-Value |
|---|---|---|---|---|---|---|
| Analysis accessibility | 48.00 ± 21.40 A | 100.00 ± 0.00 B | 88.00 ± 16.41 B | 100.00 ± 0.00 B | 84.67 ± 17.70 C | 0.007 |
| TR (<0.6) | 43.53 ± 17.28 A | 91.57 ± 12.88 B | 87.10 ± 17.40 B | 100.00 ± 0.00 B | 83.80 ± 19.12 C | 0.008 |
| Slope (>4.0) | 23.10 ± 40.01 A | 99.10 ± 1.56 B | 77.57 ± 34.37 C | 100.00 ± 0.00 B | 75.43 ± 27.97 C | 0.032 |
| AI-perfusion pattern | 14.23 ± 24.66 A | 97.10 ± 5.02 B | 74.00 ± 45.03 C | 100.00 ± 0.00 B | 66.43 ± 35.49 C | 0.023 |
| Variables | Group 1 | Group 2 | Group 3 | Group 4 | Group 5 | p-Value |
|---|---|---|---|---|---|---|
| (n = 216) | (n = 450) | (n = 396) | (n = 450) | (n = 381) | ||
| TR | 0.43 ± 0.11 A [0.35; 0.51] | 0.45 ± 0.09 B [0.39; 0.50] | 0.35 ± 0.08 C [0.30; 0.39] | 0.38 ± 0.07 D [0.32; 0.43] | 0.38 ± 0.07 D [0.33; 0.44] | <0.001 |
| Slope | 3.70 ± 2.17 A [1.85; 5.57] | 13.93 ± 6.51 B [6.58; 19.92] | 13.92 ± 6.33 B [7.86; 17.87] | 17.06 ± 6.01 C [12.63; 22.51] | 7.48 ± 3.08 D [5.47; 9.18] | <0.001 |
| T1/2MAX | 2.61 ± 1.00 A [1.97; 3.14] | 3.41 ± 0.97 B [2.72; 4.05] | 2.45 ± 0.64 A [2.09; 2.75] | 2.68 ± 0.98 A [1.43; 3.57] | 3.90 ± 2.19 C [2.14; 6.27] | <0.001 |
| TMAX | 5.92 ± 1.35 A [5.09; 6.27] | 7.84 ± 2.79 B [5.74; 10.34] | 7.28 ± 1.36 C [6.64; 7.76] | 7.01 ± 2.03 C [4.77; 8.91] | 9.53 ± 5.14 D [5.17; 15.02] | <0.001 |
| F1/2MAX | 10.74 ± 6.61 A [5.03; 17.26] | 47.99 ± 17.22 B [33.37; 68.21] | 49.81 ± 20.97 B [24.32; 64.78] | 54.52 ± 6.64 C [49.57; 59.72] | 35.13 ± 16.27 D [22.78; 47.41] | <0.001 |
| FMAX | 21.40 ± 13.24 A [9.74; 34.35] | 95.64 ± 34.23 B [66.51; 135.91] | 98.88 ± 41.59 B [48.44; 129.09] | 108.68 ± 13.20 C [98.91; 119.25] | 70.29 ± 32.59 D [45.46; 95.59] | <0.001 |
| Variables | Group 1 (n = 216) | Group 2 (n = 450) | Group 3 (n = 396) | Group 4 (n = 450) | Group 5 (n = 381) | Factor | p-Value | |
|---|---|---|---|---|---|---|---|---|
| TR | Ind 1 | 0.43 ± 0.13 | 0.54 ± 0.06 | 0.36 ± 0.10 | 0.36 ± 0.05 | 0.39 ± 0.08 | Group | <0.001 |
| Ind 2 | 0.42 ± 0.09 | 0.43 ± 0.06 | 0.36 ± 0.11 | 0.45 ± 0.05 | 0.38 ± 0.08 | Ind | <0.001 | |
| Ind 3 | 0.42 ± 0.07 | 0.38 ± 0.06 | 0.33 ± 0.04 | 0.32 ± 0.04 | 0.37 ± 0.07 | Group × Ind | <0.001 | |
| Slope | Ind 1 | 5.53 ± 1.19 | 20.83 ± 1.9 | 18.19 ± 3.42 | 13.16 ± 1.28 | 10.47 ± 2.69 | Group | <0.001 |
| Ind 2 | 2.40 ± 0.74 | 15.04 ± 3.12 | 4.51 ± 1.65 | 13.10 ± 1.75 | 6.03 ± 1.43 | Ind | <0.001 | |
| Ind 3 | 1.25 ± 1.05 | 5.93 ± 0.92 | 16.53 ± 2.63 | 24.93 ± 3.27 | 5.66 ± 2.31 | Group × Ind | <0.001 | |
| T1/2MAX | Ind 1 | 2.59 ± 0.81 | 3.60 ± 0.30 | 2.37 ± 0.68 | 3.23 ± 0.50 | 2.39 ± 0.41 | Group | <0.001 |
| Ind 2 | 2.27 ± 0.73 | 2.34 ± 0.60 | 2.58 ± 0.90 | 3.42 ± 0.34 | 6.50 ± 0.80 | Ind | <0.001 | |
| Ind 3 | 3.02 ± 1.41 | 4.30 ± 0.64 | 2.44 ± 0.27 | 1.39 ± 0.09 | 2.07 ± 0.79 | Group × Ind | <0.001 | |
| TMAX | Ind 1 | 6.02 ± 0.80 | 6.71 ± 0.58 | 6.81 ± 1.12 | 8.94 ± 0.75 | 6.42 ± 1.69 | Group | <0.001 |
| Ind 2 | 5.43 ± 1.11 | 5.53 ± 1.54 | 7.69 ± 1.96 | 7.66 ± 0.89 | 16.13 ± 1.76 | Ind | <0.001 | |
| Ind 3 | 6.20 ± 2.16 | 11.28 ± 1.45 | 7.46 ± 0.85 | 4.43 ± 0.48 | 5.28 ± 1.05 | Group × Ind | <0.001 | |
| F1/2MAX | Ind 1 | 16.57 ± 3.39 | 70.05 ± 2.94 | 62.28 ± 7.59 | 58.71 ± 4.91 | 31.61 ± 3.38 | Group | <0.001 |
| Ind 2 | 6.38 ± 1.82 | 40.61 ± 9.66 | 16.61 ± 4.75 | 49.74 ± 5.68 | 51.62 ± 9.11 | Ind | <0.001 | |
| Ind 3 | 3.21 ± 2.19 | 33.33 ± 5.57 | 61.03 ± 7.18 | 55.11 ± 5.96 | 14.69 ± 5.87 | Group × Ind | <0.001 | |
| FMAX | Ind 1 | 33.08 ± 6.74 | 139.44 ± 6.12 | 123.16 ± 14.84 | 117.06 ± 9.86 | 63.11 ± 6.70 | Group | <0.001 |
| Ind 2 | 12.66 ± 3.66 | 80.97 ± 19.15 | 32.98 ± 9.43 | 99.33 ± 11.25 | 103.46 ± 17.84 | Ind | <0.001 | |
| Ind 3 | 6.27 ± 4.27 | 66.50 ± 11.12 | 121.58 ± 14.29 | 109.67 ± 11.91 | 29.26 ± 11.73 | Group × Ind | <0.001 | |
Disclaimer/Publisher’s Note: The statements, opinions and data contained in all publications are solely those of the individual author(s) and contributor(s) and not of MDPI and/or the editor(s). MDPI and/or the editor(s) disclaim responsibility for any injury to people or property resulting from any ideas, methods, instructions or products referred to in the content. |
© 2024 by the authors. Published by MDPI on behalf of the Lithuanian University of Health Sciences. Licensee MDPI, Basel, Switzerland. This article is an open access article distributed under the terms and conditions of the Creative Commons Attribution (CC BY) license (https://creativecommons.org/licenses/by/4.0/).
Share and Cite
Son, G.M.; Park, S.-H.; Kim, N.S.; Yun, M.S.; Lee, I.Y.; Kwon, M.-S.; Kim, T.K.; Lee, E.H.; Hwang, E.J.; Baek, K.-R. Optimal Indocyanine Green Dosage for Repetitive Angiography for Laparoscopic Colorectal Surgery. Medicina 2024, 60, 1966. https://doi.org/10.3390/medicina60121966
Son GM, Park S-H, Kim NS, Yun MS, Lee IY, Kwon M-S, Kim TK, Lee EH, Hwang EJ, Baek K-R. Optimal Indocyanine Green Dosage for Repetitive Angiography for Laparoscopic Colorectal Surgery. Medicina. 2024; 60(12):1966. https://doi.org/10.3390/medicina60121966
Chicago/Turabian StyleSon, Gyung Mo, Sang-Ho Park, Nam Su Kim, Mi Sook Yun, In Young Lee, Myeong-Sook Kwon, Tae Kyun Kim, Eun Hwa Lee, Eun Jung Hwang, and Kwang-Ryul Baek. 2024. "Optimal Indocyanine Green Dosage for Repetitive Angiography for Laparoscopic Colorectal Surgery" Medicina 60, no. 12: 1966. https://doi.org/10.3390/medicina60121966
APA StyleSon, G. M., Park, S.-H., Kim, N. S., Yun, M. S., Lee, I. Y., Kwon, M.-S., Kim, T. K., Lee, E. H., Hwang, E. J., & Baek, K.-R. (2024). Optimal Indocyanine Green Dosage for Repetitive Angiography for Laparoscopic Colorectal Surgery. Medicina, 60(12), 1966. https://doi.org/10.3390/medicina60121966