Article

Comparison of Type I and Type III Collagen Concentration between Oreochromis mossambicus and Oreochromis niloticus in Relation to Skin Scaffolding

by
Bogdan Ciornei
1,
Adrian Vaduva
2,*,
Vlad Laurentiu David
1,
Diana Popescu
3,
Dan Dumitru Vulcanescu
4,
Ovidiu Adam
1,
Cecilia Roberta Avram
5,
Alina Cornelia Pacurari
6 and
Eugen Sorin Boia
1
1
Department of Pediatric Surgery and Orthopedics, “Victor Babes” University of Medicine and Pharmacy, 300002 Timisoara, Romania
2
Department of Pathology, Methodological Research Center ANAPATMOL, “Victor Babes” University of Medicine and Pharmacy, 300002 Timisoara, Romania
3
Department of Pediatric Surgery, “Louis Turcanu” Emergency Children’s Hospital, 300011 Timisoara, Romania
4
Multidisciplinary Research Center on Antimicrobial Resistance (Multi-Rez), “Victor Babes“ University of Medicine and Pharmacy, 300002 Timisoara, Romania
5
Department of Residential Training and Post-University Courses, “Vasile Goldis” Western University, 300002 Arad, Romania
6
Department of Internal Medicine, Medlife Hyperclinic, 300551 Timisoara, Romania
*
Author to whom correspondence should be addressed.
Medicina 2023, 59(6), 1002; https://doi.org/10.3390/medicina59061002
Submission received: 6 April 2023 / Revised: 11 May 2023 / Accepted: 22 May 2023 / Published: 23 May 2023

Abstract

:
Background and Objectives: Skin scaffolding can be done using allografts and autografts. As a biological allograft, the skin of Oreochromis niloticus (ON) has been used due to its high type I and III collagen content. Oreochromis mossambicus (OM) is also a member of the Oreochromis family, but not much is known regarding its collagen content. As such, this study aimed to assess and compare the collagen content of the two fish species. Materials and Methods: This is a crossover study comparing the skin collagen contents of the two fish. Young fish were chosen, as they tend to have higher collagen concentrations. The skin samples were sterilized in chlorhexidine and increasing glycerol solutions and analyzed histochemically with Sirius red picrate under polarized light microscopy. Results: 6 young ON and 4 OM specimens were used. Baseline type I collagen was higher for OM, but at maximum sterilization it was higher for ON, with no differences in between Type III collagen was higher for OM across all comparisons with the exception of the last stage of sterilization. Generally, collagen concentrations were higher in highly sterilized samples. Conclusions: OM skin harvested from young fish, with its greater collagen III content may be a better candidate for use as a biological skin scaffold in the treatment of burn wounds, compared to ON.

1. Introduction

Burns represents one of the leading traumatic injuries in the world. In the US, around 450,000 people suffer from burns every year, while around the world approximately 195,000 deaths are accountable to these injuries [1,2]. In adults, workplace accidents are the leading cause of burns, while in children neglect and abuse are the leading causes. For pediatric patients, scald injuries are the most frequent, approximately 100,000 seeking medical care due to this incident every year in the US [3].
Burn covering materials are essential for the healing process of these wounds. They can either be synthetic or biological. The most used biologic scaffolds are represented by allografts and autografts, but their supply and use are limited by donor incompatibility, in the case of allografts, or by morbidity from additional trauma of the skin through autografts [4,5,6].
Fish skin and its components have long been proposed as temporary grafts for burn wounds. Acellular fish skin has been shown to promote faster healing rates in comparison to bovine skin grafts, with reduced contraction rates, faster epithelialization, and better integration into the wound bed [7,8]. Electrospun fish collagen combined with inorganic components such as Cobalt or Copper ions could prove to enhance neo-vascularization in the first stages of wound healing [9].
The Nile Tilapia (Oreochromis niloticus) (ON) skin has been proposed as a possible biologic scaffold to be used in burns for several years [10,11,12,13]. Its use in burn healing has been evaluated to some extent, but there is a long way till it will gain universal acceptance. Its extracellular matrix (ECM) is comprised of type I and III collagen, similar to human ECM, rendering it a cheap, readily available, and possibly a biocompatible scaffold for wounds [14,15,16,17,18].
Tilapia Mossambica (Oreochromis mossambicus) (OM) is also a subspecies of the Oreochromis family, with a natural habitat located in the same regions of Central and East Africa. In other parts of the world, it is considered, like the Nile Tilapia, an invasive species with adverse effects on local ecosystems through competition for food [19,20,21]. For these reasons, the sources for both fish are limited in most of the regions outside their natural habitat, and alternatives to ON skin, like OM skin, may be useful. Not much is known in the literature about the collagen content of this fish’s skin, the Nile Tilapia being the more studied specimen.
The purpose of this study was to compare the two Tilapia subspecies, OM and ON in regards to collagen type I and III content, before and after sterilization using increasing chlorhexidine and concentrations of glycerol solutions. Additionally, we have investigated the differences between collagen type I and collagen type III ratios in both species. We conducted this study with the ultimate goal of discovering an alternative source for a biological scaffold of fish origin.

2. Materials and Methods

2.1. Preparation and Sterilization

We performed a crossover study, in which we used 10 young Tilapia fish (6 ON, 4 OM), obtaining one skin specimen from each fish. The specimens were harvested from the lateral side of each fish, resulting in 10 total pieces of skin. We have done this to be able to trace the origin of the specimens and to observe the direct histologic effect of the multiple stages of the sterilization process.
The sterilization protocol is performed after the one described by Alves et al. with minor modifications [16] and the steps we took can be seen in Table 1.
After completion of each of these steps, a 2 × 1 cm sample of tissue was harvested from each specimen to undergo histochemical analysis.

2.2. Microbiological Analysis

For the microbiological analysis, a 0.5 × 0.5 cm fragment was taken from each sample after completion of each stage of sterilization and imprinted consecutively on Petri dishes containing Blood-agar, Hicrome UTI agar, Chapman medium, and MacConkey agar, incubated at 36.3 °C in a Memmert incubator (Memmert GmbH & Co., Ltd. KG, Aussere Rittersbacher Strasse 38 D-91126 Schwabach, Germany). The dishes were evaluated for bacterial growth after 24, 48, and 72 h [22].

2.3. Histochemical Analysis

The skin samples were fixed in formalin and further embedded in paraffin as per the usual technique.
Histochemical analysis was performed using Sirius Red picrate staining (Bio-Optica Milano S.p.A. Via San Faustino 58-20134 Milano, Italy) in the evaluation process of type I and III collagen components under polarized light. The staining was performed according to the manufacturer’s instructions. Five photomicrographs were taken from each sample at ×20 magnification, belonging to each sterilization stage, adding up to 200 photomicrographs that were submitted for analysis. Polarized light microscopy images were obtained on a Leica DMD108 microscope (Leica Microsystems, Ernst-Leitz-Strasse 17-35, 35578 Wetzlar, Germany) and saved as uncompressed TIFF images.
These images were then run through an automated image analysis protocol in Icy Bioimage Analysis software [19]. Briefly, each image was split into two additional images representing the red and green channels (Figure 1).
Automatic segmentation of the positive polarized areas was performed afterward, resulting in regions of interest (ROI) for which statistics were saved to a xls file for statistical analysis.
The data obtained by the Icy BioImage Analysis Software included the total area (µm2) covered in the ROI on the respective channel (type I or type III collagen). After determining the total surface covered by the two collagen types, we calculated a ratio between collagen type I and III, on each sample [23].

2.4. Statistical Analysis

Statistical analysis was performed using SPSS IBM Statistics (v26) (IBM Corp. Released 2019. IBM SPSS Statistics for Windows, Version 26.0. Armonk, NY, USA: IBM Corp).
Sample size was calculated using the G*Power software (v 3.1.9.6), according to the ARRIVE Guidelines, using an a priori test to calculate the minimum sample size for a high effect size (0.5) and a power of 80%. The result indicated that a minimum of 8 samples were needed. As such, 10 fish were chosen.
The raw data was formatted in a wide format and tested for normality and sphericity. Repeated measures ANOVA with Bonferroni correction was used to assess in-group differences, with the default pairwise t-test used for multiple comparisons. A Student’s t-test assuming unequal variances was used at each stage to compare the two fish. The significance level was set to 95%, (p values lower than 0.05).
The xls file computed by the IcyBioImage software provided multiple determinations of areas covered by the red and green channels. We then calculated the mean area of collagen on the respective channel for each sample, by dividing the total area covered (µm2) by the number of individual surfaces. In this way, we calculated the mean area covered by collagen (type I and type III) in each sample and used it to evaluate the differences between the two species. Also with this new data, we have calculated the ratio between the two collagen types.

2.5. Ethical Considerations

The study protocol was presented and approved by the Committee on Research Ethics of the University of Medicine and Pharmacy “Victor Babes” Timisoara, under number 61/30.08.2021, being in line with the European directive 2010/63/EU European Union OJ L276/33 and The Helsinki Declaration.

3. Results

We used 10 young fish, out of which 6 were in the ON group, with weights ranging from 92–160 g, and 4 in the OM group, weighing between 129–340 g.

3.1. Microbiological Analysis

Among the 10 fish specimens subjected to microbiological analysis, contamination was observed in two samples (1 ON and 1 OM) due to mishandling, and thus, were not further examined. The remaining 8 samples were inoculated onto the previously mentioned 4 culture media. Notably, none of the 32 samples revealed any signs of bacterial growth on the Petri dishes containing Blood-agar, Hicrome UTI agar, Chapman medium, and MacConkey agar, irrespective of the incubation period (24, 48, and 72 h).

3.2. Collagen Type I Histochemical Analysis

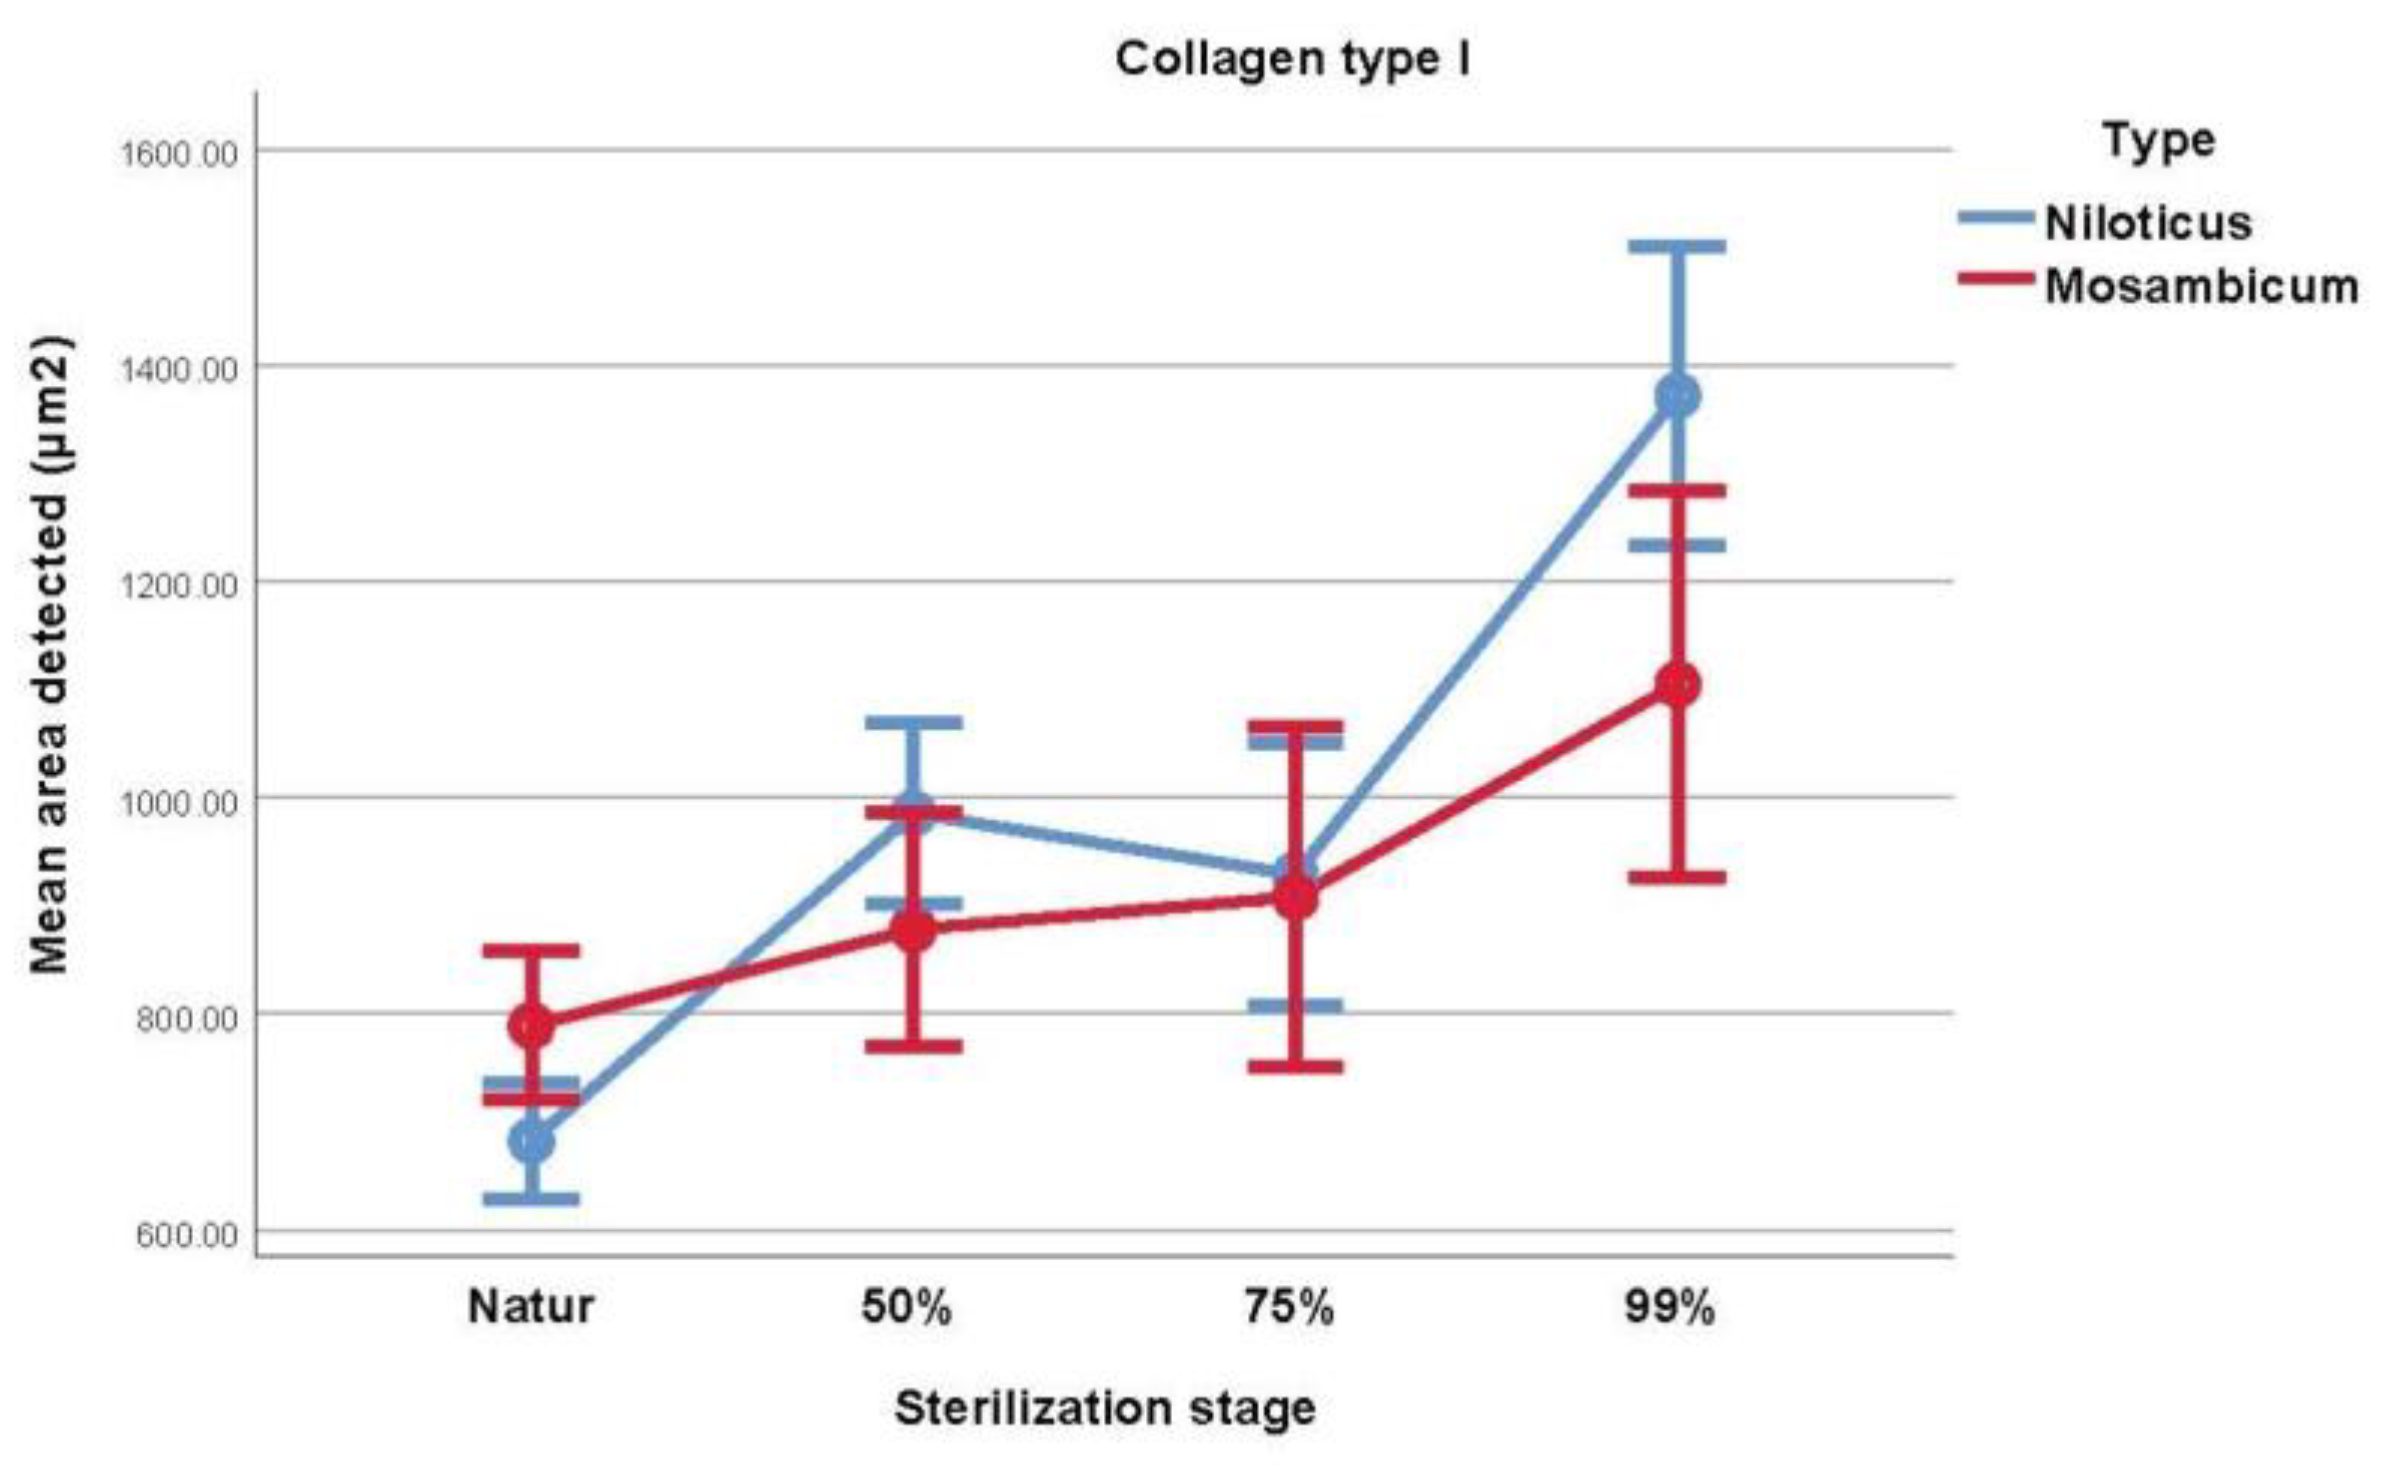
Using Student’s t test to compare the collagen type I evolution between the two species showed that there is a statistically significant difference between ON and OM at baseline (natur, p = 0.017, ON < OM) and at the last stage of sterilization (99% glycerol, p = 0.022, OM < ON), as seen in Table 2 and Figure 2.
Table 3 contains information and comparisons regarding in-group sterilization, assessed by the repeated measures ANOVA. For the ON type, natur type I collagen content was higher the higher with sterilization stage (p < 0.001), with the exception of 50% glycerol vs. 75% glycerol samples, which showed no statistical difference (p = 0.394). For the OM fish, the following differences were observed: natur vs. 99% glycerol (p = 0.001) and 50% glycerol vs. 99% glycerol (p = 0.028), with collagen concentration being higher in the more sterilized sample.

3.3. Collagen Type III Histochemical Analysis

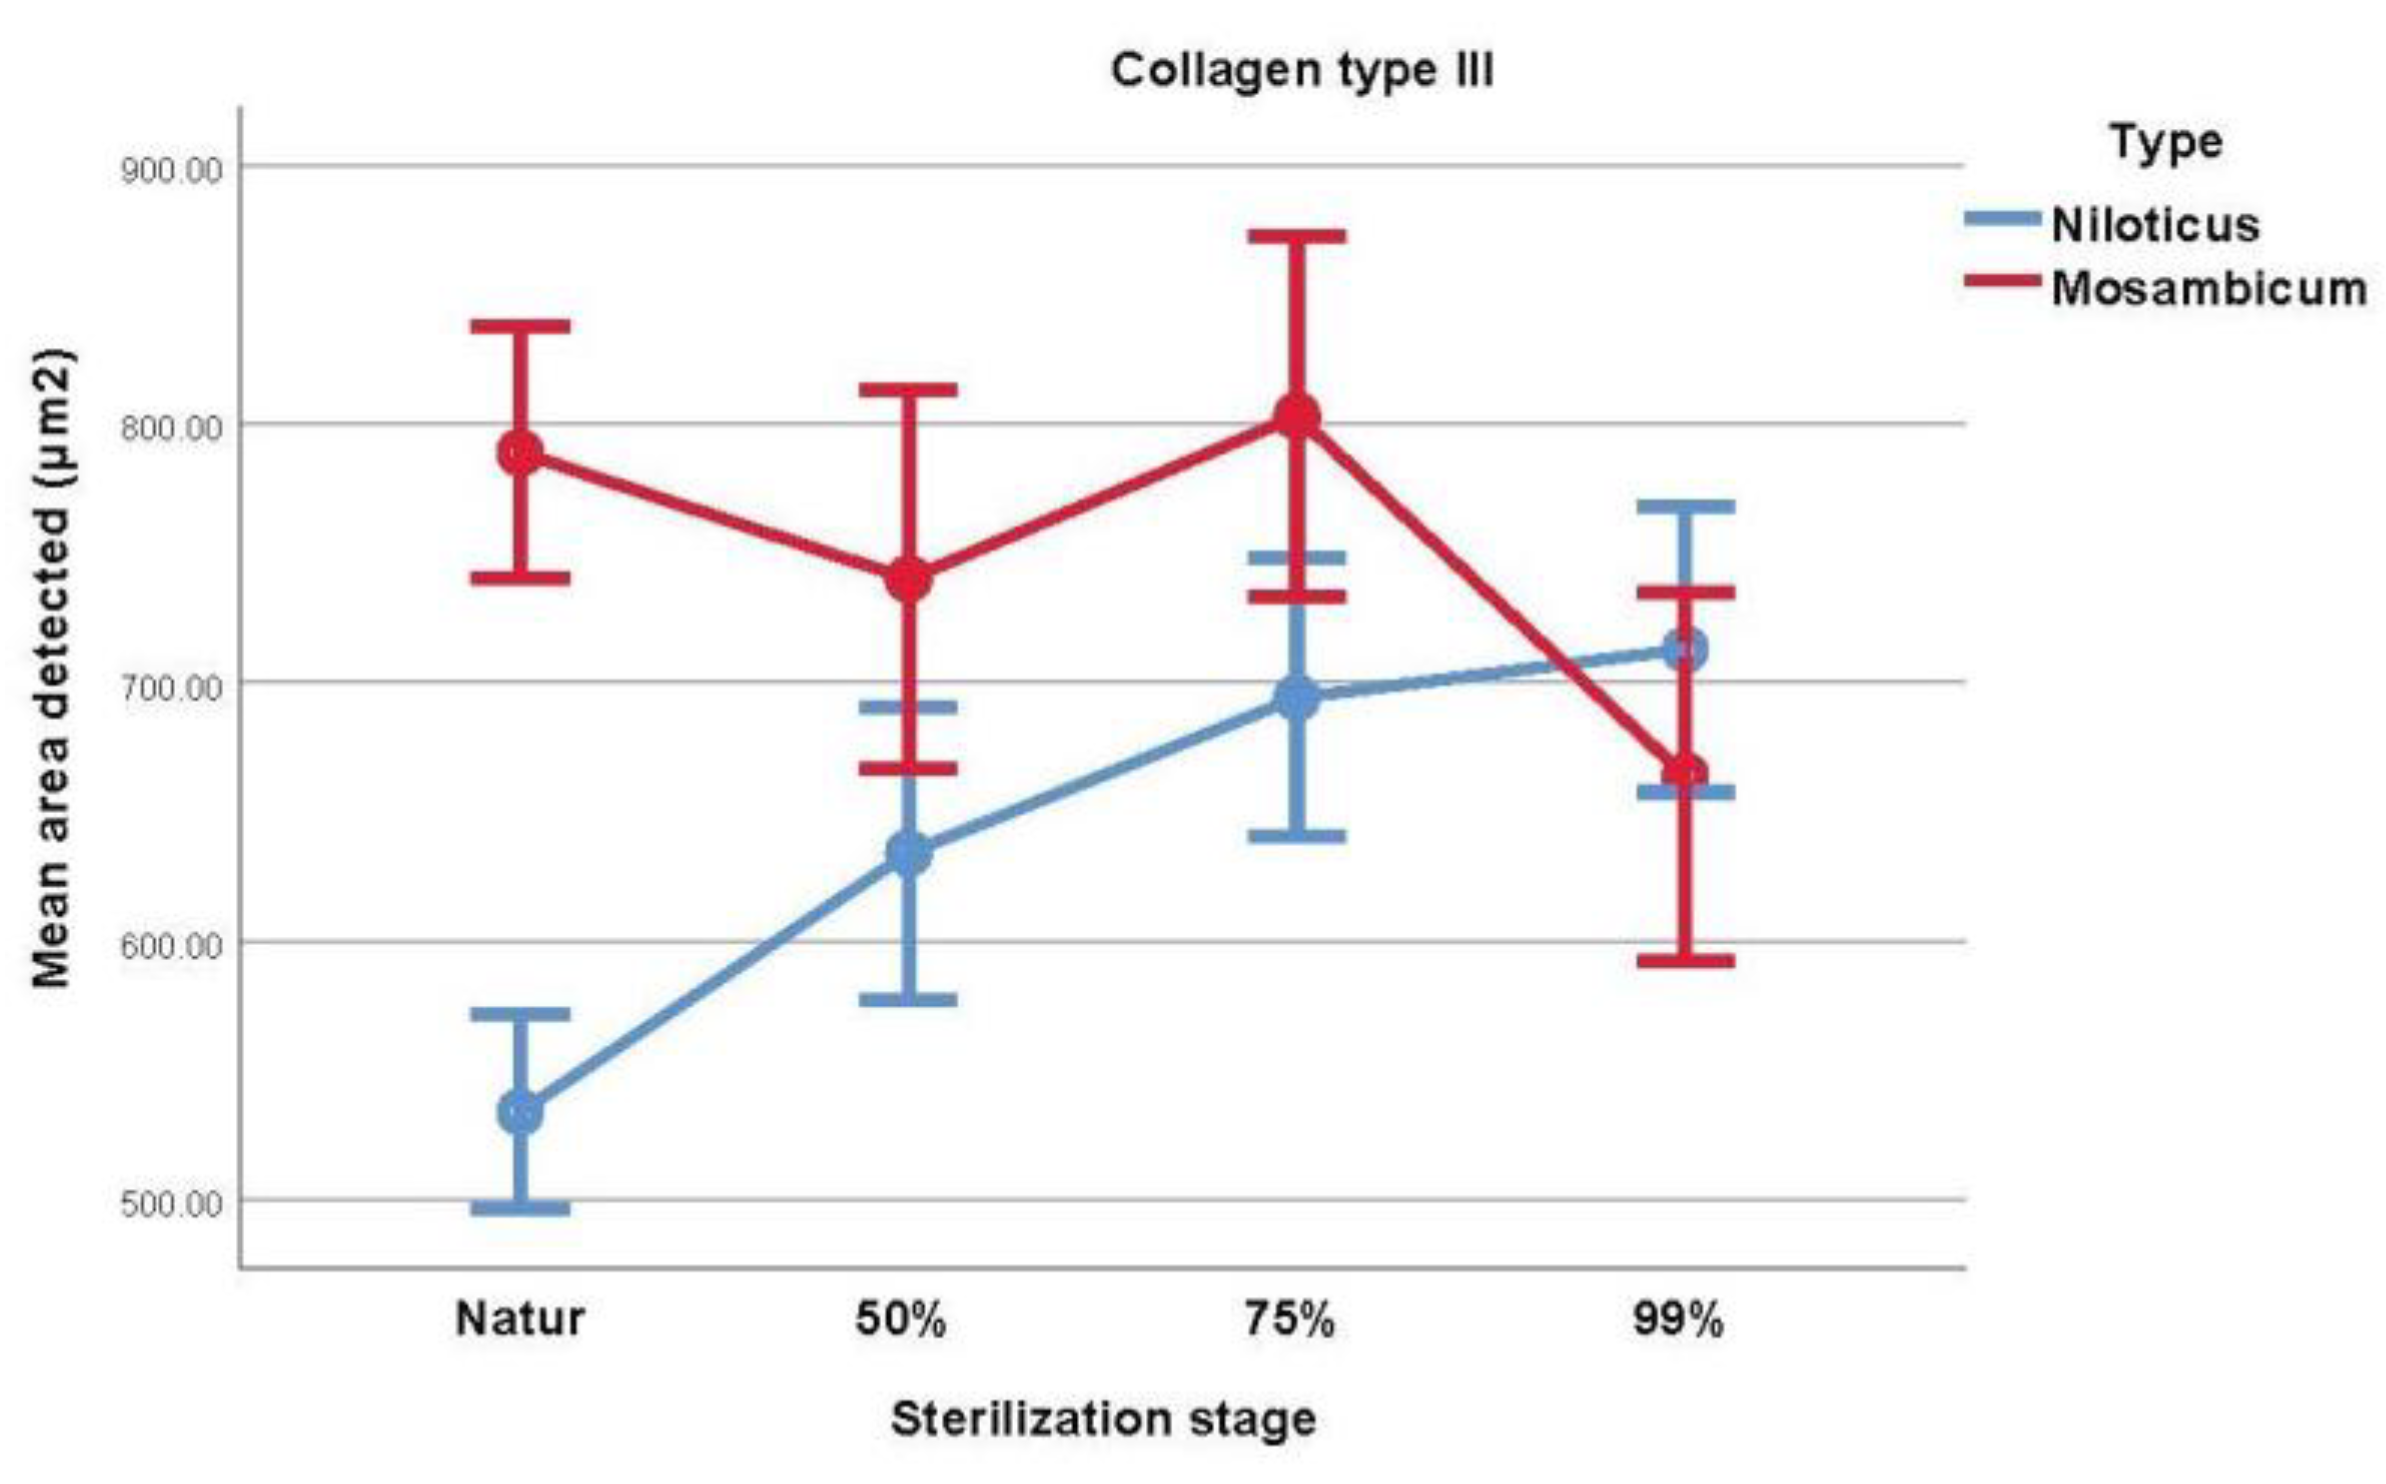
The outcomes of the t-test indicate a notable variation in the mean collagen type III content between the two species within the baseline group, with OM exhibiting over 40% higher concentration in contrast to ON (natur, p < 0.001). Additionally, Table 4 and Figure 3 reveal that collagen III levels were significantly elevated at the initial stage of sterilization (50% glycerol, p = 0.026) and second stage (75% glycerol, p = 0.16). Nonetheless, this difference was not statistically significant in the 99% Glycerol group.
Table 5 contains information and comparisons regarding in-group sterilization using the repeated measures ANOVA. For ON, a difference was observed between natur concentrations and each sterilization stage (p = 0.001 or less), with the exception of 50% glycerol vs. 75% glycerol (p = 0.065) and 75% glycerol vs. 99% glycerol (p = 0.427), with collagen concentration being higher in the more sterilized samples. For OM, the following differences were observed: natur vs. 99% glycerol (p = 0.005), with collagen concentration being higher in the more sterilized sample, 50% glycerol vs. 99% glycerol (p = 0.037) and 75% glycerol vs. 99% glycerol (p < 0.001), with collagen concentration being higher in the less sterilized samples.

3.4. Collagen I/III Ratio

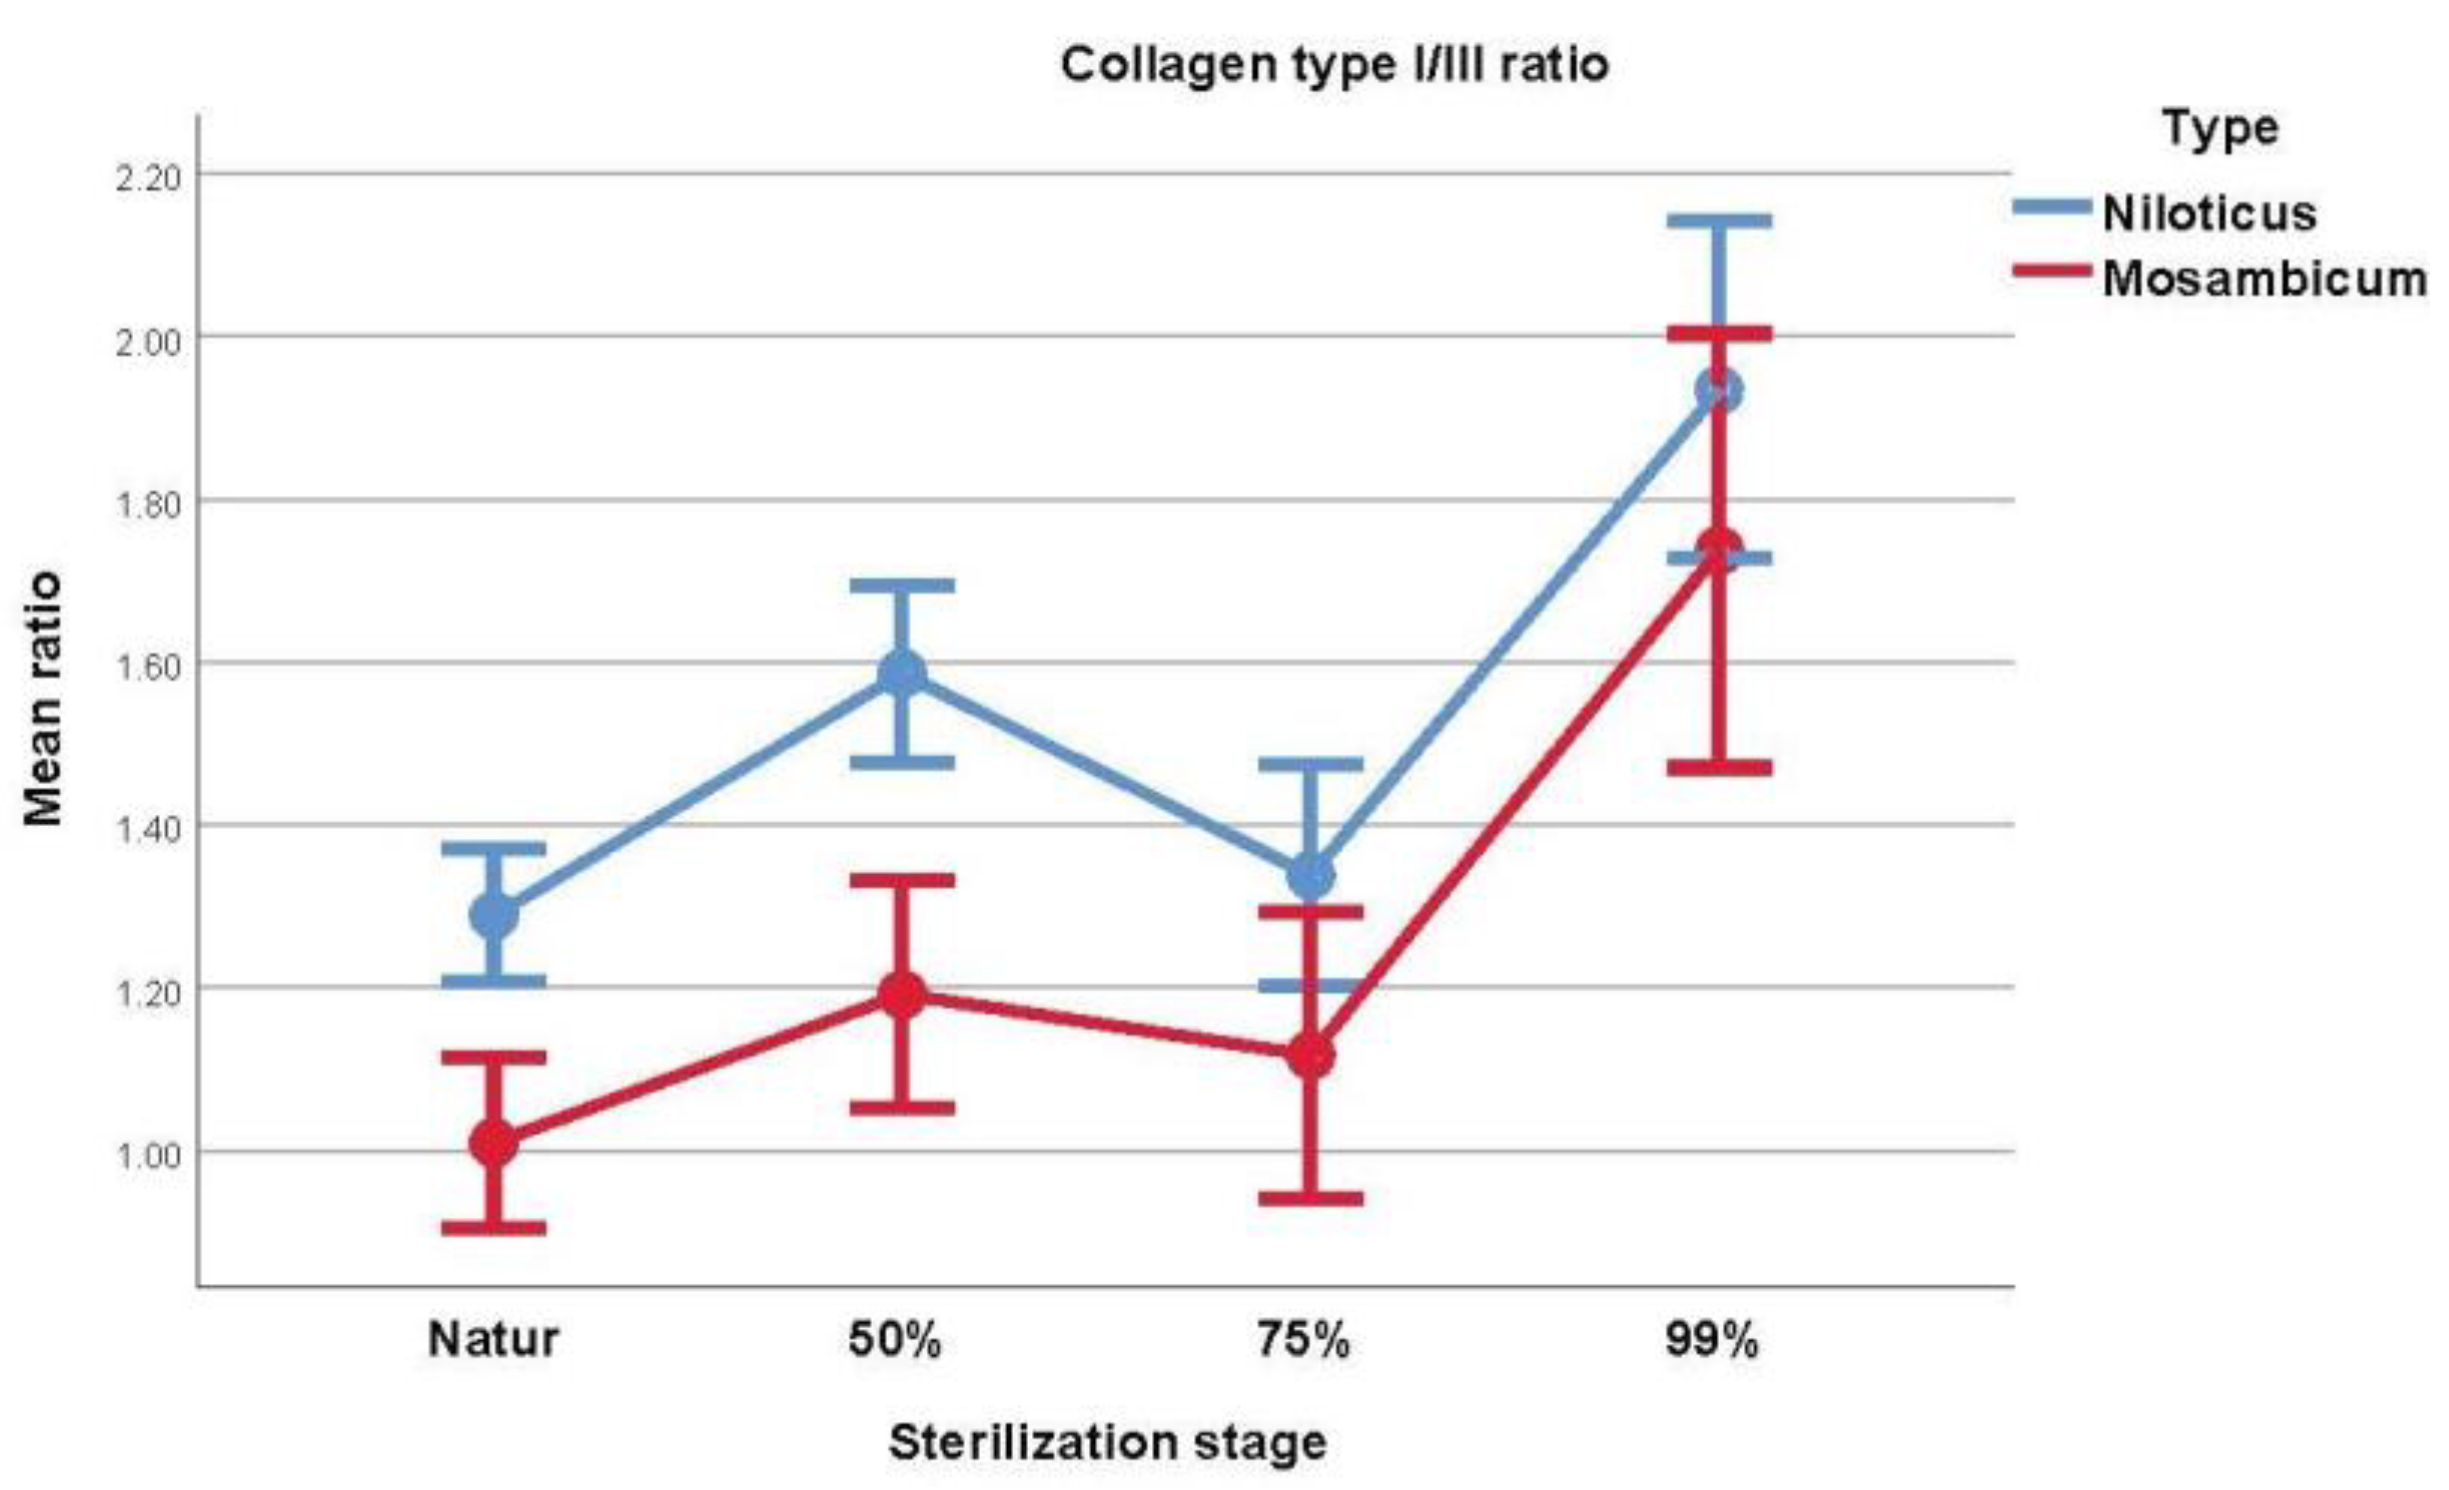
As expressed in Table 6 and Figure 4, the collagen ratio is significantly different between the two species of fish at the t test. OM presented a lower ratio for natur and 50% glycerol (p < 0.001), yet the differences could not be considered statistically significant in regards to 75% glycerol (p = 0.050) and 99% glycerol (p = 0.244). This is due to higher type III collagen concentrations.
Table 7 contains information and comparisons regarding in-group sterilization using the repeated measures ANOVA. For ON, significant differences were observed, with higher ratios being observed in more sterilized samples (p = 0.006 or less), with the exception of natur vs. 75% glycerol (p = 0.480). For the OM samples, the following statistical differences were observed: natur vs. 99% glycerol (p < 0.001), 50% glycerol vs. 99% glycerol (p < 0.001) and 75% glycerol vs. 99% glycerol (p < 0.001).

4. Discussion

Information about the collagen content of OM skin is scarce. Our inquiry into the literature has produced very little insight into the extent of OM as a subject of study. Liu et al., have studied the collagen content of OM bones, but not the skin [24]. Most articles have relied on the use of ON skin to study possible healing effects of the collagen contained within, but compared to our study, the determination of the amount of collagen was done by purification extraction methods such as enzymatic reactions, hot water, acetic-acid methods, sodium hydroxide methods, and others [25,26,27]. All of these studies have used mature fish, and it seems that after performing the above-mentioned processes of extraction, they have produced only collagen with a biochemical composition consistent with type I. However, for regeneration of the skin to happen, a biological scaffold needs type III collagen as well [28].
Other wound dressings that help skin regeneration after burns are represented by biosynthetic coverings, which have the role of temporarily or permanently closing the wound in order for it to heal. Some use the patient’s own cells to favor this process, others are comprised of an acellular collagen matrix which offers support for fibroblast and endothelial cell migration and proliferation [29]. Key characteristics of wound coverings are the ability to prevent heat and water loss and at the same time to permit exudate removal. These products also need to be biocompatible, have good adherence to the wound bed, and be free of microbial or viral colonization [30].
The biocompatibility of Tilapia fish collagen has been studied by several researchers [13,31,32,33], through in vitro studies, reaching the conclusion that indeed collagen derived from Tilapia fish skin or scales is compatible with human cells, producing no severe immunogenic reaction. Also, it seems that in vitro, Tilapia collagen might have an antimicrobial effect as well [34].
Previous studies involving the Nile Tilapia have shown the potential of this biological scaffold for the treatment of burns. It has the main elements that constitute the ECM of human skin, mainly collagen type I and III, it can be easily sterilized and stored [16,18,35].
Lv K et al. [36] sought to compare the biodegradability and biocompatibility of Tilapia skin acellular dermal matrix to fetal bovine skin acellular dermal matrix through in vitro and in vivo implantation and cell culture techniques. The biocompatibility of Tilapia acellular dermal matrix was confirmed through in vitro and in vivo experiments. The Tilapia matrix scaffold was found to have no cytotoxicity and was friendly to cell growth, as shown by cell proliferation and cytotoxicity tests. L929 culture cells were able to infiltrate and adhere to the Tilapia acellular dermal matrix scaffold. In subcutaneous implantation in rats, the scaffold had tissue fluid infiltration and adhesion to the surrounding tissue within three days, and gradually degraded to form a tissue mass within 28 days, with no adverse reactions observed. Histological staining showed that the scaffold was integrated with the skin and cells like normal soft tissue, with the collagen fiber structure becoming less intact over time due to phagocytosis and degradation.
One very important disadvantage of fish-derived collagen products is the lower denaturation temperature in comparison to mammalian counterparts. Although this threshold is indeed at room temperature for fish collagen, crosslinking during manufacturing processes could potentially increase it [37,38]. This characteristic is important both during manufacturing as well as for the clinical outcome.
Our study has shown that there is a significant difference between the collagen content of ON and OM skin. In addition, we observed that the sterilization process using sequentially increasing concentrations of glycerol interfered with the amount of collagen type I and III detected in the samples at the end of the said process.
One interesting result is that collagen denaturation did not follow a linear pattern. Moreover, the mean area of collagen type I and III has increased with respect to the preceding ones. The concentration of Glycerol that remains trapped on the surface of the skin might have played a role in the diffraction of the polarized light. We searched for other possible explanations and have found that native collagen tends to bind glycerol to its surface, which stabilizes the triple helical structure [39,40]. Also, glycerol seems to have the role to sequestrate water [41,42], thus possibly interfering with the detection method. Further studies which incorporate immunohistochemical or biochemical determinations are needed. Furthermore, Lattouf et al. [43] questioned the capacity of Sirius red picrate staining under polarized light, to differentiate between type I and III collagen fibrils. In their study regarding Ehlers-Danlos type IV patients, Sirius red picrate managed to stain two types of collagen, corresponding to type I and III, but immunohistochemical staining did not show signs of type III collagen’s presence. This could’ve happened in part because although there was no collagen type III, the matrix presented aberrant pro-collagen type III which might have been stained by Sirius red. On the other hand, immunohistochemistry will not be able to detect collagen type III with its specific antibody, if there are only pro-collagen fibrils.
In our study, the ON subjects were immature specimens. One difference that we could see is that the ratio between type I and type III collagen was lower for the OM group, meaning that the amount of collagen type III was higher in young specimens, compared to the mature ones described by Alves et al. [16].
Normally, in the early stages of skin healing, collagen type III is more abundant than collagen type I [44,45]. This shows that young fish provide a closer match to the matrix physiologically produced in the early repair processes. Therefore, the use of skin harvested from young fish might be more helpful in the management of burn wounds. Further in vivo studies are recommended.

Limitations

Limits to our study are represented by the small sample size and the fact that our determination was done using histochemical quantitative methods and not biochemical or immuno-histochemical determinations. We could also prove that the sterilization method is effective against bacteria, but the determination of viral contents was not performed.
Further studies need to assess the exact amount of collagen within these specimens to have a more accurate image of their possible use in burn injuries.

5. Conclusions

The collagen content of OM skin was greater than that of ON in the natural state. The analysis of the sterilization process showed that the difference in collagen content between baseline (natur) and 99% Glycerol state was most probably caused by the interaction of glycerol with the collagen fibers, in the way that it changes their optical properties. Based on our results, OM skin harvested from young fish, with its greater collagen type I and III content per square µm, could potentially be a better candidate than ON skin, for use as a biologic skin scaffold in the treatment of burn wounds.

Author Contributions

Conceptualization, B.C.; data curation, D.P.; formal analysis, D.D.V.; investigation, A.V.; methodology, B.C.; project administration, O.A. and E.S.B.; software, O.A. and A.C.P.; supervision, V.L.D. and E.S.B.; validation, V.L.D.; visualization, D.P. and E.S.B.; writing—original draft, B.C. and C.R.A.; writing—review & editing, A.V. and A.C.P. All authors have read and agreed to the published version of the manuscript.

Funding

This research received no external funding.

Institutional Review Board Statement

The animal study was conducted in accordance with the Declaration of Helsinki, and approved by the Ethics Committee of University of Medicine and Pharmacy “Victor Babes” Timisoara (protocol 61/30.08.2021).

Informed Consent Statement

Not applicable.

Data Availability Statement

Data available on request from the corresponding author.

Acknowledgments

The present article is part of the doctoral studies of Bogdan Ciornei (BC).

Conflicts of Interest

The authors declare no conflict of interest.

References

  1. WHO. Burns. Available online: https://www.who.int/en/news-room/fact-sheets/detail/burns (accessed on 3 January 2021).
  2. Burkey, B.; Besner, G.E. Burns. In Fundamentals of Pediatric Surgery; Mattei, P., Ed.; Springer International Publishing: Philadelphia, PA, USA, 2017; pp. 153–168. [Google Scholar]
  3. Elijah, I.E.; Komak, S.; Finnerty, C.C.; Herndon, D.N. Pediatric burns. In Pediatric Critical Care Medicine: Volume 4: Peri-Operative Care of the Critically Ill or Injured Child; Wheeler, D.S., Wong, H.R., Shanley, T.P., Eds.; Springer: London, UK, 2014; pp. 277–286. [Google Scholar]
  4. Jeschke, M.G.; van Baar, M.E.; Choudhry, M.A.; Chung, K.K.; Gibran, N.S.; Logsetty, S. Burn injury. Nat. Rev. Dis. Prim. 2020, 6, 11. [Google Scholar] [CrossRef] [PubMed]
  5. Motamed, S.; Taghiabadi, E.; Molaei, H.; Sodeifi, N.; Hassanpour, S.E.; Shafieyan, S.; Azargashb, E.; Farajzadeh-Vajari, F.; Aghdami, N.; Bajouri, A. Cell-based skin substitutes accelerate regeneration of extensive burn wounds in rats. Am. J. Surg. 2017, 214, 762–769. [Google Scholar] [CrossRef] [PubMed]
  6. Haddad, A.G.; Giatsidis, G.; Orgill, D.P.; Halvorson, E.G. Skin Substitutes and Bioscaffolds: Temporary and Permanent Coverage. Clin. Plast. Surg. 2017, 44, 627–634. [Google Scholar] [CrossRef] [PubMed]
  7. Yoon, J.; Yoon, D.; Lee, H.; Lee, J.; Jo, S.; Kym, D.; Yim, H.; Hur, J.; Chun, W.; Kim, G.; et al. Wound healing ability of acellular fish skin and bovine collagen grafts for split-thickness donor sites in burn patients: Characterization of acellular grafts and clinical application. Int. J. Biol. Macromol. 2022, 205, 452–461. [Google Scholar] [CrossRef]
  8. Stone, R., 2nd; Saathoff, E.C.; Larson, D.A.; Wall, J.T.; Wienandt, N.A.; Magnusson, S.; Kjartansson, H.; Natesan, S.; Christy, R.J. Accelerated Wound Closure of Deep Partial Thickness Burns with Acellular Fish Skin Graft. Int. J. Mol. Sci. 2021, 22, 1590. [Google Scholar] [CrossRef] [PubMed]
  9. Jana, S.; Datta, P.; Das, H.; Ghosh, P.R.; Kundu, B.; Nandi, S.K. Engineering Vascularizing Electrospun Dermal Grafts by Integrating Fish Collagen and Ion-Doped Bioactive Glass. ACS Biomater. Sci. Eng. 2022, 8, 734–752. [Google Scholar] [CrossRef] [PubMed]
  10. Zeng, R.; Lin, C.; Lin, Z.; Chen, H.; Lu, W.; Lin, C.; Li, H. Approaches to cutaneous wound healing: Basics and future directions. Cell Tissue Res. 2018, 374, 217–232. [Google Scholar] [CrossRef]
  11. Mathangi Ramakrishnan, K.; Babu, M.; Mathivanan Jayaraman, V.; Shankar, J. Advantages of collagen based biological dressings in the management of superficial and superficial partial thickness burns in children. Ann. Burns Fire Disasters 2013, 26, 98–104. [Google Scholar]
  12. Sugiura, H.; Yunoki, S.; Kondo, E.; Ikoma, T.; Tanaka, J.; Yasuda, K. In Vivo Biological Responses and Bioresorption of Tilapia Scale Collagen as a Potential Biomaterial. J. Biomater. Sci. Polym. Ed. 2009, 20, 1353–1368. [Google Scholar] [CrossRef]
  13. Lin, C.; Ritch, R.; Lin, S.; Ni, M.-H.; Chang, Y.-C.; Lu, Y.; Lai, H.; Lin, F.-H. A new fish scale-derived scaffold for corneal regeneration. Eur. Cells Mater. 2010, 19, 50–57. [Google Scholar] [CrossRef]
  14. Alves, A.P.N.N.; Verde, M.E.Q.L.; Fereira Júnior, A.E.C.; Silva, P.G.B.; Feitosa, V.P.; Júnior, E.M.L.; de Miranda, M.J.B.; de Filho, M.O.M. Avaliação microscópica, estudo histoquímico e análise de propriedades tensiométricas da pele de tilápia do Nilo. Rev. Bras. Queimaduras 2015, 14, 203–210. [Google Scholar]
  15. Lau, C.S.; Hassanbhai, A.; Wen, F.; Wang, D.; Chanchareonsook, N.; Goh, B.T.; Yu, N.; Teoh, S. Evaluation of decellularized tilapia skin as a tissue engineering scaffold. J. Tissue Eng. Regen. Med. 2019, 13, 1779–1791. [Google Scholar] [CrossRef] [PubMed]
  16. Alves, A.P.N.N.; Júnior, E.M.L.; Piccolo, N.S.; de Miranda, M.J.B.; Verde, M.E.Q.L.; Júnior, A.E.C.F.; Silva, P.G.D.B.; Feitosa, V.P.; de Bandeira, T.J.P.G.; Mathor, M.B.; et al. Study of tensiometric properties, microbiological and collagen content in nile tilapia skin submitted to different sterilization methods. Cell Tissue Bank. 2018, 19, 373–382. [Google Scholar] [CrossRef] [PubMed]
  17. Costa, B.A.; Lima Júnior, E.M.; de Moraes Filho, M.O.; Fechine, F.V.; de Moraes, M.E.A.; Silva Júnior, F.R.; do Nascimento Soares, M.F.A.; Rocha, M.B.S. Use of Tilapia Skin as a Xenograft for Pediatric Burn Treatment: A Case Report. J. Burn Care Res. 2019, 40, 714–717. [Google Scholar] [CrossRef]
  18. Lima Júnior, E.M.; de Moraes Filho, M.O.; Costa, B.A.; Fechine, F.V.; Alves, A.P.N.N.; de Moraes, M.E.A.; Rocha, M.B.S.; Silva Júnior, F.R. Pediatric Burn Treatment Using Tilapia Skin as a Xenograft for Superficial-Partial Thickness Wounds: A Pilot Study. J. Burn Care Res. 2020, 41, 241–247. [Google Scholar] [CrossRef]
  19. Basavaraja, N.; Raghavendra, C.H. Hormonal sex reversal in red tilapia (Oreochromis niloticus and Oreochromis mossambicus) and inheritance of body colour in O. mossambicus and red tilapia: Implications for commercial farming. Aquac. Int. 2017, 25, 1317–1331. [Google Scholar] [CrossRef]
  20. Valenzuela-Rojo, D.R.; López-Cervantes, J.; Sánchez-Machado, D.I. Tilapia (Oreochromis aureus) Collagen for Medical Biomaterials, Seaweed Biomaterials, Sabyasachi Maiti, IntechOpen. Available online: https://www.intechopen.com/chapters/61471 (accessed on 2 March 2020).
  21. Center for Invasive Species Solutions Australia Tilapia Mossambica. Available online: https://pestsmart.org.au/toolkit-resource/biology-and-ecology-of-mozambique-tilapia-oreochromis-mossambicus/ (accessed on 2 March 2021).
  22. Atwa, E.I. Bacteriological Study of Fish Samples Collected from Different Markets in Some Egyptian Governorates and Antimicrobial Sensitivity of Isolates. Int. J. Curr. Microbiol. Appl. Sci. 2017, 6, 2765–2776. [Google Scholar] [CrossRef]
  23. De Chaumont, F.; Dallongeville, S.; Chenouard, N.; Hervé, N.; Pop, S.; Provoost, T.; Meas-Yedid, V.; Pankajakshan, P.; LeComte, T.; Le Montagner, Y.; et al. Icy: An open bioimage informatics platform for extended reproducible research. Nat. Methods 2012, 9, 690–696. [Google Scholar] [CrossRef]
  24. Liu, H.; Huang, K. Structural Characteristics of Extracted Collagen from Tilapia (Oreochromis mossambicus) Bone: Effects of Ethylenediaminetetraacetic Acid Solution and Hydrochloric Acid Treatment. Int. J. Food Prop. 2016, 19, 63–75. [Google Scholar] [CrossRef]
  25. Menezes, M.D.L.L.R.; Ribeiro, H.L.; Flávia de Oliveira, M.; de Andrade Feitosa, J.P. Optimization of the collagen extraction from Nile tilapia skin (Oreochromis niloticus) and its hydrogel with hyaluronic acid. Colloids Surf. B Biointerfaces 2020, 189, 110852. [Google Scholar] [CrossRef]
  26. Jafari, H.; Lista, A.; Siekapen, M.M.; Ghaffari-Bohlouli, P.; Nie, L.; Alimoradi, H.; Shavandi, A. Fish Collagen: Extraction, Characterization, and Applications for Biomaterials Engineering. Polymers 2020, 12, 2230. [Google Scholar] [CrossRef] [PubMed]
  27. Bi, C.; Li, X.; Xin, Q.; Han, W.; Shi, C.; Guo, R.; Shi, W.; Qiao, R.; Wang, X.; Zhong, J. Effect of extraction methods on the preparation of electrospun/electrosprayed microstructures of tilapia skin collagen. J. Biosci. Bioeng. 2019, 128, 234–240. [Google Scholar] [CrossRef] [PubMed]
  28. Strong, A.L.; Neumeister, M.W.; Levi, B. Stem Cells and Tissue Engineering: Regeneration of the Skin and Its Contents. Clin. Plast. Surg. 2017, 44, 635–650. [Google Scholar] [CrossRef] [PubMed]
  29. Yamamoto, T.; Iwase, H.; King, T.W.; Hara, H.; Cooper, D.K. Skin xenotransplantation: Historical review and clinical potential. Burns 2018, 44, 1738–1749. [Google Scholar] [CrossRef]
  30. Oryan, A.; Alemzadeh, E.; Moshiri, A. Burn wound healing: Present concepts, treatment strategies and future directions. J. Wound Care 2017, 26, 5–19. [Google Scholar] [CrossRef]
  31. Yamamoto, K.; Igawa, K.; Sugimoto, K.; Yoshizawa, Y.; Yanagiguchi, K.; Ikeda, T.; Yamada, S.; Hayashi, Y. Biological Safety of Fish (Tilapia) Collagen. BioMed Res. Int. 2014, 2014, 630757. [Google Scholar] [CrossRef]
  32. Li, D.; Gao, Y.; Wang, Y.; Yang, X.; He, C.; Zhu, M.; Zhang, S.; Mo, X. Evaluation of biocompatibility and immunogenicity of micro/nanofiber materials based on tilapia skin collagen. J. Biomater. Appl. 2019, 33, 1118–1127. [Google Scholar] [CrossRef]
  33. Tang, J.; Saito, T. Biocompatibility of Novel Type I Collagen Purified from Tilapia Fish Scale: An In Vitro Comparative Study. BioMed Res. Int. 2015, 2015, 139476. [Google Scholar] [CrossRef] [PubMed]
  34. Mei, F.; Liu, J.; Wu, J.; Duan, Z.; Chen, M.; Meng, K.; Chen, S.; Shen, X.; Xia, G.; Zhao, M. Collagen Peptides Isolated from Salmo salar and Tilapia nilotica Skin Accelerate Wound Healing by Altering Cutaneous Microbiome Colonization via Upregulated NOD2 and BD14. J. Agric. Food Chem. 2020, 68, 1621–1633. [Google Scholar] [CrossRef]
  35. Lima Júnior, E.M.; De Moraes Filho, M.O.; Costa, B.A.; Rohleder, A.V.P.; Sales Rocha, M.B.; Fechine, F.V.; Forte, A.J.; Alves, A.P.N.N.; Silva Júnior, F.R.; Martins, C.B.; et al. Innovative Burn Treatment Using Tilapia Skin as a Xenograft: A Phase II Randomized Controlled Trial. J. Burn Care Res. 2020, 41, 585–592. [Google Scholar] [CrossRef]
  36. Lv, K.; Wang, L.; He, X.; Li, W.; Han, L.; Qin, S. Application of Tilapia Skin Acellular Dermal Matrix to Induce Acute Skin Wound Repair in Rats. Front. Bioeng. Biotechnol. 2022, 9, 792344. [Google Scholar] [CrossRef] [PubMed]
  37. Gauza-Włodarczyk, M.; Kubisz, L.; Mielcarek, S.; Włodarczyk, D. Comparison of thermal properties of fish collagen and bovine collagen in the temperature range 298–670 K. Mater. Sci. Eng. C 2017, 80, 468–471. [Google Scholar] [CrossRef] [PubMed]
  38. Zain, N.M.; Saidin, S.; Sosiawan, A. Properties of Tilapia Collagen as a Biomaterial for Tissue Engineering: A Review. In IOP Conference Series: Materials Science and Engineering; IOP Publishing: Bristol, UK, 2020; Volume 932, p. 012021. [Google Scholar] [CrossRef]
  39. Na, G.C. Interaction of calf skin collagen with glycerol: Linked function analysis. Biochemistry 1986, 25, 967–973. [Google Scholar] [CrossRef] [PubMed]
  40. Penkova, R.; Goshev, I.; Gorinstein, S.; Nedkov, P. Stabilizing effect of glycerol on collagen type I isolated from different species. Food Chem. 1999, 66, 483–487. [Google Scholar] [CrossRef]
  41. Herson, M.R.; Hamilton, K.; White, J.; Alexander, D.; Poniatowski, S.; O’connor, A.J.; Werkmeister, J.A. Interaction of preservation methods and radiation sterilization in human skin processing, with particular insight on the impact of the final water content and collagen disruption. Part I: Process validation, water activity and collagen changes in tissues. Cell Tissue Bank. 2018, 19, 215–227. [Google Scholar] [CrossRef]
  42. Liu, C.-K. Absorption of glycerol and its effects on the physical properties of a collagen material: Leather. J. Appl. Polym. Sci. 2002, 87, 1221–1231. [Google Scholar] [CrossRef]
  43. Lattouf, R.; Younes, R.; Lutomski, D.; Naaman, N.; Godeau, G.; Senni, K.; Changotade, S. Picrosirius red staining: A useful tool to appraise collagen networks in normal and pathological tissues. J. Histochem. Cytochem. 2014, 62, 751–758. [Google Scholar] [CrossRef]
  44. Griffiths, C.; Barker, J.; Bleiker, T.; Chalmers, R.; Creamer, D. Rook’s Textbook of Dermatology, 9th ed.; Wiley-Blackwell: Chichester, UK, 2016; Volume 1–4. [Google Scholar]
  45. Singer, A.J.; Boyce, S.T. Burn Wound Healing and Tissue Engineering. J. Burn Care Res. 2017, 38, 605–613. [Google Scholar] [CrossRef]
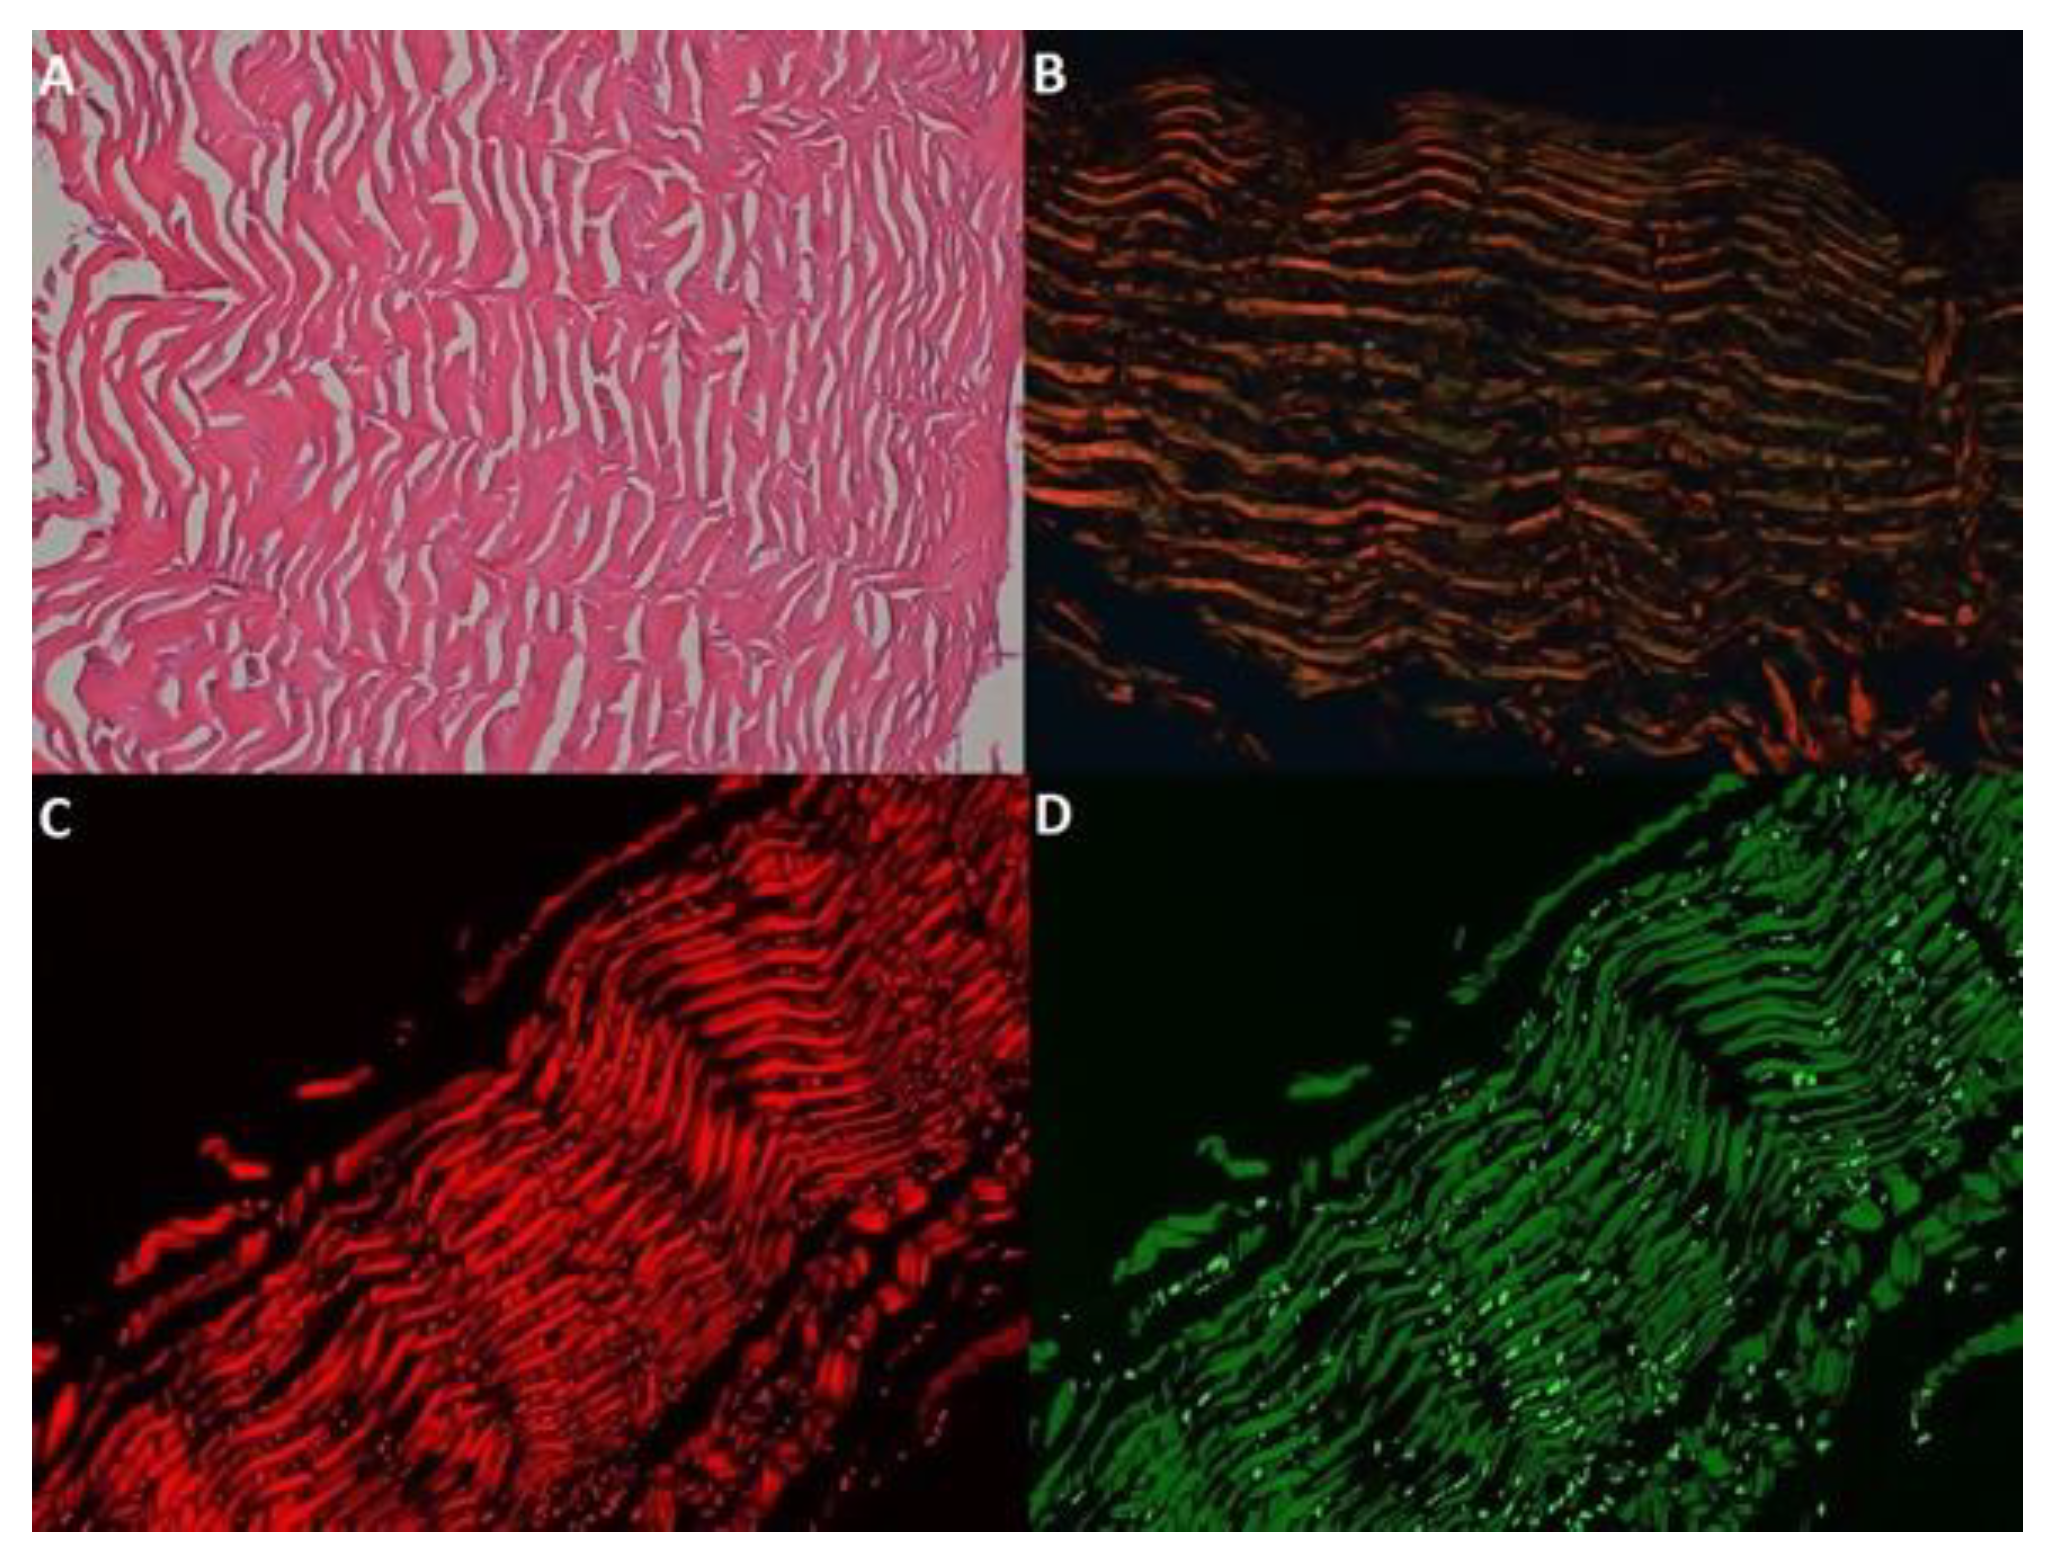
Figure 1. Multiple determination of the same skin sample. Photos represent the same sample in different histochemical coloring. (A) HE image. (B) Sirius red picrate image on polarized light microscopy. (C) RGB filtered image depicting collagen type I fibers. (D) RGB filtered image depicting collagen type III fibers.
Medicina 59 01002 g001
Figure 2. Visual comparison of the mean area of collagen type I from each type of fish.
Medicina 59 01002 g002
Figure 3. Visual comparison of the mean area of collagen type III from each type of fish.
Medicina 59 01002 g003
Figure 4. Visual comparison of the collagen type I/III ratio from each type of fish.
Medicina 59 01002 g004
Table 1. Steps of the sterilization process.
GroupsInterventionTime
1Fat and muscle scrapping and 0.9% saline wash (Natural state)N/A
22 × 2% Chlorhexidine baths +
Solution: 50% Glycerol–49% Saline (0.9%)
1% PMF (Penicillin + Metronidazole + Fluconazole solution) +
2 × 30 min
24 h at 4 °C
3Solution: 75% Glycerol–24% Saline (0.9%)
1% PMF +
3 h at 37 °C
4Solution: 99% Glycerol–1% PMF3 h at 37 °C
Table 2. Comparison of the mean area of collagen type I from each type of fish.
Sterilization(I) Type(J) TypeMean Difference (I–J)Std. ErrorSig.95% Confidence Interval for Difference
LowerUpper
NaturNiloticusMosambicus−106.683 *43.1540.017−193.547−19.818
50% GlycerolNiloticusMosambicus107.24368.4610.124−30.562245.048
75% GlycerolNiloticusMosambicus20.59199.0010.836−178.687219.869
99% GlycerolNiloticusMosambicus267.085 *112.2750.02241.087493.083
* The mean difference was significant at the 0.05 level. The unit of measure was µm2.
Table 3. Comparison of the mean area of collagen type I from each sterilization stage, within group.
TypeSterilization StageMean DifferenceStd. ErrorSig.95% Confidence Interval for Difference
Lower BoundUpper Bound
NiloticusNatur50% Glycerol−303.084 *43.812<0.001−391.273−214.894
75% Glycerol−246.303 *63.687<0.001−374.498−118.107
99% Glycerol−689.578 *71.680<0.001−833.862−545.294
50% Glycerol75% Glycerol56.78166.0350.394−76.141189.703
99% Glycerol−386.494 *77.439<0.001−542.371−230.618
75% Glycerol99% Glycerol−443.275 *87.093<0.001−618.584−267.967
MossambicusNatur50% Glycerol−89.15856.5620.122−203.01124.695
75% Glycerol−119.02982.2200.154−284.52946.471
99% Glycerol−315.810 *92.5380.001−502.080−129.540
50% Glycerol75% Glycerol−29.87185.2510.728−201.473141.731
99% Glycerol−226.652 *99.9730.028−427.887−25.416
75% Glycerol99% Glycerol−196.781112.4360.087−423.10329.542
* The mean difference was significant at the 0.05 level. The unit of measure was µm2.
Table 4. Comparison of the mean area of collagen type III from each type of fish.
Sterilization(I) Type(J) TypeMean Difference (I–J)Std. ErrorSig.95% Confidence Interval for Difference
LowerUpper
NaturNiloticusMosambicus−255.257 *30.623<0.001−316.899−193.616
50% GlycerolNiloticusMosambicus−106.039 *45.9420.026−198.515−13.563
75% GlycerolNiloticusMosambicus−109.035 *43.7770.016−197.153−20.917
99% GlycerolNiloticusMosambicus49.08444.8830.280−41.261139.428
* The mean difference was significant at the 0.05 level. The unit of measure was µm2.
Table 5. Comparison of the mean area of collagen type III from each sterilization stage, within group.
TypeSterilization StageMean DifferenceStd. ErrorSig.95% Confidence Interval for Difference
Lower BoundUpper Bound
NiloticusNatur50% Glycerol−100.379 *28.4070.001−157.559−43.199
75% Glycerol−160.451 *34.668<0.001−230.233−90.669
99% Glycerol−179.153 *33.035<0.001−245.648−112.657
50% Glycerol75% Glycerol−60.07231.7750.065−124.0323.887
99% Glycerol−78.774 *27.4960.006−134.121−23.427
75% Glycerol99% Glycerol−18.70223.3470.427−65.69728.293
MossambicusNatur50% Glycerol48.84036.6730.190−24.979122.659
75% Glycerol−14.22944.7560.752−104.31775.860
99% Glycerol125.188 *42.6480.00539.343211.033
50% Glycerol75% Glycerol−63.06941.0210.131−145.64019.503
99% Glycerol76.348 *35.4970.0374.896147.801
75% Glycerol99% Glycerol139.417*30.141<0.00178.747200.087
* The mean difference was significant at the 0.05 level. The unit of measure was µm2.
Table 6. Comparison of the collagen type I/III ratio from each type of fish.
Sterilization(I) Type(J) TypeMean Difference (I–J)Std. ErrorSig.95% Confidence Interval for Difference
LowerUpper
NaturNiloticusMosambicus0.280 *0.066<0.0010.1470.412
50% GlycerolNiloticusMosambicus0.394 *0.088<0.0010.2170.571
75% GlycerolNiloticusMosambicus0.2210.1100.0500.0000.443
99% GlycerolNiloticusMosambicus0.1980.1680.244−0.1400.535
* The mean difference was significant at the 0.05 level. The unit of measure was µm2.
Table 7. Comparison of the mean area of collagen type III from each sterilization stage, within group.
TypeSterilization StageMean DifferenceStd. ErrorSig.95% Confidence Interval for Difference
Lower BoundUpper Bound
NiloticusNatur50% Glycerol−0.297 *0.072<0.001−0.441−0.153
75% Glycerol−0.0490.0690.480−0.1890.090
99% Glycerol−0.646 *0.115<0.001−0.877−0.415
50% Glycerol75% Glycerol0.248 *0.0870.0060.0730.422
99% Glycerol−0.349 *0.1120.003−0.575−0.123
75% Glycerol99% Glycerol−0.597 *0.122<0.001−0.842−0.351
MossambicusNatur50% Glycerol−0.1820.0920.054−0.3680.003
75% Glycerol−0.1080.0890.234−0.2880.072
99% Glycerol−0.728 *0.148<0.001−1.026−0.429
50% Glycerol75% Glycerol0.0750.1120.508−0.1510.300
99% Glycerol−0.545 *0.145<0.001−0.837−0.253
75% Glycerol99% Glycerol−0.620 *0.157<0.001−0.937−0.303
* The mean difference was significant at the 0.05 level. The unit of measure was µm2.
Disclaimer/Publisher’s Note: The statements, opinions and data contained in all publications are solely those of the individual author(s) and contributor(s) and not of MDPI and/or the editor(s). MDPI and/or the editor(s) disclaim responsibility for any injury to people or property resulting from any ideas, methods, instructions or products referred to in the content.