
Nano-Motion Analysis for Rapid and Label Free Assessing of Cancer Cell Sensitivity to Chemotherapeutics


 , , ,
, , ,  and
and
Abstract
1. Introduction
2. Materials and Methods
2.1. Drugs and Chemicals
2.2. Cells and Cell Culture
2.3. Assessment of Cell Proliferation in Real-Time
2.4. Nanomotion Sensor Preparation
2.5. Experimental Procedure
2.6. Statistical Analysis
3. Results and Discussion
4. Conclusions
5. Patents
Author Contributions
Funding
Institutional Review Board Statement
Informed Consent Statement
Data Availability Statement
Acknowledgments
Conflicts of Interest
References
- Sung, H.; Ferlay, J.; Siegel, R.L.; Laversanne, M.; Soerjomataram, I.; Jemal, A.; Bray, F. Global cancer statistics 2020: GLOBOCAN estimates of incidence and mortality worldwide for 36 cancers in 185 countries. CA Cancer J. Clin. 2021. [Google Scholar] [CrossRef]
- Hawkes, N. Drug resistance: The next target for cancer treatment. BMJ 2019, 365, 12228. [Google Scholar] [CrossRef]
- Korentzelos, D.; Clark, A.M.; Wells, A.A. Perspective on Therapeutic Pan-Resistance in Metastatic Cancer. Int. J. Mol. Sci. 2020, 21, 7304. [Google Scholar] [CrossRef] [PubMed]
- Muriithi, W.; Macharia, L.W.; Heming, C.P.; Echevarria, J.L.; Nyachieo, A.; Filho, P.N.; Neto, V.M. ABC transporters and the hallmarks of cancer: Roles in cancer aggressiveness beyond multidrug resistance. Cancer Biol. Med. 2020, 17, 253–269. [Google Scholar] [CrossRef] [PubMed]
- Robinson, K.; Tiriveedhi, V. Perplexing Role of P-Glycoprotein in Tumor Microenvironment. Front. Oncol. 2020, 10, 265. [Google Scholar] [CrossRef]
- Gambardella, V.; Tarazona, N.; Cejalvo, J.M.; Lombardi, P.; Huerta, M.; Rosello, S.; Fleitas, T.; Roda, D.; Cervantes, A. Personalized Medicine: Recent Progress in Cancer Therapy. Cancers 2020, 12, 1009. [Google Scholar] [CrossRef] [PubMed]
- Lodhi, N.; Tun, M.; Nagpal, P.; Inamdar, A.A.; Ayoub, N.M.; Siyam, N.; Oton-Gonzalez, L.; Gerona, A.; Morris, D.; Sandhu, R.; et al. Biomarkers and novel therapeutic approaches for diffuse large B-cell lymphoma in the era of precision medicine. Oncotarget 2020, 11, 4045–4073. [Google Scholar] [CrossRef] [PubMed]
- Nagle, P.W.; Plukker, J.T.M.; Muijs, C.T.; van Luijk, P.; Coppes, R.P. Patient-derived tumor organoids for prediction of cancer treatment response. Semin. Cancer Biol. 2018, 53, 258–264. [Google Scholar] [CrossRef] [PubMed]
- Alonso-Sarduy, L.; Roduit, C.; Dietler, G.; Kasas, S. Human topoisomerase II-DNA interaction study by using atomic force microscopy. FEBS Lett. 2011, 585, 3139–3145. [Google Scholar] [CrossRef]
- Longo, G.; Alonso-Sarduy, L.; Rio, L.M.; Bizzini, A.; Trampuz, A.; Notz, J.; Dietler, G.; Kasas, S. Rapid detection of bacterial resistance to antibiotics using AFM cantilevers as nanomechanical sensors. Nat. Nanotechnol. 2013, 8, 522–526. [Google Scholar] [CrossRef]
- Kasas, S.; Ruggeri, F.S.; Benadiba, C.; Maillard, C.; Stupar, P.; Tournu, H.; Dietler, G.; Longo, G. Detecting nanoscale vibrations as signature of life. Proc. Natl. Acad. Sci. USA 2015, 112, 378–381. [Google Scholar] [CrossRef] [PubMed]
- Kasas, S.; Stupar, P.; Longo, G.; Dietler, G. Detecting life thanks to the atomic force microscope. Med. Sci. (Paris) 2015, 31, 369–371. [Google Scholar] [CrossRef] [PubMed][Green Version]
- Wu, S.; Liu, X.; Zhou, X.; Liang, X.M.; Gao, D.; Liu, H.; Zhao, G.; Zhang, Q.; Wu, X. Quantification of cell viability and rapid screening anti-cancer drug utilizing nanomechanical fluctuation. Biosens. Bioelectron. 2016, 77, 164–173. [Google Scholar] [CrossRef] [PubMed]
- Pesic, M.; Markovic, J.Z.; Jankovic, D.; Kanazir, S.; Markovic, I.D.; Rakic, L.; Ruzdijic, S. Induced resistance in the human non small cell lung carcinoma (NCI-H460) cell line in vitro by anticancer drugs. J. Chemother. 2006, 18, 66–73. [Google Scholar] [CrossRef]
- Podolski-Renic, A.; Andelkovic, T.; Bankovic, J.; Tanic, N.; Ruzdijic, S.; Pesic, M. The role of paclitaxel in the development and treatment of multidrug resistant cancer cell lines. Biomed. Pharm. 2011, 65, 345–353. [Google Scholar] [CrossRef]
- Kasas, S.; Radotic, K.; Longo, G.; Saha, B.; Alonso-Sarduy, L.; Dietler, G.; Roduit, C. A universal fluid cell for the imaging of biological specimens in the atomic force microscope. Microsc. Res. Tech. 2013, 76, 357–363. [Google Scholar] [CrossRef]
- Helenius, J.; Heisenberg, C.P.; Gaub, H.E.; Muller, D.J. Single-cell force spectroscopy. J. Cell Sci. 2008, 121, 1785–1791. [Google Scholar] [CrossRef]
- El-Kirat-Chatel, S.; Dufrene, Y.F. Nanoscale imaging of the Candida-macrophage interaction using correlated fluorescence-atomic force microscopy. ACS Nano 2012, 6, 10792–10799. [Google Scholar] [CrossRef] [PubMed]
- Xie, L.; Sun, Z.; Hong, Z.; Brown, N.J.; Glinskii, O.V.; Rittenhouse-Olson, K.; Meininger, G.A.; Glinsky, V.V. Temporal and molecular dynamics of human metastatic breast carcinoma cell adhesive interactions with human bone marrow endothelium analyzed by single-cell force spectroscopy. PLoS ONE 2018, 13, e0204418. [Google Scholar] [CrossRef]
- Juan-Carlos, P.M.; Perla-Lidia, P.P.; Stephanie-Talia, M.M.; Monica-Griselda, A.M.; Luz-Maria, T.E. ABC transporter superfamily. An updated overview, relevance in cancer multidrug resistance and perspectives with personalized medicine. Mol. Biol. Rep. 2021, 48, 1883–1901. [Google Scholar] [CrossRef]
- Kodan, A.; Futamata, R.; Kimura, Y.; Kioka, N.; Nakatsu, T.; Kato, H.; Ueda, K. ABCB1/MDR1/P-gp employs an ATP-dependent twist-and-squeeze mechanism to export hydrophobic drugs. FEBS Lett. 2021, 595, 707–716. [Google Scholar] [CrossRef] [PubMed]
- Kohler, A.C.; Venturelli, L.; Longo, G.; Dietler, G.; Kasas, S. Nanomotion detection based on atomic force microscopy cantilevers. Cell Surf. 2019, 5, 100021. [Google Scholar] [CrossRef] [PubMed]
- Venturelli, L.; Kohler, A.C.; Stupar, P.; Villalba, M.I.; Kalauzi, A.; Radotic, K.; Bertacchi, M.; Dinarelli, S.; Girasole, M.; Pesic, M.; et al. A perspective view on the nanomotion detection of living organisms and its features. J. Mol. Recognit. 2020, 33, e2849. [Google Scholar] [CrossRef]
- Santangelo, R.; Rizzarelli, E.; Copani, A. Role for Metallothionein-3 in the Resistance of Human U87 Glioblastoma Cells to Temozolomide. ACS Omega 2020, 5, 17900–17907. [Google Scholar] [CrossRef]
- Mollaei, M.; Hassan, Z.M.; Khorshidi, F.; Langroudi, L. Chemotherapeutic drugs: Cell death- and resistance-related signaling pathways. Are they really as smart as the tumor cells? Transl. Oncol. 2021, 14, 101056. [Google Scholar] [CrossRef] [PubMed]
- Prokhorova, E.A.; Egorshina, A.Y.; Zhivotovsky, B.; Kopeina, G.S. The DNA-damage response and nuclear events as regulators of nonapoptotic forms of cell death. Oncogene 2020, 39, 1–16. [Google Scholar] [CrossRef] [PubMed]


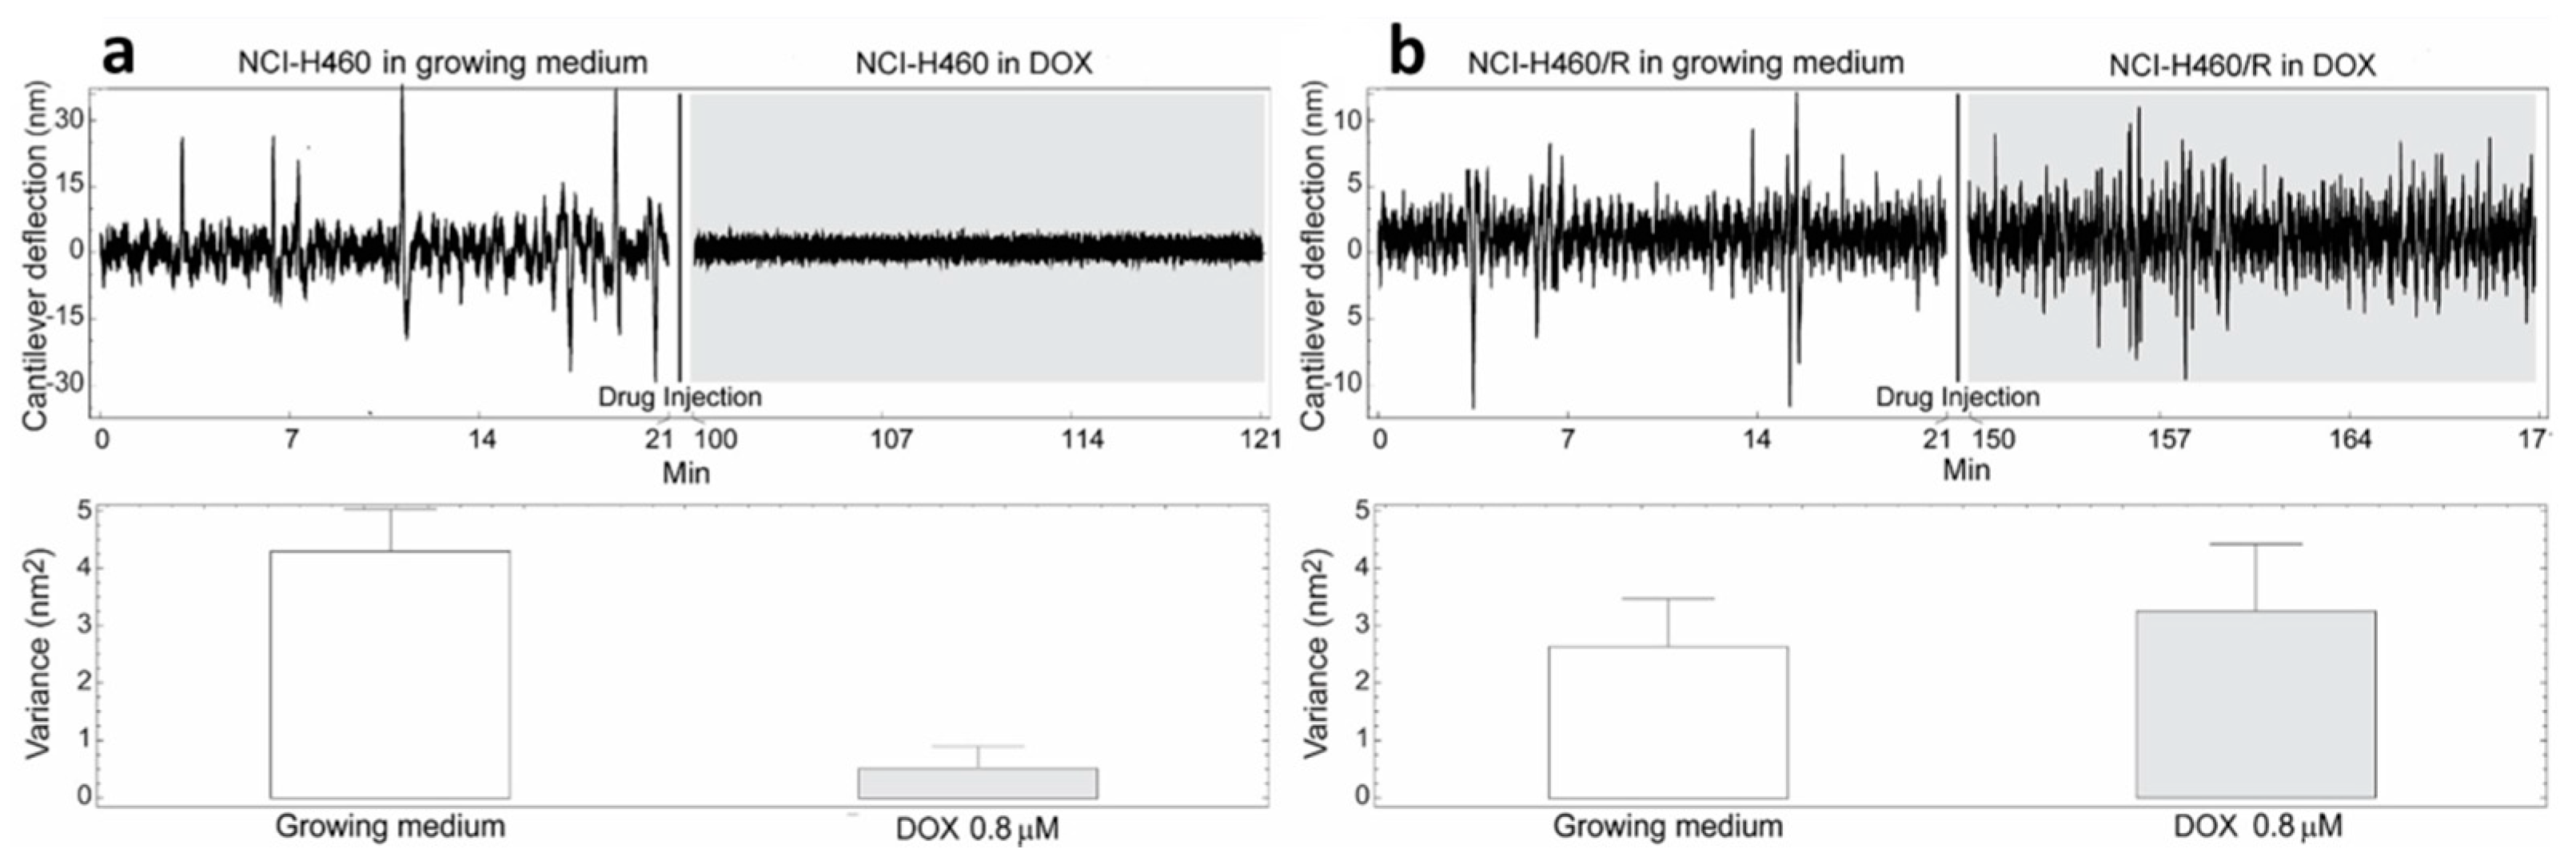
| NCI-H460 | NCI-H460/R | |||||
|---|---|---|---|---|---|---|
| Growing medium | DOX 0.8µM | % Reduction | Growing medium | DOX 0.8 µM | % Increase | |
| Variance (nm2) | 4.31 | 0.50 | 0.88 | 2.62 | 3.25 | 0.19 |
| Error bar | 0.69 | 0.35 | 0.88 | 1.19 | ||
| ** p = 0.0010 | p > 0.50 | |||||
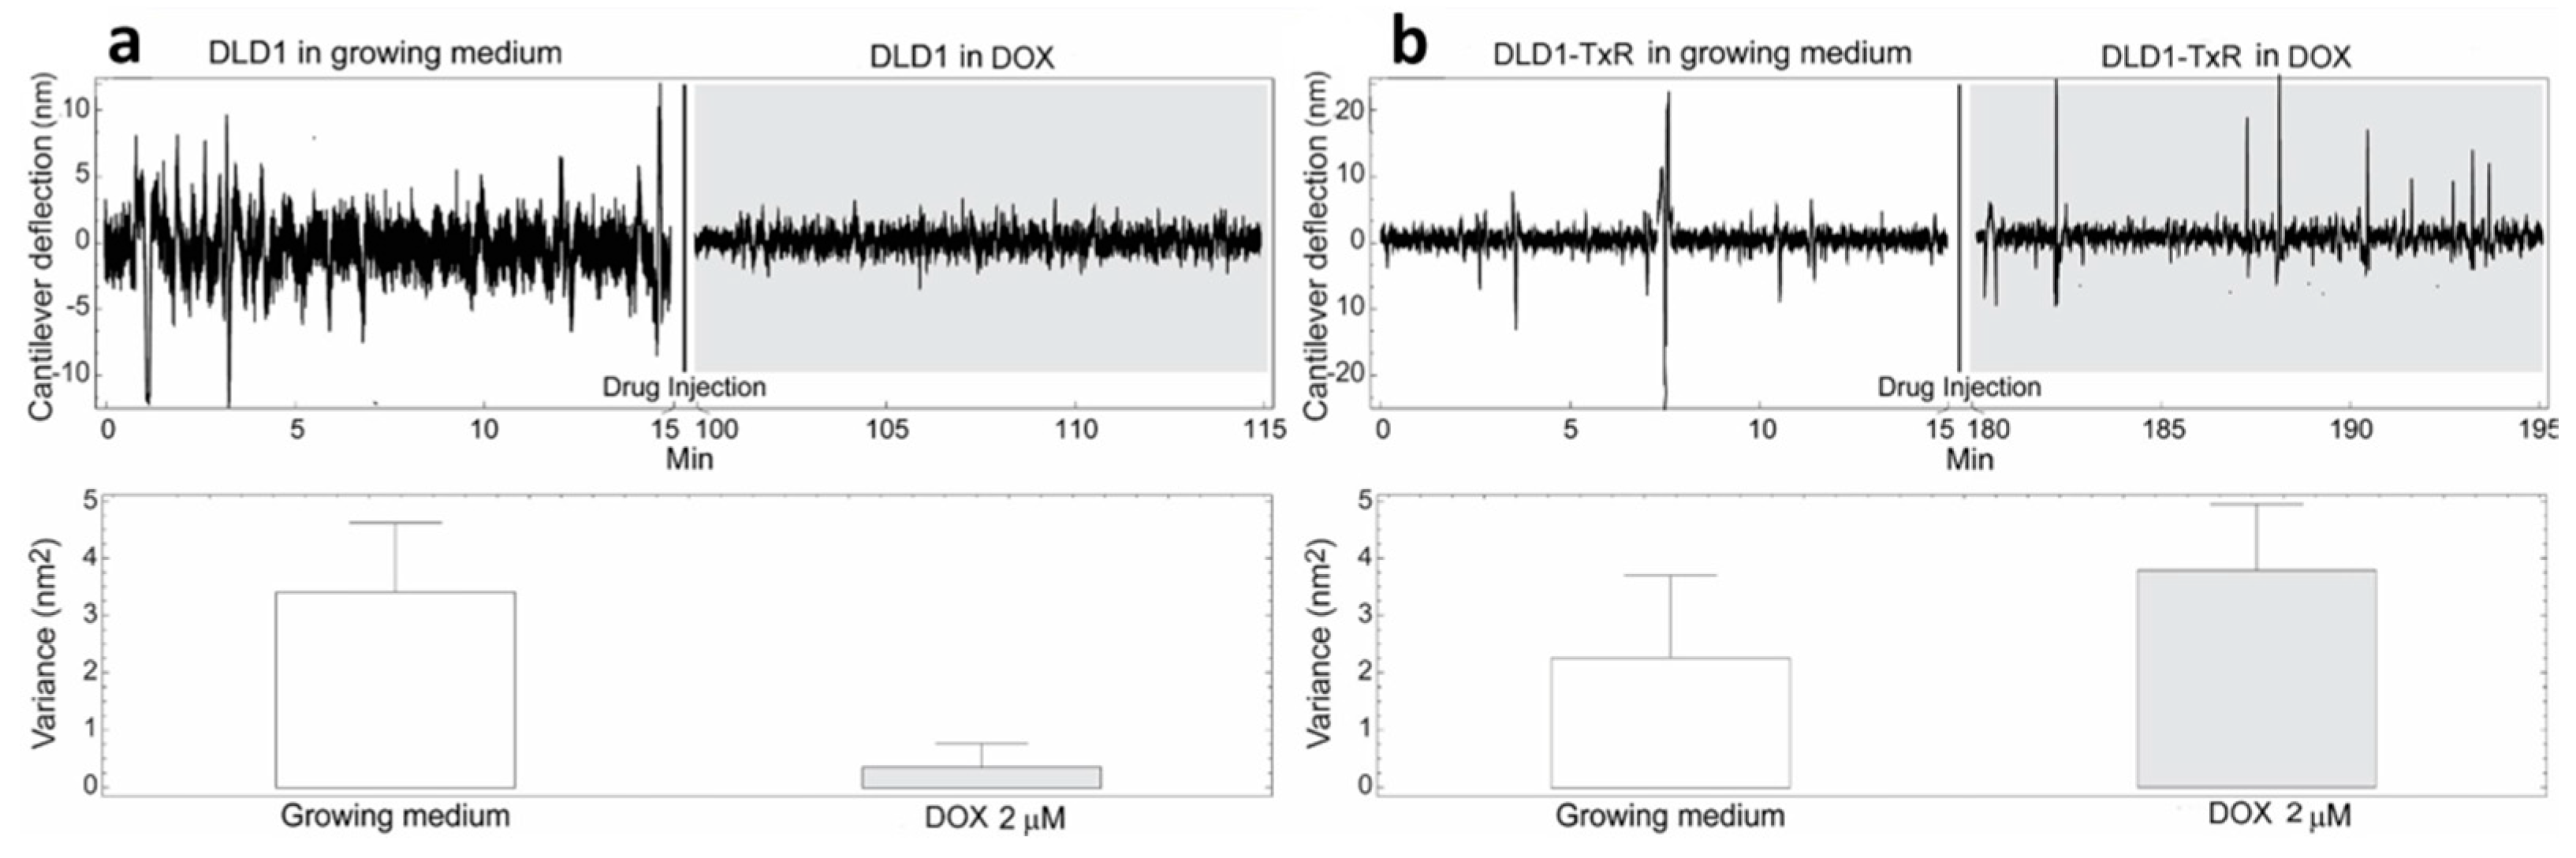
| DLD1 | DLD1-TxR | |||||
| Growing medium | DOX 2µM | % Reduction | Growing medium | DOX 2µM | % Increase | |
| Variance (nm2) | 3.40 | 0.37 | 0.89 | 2.25 | 3.75 | 0.40 |
| Error bar | 1.22 | 0.38 | 1.47 | 1.25 | ||
| * p = 0.0177 | p > 0.05 | |||||
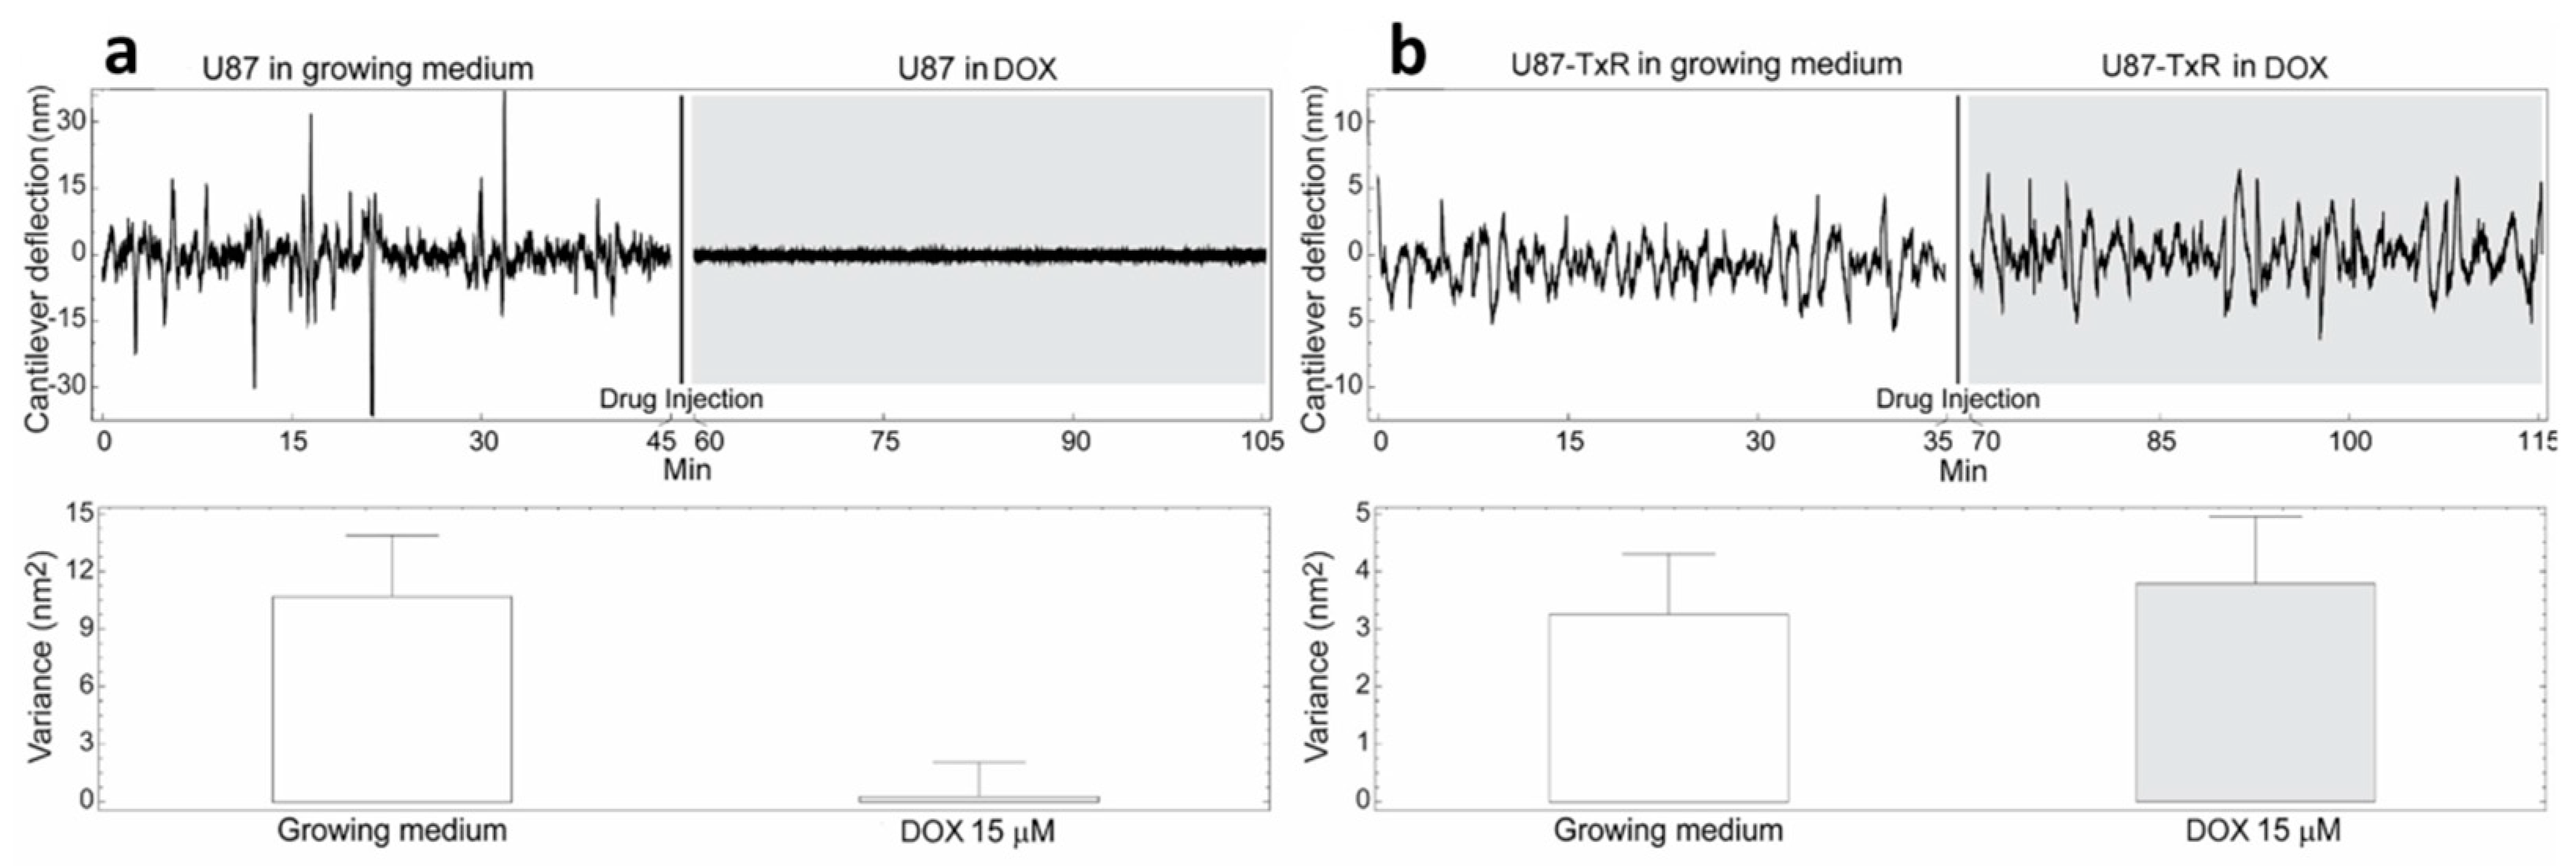
| U87 | U87-TxR | |||||
| Growing medium | DOX 15µM | % Reduction | Growing medium | DOX 15µM | % Increase | |
| Variance (nm2) | 10.65 | 0.35 | 0.97 | 3.25 | 3.75 | 0.13 |
| Error bar | 3.22 | 1.52 | 1.05 | 1.25 | ||
| ** p = 0.0074 | p > 0.05 | |||||
Publisher’s Note: MDPI stays neutral with regard to jurisdictional claims in published maps and institutional affiliations. |
© 2021 by the authors. Licensee MDPI, Basel, Switzerland. This article is an open access article distributed under the terms and conditions of the Creative Commons Attribution (CC BY) license (https://creativecommons.org/licenses/by/4.0/).
Share and Cite
Stupar, P.; Podolski-Renić, A.; Villalba, M.I.; Dragoj, M.; Jovanović Stojanov, S.; Pešić, M.; Kasas, S. Nano-Motion Analysis for Rapid and Label Free Assessing of Cancer Cell Sensitivity to Chemotherapeutics. Medicina 2021, 57, 446. https://doi.org/10.3390/medicina57050446
Stupar P, Podolski-Renić A, Villalba MI, Dragoj M, Jovanović Stojanov S, Pešić M, Kasas S. Nano-Motion Analysis for Rapid and Label Free Assessing of Cancer Cell Sensitivity to Chemotherapeutics. Medicina. 2021; 57(5):446. https://doi.org/10.3390/medicina57050446
Chicago/Turabian StyleStupar, Petar, Ana Podolski-Renić, Maria Ines Villalba, Miodrag Dragoj, Sofija Jovanović Stojanov, Milica Pešić, and Sandor Kasas. 2021. "Nano-Motion Analysis for Rapid and Label Free Assessing of Cancer Cell Sensitivity to Chemotherapeutics" Medicina 57, no. 5: 446. https://doi.org/10.3390/medicina57050446
APA StyleStupar, P., Podolski-Renić, A., Villalba, M. I., Dragoj, M., Jovanović Stojanov, S., Pešić, M., & Kasas, S. (2021). Nano-Motion Analysis for Rapid and Label Free Assessing of Cancer Cell Sensitivity to Chemotherapeutics. Medicina, 57(5), 446. https://doi.org/10.3390/medicina57050446