Article

Vitamin D Enhanced the Osteogenic Differentiation of Cell Spheroids Composed of Bone Marrow Stem Cells

1
Department of Periodontics, College of Medicine, The Catholic University of Korea, Seoul 06591, Korea
2
Guidance Dental, Buena Park, CA 90621, USA
3
Ebiogen, #405, Sungsu A1 Center 48 Ttukseom-ro 17-ga-gil, Seongdong-gu, Seoul 04785, Korea
*
Author to whom correspondence should be addressed.
Hyun-Jin Lee and Young-Min Song contributed equally.
Medicina 2021, 57(11), 1271; https://doi.org/10.3390/medicina57111271
Submission received: 24 October 2021 / Revised: 14 November 2021 / Accepted: 16 November 2021 / Published: 19 November 2021
(This article belongs to the Special Issue Recent Advances in Periodontics and Dental Implantology)

Abstract

:
Background and Objectives: Vitamin D is a bone modulator widely used in regenerative medicine. This study aimed to analyze the effects of vitamin D on the osteogenic differentiation and mineralization of human mesenchymal stem cells. Materials and Methods: Spheroids were fabricated using human bone marrow-derived stem cells, and were cultured in the presence of vitamin D at concentrations of 0, 0.1, 1, 10, and 100 nM. Stem cell spheroids were fabricated and the morphological evaluation was conducted on days 1, 3, 7 and 14. Determination of qualitative cellular viability was performed with Live/Dead Kit assay on days 1 and 7. Quantitative cellular viability was evaluated with Cell Counting Kit-8 on days 1, 3, 7, and 14. To analyze the osteogenic differentiation of cell spheroids, alkaline phosphatase activity assays were performed with commercially available kit on days 7 and 14. Real-time polymerase chain reaction was used to determine the expression levels of RUNX2, BSP, OCN, and COL1A1 on days 7 and 14. Results: The stem cells produced well-formed spheroids, and addition of vitamin D did not result in any noticeable changes in the shape. The addition of vitamin D did not significantly change the diameter of the spheroids at 0, 0.1, 1, 10, or 100 nM concentrations. Quantitative cell viability results from days 1, 3, 7 and 14 showed no significant difference between groups (p > 0.05). There was significantly higher alkaline phosphatase activity in the 0.1 nM group when compared with the control group on day 14 (p < 0.05). Real-time polymerase chain reaction results demonstrated that the mRNA expression levels of RUNX2, OCN, and COL1A1 were significantly increased when vitamin D was added to the culture. Conclusions: Based on these findings, we concluded that vitamin D could be applied to the increased osteogenicity of stem cell spheroids.

1. Introduction

Vitamin D is a bone modulator widely used in regenerative medicine [1]. Vitamin D also regulates both innate and adaptive immunity, modulates inflammatory cytokine production and blocks antigen-presenting dendritic cell maturation [2]. Several studies described vitamin D’s utility to enhance osteogenesis in primary murine osteoblasts and MC3T3-E1 cell lines [3,4,5]. Replenishing the cell culture medium containing vitamin D induces osteocalcin expression in osteoblasts [6]. Addition of both vitamin D and osteogenic factors resulted in an osteoblast phenotype which expresses alkaline phosphatase activity, secretes osteocalcin, and deposits calcium [6]. Mechanical testing showed that vitamin D induced a stiffer osteosphere compared with control [7]. Vitamin D enhanced cell responses of osteoblasts on the titanium surfaces [8]. Vitamin D is reported to act on osteoblasts through vitamin D receptors and membrane-binding protein [9]. Low dietary intake of vitamin D is reported to be negatively associated with fracture risk [7].
Mesenchymal stem cells may be ideal for tissue regeneration because they are highly prolific and have the potential for differentiation into different type of cells [10]. Mesenchymal stem cells can be isolated from a variety of tissues and organs, including bone, fat, periosteums, skeletal muscles and peripheral blood [11]. The aggregation of mesenchymal stem cells into multicellular spheroids resulted in an increase in therapeutic capacity by improving the survival of the stem cells, stemness, angiogenic and anti-inflammatory properties [12]. This method has been proposed as a promising strategy for stem cell therapy [13]. The effects of growth factors on cell survival and osteogenic differentiation of stem cell spheroids have been previously tested, which is of great interest to researchers and clinicians [14]. Short peptides have been reported to play an important role in biological information transfer, transcriptional regulation, and recovery of age-related genetic changes, and some short peptides are reported to promote differentiation of human periodontal ligament stem cells [15]. Platelet-rich fibrin enhances the osteogenic differentiation of human mesenchymal stem cells, and application of platelet-rich fibrin resulted in significant improvements in clinical and radiographic parameters [16,17]. This study aimed to analyze the effects of vitamin D on the osteogenic differentiation and mineralization of cell spheroids composed of human mesenchymal stem cells.

2. Materials and Methods

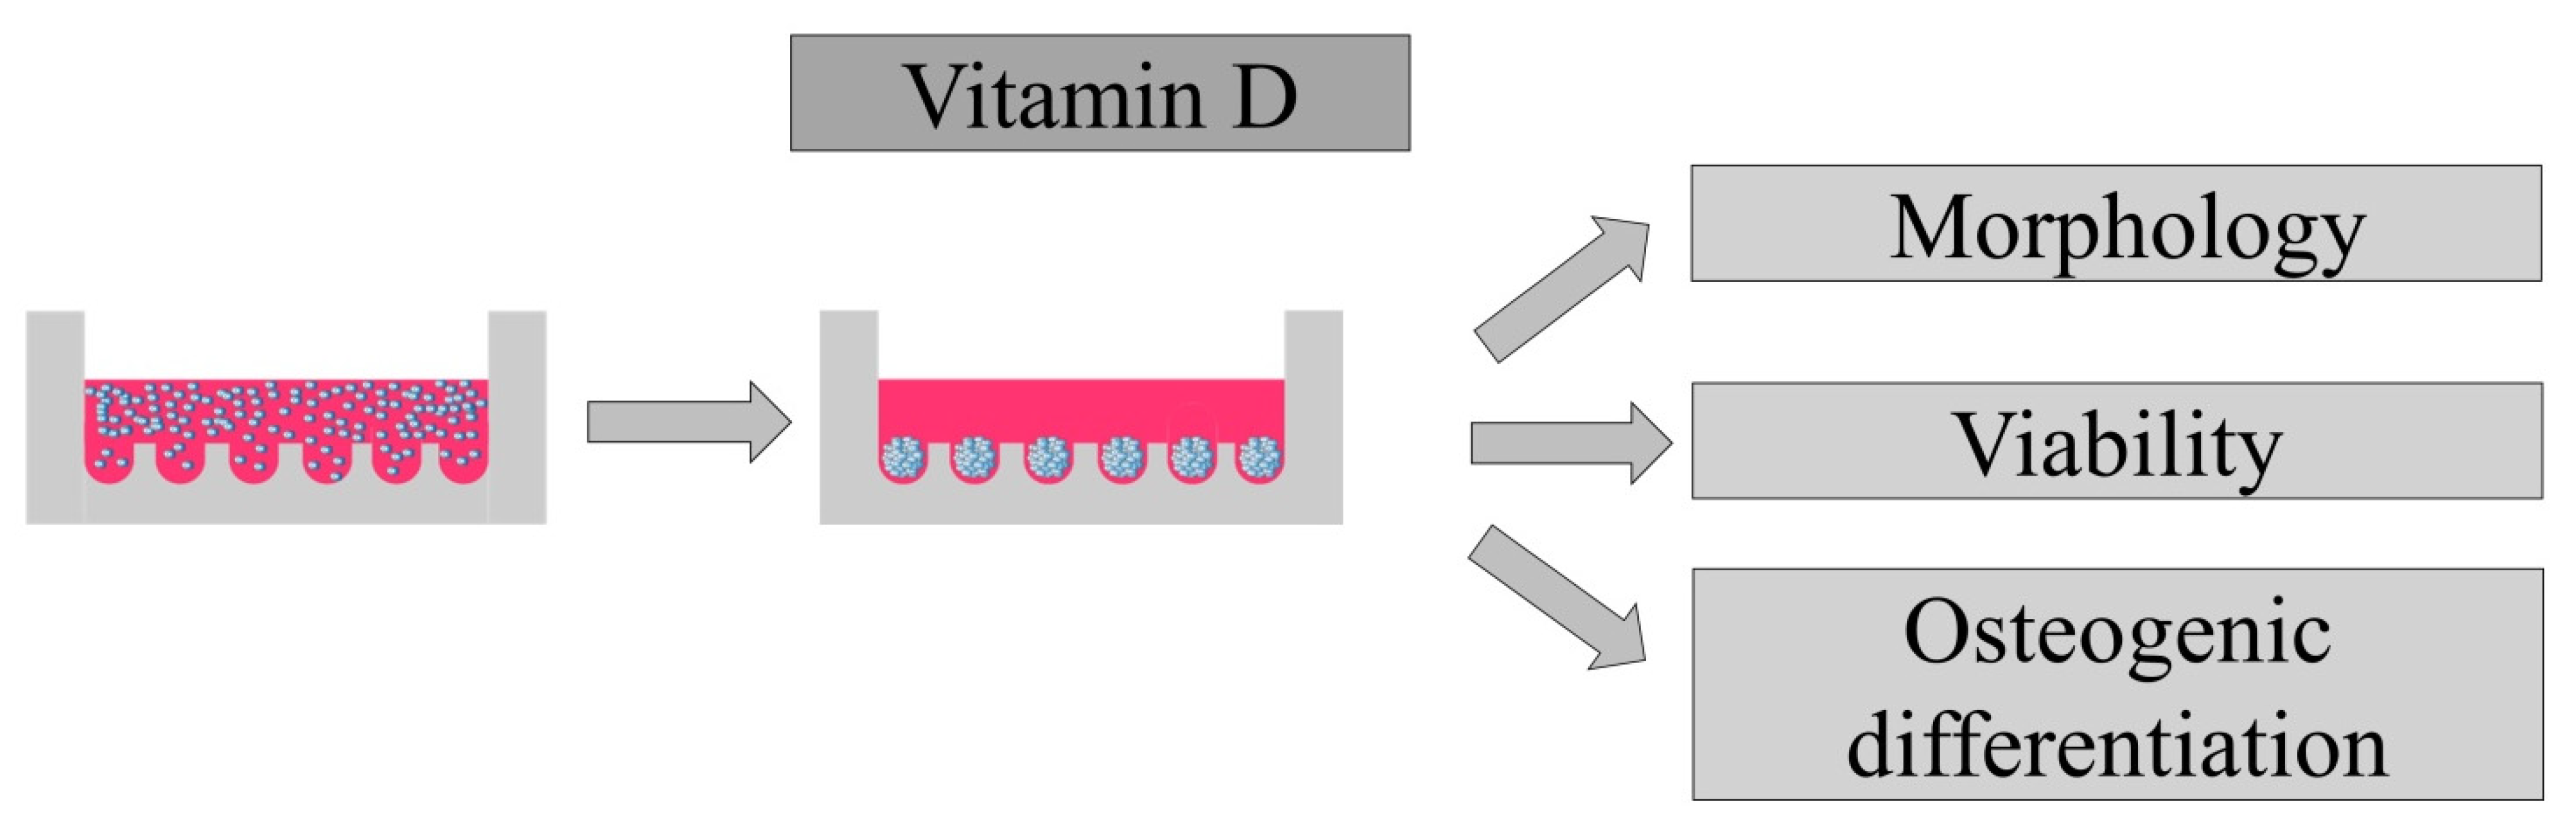
2.1. Design of the Present Study

Figure 1 provides an overview of the current study design. This research protocol has been reviewed and approved by the Institutional Review Board (KC21SASE0225, Approval date: 6 April 2021). We obtained prior consent from the participant. The culture media were changed every two to three days. The cells were grown in an incubator at 37 °C with 95% air and 5% CO2.

2.2. Fabrication of Stem Cell Spheroids

Human bone marrow-derived mesenchymal stem cells from a male participant (Catholic MASTER Cells) were obtained from the Catholic Institute of Cell Therapy (CIC, Seoul, South Korea) [18]. Stem cells were plated onto silicon elastomer-based concave microwells (StemFIT 3D; MicroFIT, Seongnam-si, Gyeonggi-do, Korea) of 600 µm diameter at a density of 1 × 10⁶ cells/well and cultured in osteogenic media [19]. The medium was replaced with fresh media every two to three day. The final concentrations of vitamin D (1α,25-Dihydroxyvitamin D3; D1530-10UG, Sigma-Aldrich, St. Louis, MO, USA) were 0, 0.1, 1, 10, and 100 nM, respectively. The morphological evaluation was carried out on days 1, 3, 7, and 14 using an inverted microscope (CKX41SF, Olympus Corporation, Tokyo, Japan).

2.3. Determination of Qualitative and Quantitative Cell Viability

The qualitative cell viability of cell spheroids cultured in osteogenic media was evaluated with Live/Dead Kit assay (Molecular Probes, Eugene, OR, USA) on days 1 and 7 [20]. These spheroids were incubated at room temperature for 60 min and were observed at ×100 magnification using a confocal laser scanning microscope (LSM800, Carl Zeiss, Germany). Quantitative cell viability test was conducted using Cell Counting Kit-8 (Dojindo, Tokyo, Japan) on days 1, 3, 7, and 14 [21].

2.4. Evaluation of Alkaline Phosphatase Activity

Alkaline phosphatase activity levels were used to evaluate osteogenic differentiation using commercially available kit (K412-500, BioVision, Inc., Milpitas, CA, USA) on days 7 and 14 [22]. The absorbance at 405 nm were measured after mixing substrate with cell lysates after incubating for 30 min at 37 °C [21].

2.5. Total RNA Extraction and Quantification of RUNX2, BSP, OCN and COL1A1 mRNA by Real-Time Quantitative Polymerase Chain Reaction (qPCR)

Total RNA extraction was performed using a commercially available kit (Thermo Fisher Scientific, Inc., Waltham, MA, USA), according to the manufacturer’s instructions [23]. The quality of RNA was evaluated with a bioanalyzer (Agilent 2100) using a kit (RNA 6000 Nano Chip; Agilent Technologies, Santa Clara, CA, USA), and RNA quantity was evaluated with the ratio of absorbance at 260 nm and 280 nm using a spectrophotometer (ND-2000, Thermo Fisher Scientific, Inc.). RNA was used as reverse transcription template applying reverse transcriptase (SuperScript II; Invitrogen, Carlsbad, CA, USA).
mRNA expression was detected by qPCR on days 7 and 14. We used GenBank to design the sense and antisense primers for PCR. The primer sequences were as follows: RUNX2 (accession No.: NM_001015051.3; forward: 5′-CAGTTCCCAAGCATTTCATCC-3′, reverse: 5′-AGGTGGCTGGATAGTGCATT-3′), BSP (accession No.: NM_004967.4; forward: 5′-CCTCTCCAAATGGTGGGTTT-3′, reverse: 5′-ATTCAACGGTGGTGGTTTTC-3′), OCN (accession No.: NM_199173.6; forward 5′-GGTGCAGAGTCCAGCAAAGG-3′, reverse: 5′-GCGCCTGGGTCTCTTCACTA-3′), COL1A1 (accession No.: NM_000088.4; forward: 5′-TACCCCACTCAGCCCAGTGT-3′, reverse: 5′-CCGAACCAGACATGCCTCTT-3′), and β-actin (accession. No.: NM 001101: forward: 5′-AATGCTTCTAGGCGGACTATGA-3′, reverse: 5′-TTTCTGCGCAAGTTAGGTTTT-3′) [24,25].

2.6. Statistical Analysis

All values are presented as mean ± standard deviation. Tests of normality and equality of variances were conducted. Comparisons between the groups were performed by one-way analysis of variance with Tukey’s post hot test. Three technical replicates were evaluated for each analysis.

3. Results

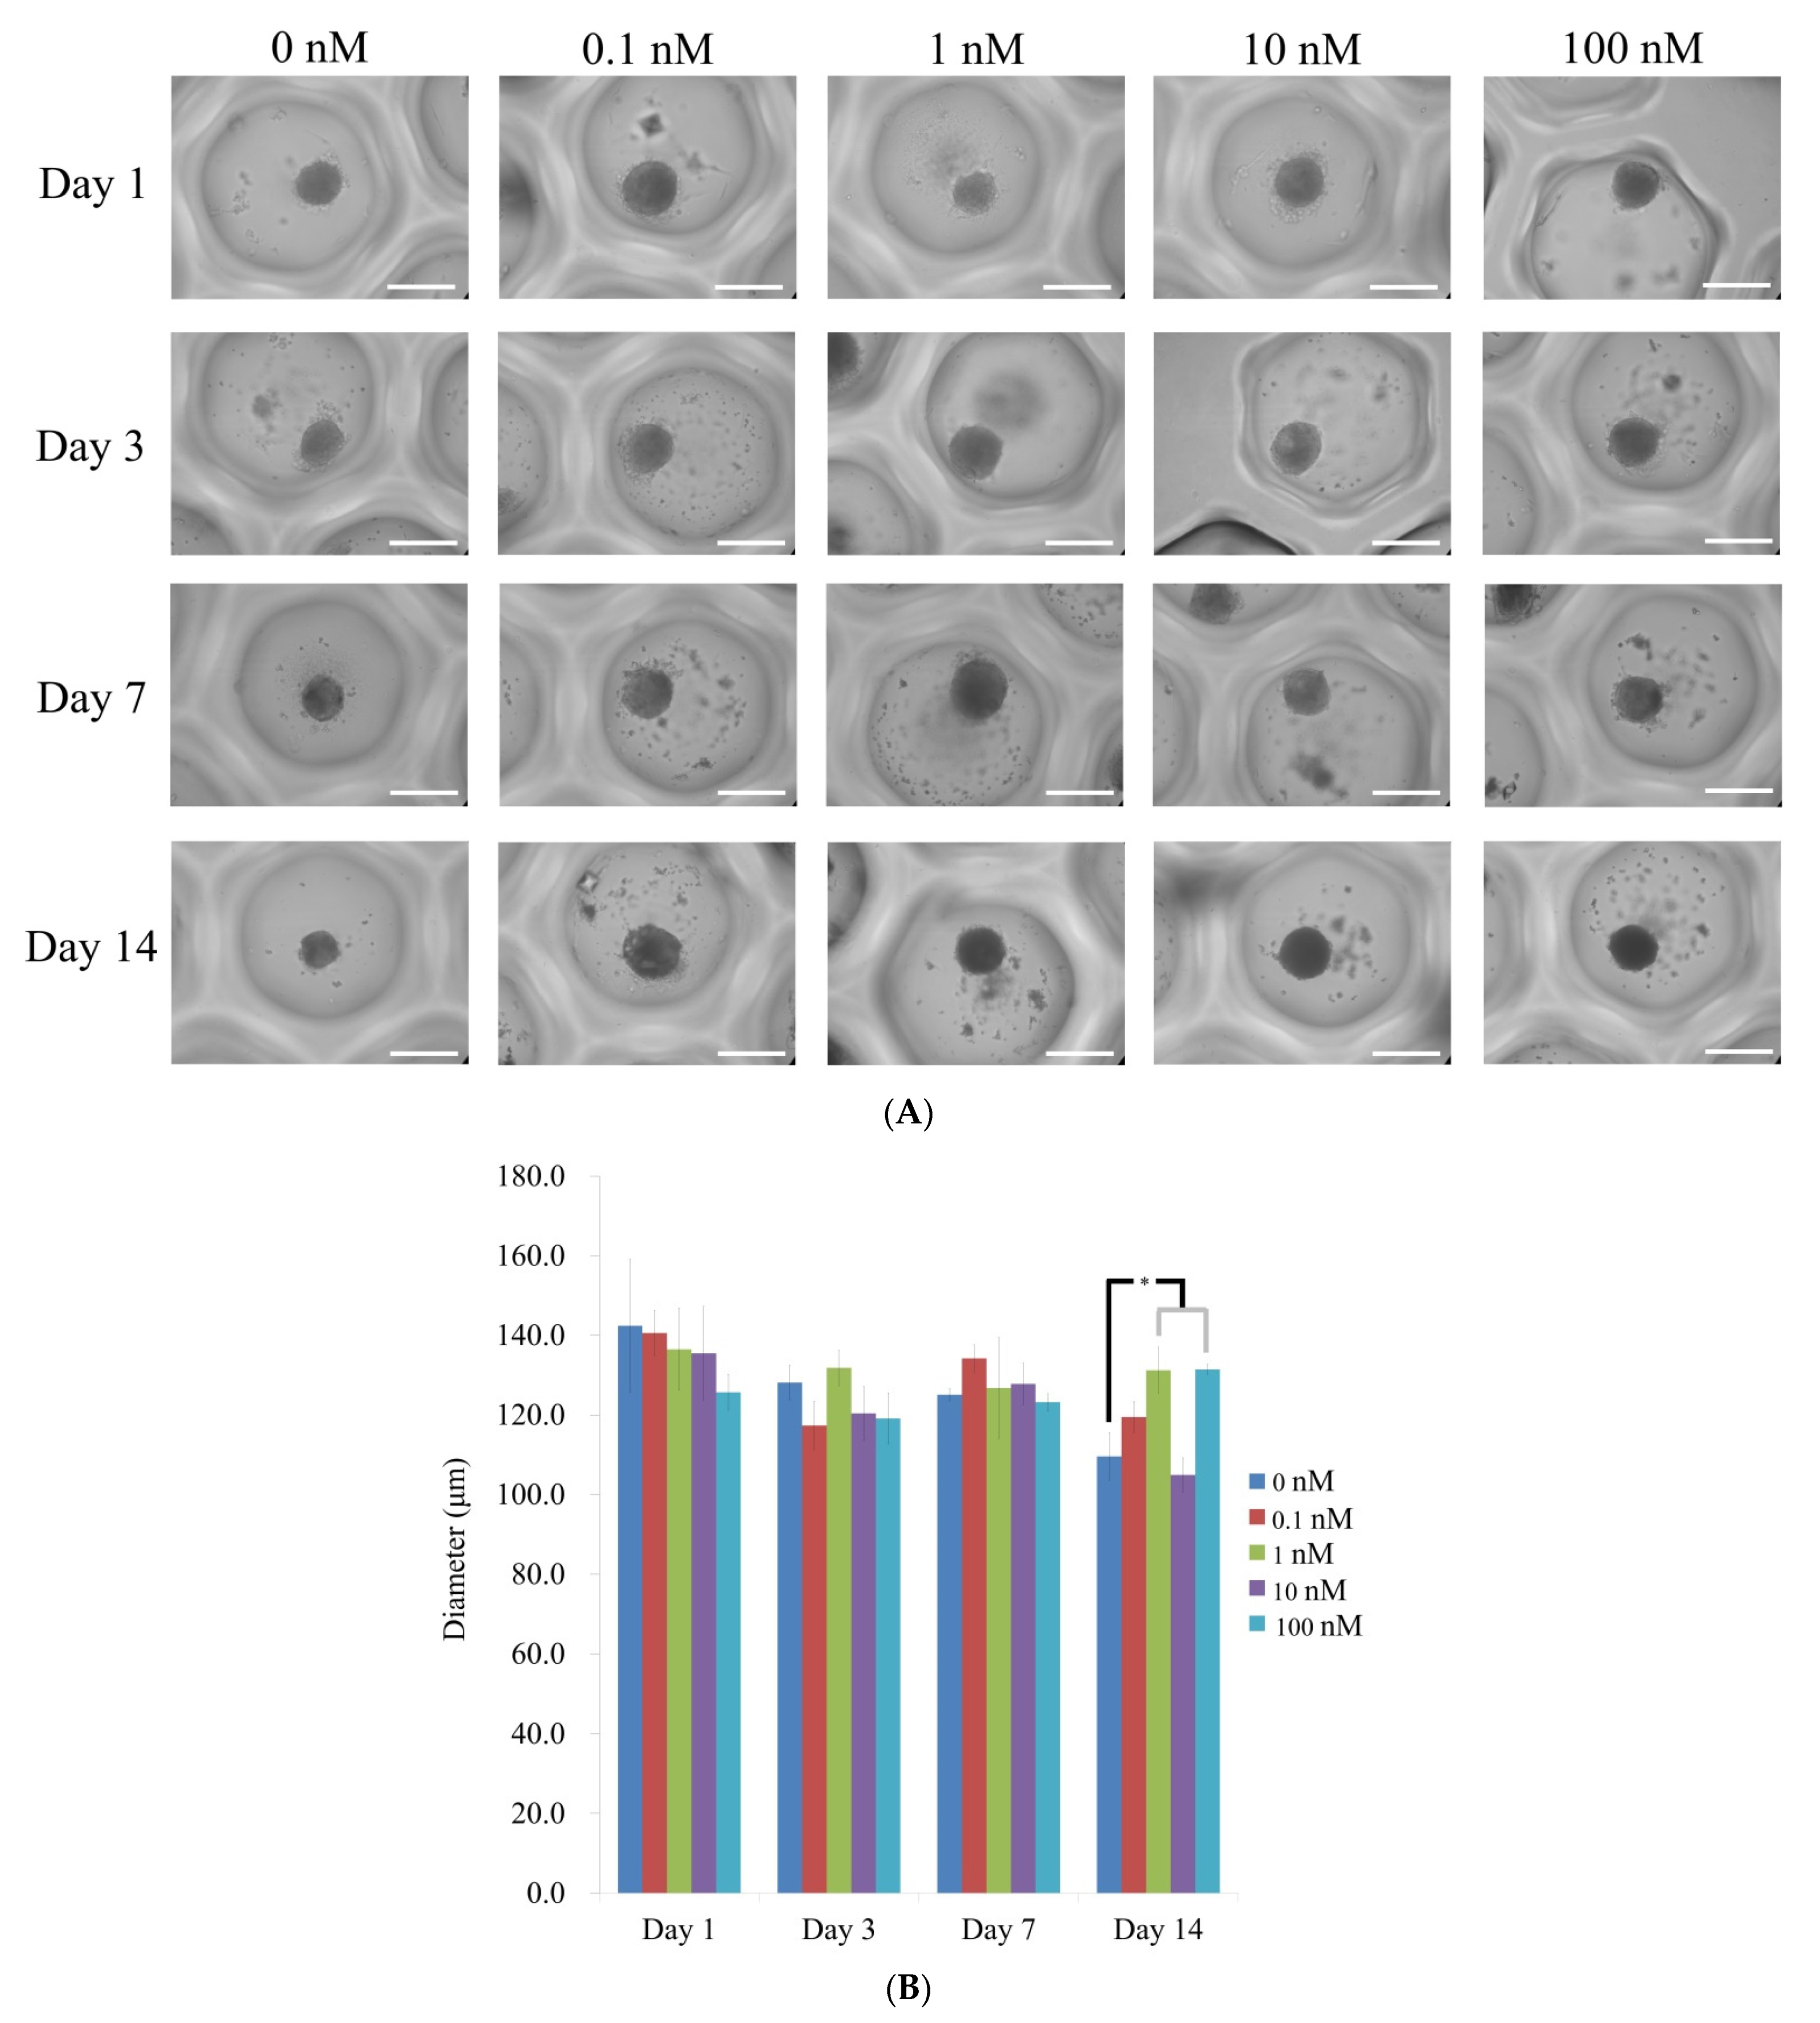
3.1. Cell Spheroids of Human Bone Marrow-Derived Mesenchymal Stem Cells

The morphology of spheroid treated with vitamin D at final concentrations of 0, 0.1, 1, 10, and 100 nM on days 1, 3, 7 and 14 is shown in Figure 2A. Stem cell spheroids did not show any morphological changes during the 14 days. All stem cell spheroids kept their round figure and maintained their size from day 1 through to day 14. The diameter of the spheroids can be found in Figure 2B. On day 1, the diameters were 142.4 ± 16.8, 140.6 ± 5.7, 136.5 ± 10.3, 135.5 ± 11.8, and 125.7 ± 4.5 µm for vitamin D at 0, 0.1, 1, 10, and 100 nM groups, respectively (p > 0.05). On day 3, the diameters for vitamin D at 0, 0.1, 1, 10, and 100 nM concentrations were 128.2 ± 4.3, 117.3 ± 6.1, 131.8 ± 4.5, 120.4 ± 6.8, and 119.1 ± 6.4 µm, respectively (p > 0.05). The diameters on day 7 were 125.0 ± 1.5, 134.2 ± 3.4, 126.8 ± 12.7, 127.8 ± 5.2, and 123.2 ± 2.1 for vitamin D at 0, 0.1, 1, 10, and 100 nM groups, respectively (p > 0.05). On day 14, the diameters were 109.6 ± 6.0, 119.5 ± 3.9, 131.3 ± 5.8, 104.9 ± 4.3, and 131.4 ± 1.3 µm for vitamin D at 0, 0.1, 1, 10, and 100 nM groups, respectively (p < 0.05).

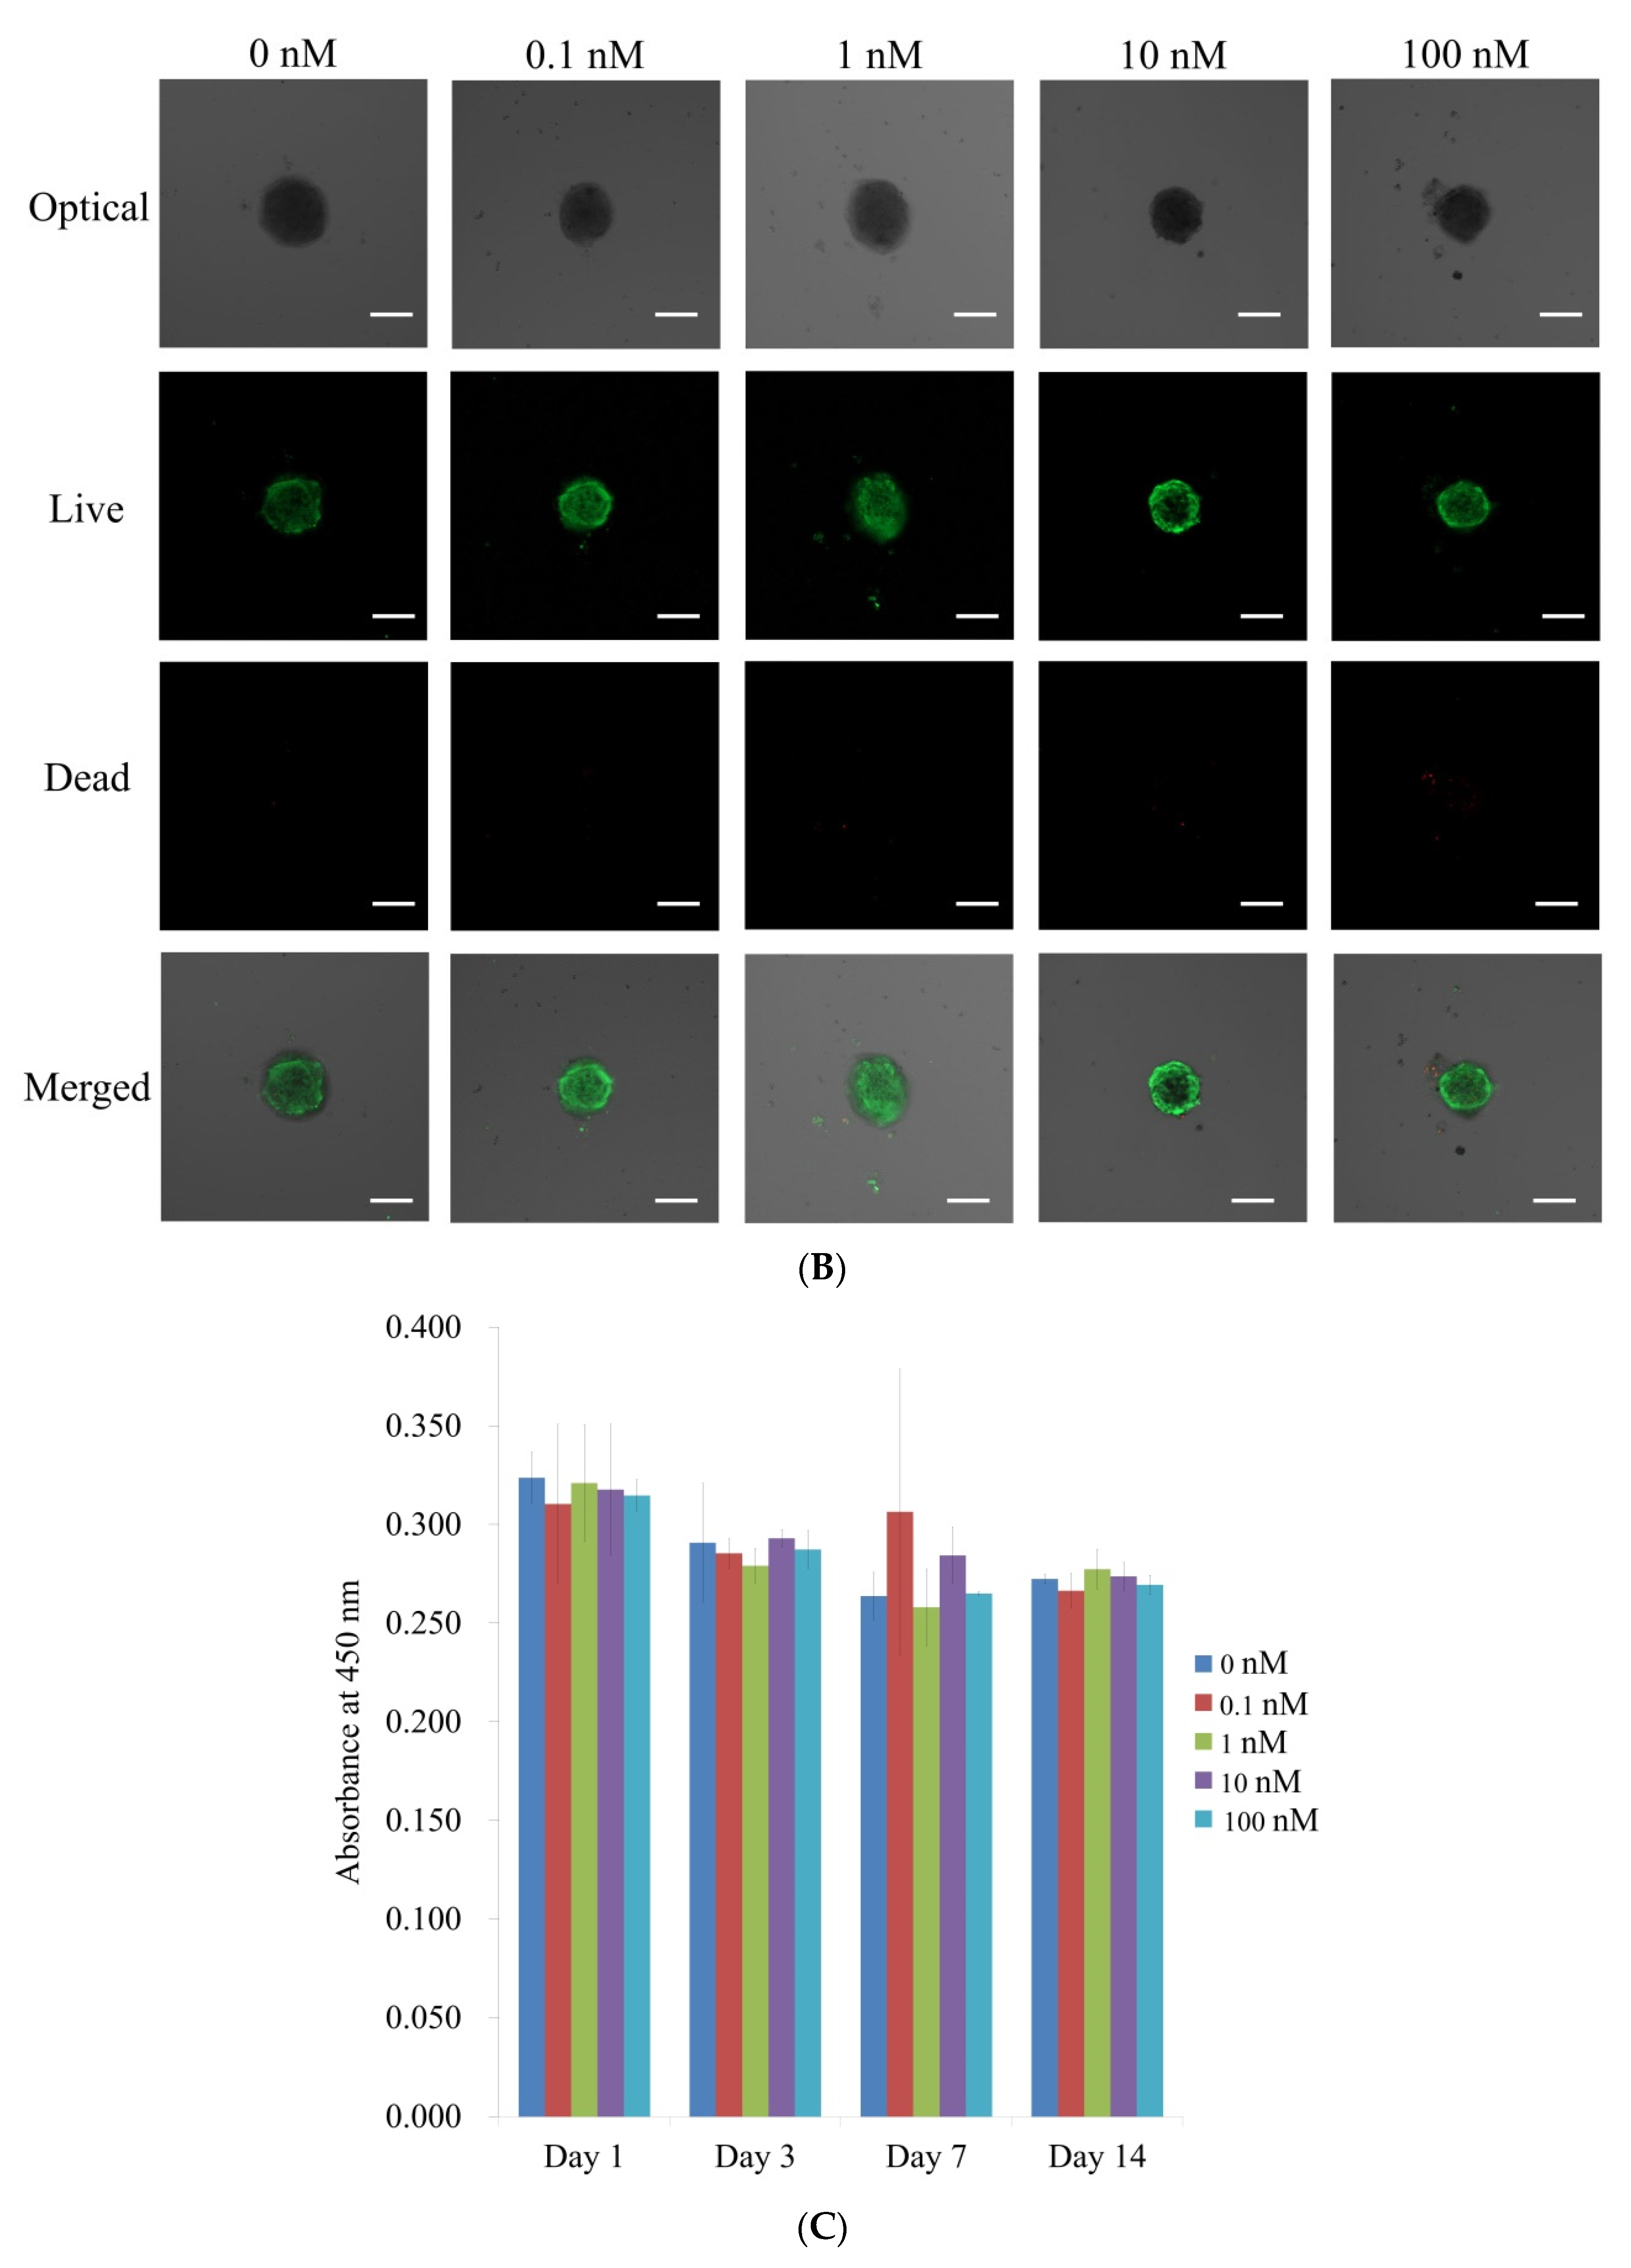
3.2. Qualitative Determination and Quantitative Values for Cell Viability

The qualitative viability of stem cells was analyzed using a Live/Dead Kit assay on days 1 and 7 (Figure 3A,B). In all cases, we recognized that most of the stem cells showed a round shape with intense green fluorescence, indicating live cells on day 1 (Figure 3A). Longer incubation of cells on day 7 did not show a noticeable decrease in green fluorescence (Figure 3B).
The quantitative cellular viability on days 1, 3, 7, and 14 are shown in Figure 3C. The absorbance values at 450 nm on day 1 were 0.324 ± 0.013, 0.310 ± 0.040, 0.321 ± 0.030, 0.318 ± 0.033, and 0.315 ± 0.008 for vitamin D at 0, 0.1, 1, 10, and 100 nM groups, respectively (p > 0.05). On day 3, the absorbance values for vitamin D at 0, 0.1, 1, 10, and 100 nM concentrations were 0.291 ± 0.030, 0.285 ± 0.008, 0.279 ± 0.009, 0.293 ± 0.004, and 0.287 ± 0.010, respectively (p > 0.05). On day 7, the absorbance values for vitamin D at 0, 0.1, 1, 10, and 100 nM concentrations were 0.264 ± 0.012, 0.306 ± 0.073, 0.258 ± 0.020, 0.284 ± 0.014, and 0.265 ± 0.001, respectively (p > 0.05). The absorbance values at 450 nm on day 14 were 0.272 ± 0.002, 0.266 ± 0.009, 0.277 ± 0.010, 0.274 ± 0.007, and 0.269 ± 0.005 for vitamin D at 0, 0.1, 1, 10, and 100 nM groups, respectively (p > 0.05).

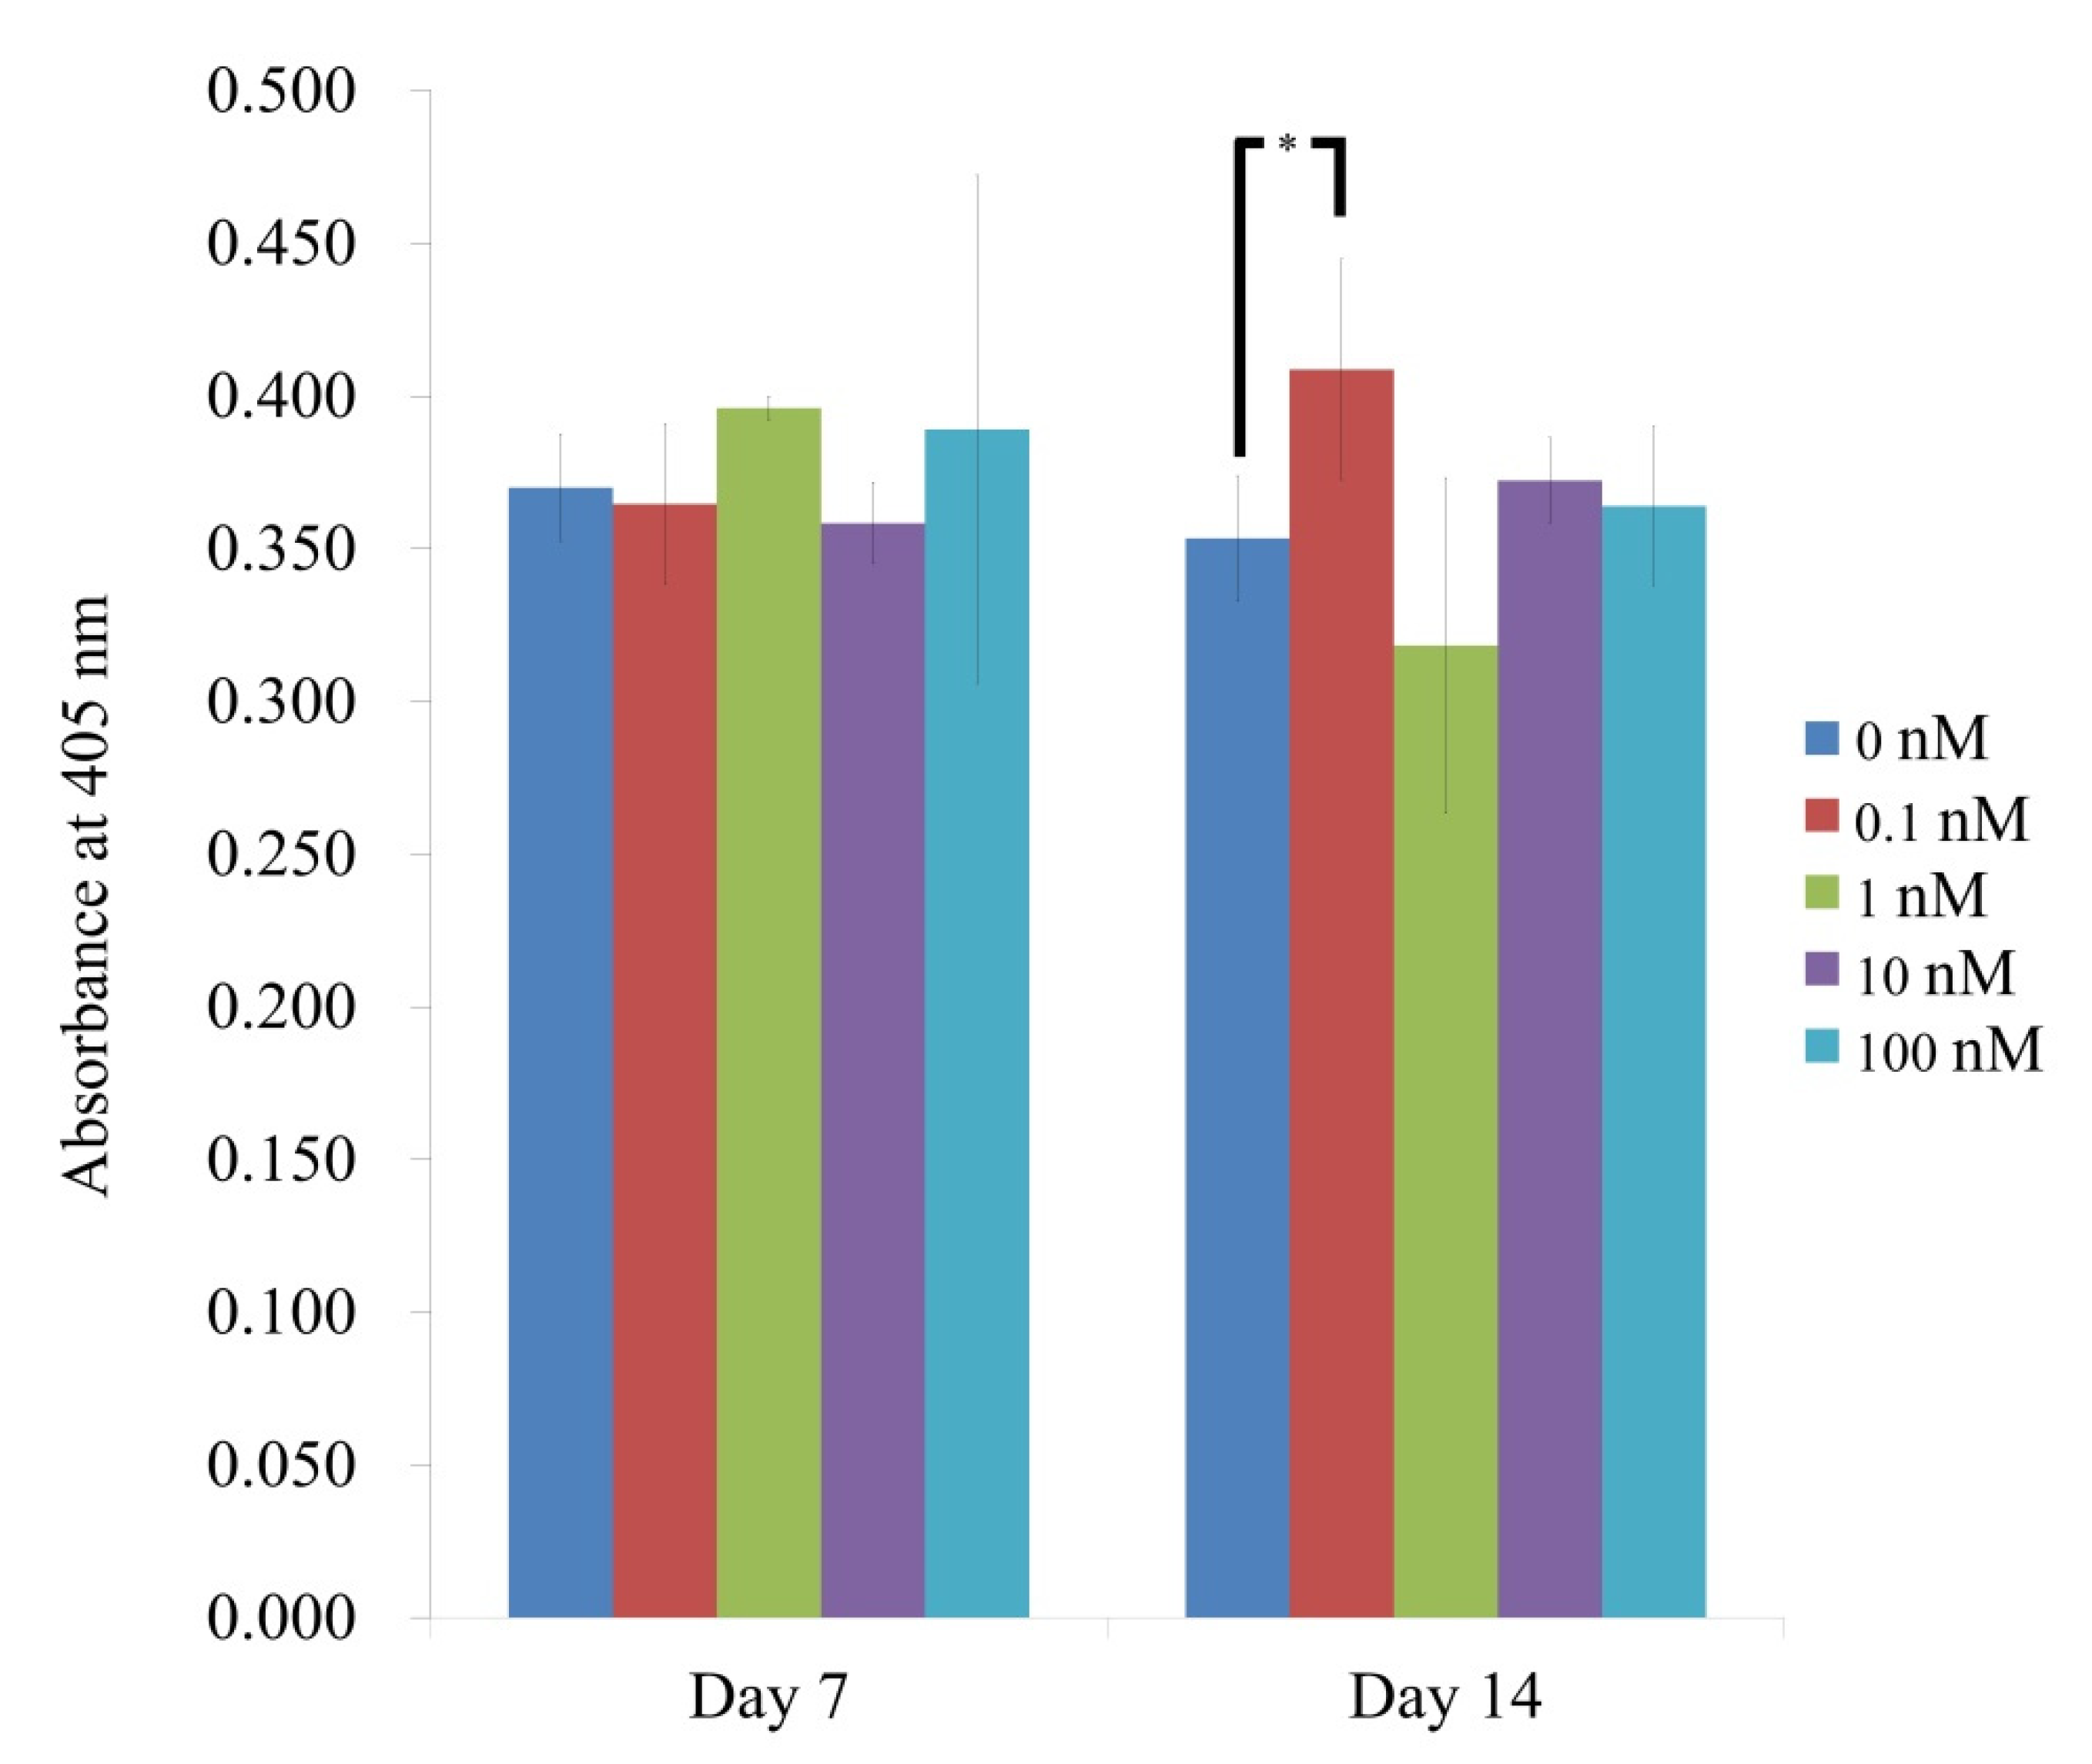
3.3. Evaluation of Alkaline Phosphatase Activity

The results of alkaline phosphatase activity showed that there was a significant increase in the 0.1 nM group when compared with the control on day 14 (p < 0.05) (Figure 4). The absorbance values at 405 nm on day 7 for vitamin D at 0, 0.1, 1, 10, and 100 nM concentrations were 0.370 ± 0.018, 0.365 ± 0.026, 0.396 ± 0.004, 0.358 ± 0.013, and 0.389 ± 0.083, respectively (p > 0.05). On day 14, the absorbance values for vitamin D at 0, 0.1, 1, 10, and 100 nM concentrations were 0.353 ± 0.021, 0.409 ± 0.036, 0.318 ± 0.055, 0.372 ± 0.014, and 0.364 ± 0.026, respectively (p < 0.05).

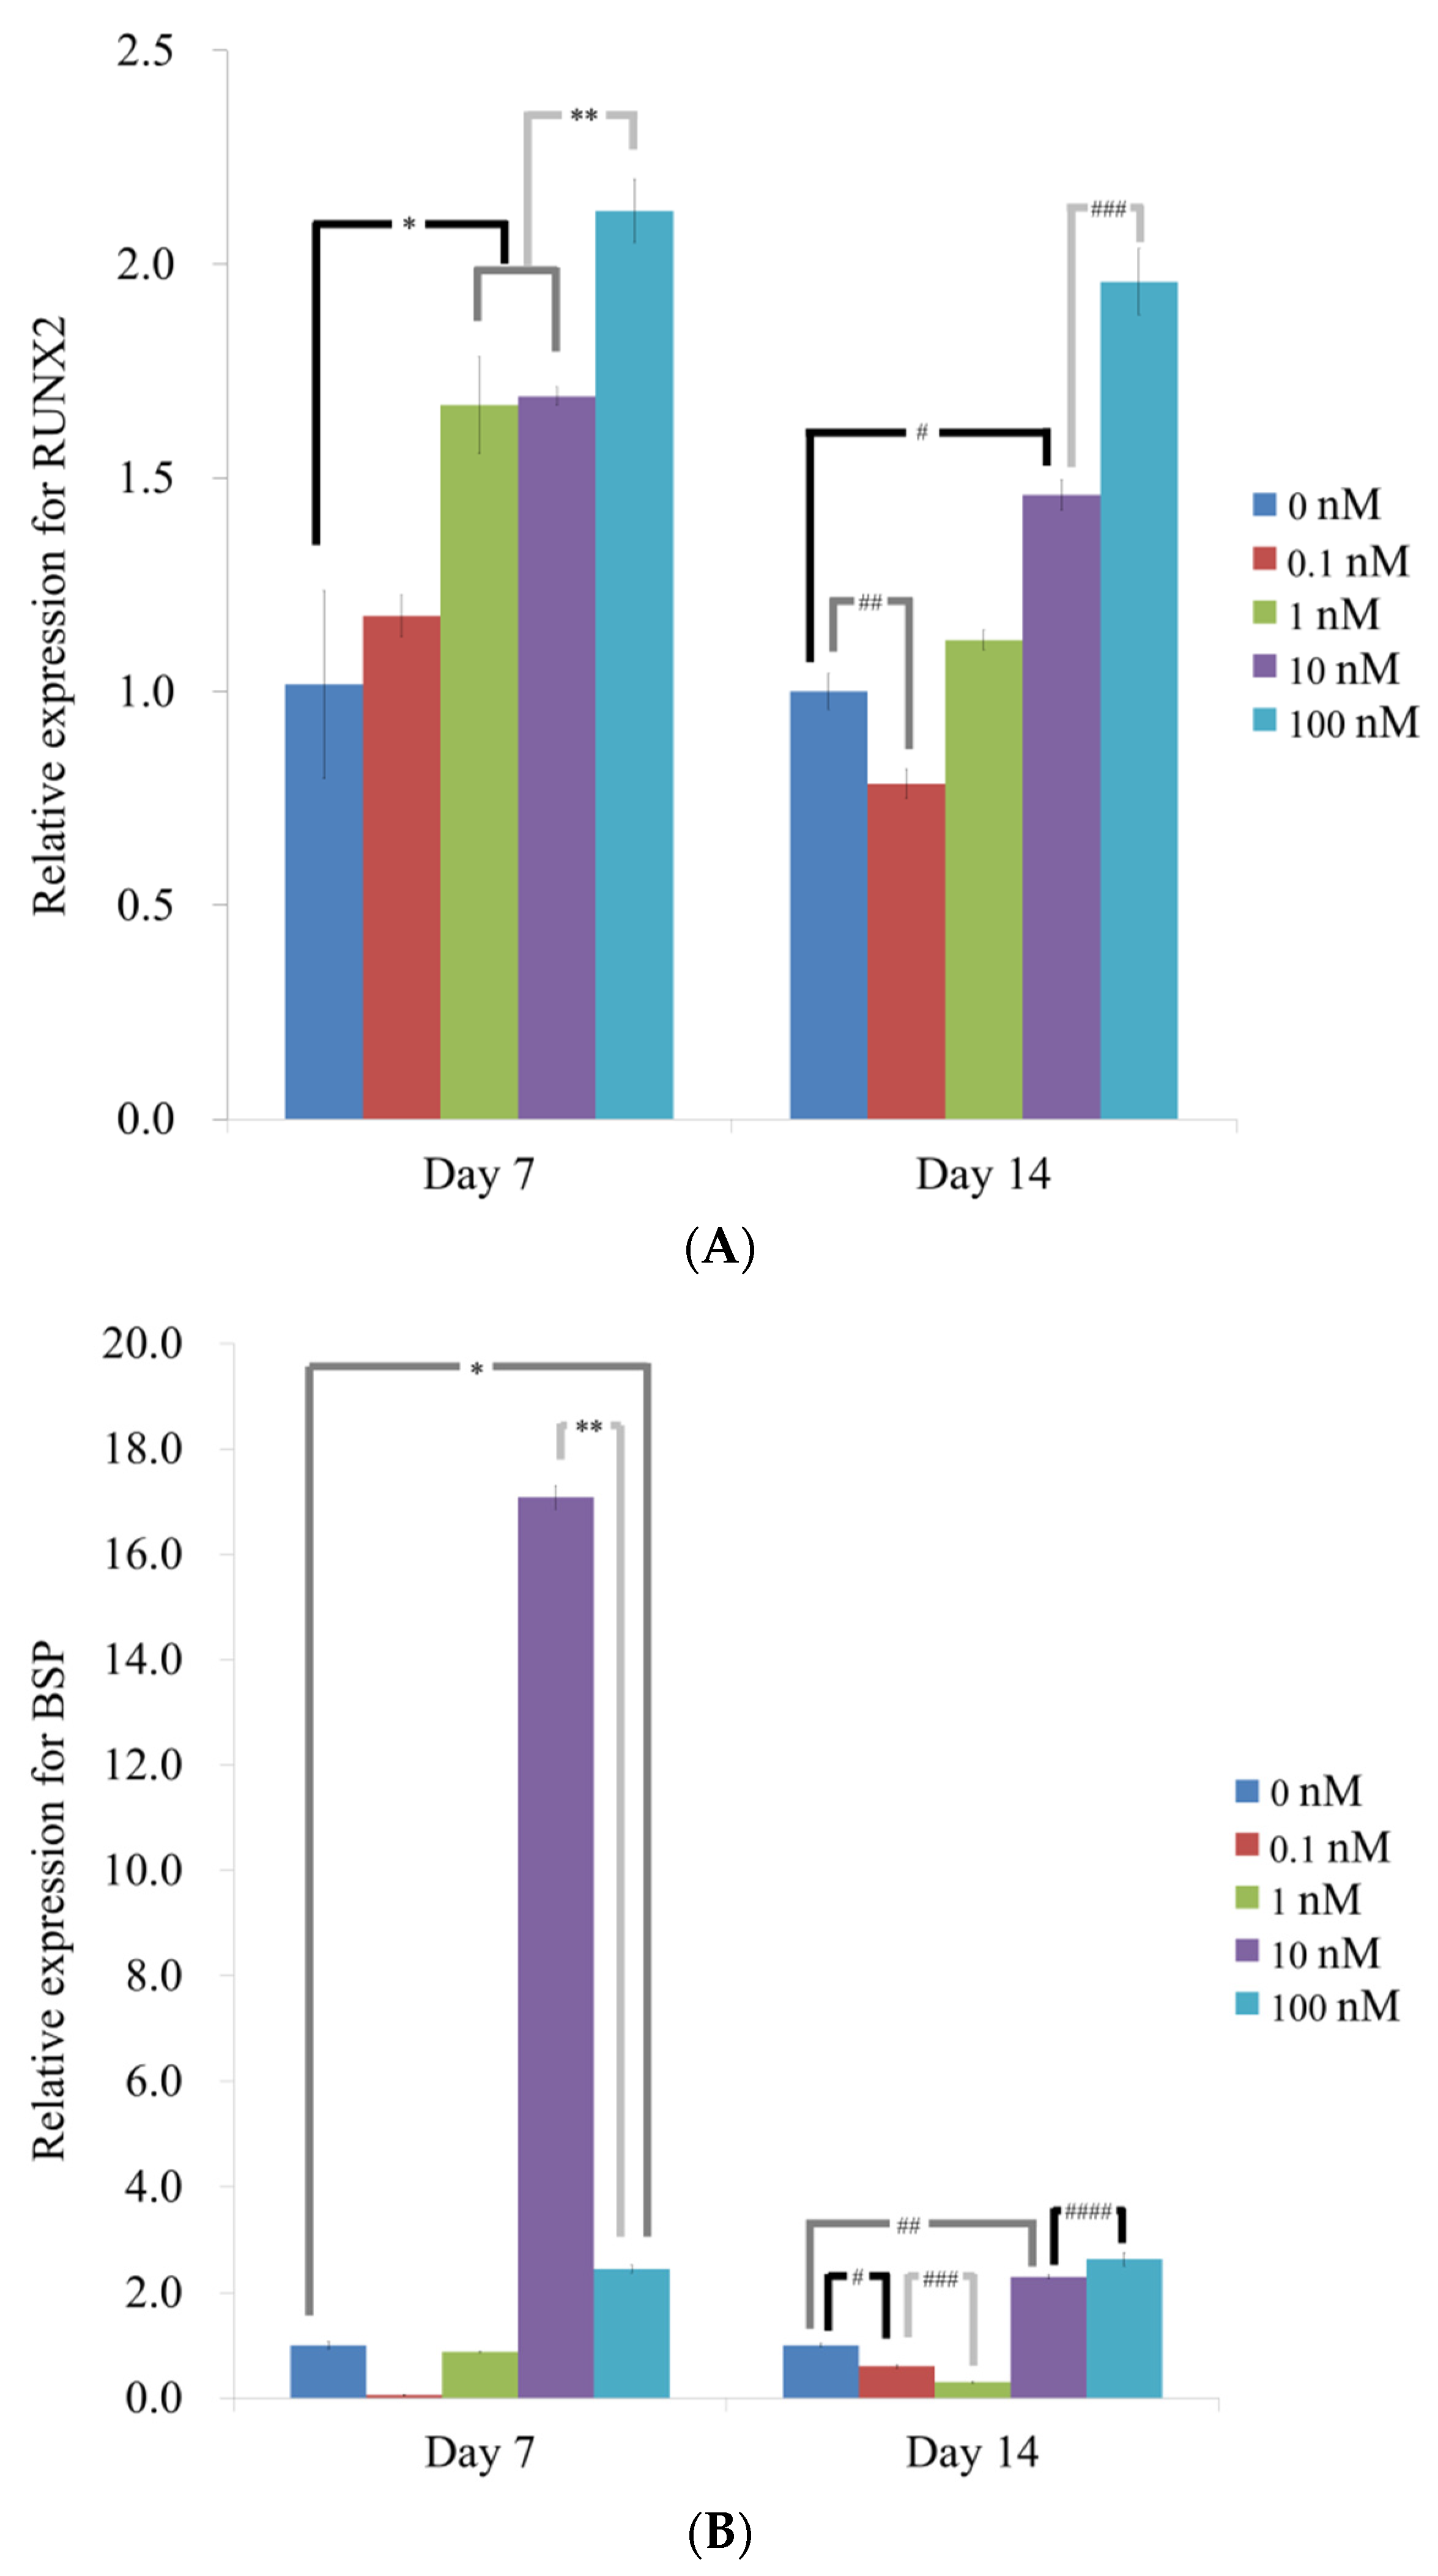
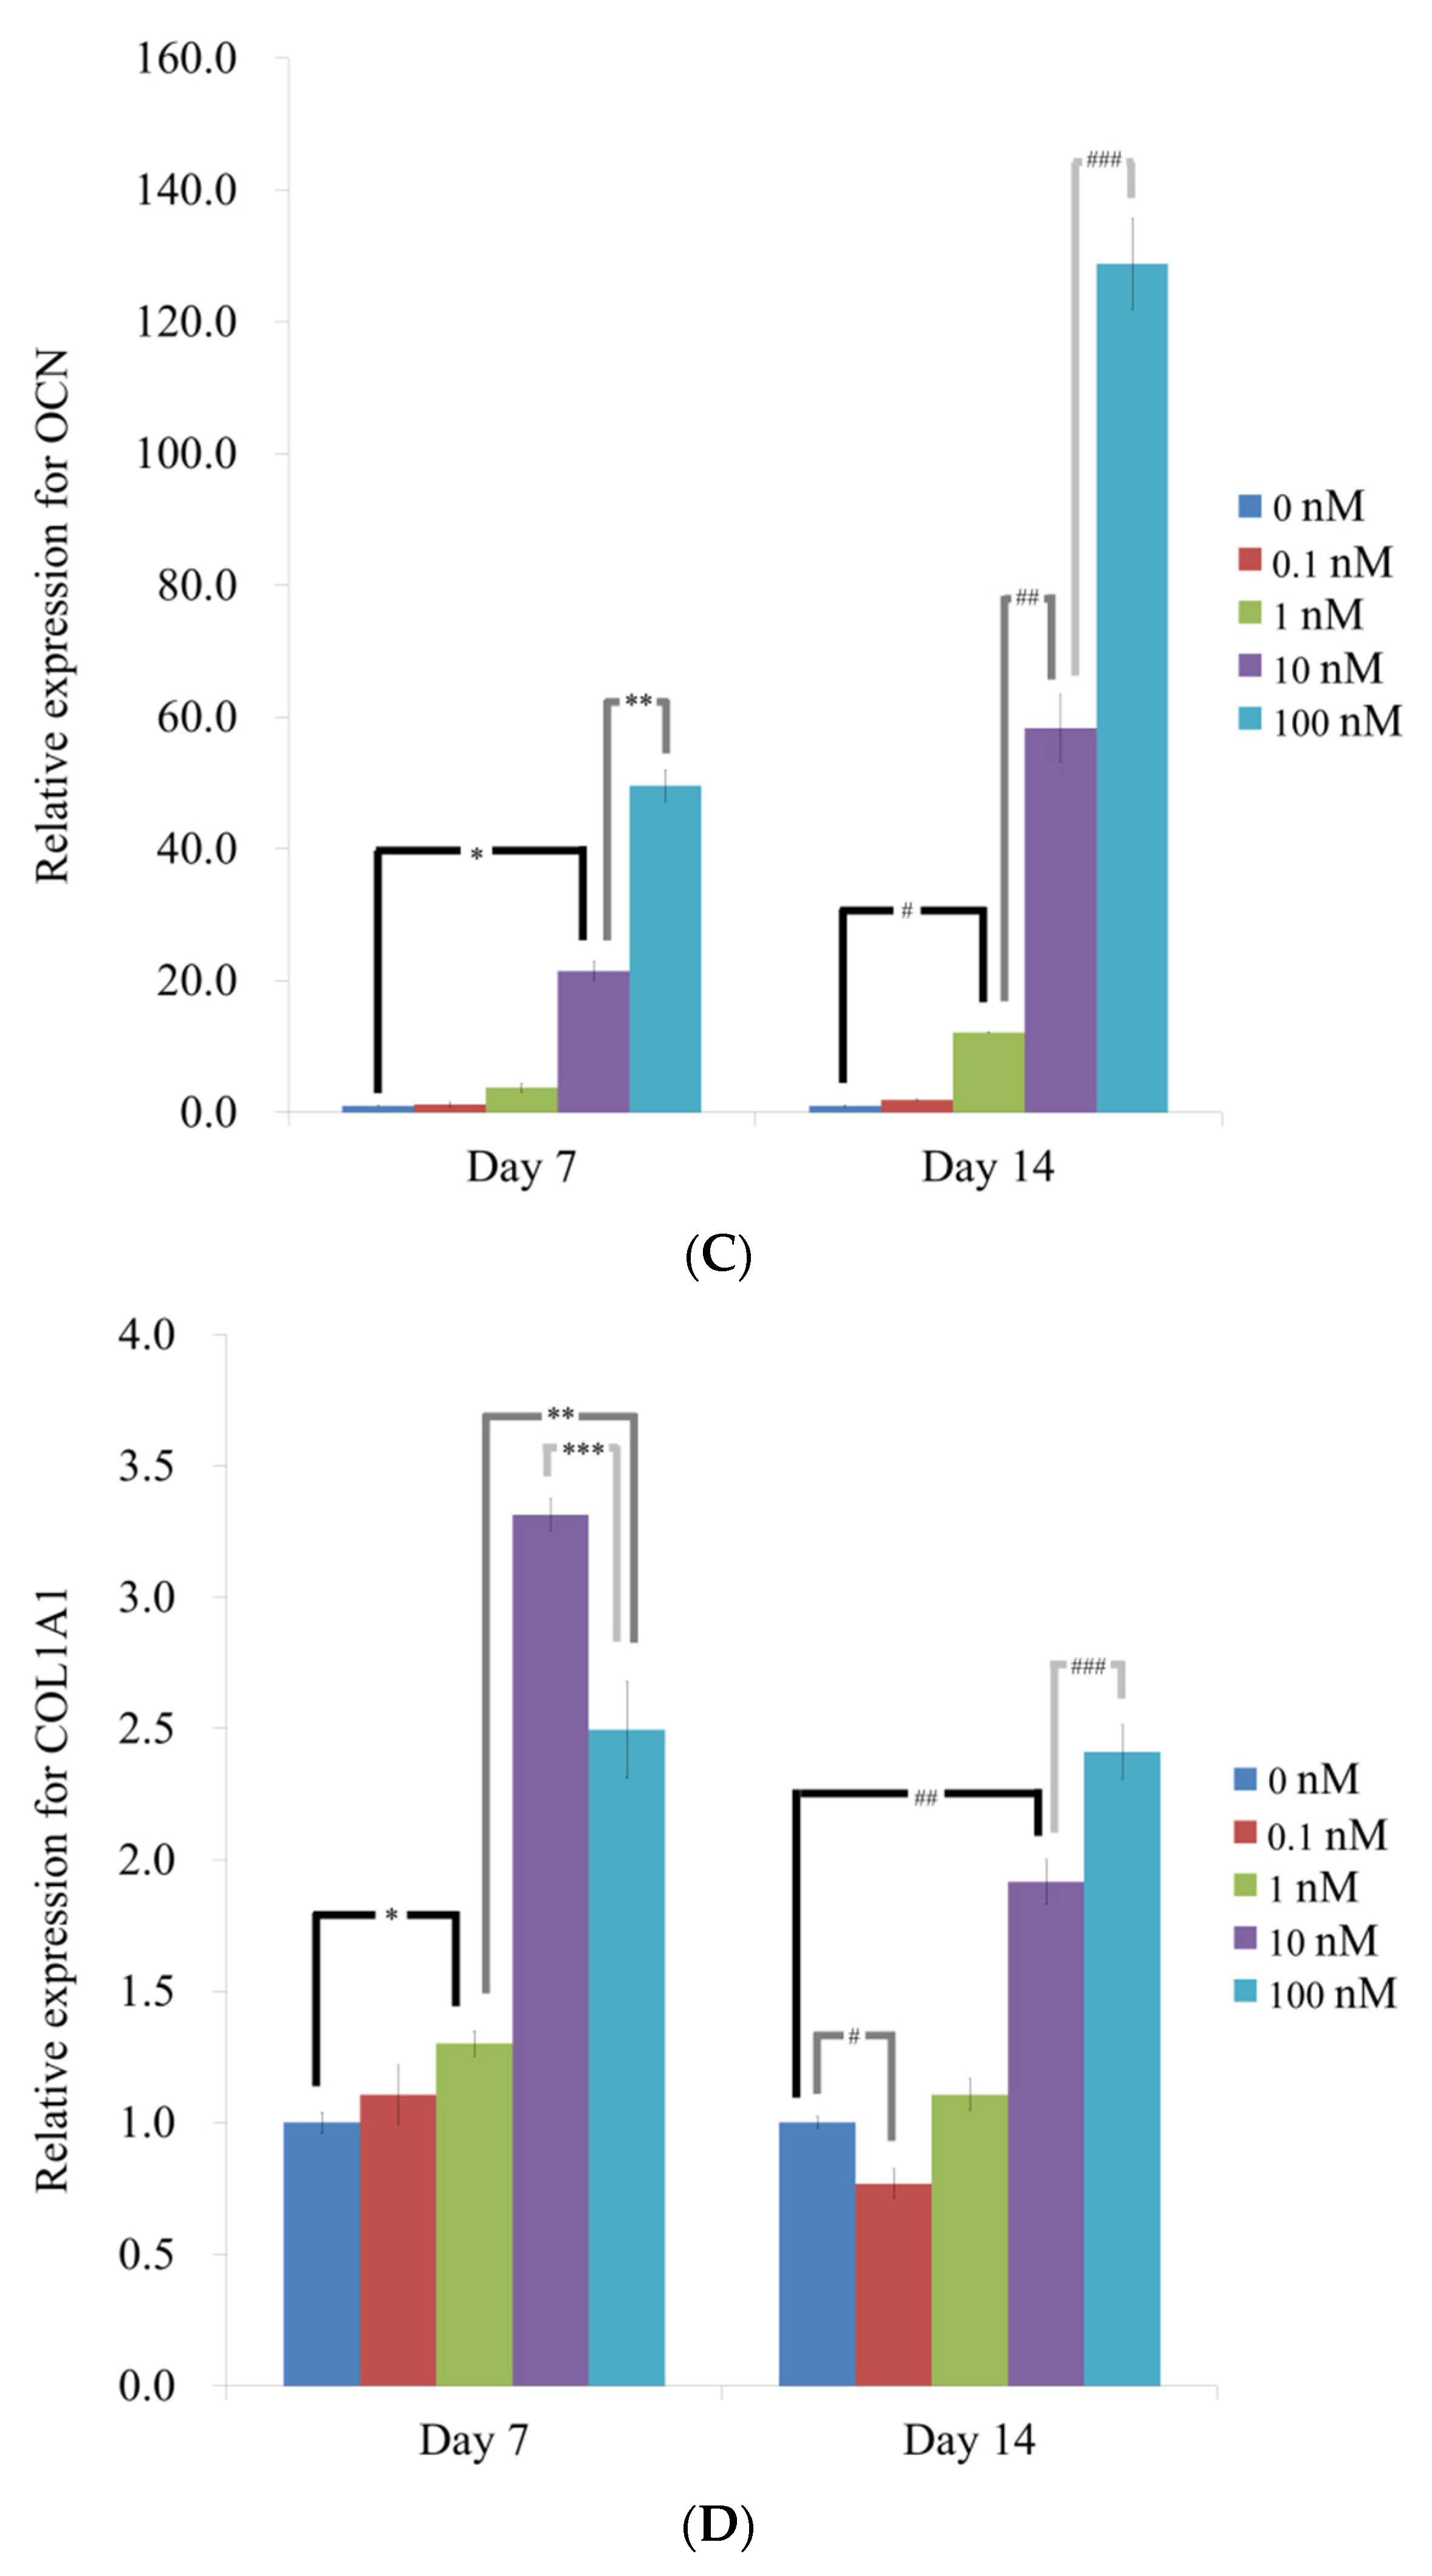
3.4. Evaluation of RUNX2, BSP, OCN, and COL1A1 by qPCR

qPCR revealed that the mRNA levels of RUNX2 on day 7 were 1.017 ± 0.220, 1.177 ± 0.049, 1.670 ± 0.113, 1.691 ± 0.021, and 2.125 ± 0.074 for vitamin D at 0, 0.1, 1, 10, 100 nM, respectively (p < 0.05) (Figure 5A). The addition of vitamin D led to the significant increase in RUNX2 expression at 1, 10 and 100 nM. The results showed that the mRNA levels of RUNX2 on day 14 were 1.001 ± 0.042, 0.785 ± 0.034, 1.121 ± 0.023, 1.460 ± 0.034, and 1.959 ± 0.078 for vitamin D at 0, 0.1, 1, 10, 100 nM, respectively (p < 0.05). The addition of vitamin D led to the significant increase in RUNX2 expression at 10 and 100 nM.
qPCR revealed that the mRNA levels of BSP on day 7 were 1.002 ± 0.070, 0.054 ± 0.010, 0.874 ± 0.013, 17.082 ± 0.224, and 2.452 ± 0.076, respectively (p < 0.05) (Figure 5B). The addition of vitamin D led to the significant increase in BSP expression at 10 and 100 nM. The results demonstrated that the mRNA levels of BSP on day 14 were 1.000 ± 0.029, 0.600 ± 0.032, 0.300 ± 0.008, 2.300 ± 0.035, and 2.637 ± 0.124, respectively (p < 0.05). The addition of vitamin D led to the significant increase in BSP expression at 10 and 100 nM.
qPCR revealed that the mRNA levels of OCN on day 7 were 1.001 ± 0.043, 1.204 ± 0.338, 3.748 ± 0.653, 21.457 ± 1.445, and 49.592 ± 2.344, respectively (p < 0.05) (Figure 5C). The addition of vitamin D led to the significant increase in OCN expression at 10 and 100 nM. The results demonstrated that he mRNA levels of BSP on day 14 were 1.006 ± 0.131, 1.888 ± 0.098, 12.125 ± 0.064, 58.288 ± 5.088, and 128.783 ± 6.925, respectively (p < 0.05). The addition of vitamin D led to the significant increase in RUNX2 expression at 1, 10 and 100 nM.
qPCR revealed that the mRNA levels of COL1A1 on day 7 were 1.001 ± 0.040, 1.105 ± 0.112, 1.301 ± 0.048, 3.315 ± 0.062, and 2.495 ± 0.184, respectively (p < 0.05) (Figure 5D). The addition of vitamin D led to the significant increase in COL1A1 expression at 1, 10 and 100 nM. The results demonstrated that the mRNA levels of COL1A1 on day 14 were 1.000 ± 0.022, 0.770 ± 0.056, 1.107 ± 0.060, 1.917 ± 0.085, and 2.411 ± 0.102, respectively (p < 0.05). The addition of vitamin D led to the significant increase in COL1A1 expression at 10 and 100 nM.

4. Discussion

This research analyzed the effects of vitamin D on the osteogenic differentiation and mineralization of human mesenchymal stem cells. Differentiation into an osteogenic lineage was detected by alkaline phosphatase activity, and the mRNA levels of RUNX2, BSP, OCN, and COL1A1 were detected using real-time quantitative polymerase chain reaction [26].
Vitamin D has various effects on different tissues and cells [27,28,29,30,31,32,33]. Vitamin D deficiency is reported to result in abnormal calcium, phosphorus and bone metabolism [27]. In particular, vitamin D deficiency reduced the efficiency of intestinal calcium and reduced the absorption of phosphorus from dietary calcium and phosphorus, resulting in increased parathyroid hormone levels [28]. Vitamin D deficiency may impair fracture healing and may worsen bone loss after trauma [29]. A previous report revealed that vitamin D had a regulatory role on human colon stem cells, showing a homeostatic effect on colon epithelium with relevant implications in inflammatory bowel diseases and colorectal cancer [30]. Another previous report showed that vitamin D could be unfavorable in the context of cartilage matrix synthesis [31]. Treatment of vitamin D deficiency led to increase in the level of bone at the implant [32]. There were controversial results regarding bone markers. It was shown that consumption of vitamin D-fortified foods did not show significant changes of bone turnover markers, including osteocalcin and type 1 collagen [33].
The effects of different concentrations of vitamin D have been evaluated in previous studies [34,35,36,37]. A previous report showed that MC3T3-E1 osteoblastic cells showed significant increases in alkaline phosphatase activity with vitamin D at 0.1 nM [34]. Treatment with vitamin D at 5 nM and 10 nM led to a statistically significant increase in Alizarin red optical density of mesenchymal stem cells obtained from dental pulp [35]. Human periodontal ligament stem cells were treated with vitamin D at 100 nM and photobiomodulated, and this led to enhanced osteoblastic differentiation [36]. Treatment of primary human skeletal muscle myoblast with vitamin D at 100 nM showed inhibition of myoblast proliferation and enhancement of differentiation [37]. Differences in the maximum effective doses may be due to variability in conditions including cell culture conditions, cell passage, cell type, and incubation time [38,39].
Cellular viability was analyzed with qualitative and quantitative methods [20,40]. Alkaline phosphatase activity is considered as one of the first key players in the process of osteogenesis [41]. Alkaline phosphatase activity has become the marker of choice when assessing the phenotypic or developmental maturity of mineralized tissue cells because of its centrality, biochemical and histological analysis [19]. Expression level of various genes including RUNX2, BSP, OCN, and COL1A1 were studied to analyze the osteogenic potential [42]. RUNX2 is known as a major transcription factor for osteoblasts, and has been widely used for the evaluation of osteogenic differentiation including stem cell spheroids [14,43]. BSP was suggested to be the early marker for osteogenic differentiation of stem cells [44]. The OCN gene encodes protein secreted by osteoblasts that regulates bone remodeling [45]. COL1A1 is also known as an osteogenic marker, and the impairment in collagen formation due to mutation of COL1A1 may lead to fragility of bone [46].
Vitamin D was loaded in collagen gel and it was served as an injectable scaffold to accelerated bone growth [47]. Vitamin D was applied with vitamin-conjugated gold nanoparticles as carriers, and they promoted osteogenic differentiation of human adipose-derived stem cells effectively [48]. Previous research reported on the combinatorial use of vitamin D and bone morphogenetic protein 2 [49]. It was also shown that the combination of systemic vitamin D and local Forkhead transcription factor 1 inhibitor can be applied for the enhancement of implant osseointegration [50]. There is some limitation to this study, including the protein expression levels of Runt-related transcription factor 2, bone sialoprotein, osteocalcin and type I collagen.

5. Conclusions

This study showed that application of vitamin D had the tendency to increase osteogenic differentiation, as seen from alkaline phosphatase activity and mRNA expression of cell spheroids. Based on these findings, we conclude that vitamin D can be applied for increased osteogenic differentiation of stem cell spheroids.

Author Contributions

Conceptualization, H.-J.L., Y.-M.S., S.B., Y.-H.P., J.-B.P.; methodology, H.-J.L., Y.-M.S., S.B., Y.-H.P., J.-B.P.; formal analysis, H.-J.L., Y.-M.S., S.B., Y.-H.P., J.-B.P.; writing—original draft preparation, H.-J.L., Y.-M.S., S.B., Y.-H.P., J.-B.P. and writing—review and editing, H.-J.L., Y.-M.S., S.B., Y.-H.P., J.-B.P. All authors have read and agreed to the published version of the manuscript.

Funding

This study was supported by the National Research Foundation of Korea (NRF) grant funded by the Korea government (MSIT) (No. 2020R1A2C4001624).

Institutional Review Board Statement

This study and all the experimental schemes were reviewed and approved (KC21SASE0225, Approval date: 6 April 2021) to be performed according to the relevant guidelines.

Informed Consent Statement

Informed consent was obtained from the participants involved in the study.

Data Availability Statement

All data analyzed during this study are included in this published article.

Acknowledgments

Parts of this paper were submitted as an abstract at the 2021 EAO Digital Days of the European Association for Osseointegration.

Conflicts of Interest

The authors do not have any conflict of interest to declare.

References

  1. Gupta, A.A.; Kheur, S.; Badhe, R.V.; Raj, A.T.; Bhonde, R.; Jaisinghani, A.; Vyas, N.; Patil, V.R.; Alhazmi, Y.A.; Parveen, S.; et al. Assessing the potential use of chitosan scaffolds for the sustained localized delivery of vitamin D. Saudi J. Biol. Sci. 2021, 28, 2210–2215. [Google Scholar] [CrossRef]
  2. Costantini, E.; Sinjari, B.; Piscopo, F.; Porreca, A.; Reale, M.; Caputi, S.; Murmura, G. Evaluation of Salivary Cytokines and Vitamin D Levels in Periodontopathic Patients. Int. J. Mol. Sci. 2020, 21, 2669. [Google Scholar] [CrossRef]
  3. Lieberherr, M. Effects of vitamin D3 metabolites on cytosolic free calcium in confluent mouse osteoblasts. J. Biol. Chem. 1987, 262, 13168–13173. [Google Scholar] [CrossRef]
  4. Oshima, J.; Watanabe, M.; Hirosumi, J.; Orimo, H. 1,25(OH)2D3 increases cytosolic Ca++ concentration of osteoblastic cells, clone MC3T3-E1. Biochem. Biophys. Res. Commun. 1987, 145, 956–960. [Google Scholar] [CrossRef]
  5. Aoshima, Y.; Mizobuchi, M.; Ogata, H.; Kumata, C.; Nakazawa, A.; Kondo, F.; Ono, N.; Koiwa, F.; Kinugasa, E.; Akizawa, T. Vitamin D receptor activators inhibit vascular smooth muscle cell mineralization induced by phosphate and TNF-α. Nephrol. Dial. Transplant. 2012, 27, 1800–1806. [Google Scholar] [CrossRef]
  6. Metzger, W.; Schimmelpfennig, L.; Schwab, B.; Sossong, D.; Dorst, N.; Bubel, M.; Görg, A.; Pütz, N.; Wennemuth, G.; Pohlemann, T.; et al. Expansion and differentiation of human primary osteoblasts in two- and three-dimensional culture. Biotech. Histochem. 2013, 88, 86–102. [Google Scholar] [CrossRef]
  7. Schröder, M.; Riksen, E.A.; He, J.; Skallerud, B.H.; Møller, M.E.; Lian, A.M.; Syversen, U.; Reseland, J.E. Vitamin K2 Modulates Vitamin D-Induced Mechanical Properties of Human 3D Bone Spheroids In Vitro. JBMR Plus 2020, 4, e10394. [Google Scholar] [CrossRef]
  8. Olivares-Navarrete, R.; Hyzy, S.L.; Boyan, B.D.; Schwartz, Z. Regulation of Osteoblast Differentiation by Acid-Etched and/or Grit-Blasted Titanium Substrate Topography Is Enhanced by 1,25(OH)2D3 in a Sex-Dependent Manner. Biomed. Res. Int. 2015, 2015, 365014. [Google Scholar] [CrossRef] [PubMed]
  9. Olivares-Navarrete, R.; Sutha, K.; Hyzy, S.L.; Hutton, D.L.; Schwartz, Z.; McDevitt, T.; Boyan, B.D. Osteogenic differentiation of stem cells alters vitamin D receptor expression. Stem Cells Dev. 2012, 21, 1726–1735. [Google Scholar] [CrossRef]
  10. Shao, B.Y.; Wang, L.; Yu, Y.; Chen, L.; Gan, N.; Huang, W.M. Effects of CD4(+) T lymphocytes from ovariectomized mice on bone marrow mesenchymal stem cell proliferation and osteogenic differentiation. Exp. Ther. Med. 2020, 20, 84. [Google Scholar] [CrossRef] [PubMed]
  11. Lan, C.; Long, L.; Xie, K.; Liu, J.; Zhou, L.; Pan, S.; Liang, J.; Tu, Z.; Gao, Z.; Tang, Y. miRNA-429 suppresses osteogenic differentiation of human adipose-derived mesenchymal stem cells under oxidative stress via targeting SCD-1. Exp. Ther. Med. 2020, 19, 696–702. [Google Scholar] [CrossRef]
  12. Petrenko, Y.; Syková, E.; Kubinová, Š. The therapeutic potential of three-dimensional multipotent mesenchymal stromal cell spheroids. Stem Cell Res. Ther. 2017, 8, 94. [Google Scholar] [CrossRef] [PubMed]
  13. Lee, S.I.; Ko, Y.; Park, J.B. Evaluation of the maintenance of stemness, viability, and differentiation potential of gingiva-derived stem-cell spheroids. Exp. Ther. Med. 2017, 13, 1757–1764. [Google Scholar] [CrossRef] [PubMed]
  14. Min, S.K.; Kim, M.; Park, J.B. Insulin-like growth factor 2-enhanced osteogenic differentiation of stem cell spheroids by regulation of Runx2 and Col1 expression. Exp. Ther. Med. 2021, 21, 383. [Google Scholar] [CrossRef] [PubMed]
  15. Caputi, S.; Trubiani, O.; Sinjari, B.; Trofimova, S.; Diomede, F.; Linkova, N.; Diatlova, A.; Khavinson, V. Effect of short peptides on neuronal differentiation of stem cells. Int. J. Immunopathol. Pharmacol. 2019, 33, 2058738419828613. [Google Scholar] [CrossRef]
  16. Rexhepi, I.; Paolantonio, M.; Romano, L.; Serroni, M.; Santamaria, P.; Secondi, L.; Paolantonio, G.; Sinjari, B.; De Ninis, P.; Femminella, B. Efficacy of inorganic bovine bone combined with leukocyte and platelet-rich fibrin or collagen membranes for treating unfavorable periodontal infrabony defects: Randomized non-inferiority trial. J. Periodontol. 2021. [Google Scholar] [CrossRef]
  17. Rastegar, A.; Mahmoodi, M.; Mirjalili, M.; Nasirizadeh, N. Platelet-rich fibrin-loaded PCL/chitosan core-shell fibers scaffold for enhanced osteogenic differentiation of mesenchymal stem cells. Carbohydr. Polym. 2021, 269, 118351. [Google Scholar] [CrossRef]
  18. Lee, H.J.; Lee, H.; Na, C.B.; Song, I.S.; Ryu, J.J.; Park, J.B. Evaluation of the Age- and Sex-Related Changes of the Osteogenic Differentiation Potentials of Healthy Bone Marrow-Derived Mesenchymal Stem Cells. Medicina 2021, 57, 520. [Google Scholar] [CrossRef]
  19. Lee, H.; Park, J.B. Dimethyl sulfoxide leads to decreased osteogenic differentiation of stem cells derived from gingiva via Runx2 and Collagen I expression. Eur. J. Dent. 2019, 13, 131–136. [Google Scholar] [CrossRef]
  20. Kang, S.H.; Park, J.B.; Kim, I.; Lee, W.; Kim, H. Assessment of stem cell viability in the initial healing period in rabbits with a cranial bone defect according to the type and form of scaffold. J. Periodontal Implant Sci. 2019, 49, 258–267. [Google Scholar] [CrossRef] [PubMed]
  21. Kim, B.B.; Tae, J.Y.; Ko, Y.; Park, J.B. Lovastatin increases the proliferation and osteoblastic differentiation of human gingiva-derived stem cells in three-dimensional cultures. Exp. Ther. Med. 2019, 18, 3425–3430. [Google Scholar] [CrossRef]
  22. Lee, H.; Son, J.; Min, S.K.; Na, C.B.; Yi, G.; Koo, H.; Park, J.B. A study of the effects of doxorubicin-containing liposomes on osteogenesis of 3D stem cell spheroids derived from gingiva. Materials 2019, 12, 2693. [Google Scholar] [CrossRef]
  23. Lee, H.; Lee, H.; Na, C.B.; Park, J.B. The effects of simvastatin on cellular viability, stemness and osteogenic differentiation using 3-dimensional cultures of stem cells and osteoblast-like cells. Adv. Clin. Exp. Med. 2019, 28, 699–706. [Google Scholar] [CrossRef] [PubMed]
  24. Min, S.K.; Kim, M.; Park, J.B. Bone morphogenetic protein 2-enhanced osteogenic differentiation of stem cell spheres by regulation of Runx2 expression. Exp. Ther. Med. 2020, 20, 79. [Google Scholar] [CrossRef] [PubMed]
  25. Son, J.; Tae, J.Y.; Min, S.K.; Ko, Y.; Park, J.B. Fibroblast growth factor-4 maintains cellular viability while enhancing osteogenic differentiation of stem cell spheroids in part by regulating RUNX2 and BGLAP expression. Exp. Ther. Med. 2020, 20, 2013–2020. [Google Scholar] [CrossRef] [PubMed]
  26. Cao, Y.; Wang, Y.; Li, C.; Jiang, Q.; Zhu, L. Effect of TNF-α on the proliferation and osteogenesis of human periodontal mesenchymal stem cells. Exp. Ther. Med. 2021, 21, 434. [Google Scholar] [CrossRef] [PubMed]
  27. Reid, I.R.; Bolland, M.J.; Grey, A. Effects of vitamin D supplements on bone mineral density: A systematic review and meta-analysis. Lancet 2014, 383, 146–155. [Google Scholar] [CrossRef]
  28. DeLuca, H.F. The metabolism and functions of vitamin D. Adv. Exp. Med. Biol. 1986, 196, 361–375. [Google Scholar]
  29. Fischer, V.; Haffner-Luntzer, M.; Prystaz, K.; Vom Scheidt, A.; Busse, B.; Schinke, T.; Amling, M.; Ignatius, A. Calcium and vitamin-D deficiency marginally impairs fracture healing but aggravates posttraumatic bone loss in osteoporotic mice. Sci. Rep. 2017, 7, 7223. [Google Scholar] [CrossRef] [PubMed]
  30. Fernández-Barral, A.; Costales-Carrera, A.; Buira, S.P.; Jung, P.; Ferrer-Mayorga, G.; Larriba, M.J.; Bustamante-Madrid, P.; Domínguez, O.; Real, F.X.; Guerra-Pastrián, L.; et al. Vitamin D differentially regulates colon stem cells in patient-derived normal and tumor organoids. FEBS J. 2020, 287, 53–72. [Google Scholar] [CrossRef]
  31. Hansen, A.K.; Figenschau, Y.; Zubiaurre-Martinez, I. Co-expression of 1α-hydroxylase and vitamin D receptor in human articular chondrocytes. BMC Musculoskelet. Disord. 2017, 18, 432. [Google Scholar] [CrossRef] [PubMed]
  32. Kwiatek, J.; Jaroń, A.; Trybek, G. Impact of the 25-Hydroxycholecalciferol Concentration and Vitamin D Deficiency Treatment on Changes in the Bone Level at the Implant Site during the Process of Osseointegration: A Prospective, Randomized, Controlled Clinical Trial. J. Clin. Med. 2021, 10, 526. [Google Scholar] [CrossRef]
  33. Grønborg, I.M.; Tetens, I.; Andersen, E.W.; Kristensen, M.; Larsen, R.E.K.; Tran, T.L.L.; Andersen, R. Effect of vitamin D fortified foods on bone markers and muscle strength in women of Pakistani and Danish origin living in Denmark: A randomised controlled trial. Nutr. J. 2019, 18, 82. [Google Scholar] [CrossRef] [PubMed]
  34. Kim, H.S.; Zheng, M.; Kim, D.K.; Lee, W.P.; Yu, S.J.; Kim, B.O. Effects of 1,25-dihydroxyvitamin D(3) on the differentiation of MC3T3-E1 osteoblast-like cells. J. Periodontal Implant Sci. 2018, 48, 34–46. [Google Scholar] [CrossRef] [PubMed]
  35. Petrescu, N.B.; Jurj, A.; Sorițău, O.; Lucaciu, O.P.; Dirzu, N.; Raduly, L.; Berindan-Neagoe, I.; Cenariu, M.; Boșca, B.A.; Campian, R.S.; et al. Cannabidiol and Vitamin D3 Impact on Osteogenic Differentiation of Human Dental Mesenchymal Stem Cells. Medicina 2020, 56, 607. [Google Scholar] [CrossRef]
  36. Abdelgawad, L.M.; Abdelaziz, A.M.; Sabry, D.; Abdelgwad, M. Influence of photobiomodulation and vitamin D on osteoblastic differentiation of human periodontal ligament stem cells and bone-like tissue formation through enzymatic activity and gene expression. Biomol. Concepts 2020, 11, 172–181. [Google Scholar] [CrossRef]
  37. Romeu Montenegro, K.; Carlessi, R.; Cruzat, V.; Newsholme, P. Effects of vitamin D on primary human skeletal muscle cell proliferation, differentiation, protein synthesis and bioenergetics. J. Steroid Biochem. Mol. Biol. 2019, 193, 105423. [Google Scholar] [CrossRef]
  38. Gülden, M.; Jess, A.; Kammann, J.; Maser, E.; Seibert, H. Cytotoxic potency of H2O2 in cell cultures: Impact of cell concentration and exposure time. Free Radic. Biol. Med. 2010, 49, 1298–1305. [Google Scholar] [CrossRef] [PubMed]
  39. Song, I.S.; Lee, J.E.; Park, J.B. The Effects of Various Mouthwashes on Osteoblast Precursor Cells. Open Life Sci. 2019, 14, 376–383. [Google Scholar] [CrossRef]
  40. Choi, Y.S.; Baek, K.; Choi, Y. Estrogen reinforces barrier formation and protects against tumor necrosis factor alpha-induced barrier dysfunction in oral epithelial cells. J. Periodontal Implant Sci. 2018, 48, 284–294. [Google Scholar] [CrossRef] [PubMed]
  41. Lee, J.H.; Song, Y.M.; Min, S.K.; Lee, H.J.; Lee, H.L.; Kim, M.J.; Park, Y.H.; Park, J.U.; Park, J.B. NELL-1 Increased the Osteogenic Differentiation and mRNA Expression of Spheroids Composed of Stem Cells. Medicina 2021, 57, 586. [Google Scholar] [CrossRef] [PubMed]
  42. Alnahash, A.Z.; Song, Y.-M.; Min, S.-K.; Lee, H.-J.; Kim, M.-J.; Park, Y.-H.; Park, J.-U.; Park, J.-B. Effects of Connective Tissue Growth Factor on the Cell Viability, Proliferation, Osteogenic Capacity and mRNA Expression of Stem Cell Spheroids. Appl. Sci. 2021, 11, 6572. [Google Scholar] [CrossRef]
  43. Tae, J.Y.; Ko, Y.; Park, J.B. Evaluation of fibroblast growth factor-2 on the proliferation of osteogenic potential and protein expression of stem cell spheroids composed of stem cells derived from bone marrow. Exp. Ther. Med. 2019, 18, 326–331. [Google Scholar] [CrossRef]
  44. Lee, H.; Song, Y.; Park, Y.H.; Uddin, M.S.; Park, J.B. Evaluation of the Effects of Cuminum cyminum on Cellular Viability, Osteogenic Differentiation and Mineralization of Human Bone Marrow-Derived Stem Cells. Medicina 2021, 57, 38. [Google Scholar] [CrossRef]
  45. Yang, H.; Cao, Z.; Wang, Y.; Wang, J.; Gao, J.; Han, B.; Yu, F.; Qin, Y.; Guo, Y. Treadmill exercise influences the microRNA profiles in the bone tissues of mice. Exp. Ther. Med. 2021, 22, 1035. [Google Scholar] [CrossRef] [PubMed]
  46. Jung, H.; Rim, Y.A.; Park, N.; Nam, Y.; Ju, J.H. Restoration of Osteogenesis by CRISPR/Cas9 Genome Editing of the Mutated COL1A1 Gene in Osteogenesis Imperfecta. J. Clin. Med. 2021, 10, 3141. [Google Scholar] [CrossRef]
  47. Bosetti, M.; Borrone, A.; Leigheb, M.; Shastri, V.P.; Cannas, M. Injectable Graft Substitute Active on Bone Tissue Regeneration. Tissue Eng. Part A 2017, 23, 1413–1422. [Google Scholar] [CrossRef] [PubMed]
  48. Nah, H.; Lee, D.; Heo, M.; Lee, J.S.; Lee, S.J.; Heo, D.N.; Seong, J.; Lim, H.N.; Lee, Y.H.; Moon, H.J.; et al. Vitamin D-conjugated gold nanoparticles as functional carriers to enhancing osteogenic differentiation. Sci. Technol. Adv. Mater. 2019, 20, 826–836. [Google Scholar] [CrossRef]
  49. Kim, S.; Lee, S.; Kim, K. Bone Tissue Engineering Strategies in Co-Delivery of Bone Morphogenetic Protein-2 and Biochemical Signaling Factors. Adv. Exp. Med. Biol. 2018, 1078, 233–244. [Google Scholar]
  50. Xiong, Y.; Zhang, Y.; Guo, Y.; Yuan, Y.; Guo, Q.; Gong, P.; Wu, Y. 1α,25-Dihydroxyvitamin D(3) increases implant osseointegration in diabetic mice partly through FoxO1 inactivation in osteoblasts. Biochem. Biophys. Res. Commun. 2017, 494, 626–633. [Google Scholar] [CrossRef]
Figure 1. Study flow diagram illustrating the overview.
Medicina 57 01271 g001
Figure 2. (A) The morphologies of stem cell spheroids treated with different concentrations of vitamin D on days 1, 3, 7, and 14. The scale bar represents 200 μm (original magnification ×200). (B) The diameters of the stem cell spheroids on days 1, 3, 7, and 14. * p < 0.05 vs. time-matched 0 nM group.
Medicina 57 01271 g002
Figure 3. (A) Optical, live, dead, and merged cell images of stem cell spheroids on day 1. (B) Optical, live, dead, and merged cell images of stem cell spheroids on day 7. The scale bar represents 100 μm (original magnification ×100). (C) Cell viability using Cell Counting Kit-8 on days 1, 3, 7, and 14.
Medicina 57 01271 g003aMedicina 57 01271 g003b
Figure 4. Graphical representation of alkaline phosphatase activity results on days 7 and 14. * p < 0.05 vs. time-matched 0 nM group.
Medicina 57 01271 g004
Figure 5. (A) Quantification of expression of RUNX2 mRNA by real-time polymerase chain reaction on days 7 and 14. * p < 0.05 versus the 0 nM on day 7. ** p < 0.05 versus the 1 and 10 nM groups on day 7. # p < 0.05 versus the 0 nM group on day 14. ## p < 0.05 versus the 0 nM group on day 14. ### p < 0.05 versus the 10 nM group on day 14. (B) Quantification of expression of BSP mRNA by real-time polymerase chain reaction on days 7 and 14. * p < 0.05 versus the 0 nM on day 7. ** p < 0.05 versus the 10 nM group on day 7. # p < 0.05 versus the 0 nM group on day 14. ## p < 0.05 versus the 0 nM group on day 14. ### p < 0.05 versus the 0.1 nM group on Day 14. #### p < 0.05 versus the 10 nM group on day 14. (C) Quantification of expression of OCN mRNA by real-time polymerase chain reaction on days 7 and 14. * p < 0.05 versus the 0 nM on day 7. ** p < 0.05 versus the 10 nM group on day 7. # p < 0.05 versus the 0 nM group on day 14. ## p < 0.05 versus the 1 nM group on day 14. ### p < 0.05 versus the 10 nM group on day 14. (D) Quantification of expression of COL1A1 mRNA by real-time polymerase chain reaction on days 7 and 14. * p < 0.05 versus the 0 nM on day 7. ** p < 0.05 versus the 1 nM group on day 7. *** p < 0.05 versus the 10 nM group on day 7. # p < 0.05 versus the 0 nM group on day 14. ## p < 0.05 versus the 0 nM group on day 14. ### p < 0.05 versus the 10 nM group on day 14.
Medicina 57 01271 g005aMedicina 57 01271 g005b
Publisher’s Note: MDPI stays neutral with regard to jurisdictional claims in published maps and institutional affiliations.

