1. Introduction
Alzheimer Disease (AD), one of the most prevailing types of dementia, is a neurodegenerative disorder with a worldwide occurrence, which is strongly related to the aging process [
1]. The age by which the AD appears determines its characteristic form [
1,
2]. Its clinical phenotype is characterized by progressive memory disturbances, hallucinations, speaking or communication difficulties, and orientation as well as motor disorders [
2,
3,
4].
Numerous histopathalogical modifications take place in the AD patients’ brain that eventually lead to general brain atrophy mainly in the temporal and frontal lobes [
5,
6,
7,
8]. The senile plaques, the neurofibrillary tangles, and the early degeneration or death of neurons are indicative biomarkers of the AD [
5].
Several studies have already been conducted in order to provide a full-spectrum theory of AD’s pathogenesis [
9]. Complex biochemical, molecular, and cellular abnormalities, together with multiple gene mutations inducing neurodysfunction and neurodegeneration, are involved in Alzheimer’s manifestation [
9].
Despite the progress in research, providing insight into the pathophysiology of AD, the therapeutic options of dementia syndrome still remain a challenge. Transcranial Magnetic Stimulation, as many studies imply, can positively modify brain activity in AD and thus, mitigate clinical symptoms [
10]. The brain stimulation frequencies mainly used up to now are >3 Hz with the effect on AD profile being depended on various factors and parameters [
10].
In our clinical trial, in order to estimate the atypical magnetic fields, due to abnormal neuronal activity of the AD patients’ brain, we used the sensitive technique of the Transcranial MagnetoEncephaloGraphy (T-MEG) [
11,
12]. This magnetic field of the brain is the result of the cellular ionic activity due to the dynamical alterations of the neuron membrane potentials. It is very weak, approximately pT = 10
−12 T, and can easily be detected and scored by using MEG recordings [
13].
Our goal is to detect possible alterations in the front temporal lobes of the patient’s AD brain through the use of pT-TMS electronic device after applying FFT analysis [
14]. This device is a 122-coil helmet, arranged in five groups disposition, which covers the main 7 brain areas of the patient (
Table 1) and is designed to create pT-TMS range modulations of magnetic flux in the alpha frequency range (8–13 Hz) for every patient [
14]. The pT-TMS device format is to produce a square wave equivalent to the neuron’s interaction or communication in the brain [
15,
16,
17,
18,
19,
20].
2. Materials and Methods
2.1. Sample
The study sample included 10 volunteer patients, 7 male, and 3 female. All the patients that were referred to our laboratory of Medical Physics by neurologists, were diagnosed with AD and had normal complete serum biochemical profile. The patients’ age scale in the present study was from 55 to 72 years.
All AD patients prior the procedure, were informed and gave their consent for the methodology and the aim of the study.
The Research Committee of Democritus University of Thrace gave its approval for the protocol of our study.
The General Secretariat of Research and Technology, GR, and the ERGO AEBE INC, GR (Grant Number: 80623) funded the research.
2.2. Procedure
The study was planned for 3 days duration. The first day (day 1) every AD patient underwent, ensuring alertness, a 2 min brain scannin2g session, through the use of the whole head 122-channel 2nd order gradiometer device NEUROMAG-122 SQUID (Neuromag-122, Neuromag Ltd., Helsinki, Finland), and thus, MEG signals were recorded for each subject before pT-TMS. The whole-head 122 channel MEG system, embodied in a specially designed room in order to diminish the magnetic noise and provide accurate results, has already been described in our previous publications [
15,
16,
17,
18,
19,
20].
The second day (day 2) pT-TMS was applied for 60 s on each participant with a whole head device, especially designed to adjust in the Alpha Brain Frequency of every subject (customized brain stimulation). [
16,
17,
18,
19,
20]. Afterward, a 2 min post-stimulus MEG recording was performed. The same procedure was repeated on the third day (day 3) with the presence of neurologists, thus as to perform a clinical and neuropsychological examination of the group.
2.3. Data Acquisition
In order to score the Primary Dominant Frequencies (PDF) changes, we developed a software program [
15,
16,
17,
18,
19,
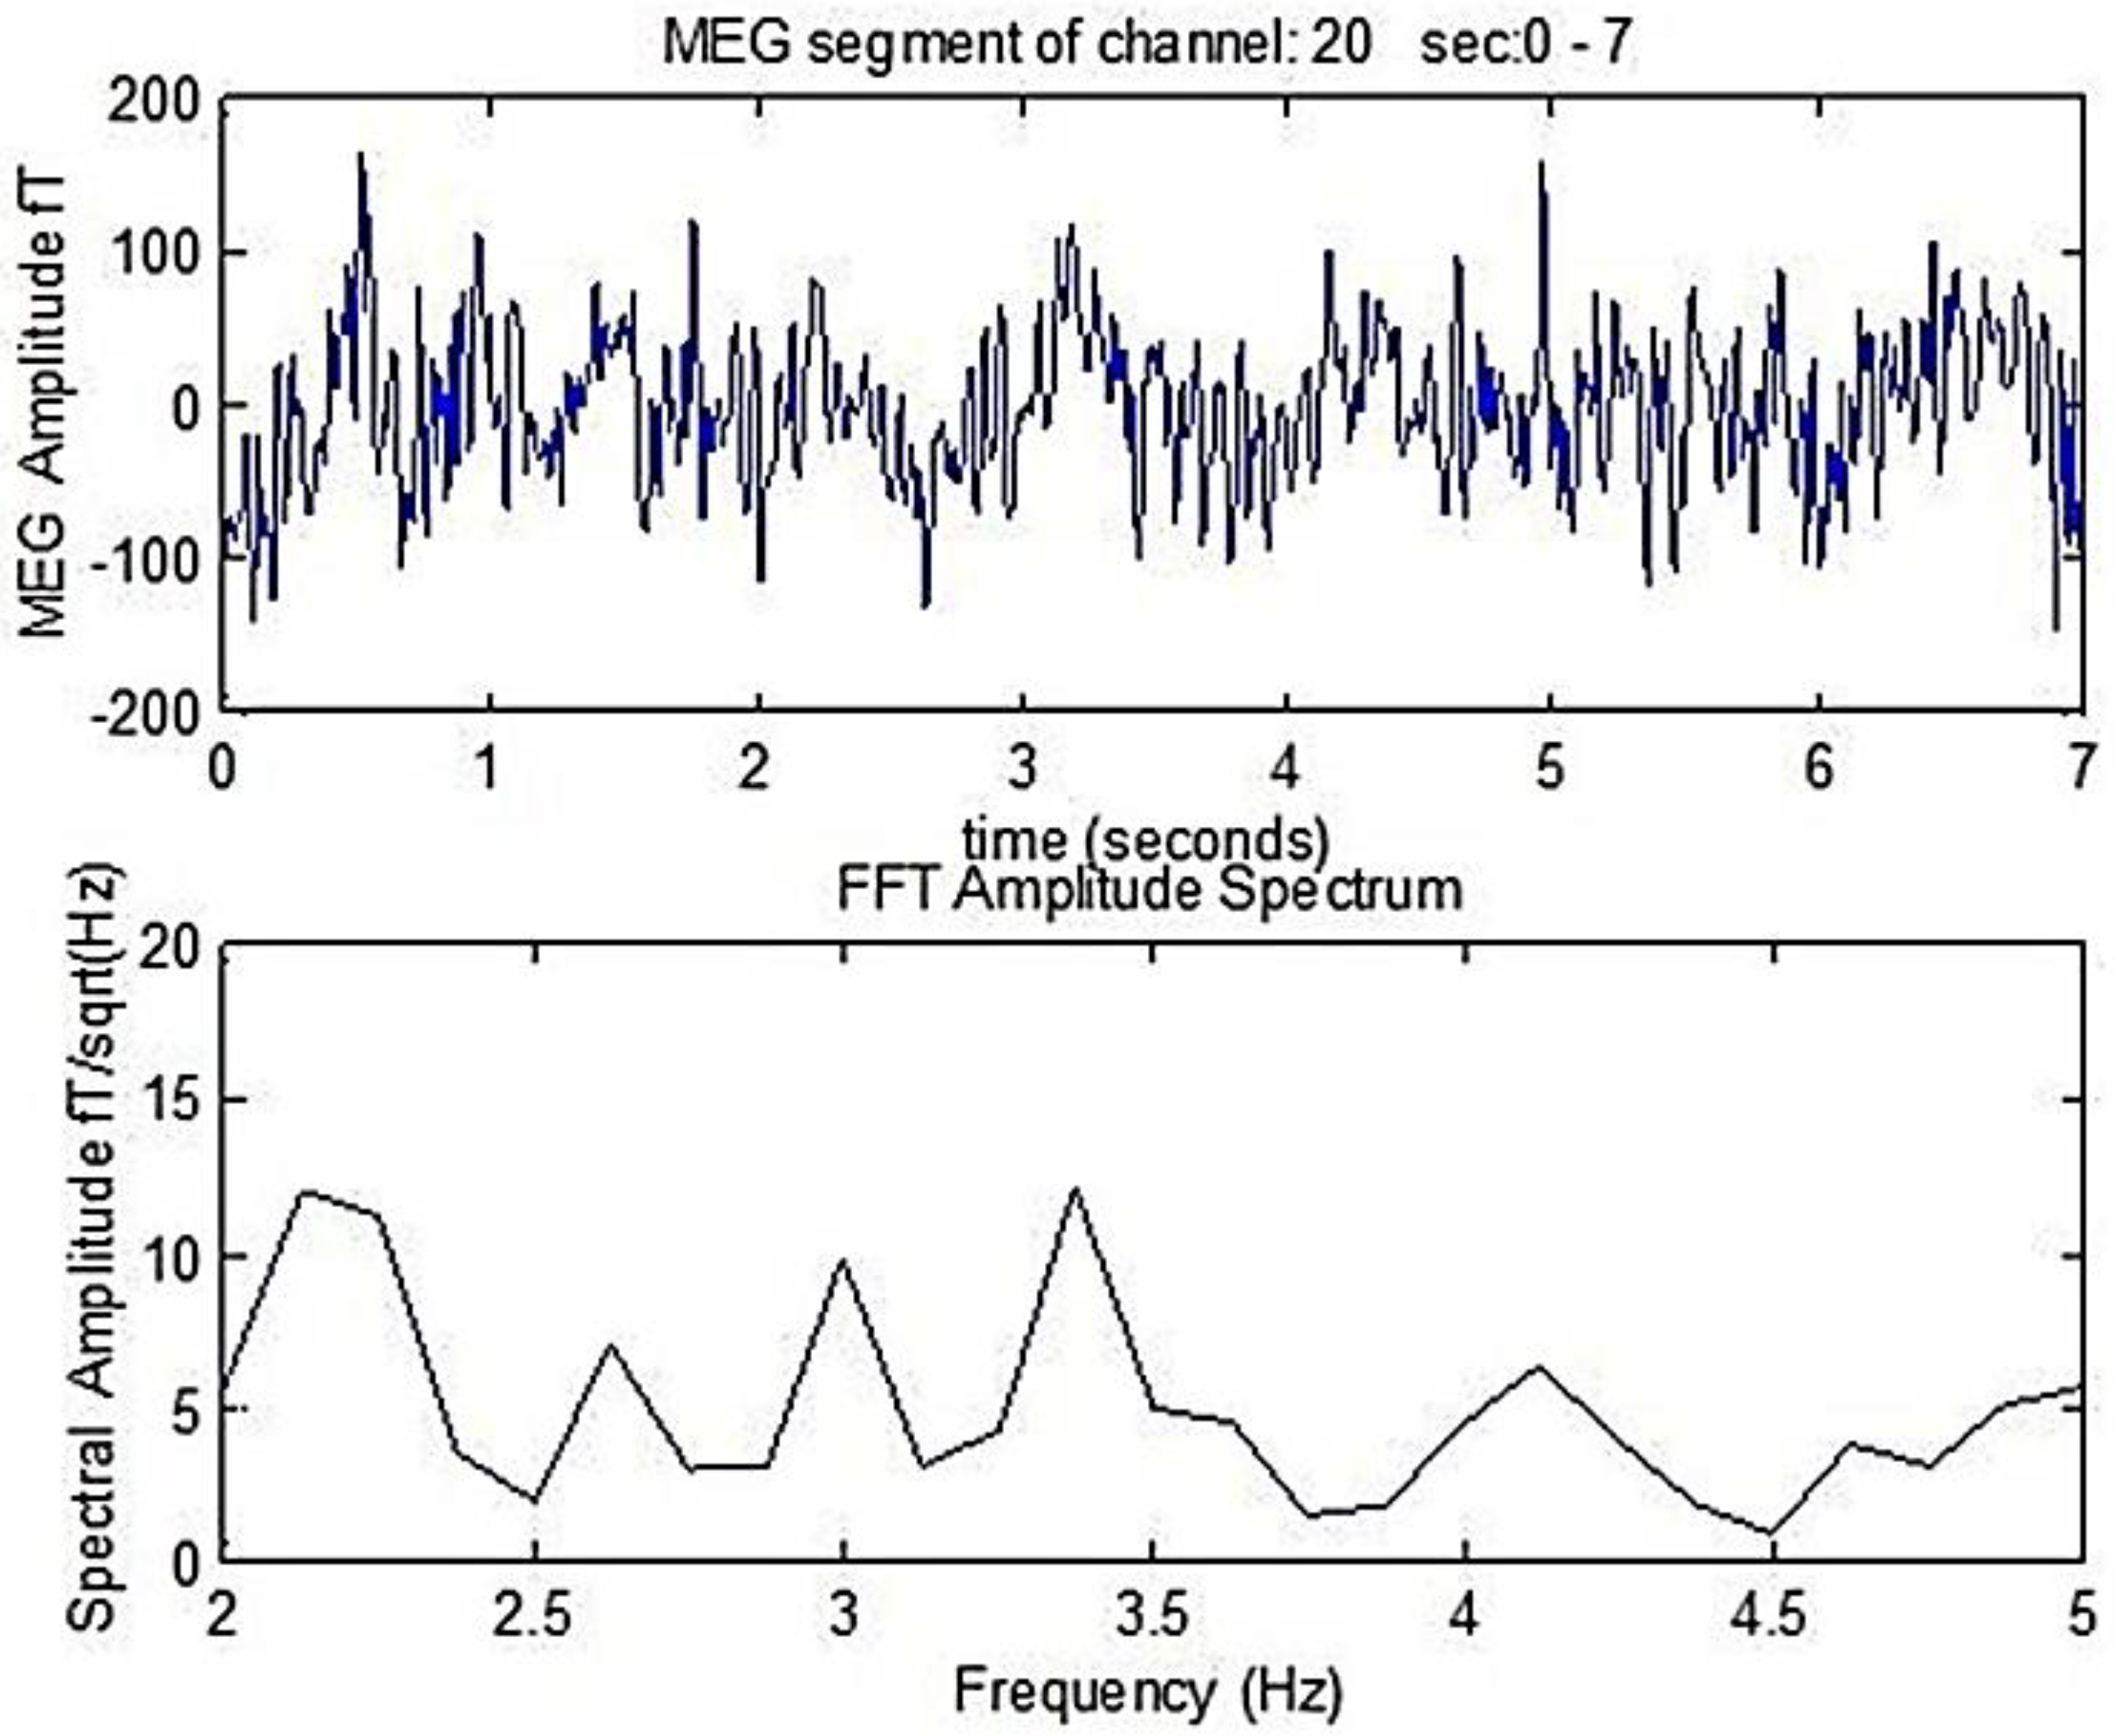
20], which detects the PDF of the power spectra of the MEG obtained from AD patients affected brain region prior and following weak TMS. The primary frequency of each signal was detected after applying Fast Fourier Transform (FFT), as is shown in
Figure 1. There a 7 s duration MEG segment of an AD patient is shown, as well as the corresponding amplitude spectrum that is derived following the FFT analysis. The primary dominant frequency in the amplitude spectrum shown in
Figure 1 is 2.1 Hz.
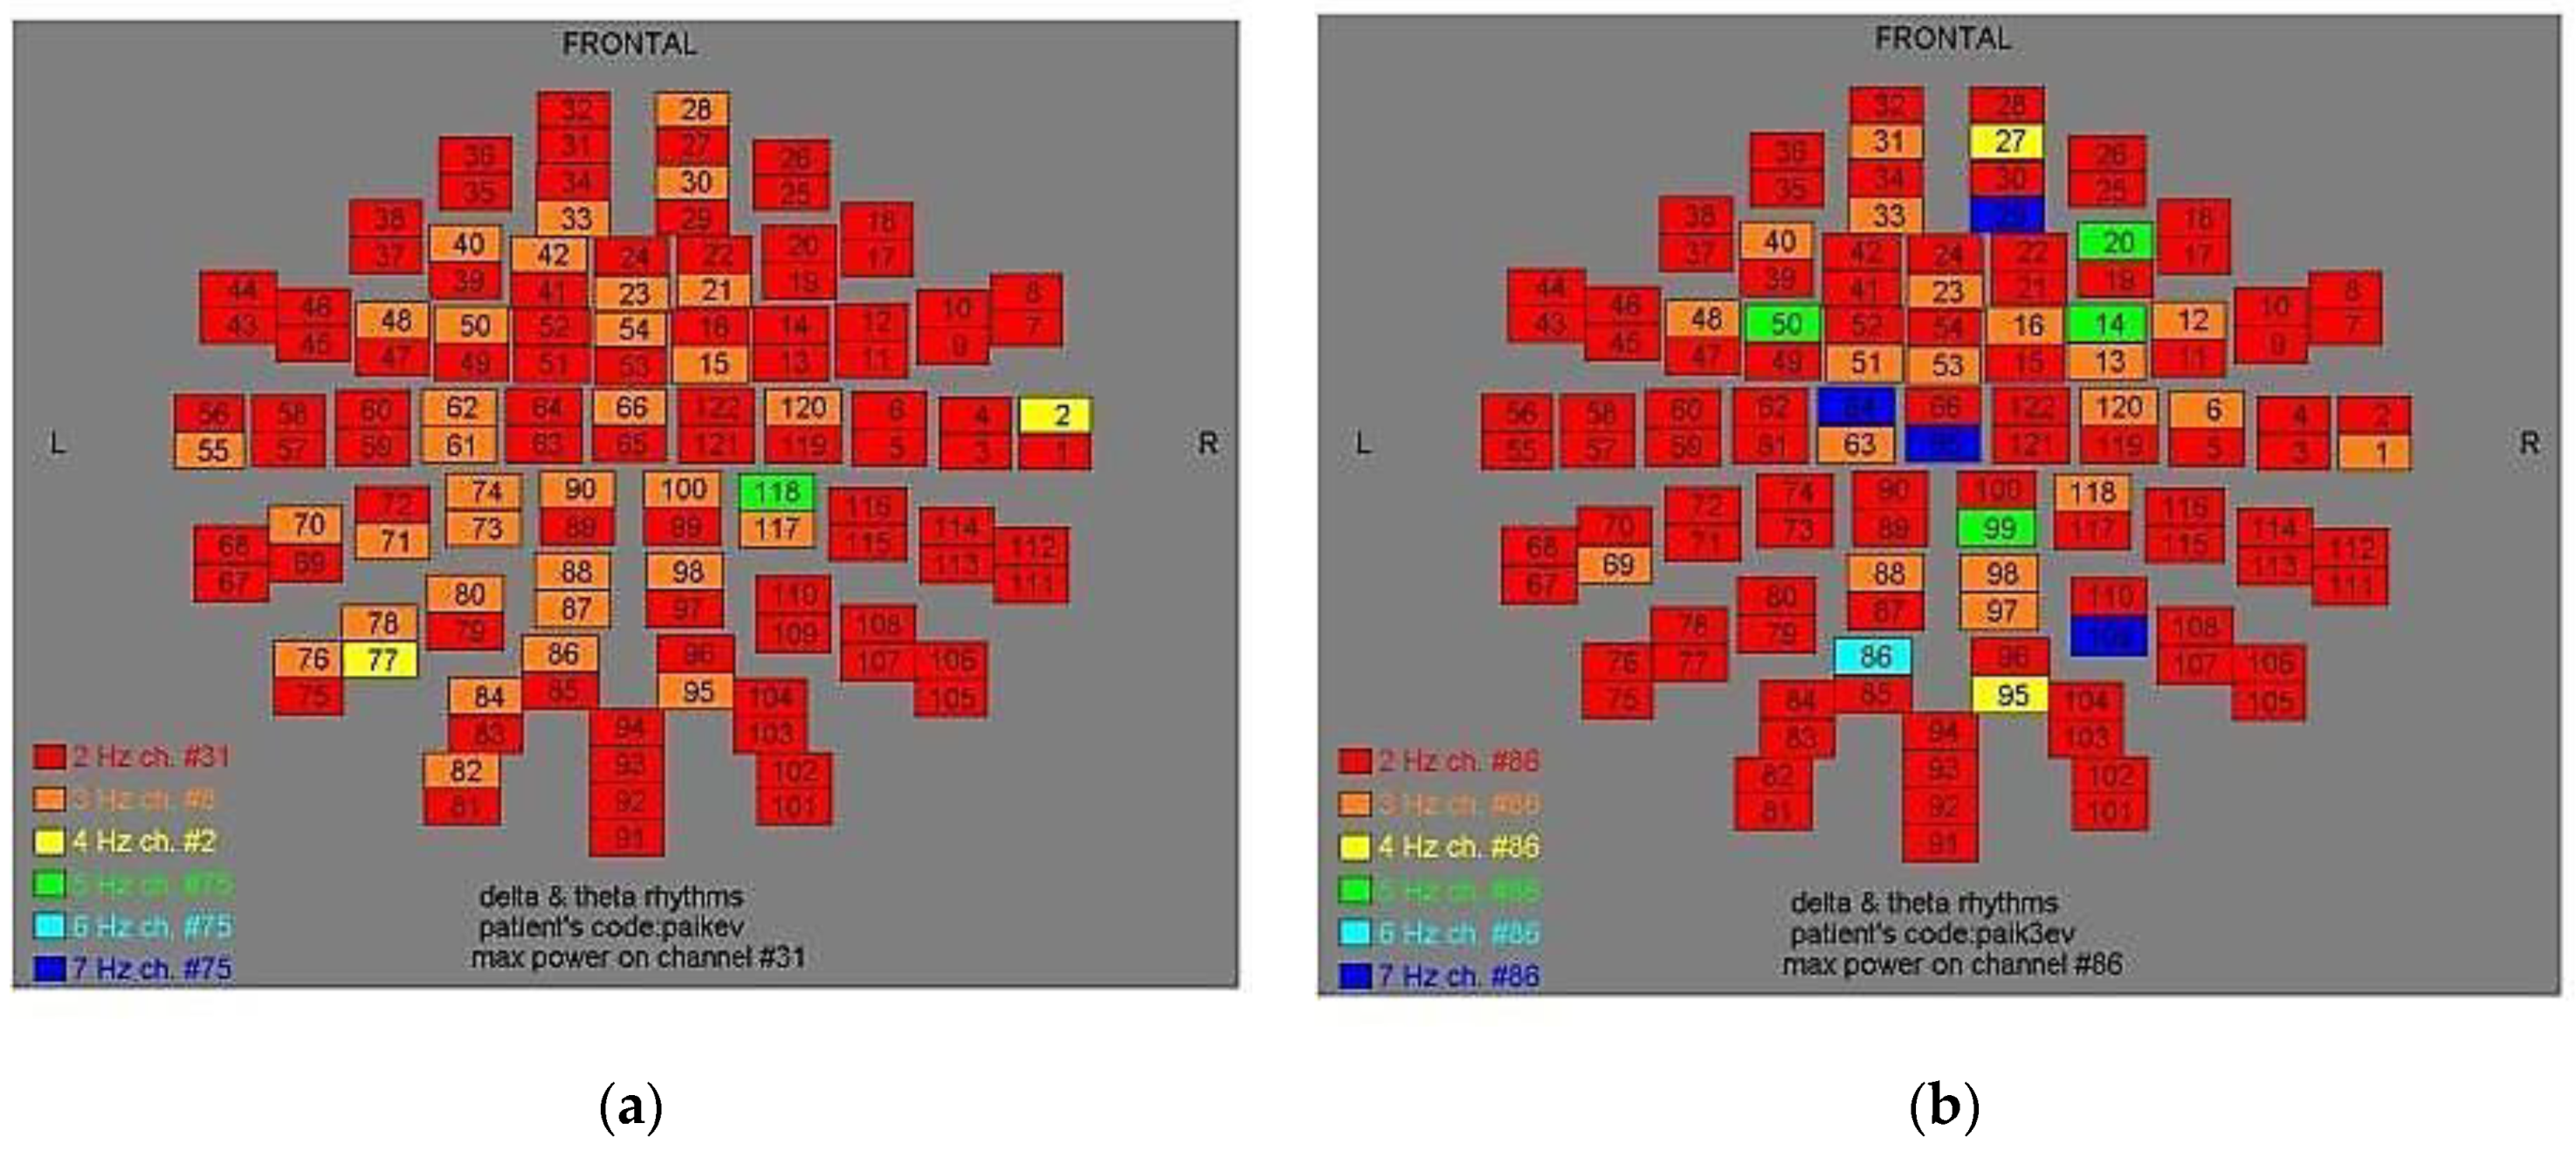
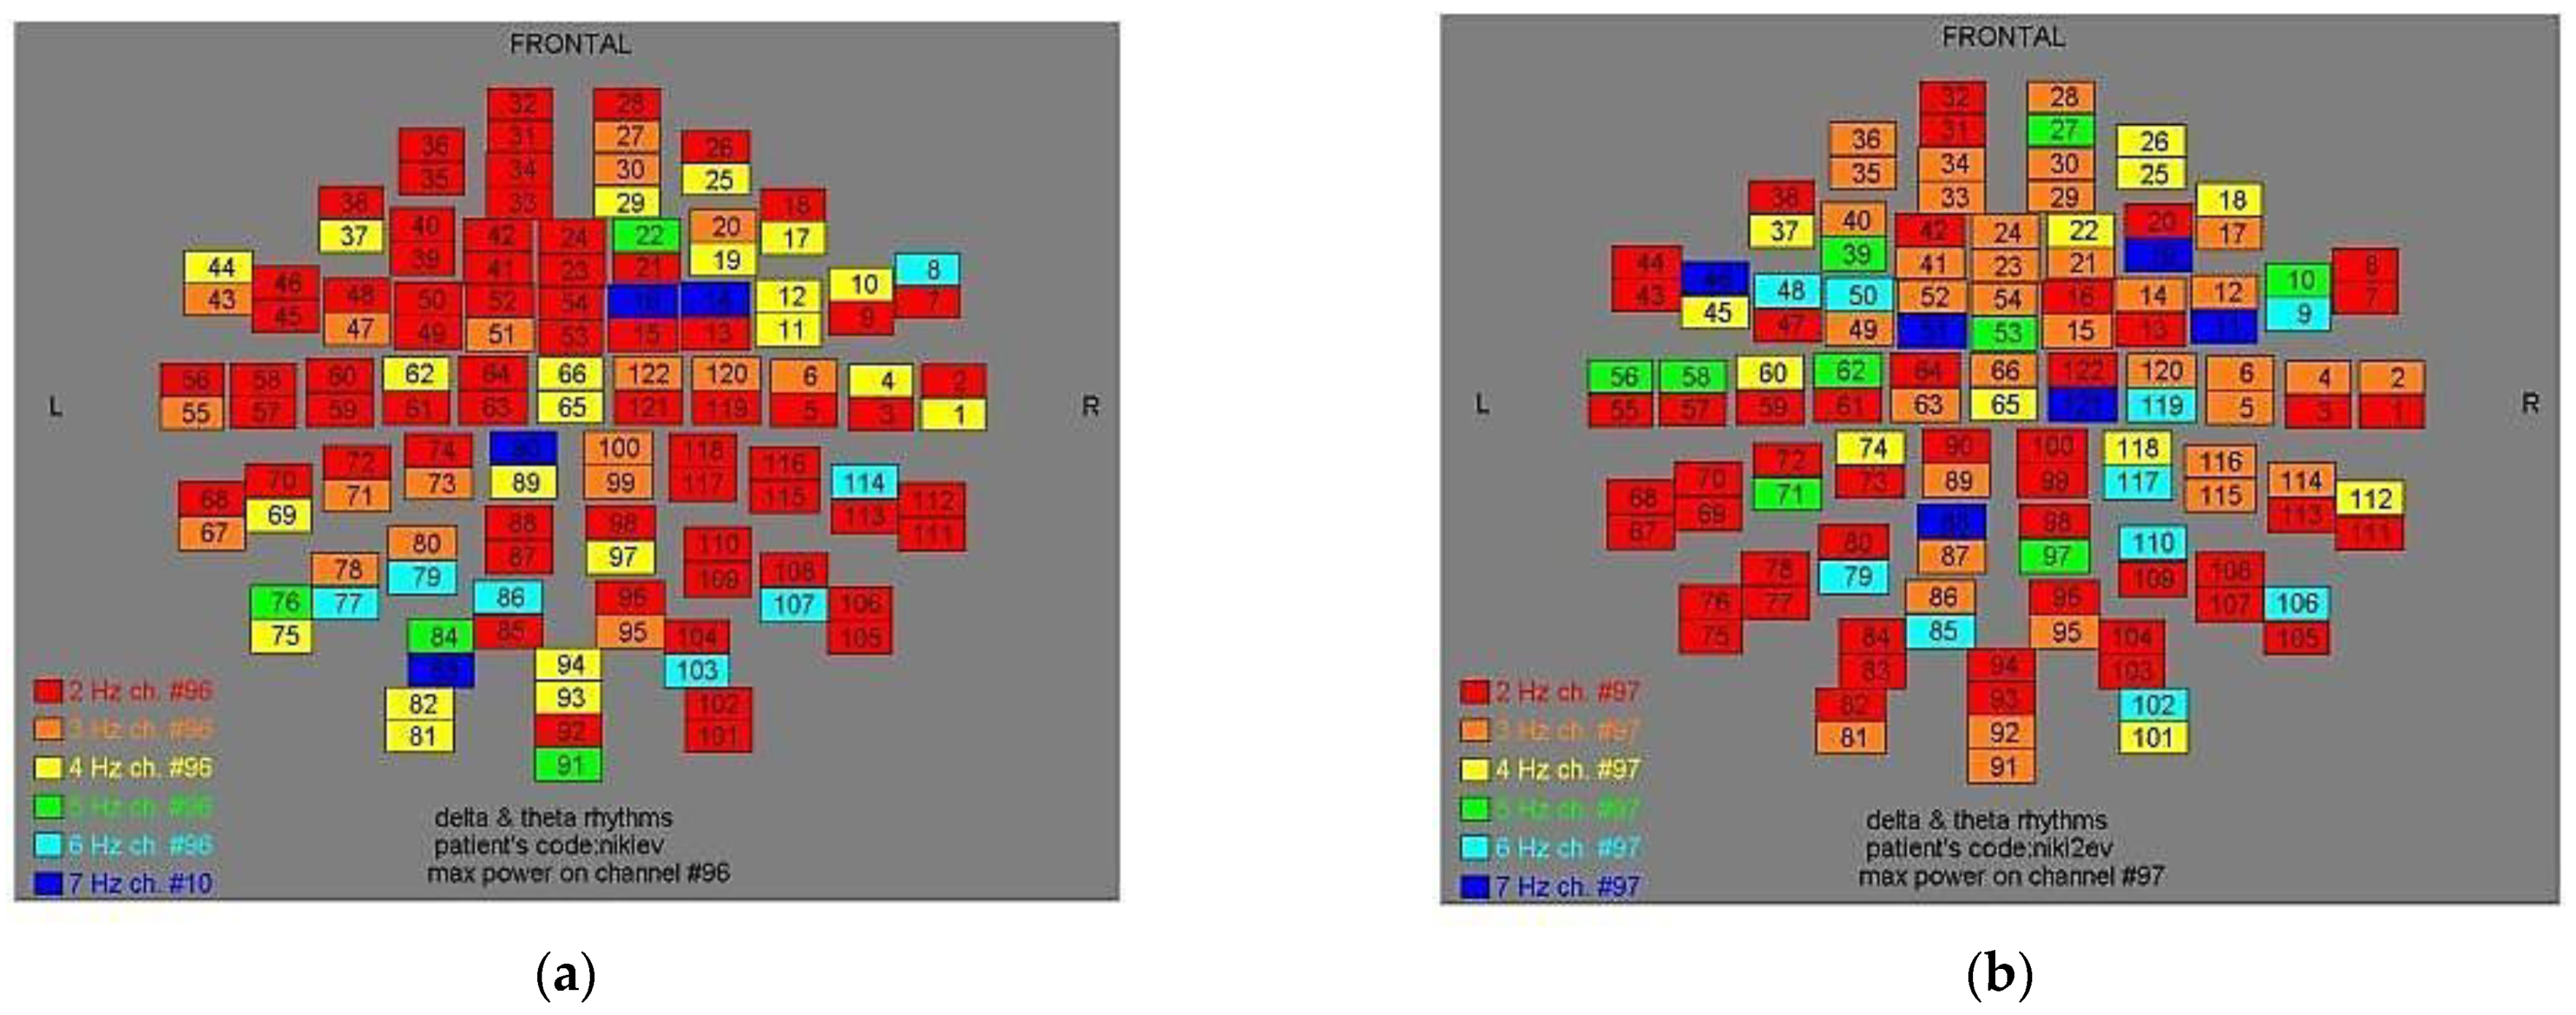
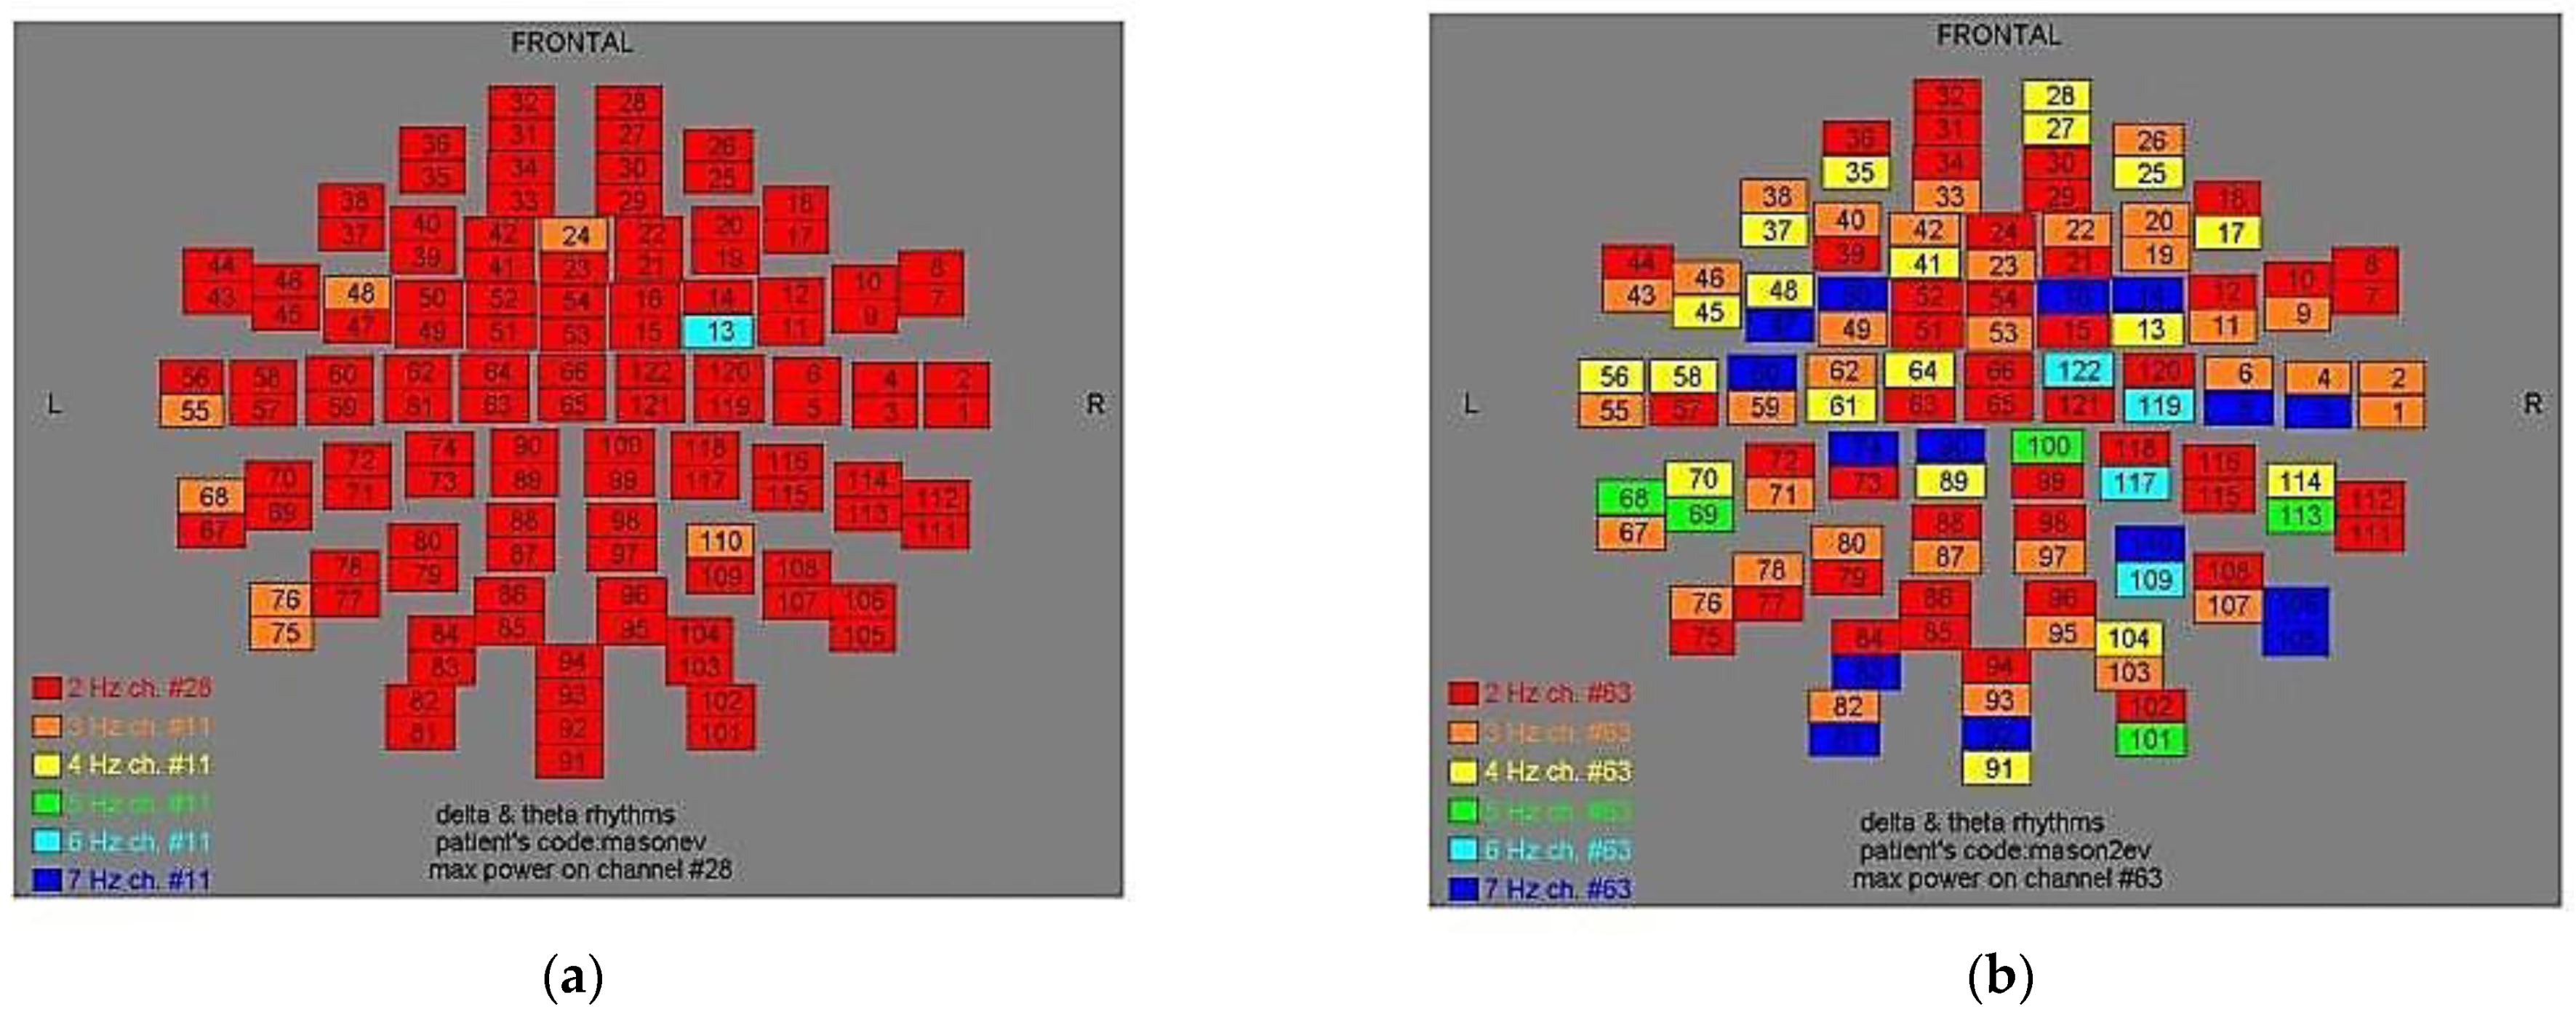
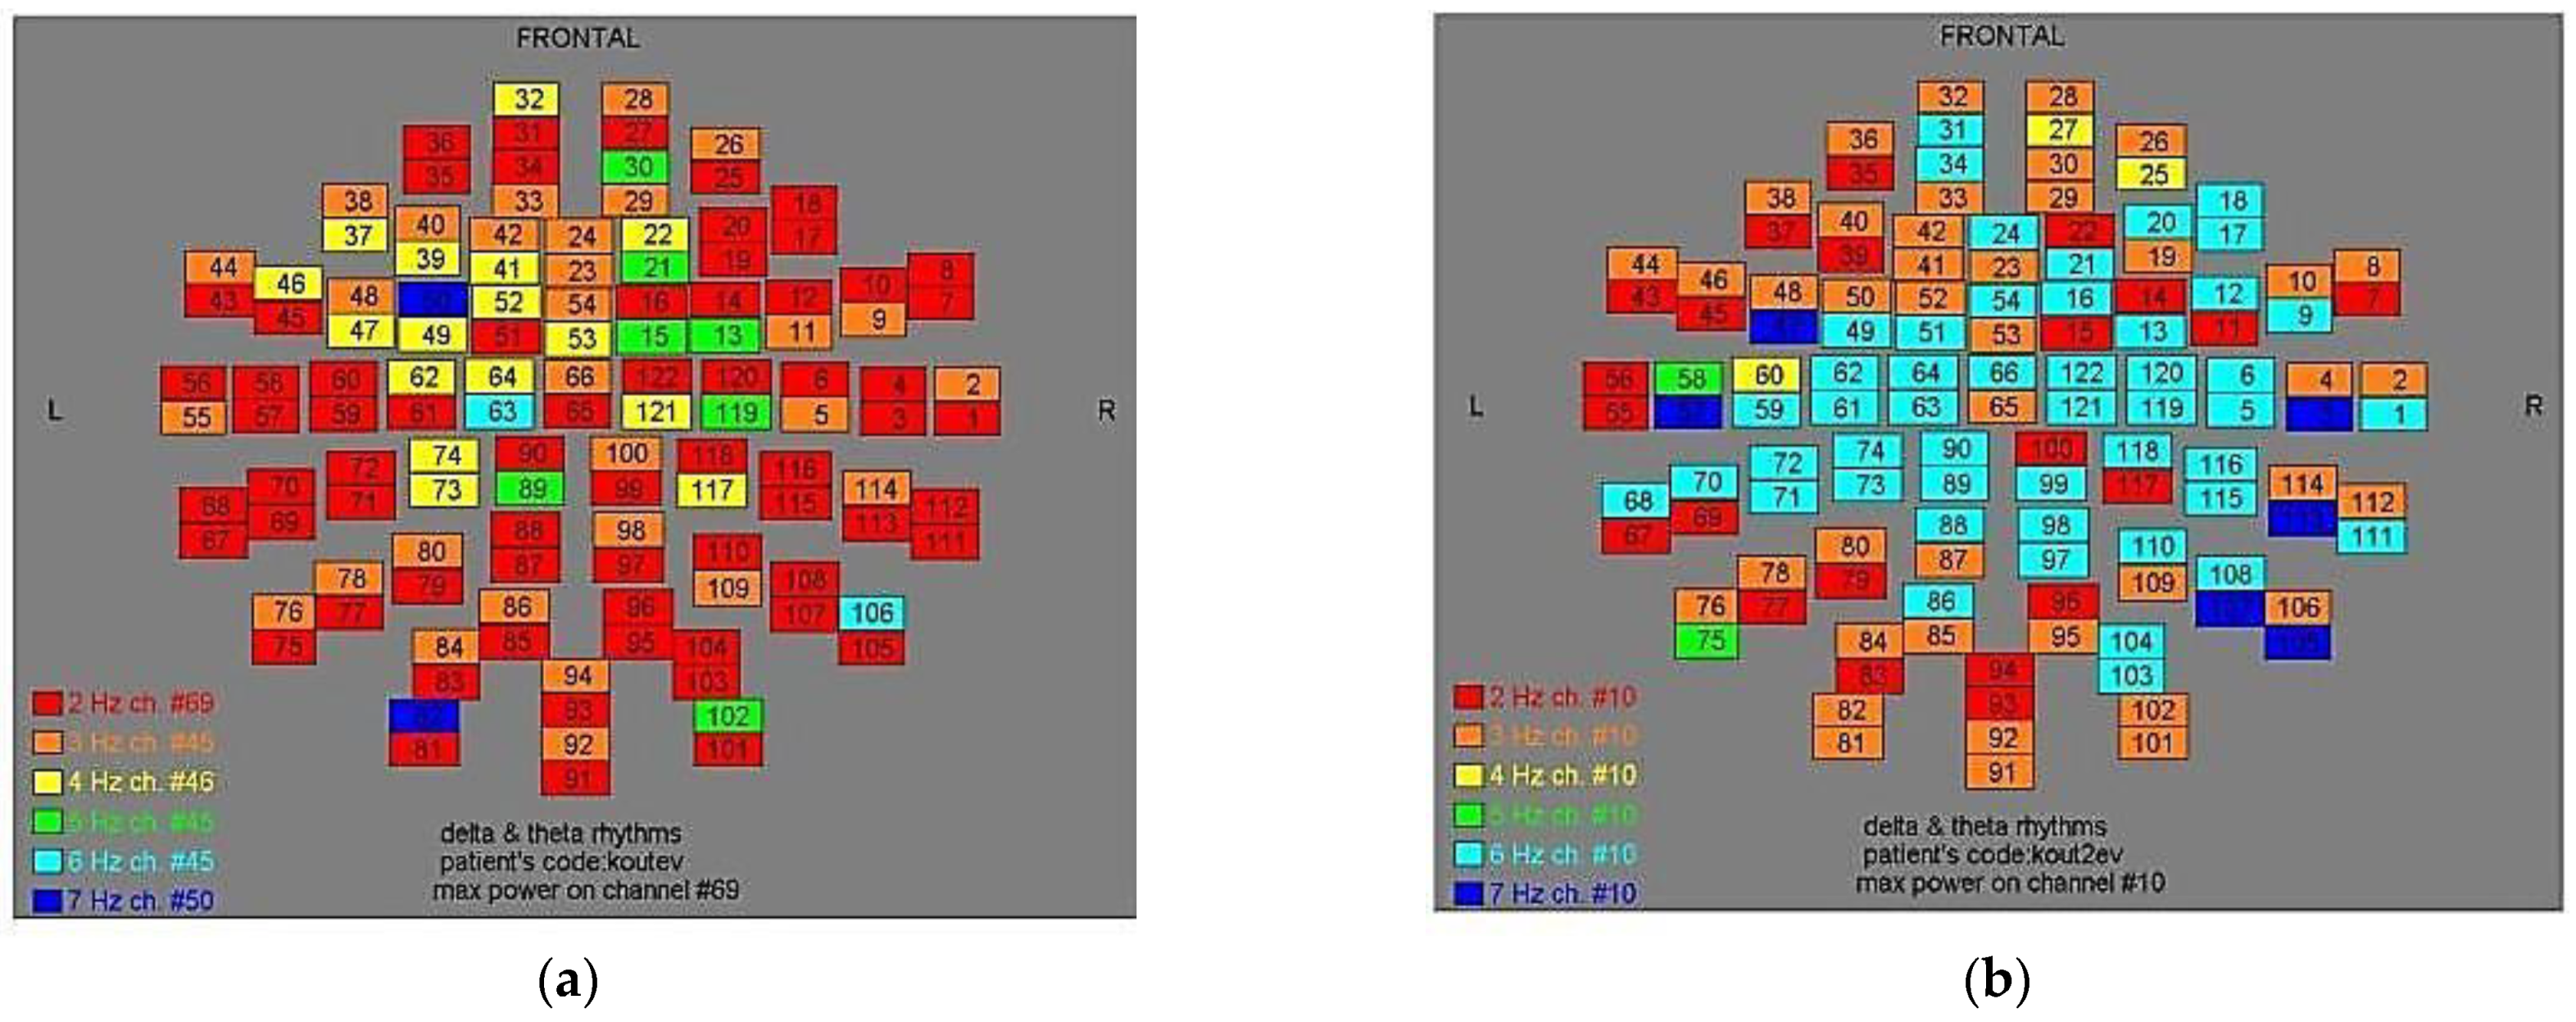
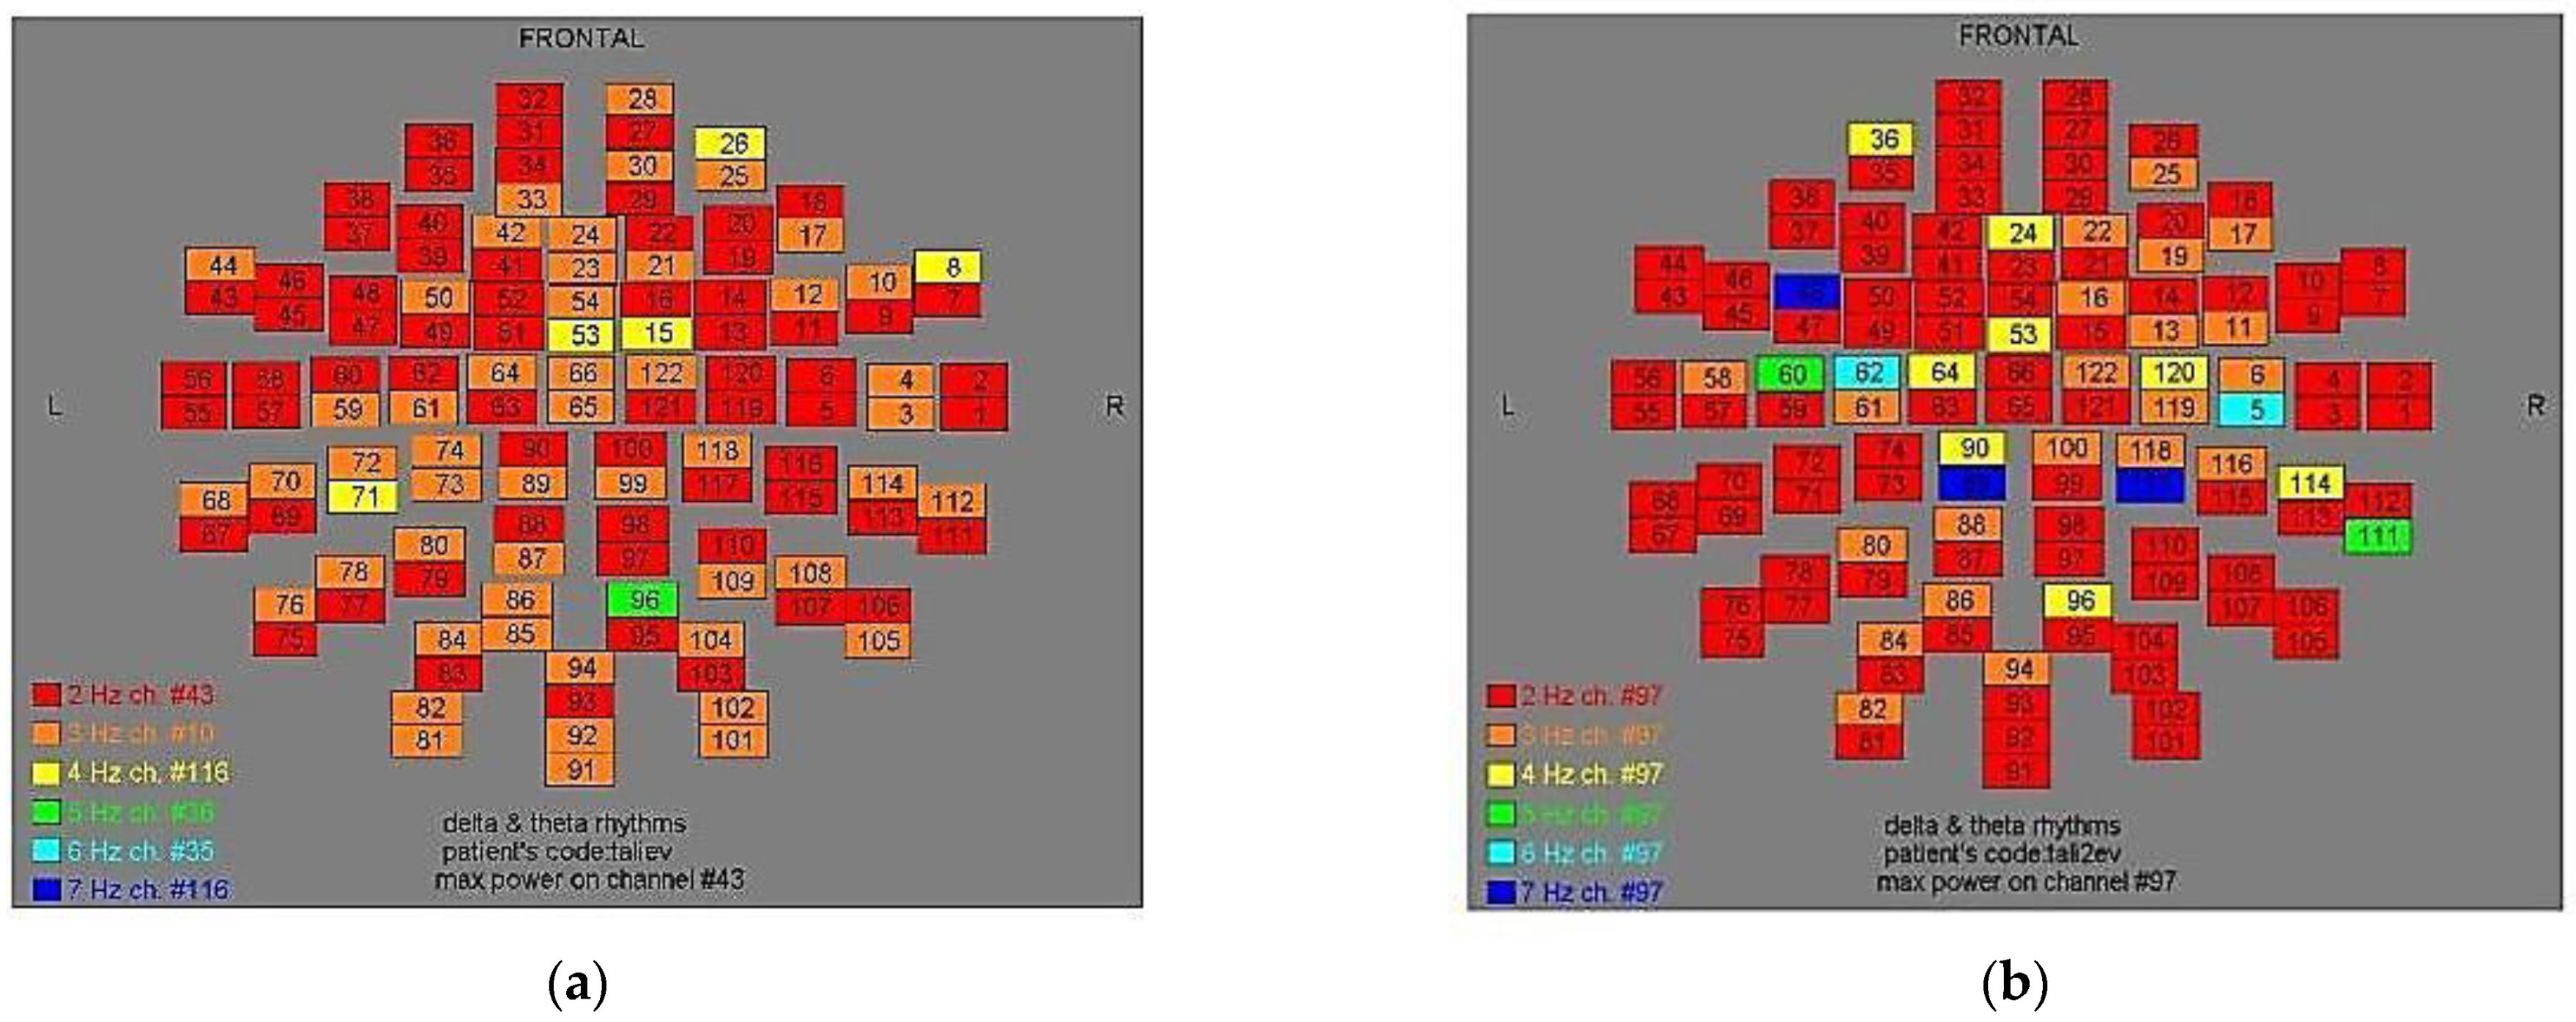
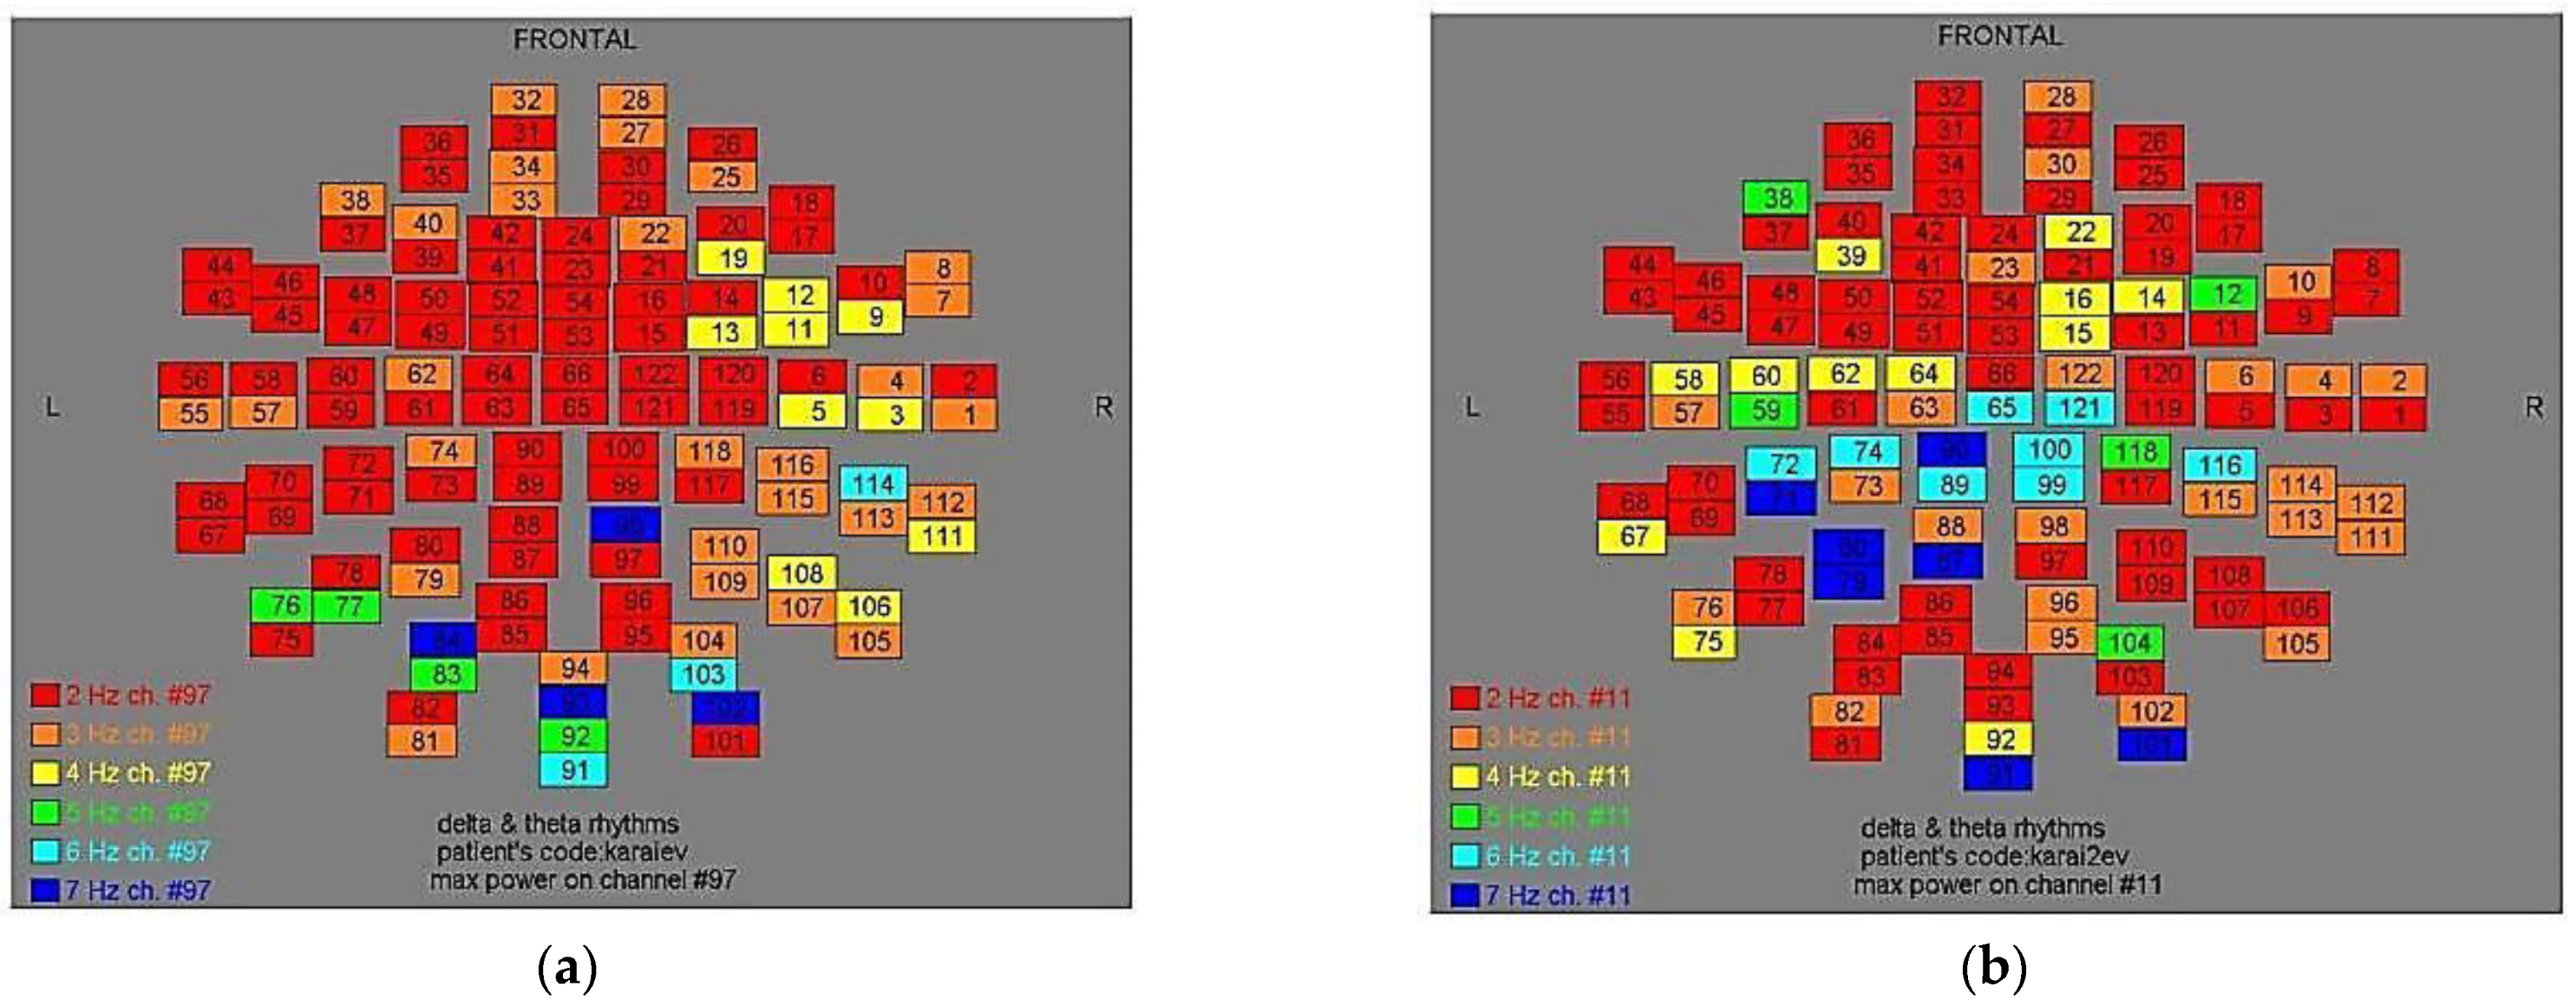
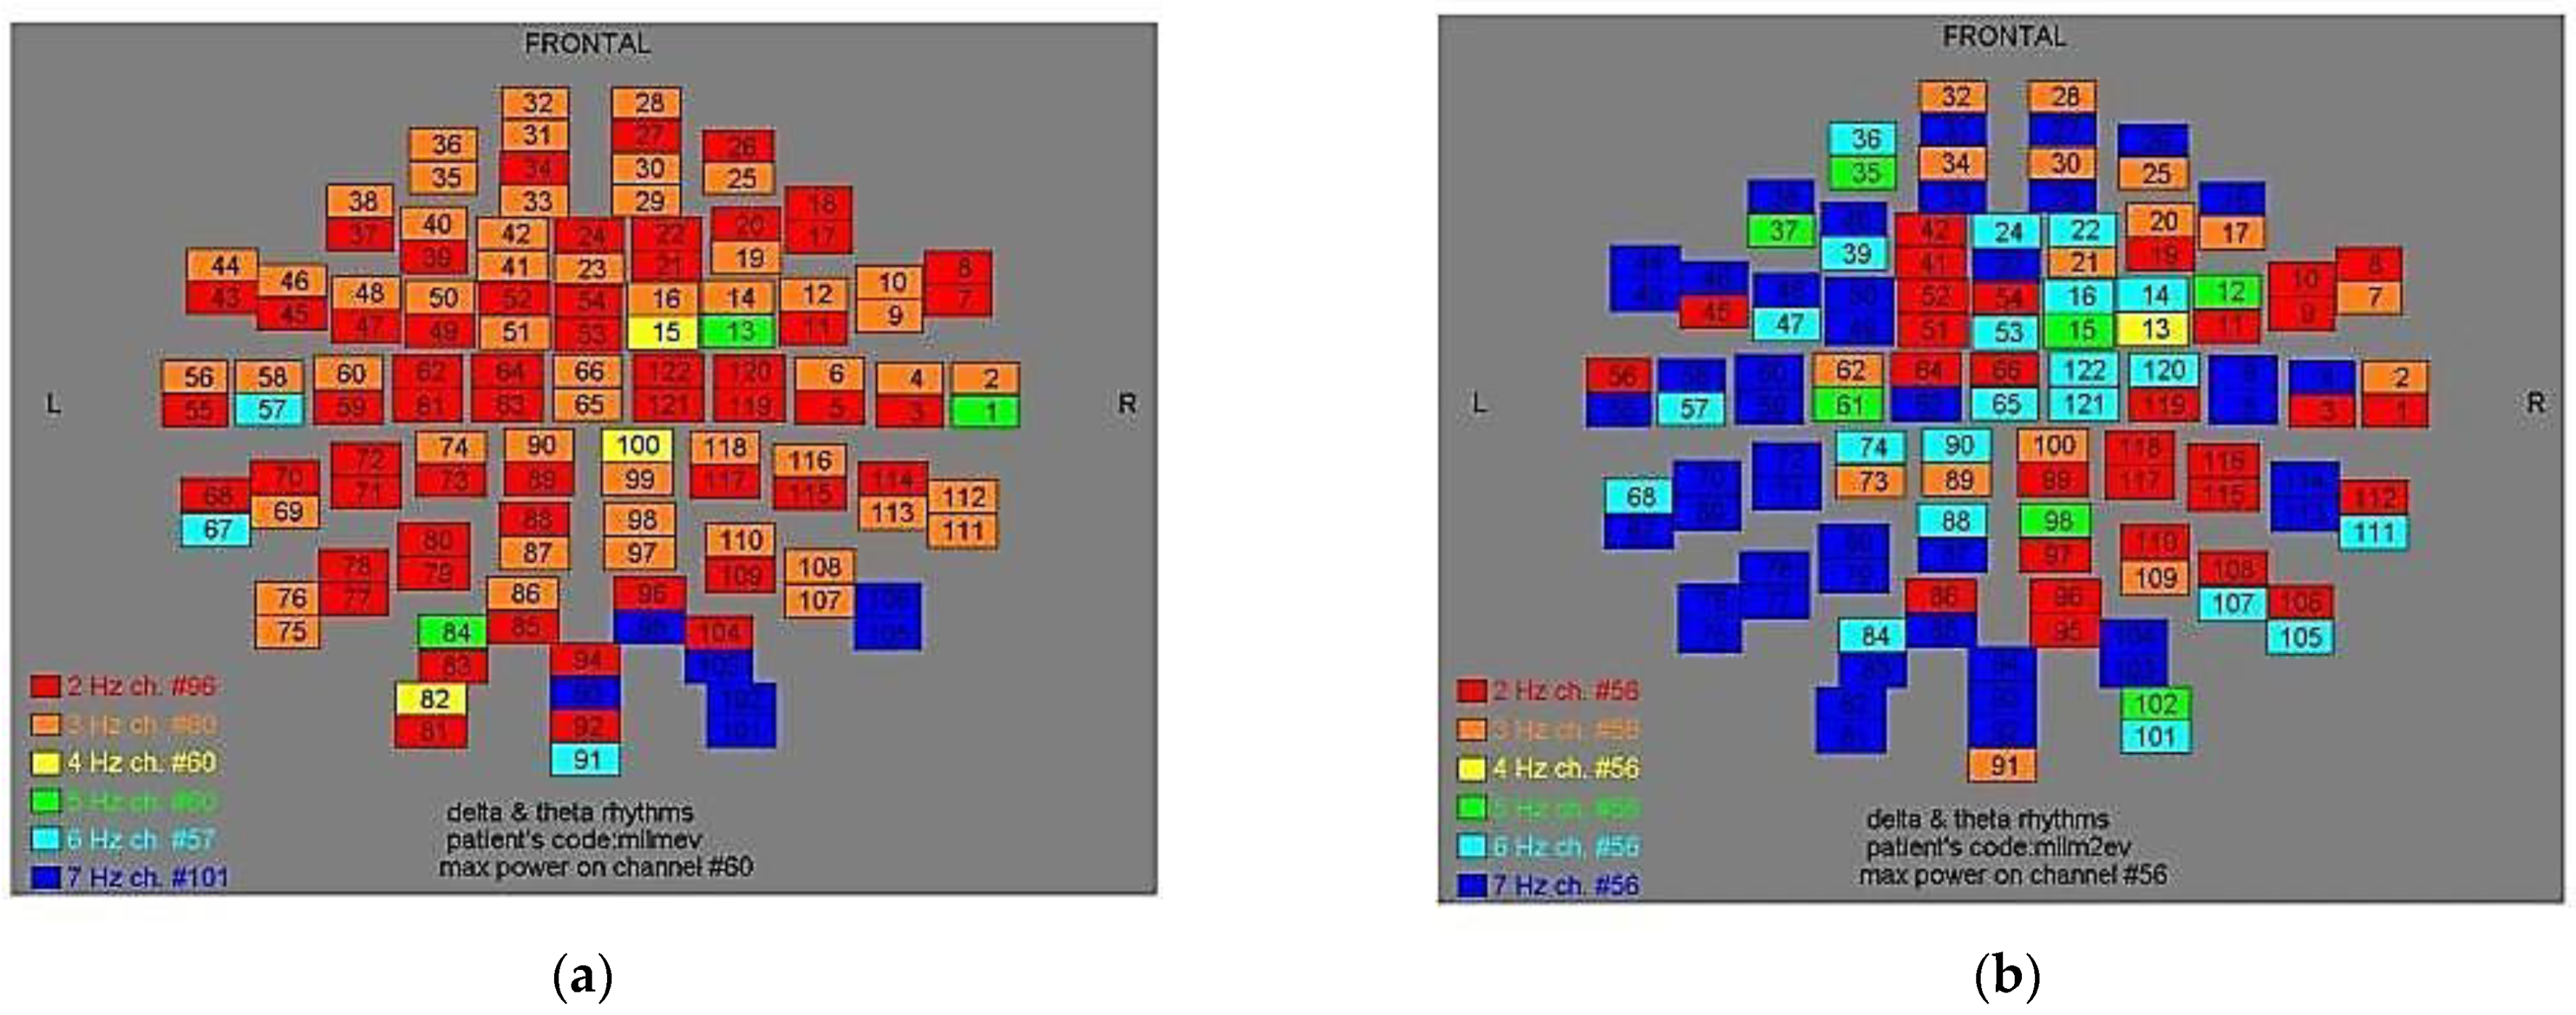
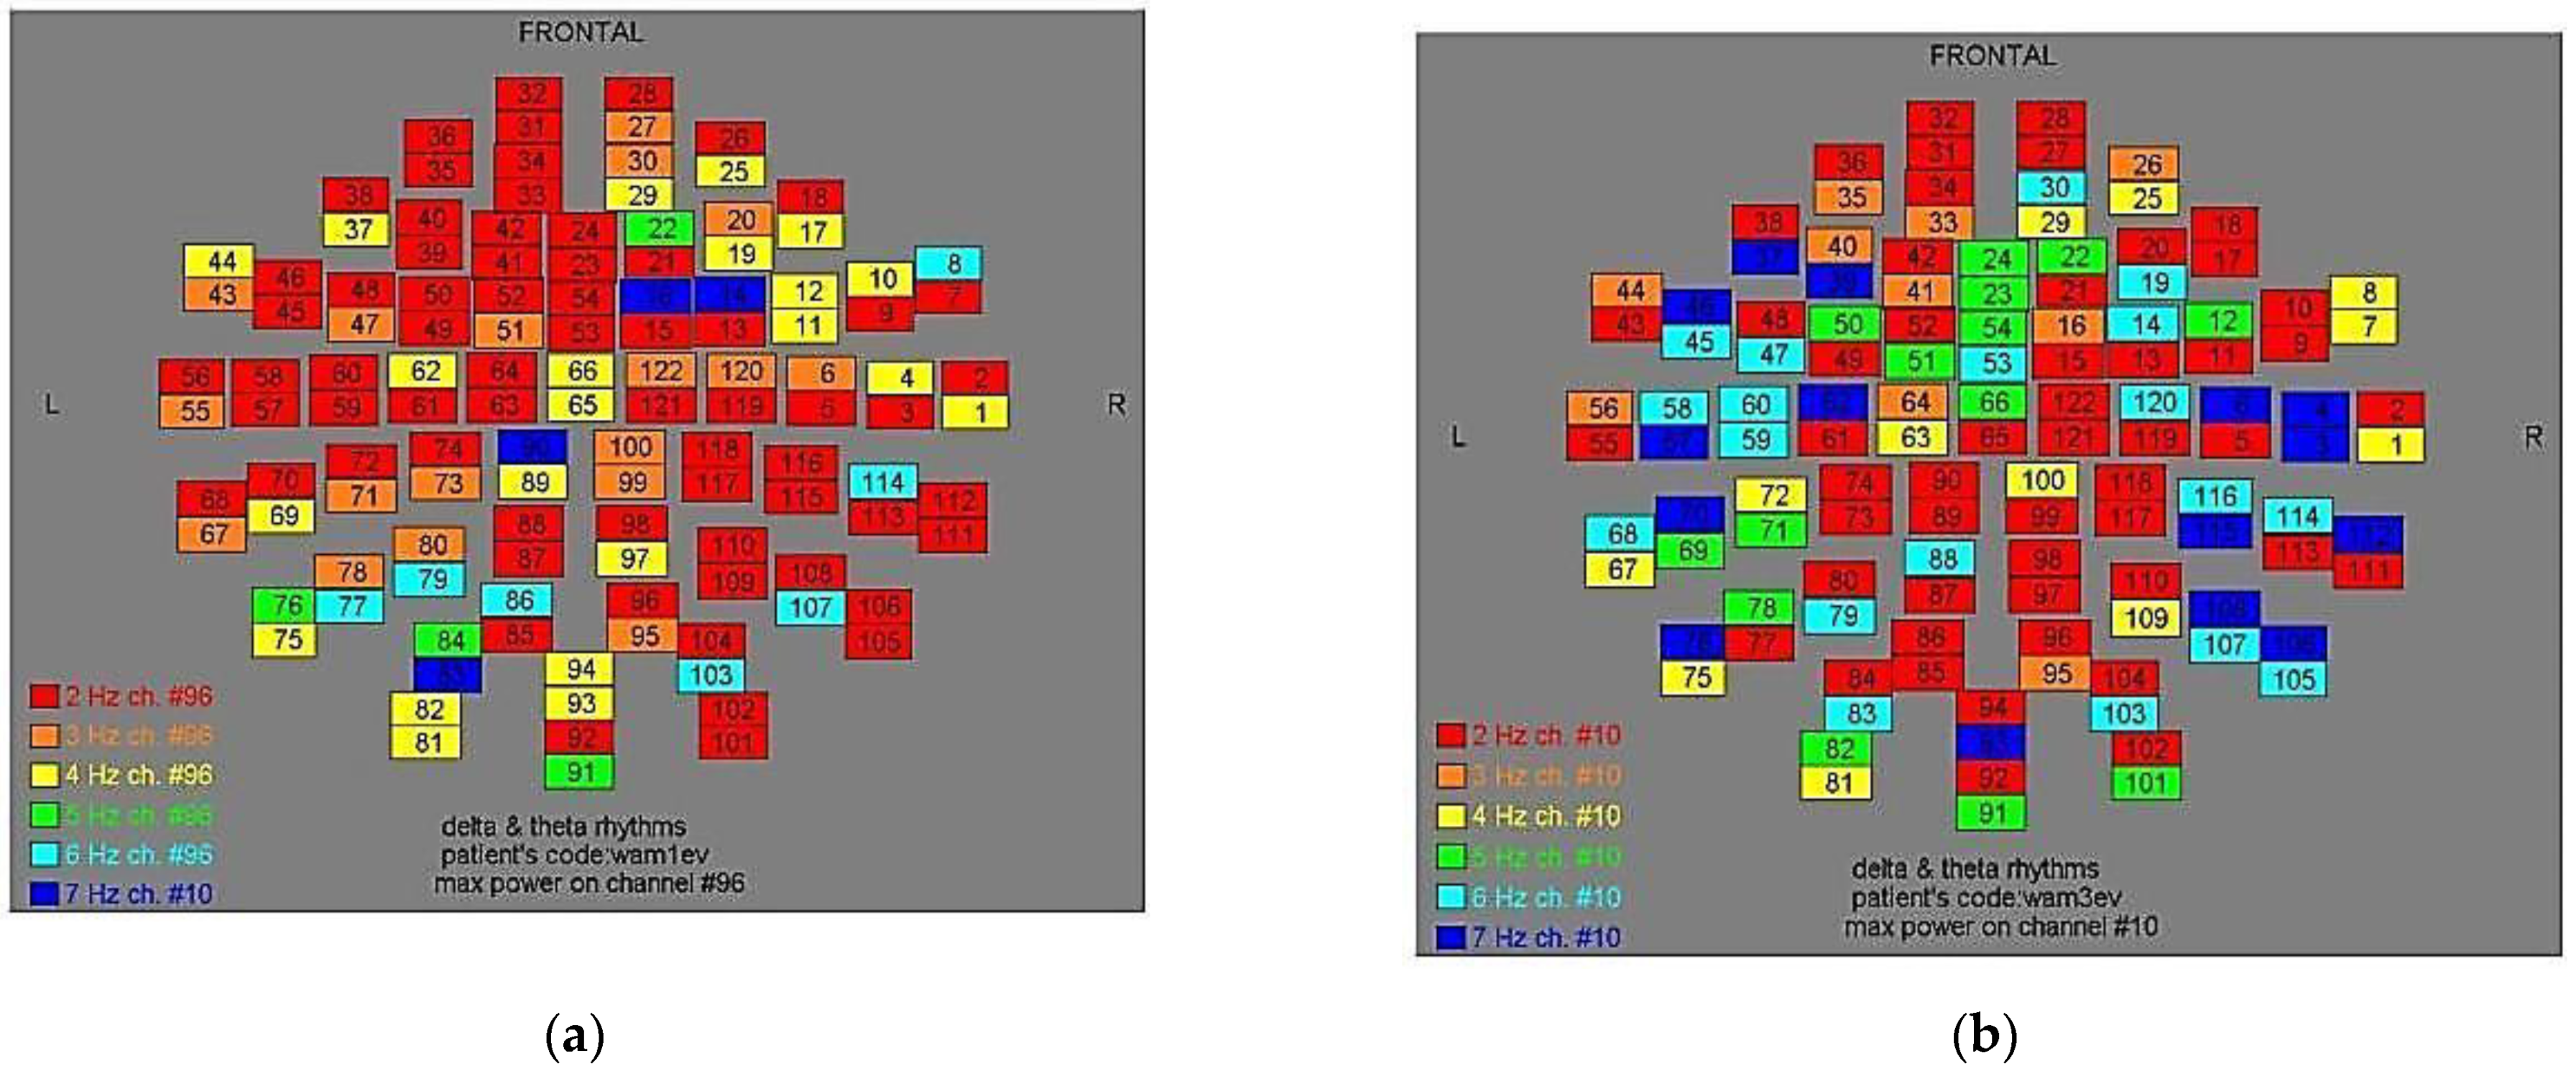
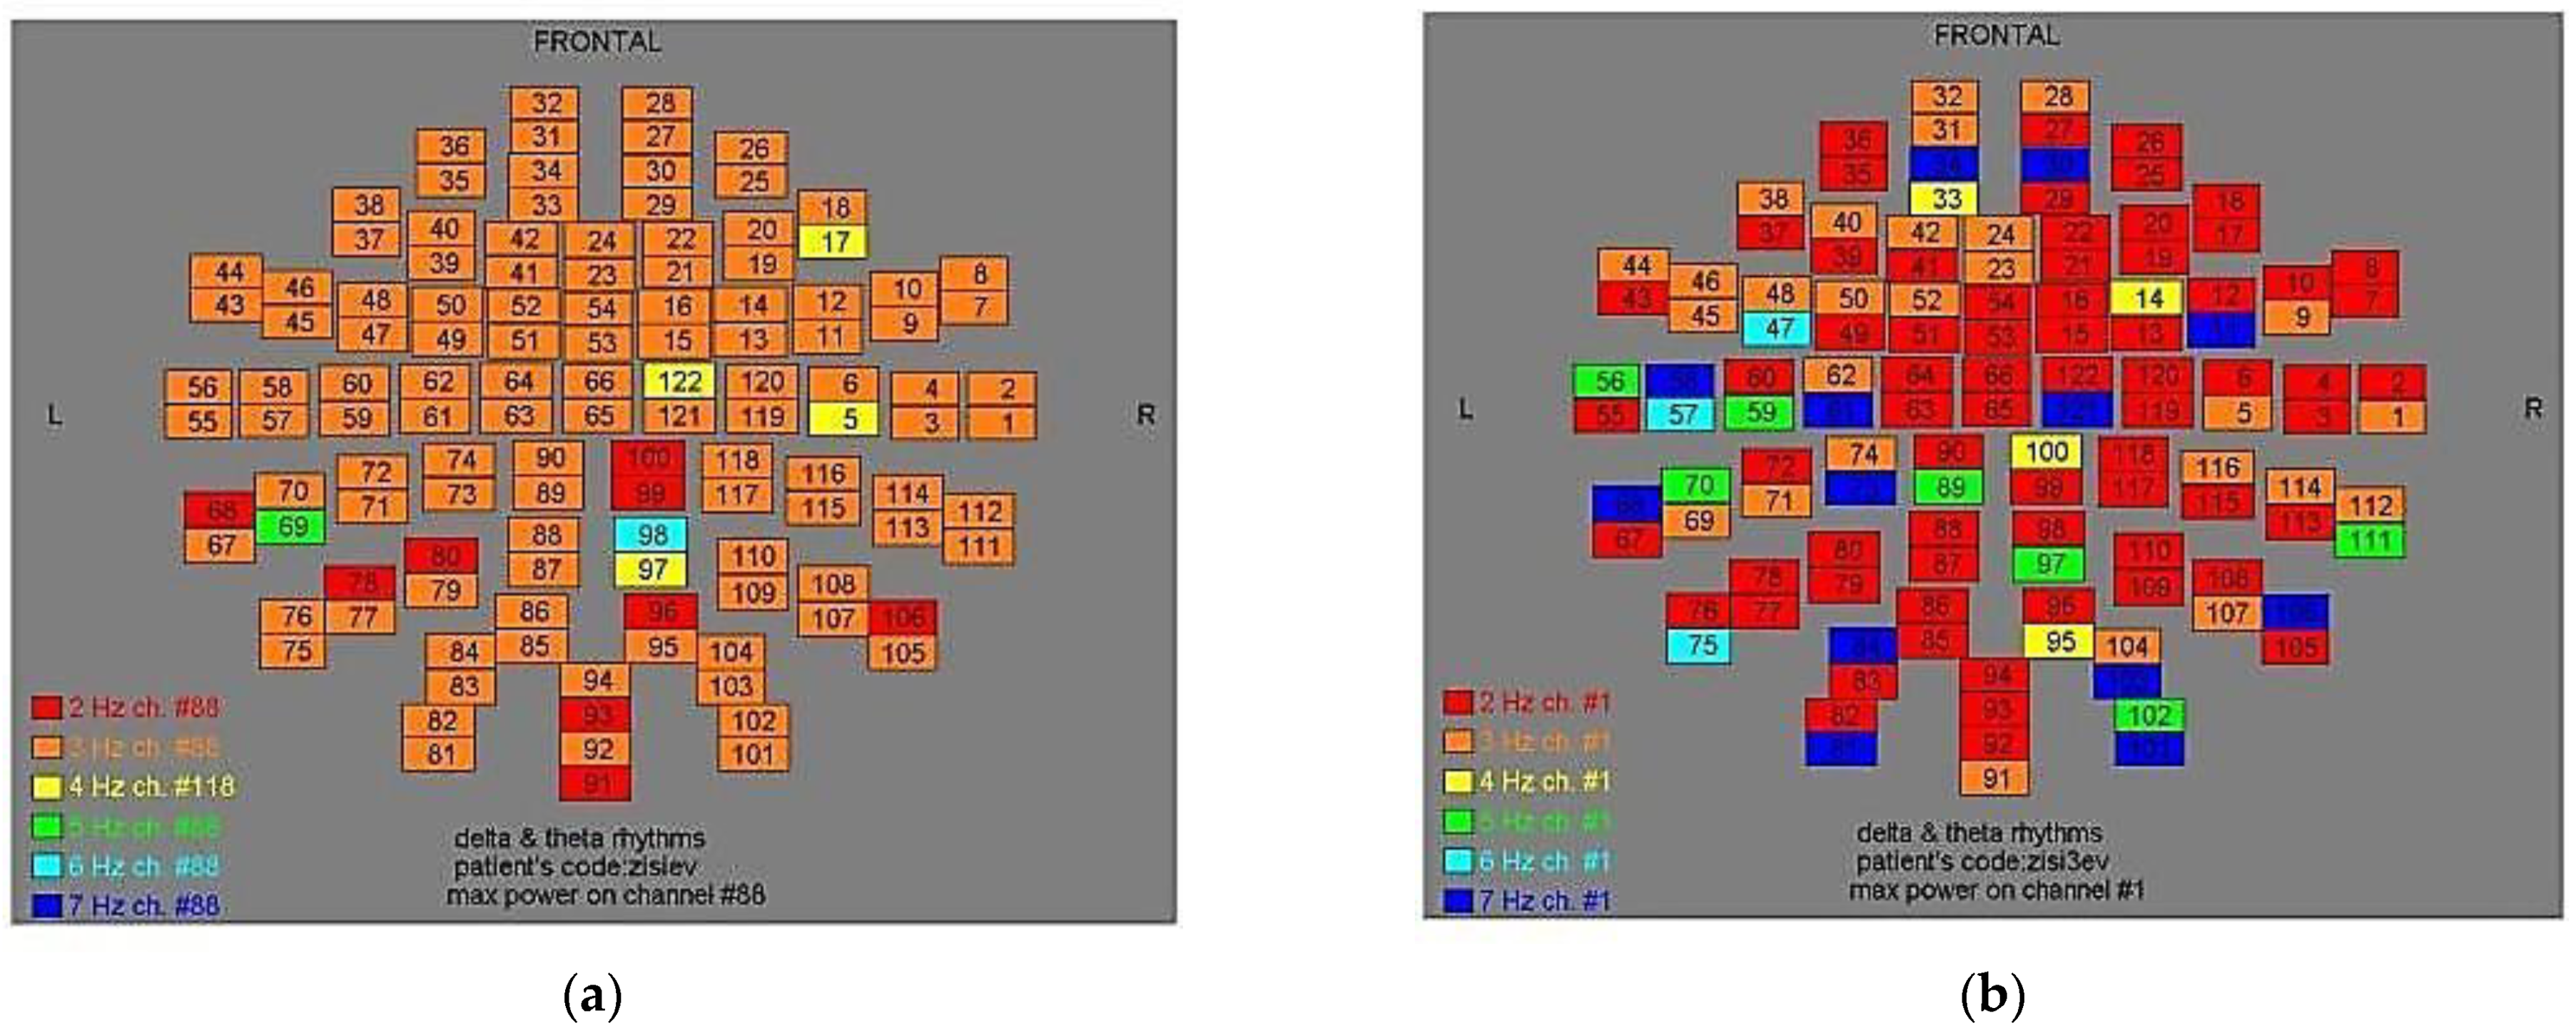
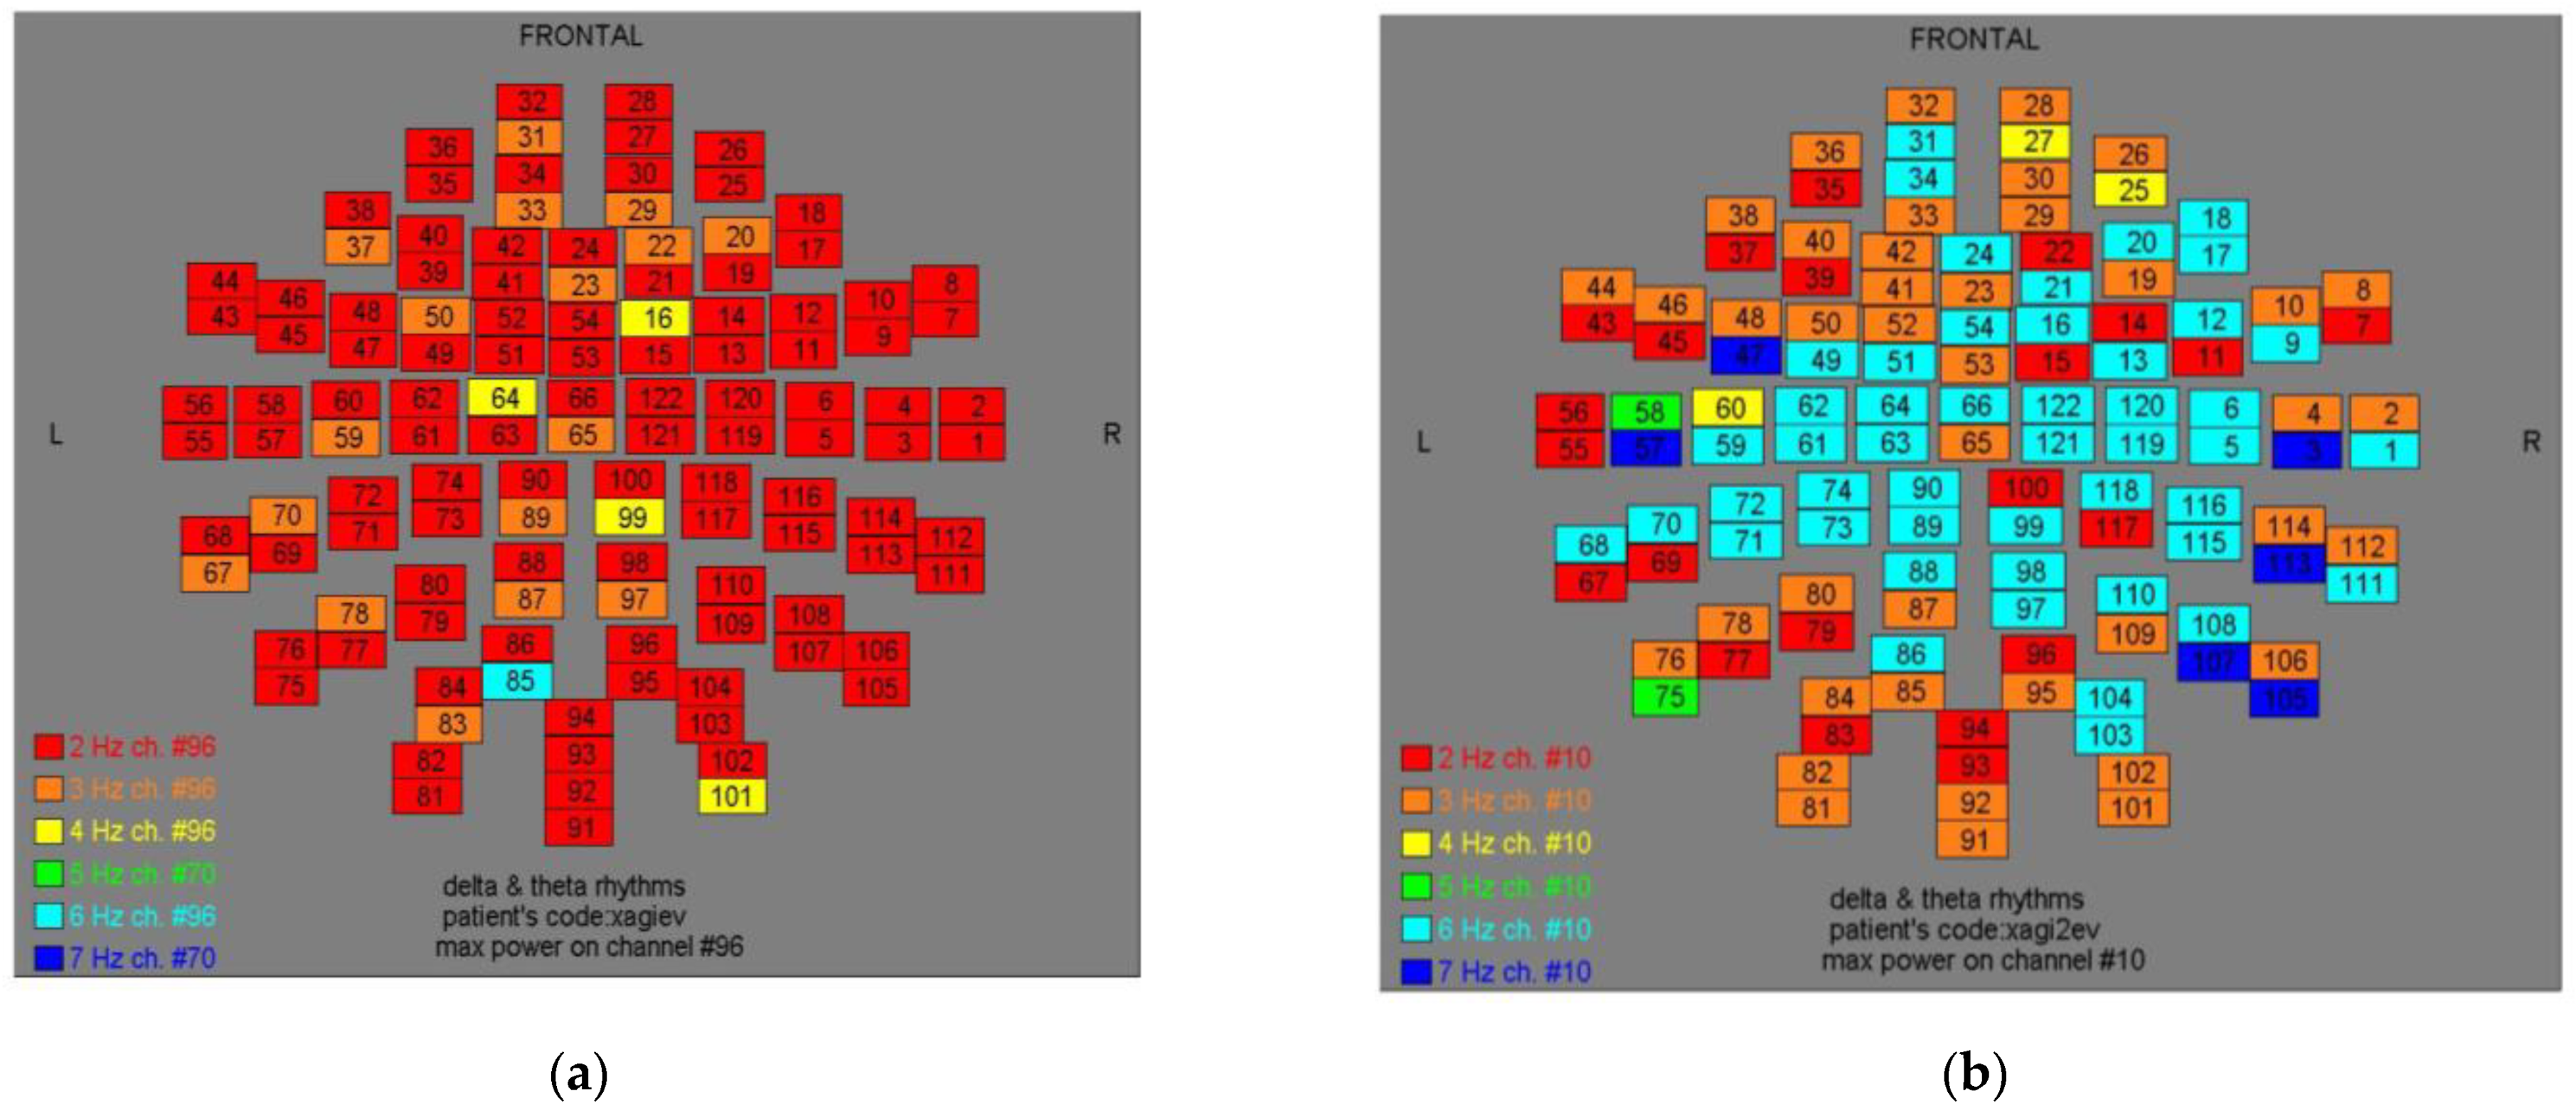
Two-dimensional color maps for the spatial distribution of the primary dominant frequencies were constructed based on these frequencies estimation for each affected brain region and channel. Each color in the maps depicts different primary dominant frequencies. Finally, each number in the map squares indicates groups of MEG channels, in line with the whole-head device for each brain area according to
Table 1.
2.4. Statistical Analysis
Data were displayed as mean ± standard error of the mean. Single comparisons were performed with unpaired Student’s t-test. Statistical analysis was employed by SPSS 16.0 (SPSS Inc., Chicago, IL, USA). Values with p < 0.05 were considered statistically significant.
3. Results
In
Figure 1, through compendious analysis, we identified the magnitude of the primary dominant frequency (MPFD) of the amplitude spectra after pT-TMS and FFT analysis.
In
Table 1, we present the brain regions and the respective channels in each brain region. In
Table 2 are displayed possible modification effects before and after the use of pT-TMS on each AD patients’ brain. In particular, the maximum frequency is shown between the first MEG recording before stimulation (BS) and the MEG recording after stimulation (AS) for the affected brain regions of the 10 AD patients.
In
Table 3 is shown the statistical analysis for the AD patients using an unpaired
t-test. The results were statistically significant at 7 out of 10 patients (70%).
In
Table 4 is shown the AD patient’s symptomatology before and after pT-TMS effect, as they were evaluated by interviews by clinicians. We observed that 3 out 10 AD patients did not show improvement (30%) namely (nr. 2, 4, 8), according to the statistical analysis of
Table 3. Especially, 1 out of 3 female AD patients (33%) and 2 out of 7 male patients (28%) did not show improvement.
Finally, in
Figure 2,
Figure 3,
Figure 4,
Figure 5,
Figure 6,
Figure 7,
Figure 8,
Figure 9,
Figure 10 and
Figure 11, color maps depict frequencies alteration before and after magnetic stimulation of each AD patient.
4. Discussion
AD is a common degenerative brain disorder with multi-complex clinical symptomatology, which debilitates the patient from daily routine and reduces the quality of life [
21,
22]. Despite the fact that numerous studies have been made involving Alzheimer’s pathogenesis, still there are many blur paths that need to be clarified [
23]. Probably this is the reason why we are still not talking about a completely efficient cure.
As far as we know, the therapeutic strategies for AD preserve two ways, the pharmaceutical and the non-pharmaceutical trail [
22]. Drugs approved for Alzheimer’s management emphasize on the Aβ brain plaques accumulation control or focus on cell signal processing with the clinical benefits being semi-promising [
23]. Transcranial Magnetic Stimulation, on the other hand, overrules among the alternative treatment options [
24,
25]. Up to now, clinical trials that have been working on high frequencies brain stimulation >3 Hz and mainly at the range of 10 to 20 Hz, rather than low frequencies (≤1 Hz), provide positive results several weeks or months post-TMS [
24,
25].
In our study, 3 out of 10 participants with extremely serious symptoms did not have any improvement, through weak TMS, in their clinical profile. Our results are in line with previous studies applying a range stimulation protocol from 1 Hz up to 20 Hz on patients with mainly severe symptomatology and prolonged disease progression [
25].
On the other hand, the pT-TMS on AD patients with mild symptomatology exhibited a positively statistically significant effect since 7 out of 10 patients declared substantial clinical improvement. To our knowledge, this is the first time that TMS, as weak as 10−12 Tesla, is applied on AD patients, through a whole head personalized brain stimulation apparatus, for a very short period of time (2 sessions of 60 s each, 24 h apart) and accompanied by MEG neurosensitive scanning, pre- and post-stimulus.
However, the encouraging outcome with the up to now AD knowledge cannot be totally explicated. Still, one rational explanation might be the fact that weak magnetic fields hold a strong positive impact on the pineal gland’s ability, through melatonin, to control endogenous opioid signal pathways [
26,
27,
28] and several neurotransmission nets [
29,
30], which show significant changes in cognitive disorders. Additionally, another perspective is that this type of magnetic stimulation is capable of modulating neurons cell membrane’s overall biological profile and role in the neurotransmission process, which is significantly impaired in AD patients [
31].
5. Conclusions
To summarize, the use of pT-TMS preserves a promising positive outcome of the clinical image of AD patients, as it lightens’ their daily symptoms, in no time, with the use of a totally safe model. Nevertheless, in order to prove pT-TMS effectiveness on AD treatment, further studies with larger groups of AD patients are needed to be conducted.
6. Patents
Anninos, P.A, and Tsagas, N. Electronic apparatus for treating Epileptic individuals. USA patent 5453072, 1995.
Author Contributions
Conceptualization, P.A. and N.T.; methodology, P.A., N.T. and A.A.; software, A.A.; validation, N.A.; formal analysis, P.A. and N.A.; investigation, P.A.; resources, P.A. and N.T.; data curation, A.A.; writing—original draft preparation, P.A.; writing—review and editing, P.A., A.A. and N.A.; visualization, A.A.; supervision, P.A.; project administration, P.A.; funding acquisition, P.A. All authors have read and agreed to the published version of the manuscript.
Funding
This research was funded by GENERAL SECRETERIAT OF RESEARCH AND TECHNOLOGY, GR and the ERGO AEBE, INC. GR under the research program, grant number 97ΔΕ45.
Institutional Review Board Statement
The study was conducted according to the guidelines of the Declaration of Helsinki and approved by the Ethics Committee of Democritus University of Thrace, protocol 80623 and 80347.
Informed Consent Statement
Informed consent was obtained from all subjects involved in the study.
Data Availability Statement
The datasets used and analyzed during the current study are available from the corresponding author on reasonable request.
Conflicts of Interest
The authors declare no conflict of interest. The funders had no role in the design of the study; in the collection, analyses, or interpretation of data; in the writing of the manuscript, or in the decision to publish the results.
References
- Ghosh, K.; Agarwal, P.; Haggerty, G. Alzheimer’s disease-not an exaggeration of healthy aging. Indian J. Psychol. Med. 2011, 33, 106–114. [Google Scholar] [CrossRef] [PubMed] [Green Version]
- Barnes, J.; Dickerson, B.C.; Frost, C.; Jiskoot, L.C.; Wolk, D.; Flier, W.M. Alzheimer’s disease first symptoms are age dependent: Evidence from the NACC dataset. Alzheimer’s Dementia 2015, 11, 1349–1357. [Google Scholar] [CrossRef] [PubMed] [Green Version]
- Östling, S.; Pálsson, S.P.; Skoog, I. The incidence of first-onset psychotic symptoms and paranoid ideation in a representative population sample followed from age 70–90 years. Relation to mortality and later development of dementia. Int. J. Geriatr. Psychiatry 2006, 22, 520–528. [Google Scholar] [CrossRef]
- Tarawneh, R.; Holtzman, D.M. The Clinical Problem of Symptomatic Alzheimer Disease and Mild Cognitive Impairment. Cold Spring Harb. Perspect. Med. 2012, 2, a006148. [Google Scholar] [CrossRef] [PubMed]
- Kailie, L.; Jesusa, L.R.; Ki-Young, L. Viewpoint: Crosstalks between neurofibrillary tangles and amyloid plaque formation. Ageing Res. Rev. 2013, 12, 174–181. [Google Scholar]
- Gustafson, L. Frontal lobe degeneration of non-Alzheimer type. Clinical picture and differential diagnosis. Arch. Gerontol. Geriatr. 1987, 6, 209–223. [Google Scholar] [CrossRef]
- Rosen, H.J.; Gorno–Tempini, M.L.; Goldman, W.P.; Perry, R.J.; Schuff, N.; Weiner, M.; Feiwell, R.; Kramer, J.H.; Miller, B.L. Patterns of brain atrophy in frontotemporal dementia and semantic dementia. Neurol. Jan. 2002, 58, 198–208. [Google Scholar] [CrossRef] [Green Version]
- Hodges, J.R.; Patterson, K.; Oxbury, S.; Funnell, E. Semantic dementia. Progressive fluent aphasia with temporal lobe atrophy. Brain 1992, 115, 1783–1806. [Google Scholar] [CrossRef] [PubMed]
- Swerdlow, R.H. Pathogenesis of Alzheimer’s disease. Clin. Interv. Aging 2007, 2, 347–359. [Google Scholar]
- Elder, G.J.; Taylor, J.P. Transcranial magnetic stimulation and transcranial direct current stimulation: Treatments for cognitive and neuropsychiatric symptoms in the neurodegenerative dementias? Alzheimer’s Res. Therapy 2014, 6, 1–11. [Google Scholar] [CrossRef]
- Koshev, N.; Butorina, A.; Skidchenko, E.; Kuzmichev, A.; Ossadtchi, A.; Ostras, M.; Fedorov, M.; Vetoshko, P. Evolution of MEG: A first MEG-feasible fluxgate magnetometer. Hum. Brain Mapp. 2021, 42, 4844–4856. [Google Scholar] [CrossRef] [PubMed]
- Mandal, P.; Banerjee, A.; Tripathi, A.; Sharma, A. A Comprehensive Review of Magnetoencephalography (MEG) Studies for Brain Functionality in Healthy Aging and Alzheimer’s Disease (AD). Front Comput. Neurosci. 2018, 12, 60. [Google Scholar] [CrossRef] [PubMed]
- Singh, S.P. Magnetoencephalography: Basic principles. Ann. Indian Acad. Neurol. 2014, 17 (Suppl. 1), 107–112. [Google Scholar] [CrossRef]
- Anninos, P.A.; Tsagas, N. Electronic Apparatus for Treating Epileptic Individuals. U.S. Patent 5453072, 26 September 1995. [Google Scholar]
- Abatzoglou, I.; Anninos, P.; Tsalafoutas, I.; Koukourakis, M. Multi-Channel Magnetoencephalogram on Alzhemer Disease Patients. Integrat. Neurosc. 2009, 8, 13–21. [Google Scholar] [CrossRef]
- Anninos, P.; Kotini, A.; Adamopoulos, A.; Tsagas, N. Frequency analysis for the effect of Pico Tesla-Transcranial Magnetic Stimulation in Epilepsy Patients Using Magnetoencephalography. J. Rare Dis. Res. Treat. 2018, 3, 22–28. [Google Scholar] [CrossRef]
- Anninos, P.; Anninou, N.; Adamopoulos, A.; Kotini, A.; Gemousakakis, T.; Tsagas, N. We used a Double Bilnd Experiment to Investigate weak pT-TMS in Epilepsy Patients. Med. J. Clin. Med. 2020, 15, 92–95. [Google Scholar]
- Anninos, P.; Chatzimichael, A.; Anninou, N.; Kotini, A.; Adamopoulos, A.; Gemousakakis, T.; Tsagas, N. The effect of pt-TMS on Beta Rhythm in children with Autism Disorder. A MEG Study. Med. J. Clin. Med. 2019, 14, 332–342. [Google Scholar]
- Anninos, P.; Kotini, A.; Adamopoulos, A.; Tsagas, N. MEG recordings of patients with cerebral palsy before and after the application of pico-Tesla weak magnetic fields. J. Integ. Neurosc. 2019, 18, 17–21. [Google Scholar]
- Anninos, P.; Kotini, A.; Adamopoulos, A.; Tsagas, N. MEG and Pico-Tesla-TMS in Patients with Atrophy with a Double Blind Exrerimental Design. Neurol. Neuroth. J. 2018, 3, 121. [Google Scholar]
- Qiu, C.; Kivipelto, M.; Strauss, E. Epidemiology of Alzheimer’s disease: Occurrence, determinants, and strategies toward intervention. Dialogues Clin. Neurosci. 2009, 11, 111–128. [Google Scholar]
- Perl, D.P. Neuropathology of Alzheimer’s Disease. Mt. Sinai J. Med. 2010, 77, 32–42. [Google Scholar] [CrossRef] [PubMed]
- Tiwari, S.; Atluri, V.; Kaushik, A.; Yndart, A.; Nair, M. Alzheimer’s disease: Pathogenesis, diagnostics, and therapeutics. Int. J. Nanomed. 2019, 14, 5541–5554. [Google Scholar] [CrossRef] [Green Version]
- Marron, E.M.; Viejo-Sobera, R.; Quintana, M.; Redolar-Ripoll, D.; Rodríguez, D.; Garolera, M. Transcranial magnetic stimulation intervention in Alzheimer’s disease: A research proposal for a randomized controlled trial. BMC Res. Notes 2018, 11, 648. [Google Scholar] [CrossRef] [PubMed]
- Weiler, M.; Stieger, K.C.; Long, J.M.; Rapp, P.R. Transcranial Magnetic Stimulation in Alzheimer’s Disease: Are We Ready? ENeuro 2020, 7, 7. [Google Scholar] [CrossRef]
- Song, L.; Wu, C.; Zuo, Y. Melatonin prevents morphine-induced hyperalgesia and tolerance in rats: Role of protein kinase C and N-methyl-D-aspartate receptors. BMC Anesthesiol. 2015, 15, 12. [Google Scholar] [CrossRef] [Green Version]
- Meilandt, W.J.; Yu, G.Q.; Chin, J.; Roberson, E.D.; Palop, J.J.; Wu, T.; Scearce-Levie, K.; Mucke, L. Enkephalin Elevations Contribute to Neuronal and Behavioral Impairments in a Transgenic Mouse Model of Alzheimer’s Disease. J. Neurosci. 2008, 28, 5007–5017. [Google Scholar] [CrossRef] [PubMed]
- Zisapel, N. Melatonin–Dopamine Interactions: From Basic Neurochemistry to a Clinical Setting. Cell Mol. Neurobiol. 2001, 21, 605–616. [Google Scholar] [CrossRef]
- Nitsche, M.A.; Lampe, C.; Antal, A.; Liebetanz, D.; Lang, N.; Tergau, F.; Paulus, W. Dopaminergic modulation of long-lasting direct current-induced cortical excitability changes in the human motor cortex. Eur. J. Neurosci. 2006, 23, 1651–1657. [Google Scholar] [CrossRef]
- Roy, J.; Tsui, K.C.; Ng, J.; Fung, M.L.; Lim, L.W. Regulation of Melatonin and Neurotransmission in Alzheimer’s Disease. Int. J. Mol. Sci. 2021, 22, 6841. [Google Scholar] [CrossRef]
- Lenz, M.; Galanis, C.; Müller-Dahlhaus, F.; Opitz, A.; Wierenga, C.J.; Szabó, G.; Ziemann, U.; Deller, T.; Funke, K.; Vlachos, A. Repetitive magnetic stimulation induces plasticity of inhibitory synapses. Nat. Commun. 2016, 7, 10020. [Google Scholar] [CrossRef] [Green Version]
Figure 1.
A 0–7s MEG segment of an AD patient (up) and the corresponding amplitude spectrum that is obtained after the application of FFT (bottom). The dominant frequency is 2.1 Hz.
Figure 1.
A 0–7s MEG segment of an AD patient (up) and the corresponding amplitude spectrum that is obtained after the application of FFT (bottom). The dominant frequency is 2.1 Hz.
Figure 2.
Dominant frequency color mapping for patient #1, before (a) and after (b) magnetic stimulation.
Figure 2.
Dominant frequency color mapping for patient #1, before (a) and after (b) magnetic stimulation.
Figure 3.
Dominant frequency color mapping for patient #2, before (a) and after (b) magnetic stimulation.
Figure 3.
Dominant frequency color mapping for patient #2, before (a) and after (b) magnetic stimulation.
Figure 4.
Dominant frequency color mapping for patient #3, before (a) and after (b) magnetic stimulation.
Figure 4.
Dominant frequency color mapping for patient #3, before (a) and after (b) magnetic stimulation.
Figure 5.
Dominant frequency color mapping for patient #4, before (a) and after (b) magnetic stimulation.
Figure 5.
Dominant frequency color mapping for patient #4, before (a) and after (b) magnetic stimulation.
Figure 6.
Dominant frequency color mapping for patient #5, before (a) and after (b) magnetic stimulation.
Figure 6.
Dominant frequency color mapping for patient #5, before (a) and after (b) magnetic stimulation.
Figure 7.
Dominant frequency color mapping for patient #6, before (a) and after (b) magnetic stimulation.
Figure 7.
Dominant frequency color mapping for patient #6, before (a) and after (b) magnetic stimulation.
Figure 8.
Dominant frequency color mapping for patient #7, before (a) and after (b) magnetic stimulation.
Figure 8.
Dominant frequency color mapping for patient #7, before (a) and after (b) magnetic stimulation.
Figure 9.
Dominant frequency color mapping for patient #8, before (a) and after (b) magnetic stimulation.
Figure 9.
Dominant frequency color mapping for patient #8, before (a) and after (b) magnetic stimulation.
Figure 10.
Dominant frequency color mapping for patient #9, before (a) and after (b) magnetic stimulation.
Figure 10.
Dominant frequency color mapping for patient #9, before (a) and after (b) magnetic stimulation.
Figure 11.
Dominant frequency color mapping for patient #10, before (a) and after (b) magnetic stimulation.
Figure 11.
Dominant frequency color mapping for patient #10, before (a) and after (b) magnetic stimulation.
Table 1.
Brain areas and the relative channels in each brain area.
Table 1.
Brain areas and the relative channels in each brain area.
| Main Brain Areas | Channels |
|---|
| Right Temporal | 1–14, 111–120 |
| Left Temporal | 43–50, 55–62, 67–74 |
| Right Parietal | 5–6, 11–16, 97–100, 109,110, 115–122 |
| Left Parietal | |
| Frontal | 17–42 |
| Occipital | 75–86, 91–96, 101–110 |
| Vertex | 13–16, 49–54, 61–66, 73, 74, 89, 90, 99, 100, 117–122 |
Table 2.
Maximum frequency between the first MEG recording before stimulation (BS) and the MEG recording after stimulation (AS) for the affected brain regions of the AD patients.
Table 2.
Maximum frequency between the first MEG recording before stimulation (BS) and the MEG recording after stimulation (AS) for the affected brain regions of the AD patients.
Table 3.
Statistical analysis of the Alzheimer patients’ group. Marked in bold are the statistically significant results (p < 0.05).
Table 3.
Statistical analysis of the Alzheimer patients’ group. Marked in bold are the statistically significant results (p < 0.05).
| Patients | Meanf (BS+) | Meanf (AS+) | t-Test p-Values |
|---|
| 1 | 3.80 ± 1.10 | 5.60 ± 0.55 | 0.0111 |
| 2 | 5.00 ± 1.00 | 6.20 ± 0.84 | 0.0736 |
| 3 | 4.20 ± 1.64 | 6.40 ± 1.34 | 0.0490 |
| 4 | 5.80 ± 1.10 | 6.60 ± 0.55 | 0.1823 |
| 5 | 4.00 ± 0.00 | 6.40 ± 1.34 | 0.0039 |
| 6 | 4.20 ± 1.84 | 6.20 ± 0.84 | 0.0415 |
| 7 | 4.40 ± 1.34 | 6.80 ± 0.45 | 0.0053 |
| 8 | 6.00 ± 1.41 | 7.00 ± 0.00 | 0.1525 |
| 9 | 4.60 ± 1.14 | 7.00 ± 0.00 | 0.0015 |
| 10 | 3.20 ± 0.84 | 6.60 ± 0.55 | 0.0001 |
Table 4.
Clinical symptomatology of the Alzheimer patients as it was assessed by neurologists before and after stimulations (2nd and 3rd day in the lab) (F: Female; M: Male).
Table 4.
Clinical symptomatology of the Alzheimer patients as it was assessed by neurologists before and after stimulations (2nd and 3rd day in the lab) (F: Female; M: Male).
| Patients | Sex | Symptoms before Stimulation (BS) | Symptoms after Stimulation (AS) |
|---|
| 1 | M | Memory problems, speaking
communications | His symptoms
improved |
| 2 | F | General atrophy in
temporal and frontal lobes and orientation disorders | Her symptoms did not stop |
| 3 | M | Memory disturbances, speaking
communication | His symptoms
improved |
| 4 | M | General atrophy in
temporal and frontal lobes | His symptoms
did not improve |
| 5 | F | Memory disturbances
orientation difficulties | Her symptoms
improved |
| 6 | F | Atrophy of temporal and frontal lobes, memory disorders | Her symptoms
improved |
| 7 | Μ | Difficulties of speaking and memory problems | His symptoms
improved |
| 8 | Μ | Orientation disorders and memory problems | His symptoms did not improve |
| 9 | Μ | Difficulties in memory
and speaking | His symptoms improved |
| 10 | M | Difficulties in memory
and speaking | His symptoms
improved |
| Publisher’s Note: MDPI stays neutral with regard to jurisdictional claims in published maps and institutional affiliations. |
© 2021 by the authors. Licensee MDPI, Basel, Switzerland. This article is an open access article distributed under the terms and conditions of the Creative Commons Attribution (CC BY) license (https://creativecommons.org/licenses/by/4.0/).


