Abstract
Finding a sustainable mobility solution for the future is one of the most competitive challenges in the logistics and transportation sector nowadays. Researchers, universities, and companies are working intensively to provide novel mobility options that can be environmentally friendly and sustainable. While autonomous car-sharing services have been introduced as a very promising solution, an innovative alternative is arising using self-driving bikes. Shared autonomous cargo bike fleets are likely to increase the livability and sustainability of the city as the use of cargo bikes in an on-demand mobility service can replace the use of cars for short-distance trips and enhance connectivity to public transportation. However, more research is still needed to develop this new concept. To address this research gap, this paper examines the on-demand shared-use autonomous bikes service (OSABS) from a fleet management perspective. In fact, such a system requires good management strategies in order to ensure its efficiency. Through an agent-based simulation of a case study in Magdeburg, we investigate various parameters that can influence the performance and the service quality of OSABS such as the rebalancing frequency and the relocation type. Tests were performed for two different operational areas: the inner city and the complete city of Magdeburg. We conclude with different management insights for an optimized functioning of the system.
1. Introduction
Since its appearance in 2019, the COVID-19 pandemic has provoked a huge behavior change in the way people travel. A modal shift from public transport to personal cars or bicycles has been observed [1]. While this shift may help to reduce crowdedness in public transportation and thereafter decrease the virus expansion, it may lead to higher carbon emission [1]. Whereas, with the climate emergency, it is crucial to provide sustainable mobility solutions that satisfy the pandemic requirements.
In this context, shared autonomous vehicles have been proposed as a solution to reduce car ownership and provide a personal travel experience [2]. In recent years, we have witnessed a progressive automation of vehicles (especially cars) [3], which has increased research interest in autonomous mobility solutions. This knowledge of autonomous driving has also been transferred to micro-vehicles as they reduce street congestion by using sidewalks [4]. As a type of micro-vehicles, Assmann et al. [5] suggested the use of a shared fleet of autonomous cargo bikes to improve city sustainability. Autonomous bikes can be used as a means for a transportation service as well as for last mile delivery.
In this work, we introduce the “On-demand Shared-use Autonomous Bike-sharing Service” (OSABS) which is a novel on-demand mobility option that is environmentally friendly and COVID safe. Passengers can book a bike via a smartphone application. The bike drives autonomously to its location within the given service time (10 min). The customer will ride it manually to the desired destination and release it after usage. Then, the bike drives to either the next customer, a waiting station (to park close to prospective demands), or a charging station (for battery refueling). This service allows a door-to-door mobility solution with zero human contact. In addition, the use of a shared autonomous cargo-bike fleet enhances the city’s sustainability as it reinforces the multi-usage of streets and thus helps reduce congestion and pollution [5].
However, one major challenge to the success of this new mode of transport is the optimization of the vehicle’s fleet. To guarantee the economic viability of this service, it is important to operate the fleet as efficiently as possible by reducing the unnecessary operational costs and satisfying the customer demand with the minimum fleet size. With an autonomous fleet, the management opportunities are enormous. Using self-driving technologies, idle vehicles can be relocated proactively according to the upcoming demand to prevent their accumulation in low-demand areas and to better satisfy customer requests. In addition, self-driving vehicles enable relocation to be executed centrally by a fleet operator that controls the state of all the vehicles and analyses the demand, rather than locally by individual drivers.
Given this expansion of fleet management options, there are endless possible relocation strategies that could be implemented. This paper aims to explore the implication of different rebalancing parameters on OSABS performance. Such an evaluation study will help decision makers determine the suitable strategy for this new service. The remainder of the paper is as follows: In Section 2, we present an overview of related research and publications. In Section 3, we describe the research methodology and the data used in this work. In Section 4, we present and analyze the simulation results and discuss them in Section 5. We conclude with fleet management insights in Section 6.
2. Literature Review
2.1. Fleet Management for Bike-Sharing Systems
Fleet management is a substantial activity that involves the fields of logistics, transportation, and distribution. Its main goal is to improve operational performance and service efficiency while reducing overall costs [6]. Based on the type and functioning of the system, different fleet management approaches could be considered. For the conventional bike-sharing system (CBSS), the relocation problem has been considered one of the main fleet management challenges that bike-sharing systems face. Since their earliest implementations, CBSS operators recognized the need to improve the bike’s distribution methods, and sometimes, they assessed its associated costs [7]. Therefore, it is essential to find approaches that make fleet relocation more efficient [8].
To date, several methods have been suggested to solve the bike rebalancing problem. Different classifications of the bike repositioning literature were also made. We should first distinguish between the operator-based rebalancing (OBR) strategies where the relocation operation is generally done by a fleet of trucks that collect and drop bikes across the network to satisfy the upcoming demand and the user-based rebalancing (UBR) strategies where incentives are given to customers to encourage a self-rebalance of bikes in the network. While the literature on the OBR strategies is rich and diverse [9,10,11,12,13,14,15,16], the publications on UBR are limited [17,18,19,20]. For the OBR strategies, Ho and Szeto [21] categorized the publications according to the operation types and available rebalancing vehicles. Considering the available repositioning vehicles, we differentiate between relocation problems with a single repositioning truck or multi-trucks. For the operation types, we can roughly distinguish between two categories: the static repositioning problem (SRP) and the dynamic repositioning problem (DRP). The SRP is applied for overnight rebalancing and does not integrate the demand forecasting for the operating day. It is a deterministic problem and can be viewed as a static, many-to-many pickup and delivery problem. We could find a survey of the static bicycle repositioning problem in [22]. The DRP is, on the other hand, applied for intraday rebalancing and considers the upcoming demand during the day [23]. The DRP is both dynamic and stochastic. We can also differentiate between the different OBR strategies according to the type of bike-sharing system: dock-based or free-floating. For an extensive literature review on the rebalancing problem for station-based BSS, we refer to [24]. For the free-floating systems, the rebalancing operation is more complicated as bikes are randomly dispersed in the operational area. The difficulty in seizing the bikes’ location leads to high rebalancing costs [20]. To summarize, we can differentiate between the UBR where papers are still limited and it is mainly performed by giving some incentives to the customers to encourage them to do a self-rebalancing of the system, and the OBR strategies where the service provider needs to solve a static or dynamic vehicle routing problem and here the repositioning (or rebalancing) problem consists on determining the best route for each vehicle (generally a truck), the stations (or points) that should visit and the number of bikes to load or unload at each visited station, such that we minimize the dissatisfaction cost in the overall system. For both types, the relocation problem solved is completely different from the rebalancing of autonomous bikes. For OSABS, we do not require a vehicle to perform the rebalancing task. Instead, the bikes could ride autonomously from one station to another, according to the upcoming demand. Our rebalancing problem is rather considered as a part of the fleet management of autonomous mobility-on-demand (AMoD) services that we are investigating in the next part.
2.2. Fleet Management for AMOD Services
Different studies have demonstrated the importance of AMoD’s fleet management for cost reduction [25] and the minimization of the customer waiting time [26]. Various rebalancing models have been developed in the literature with different assumptions and considerations. Numerous authors suggested solving the relocation problem while considering a grid network. They divide the operation area into blocks and calculate the imbalance of each block. After that, they send vehicles from surplus blocks to deficit blocks [27,28,29]. Other studies modeled the system as a graph network where the nodes represent the stations and the edges are the travel cost. This formulation is solved through linear or integer programming [25,30,31,32]. Some papers used a road network and divide the area into relocation regions [33,34]. Only a few papers are found where a real network (maps) is used [35,36]. This can be explained by the complexity of routing in real maps, which implies high computational times. In conclusion, the literature on the relocation of autonomous vehicles is extensive. However, due to the complexity of the problem, each study uses specific assumptions, which include the routing, the network type, and the demand. These assumptions affect the problem formulation and its resolution. In addition, to the best of our knowledge, all the papers in the literature have only considered either one or different periodic relocation strategies without studying the influence of the rebalancing parameters on their results and the difference between different types of relocation. Only one paper has compared the two different types of relocation (relocation between stations and relocation after rental) for an autonomous car-sharing system, but without including the impact of the periodic relocation frequency in the research [35].
The main contribution of this work is the analysis of different rebalancing types and frequencies for OSABS while considering the specificity of our system and testing for two different operational areas: the inner city and the complete city. We simulate its operation through an agent-based simulation in Anylogic with a real network (Open Street Maps) and using no down-sampling of the demand. The demand scenarios are generated based on realistic spatial and temporal demand patterns determined from real-world traveling data. This paper is considered as a continuity of the work done in [37] where we made a first comparison between the three relocation strategies for the inner city but without varying the rebalancing parameters. In this work, we extend the study by investigating the implication of the rebalancing frequency and comparing the various relocation types. In addition, we discuss the results for two different operational areas to conclude the best strategy for each scenario.
3. Methodology
As OSABS is an entirely new service and still under development, our methodology of choice is simulation. The simulation study provides fundamental knowledge about the interaction of various elements in complex real-world systems and enables the evaluation of system performance. According to [38], agent-based models (ABMs) are better than other simulation methods for simulating a complex system with interdependent entities such as mobility systems involving self-driving vehicles. A significant number of studies have used agent-based simulation to study autonomous vehicle fleet management and provide decision support to decision makers [38]. One of the main advantages of ABM is the ability to define the behavior of different system components at a detailed level through the use of state charts [39].
In this work, we used agent-based simulation to study OSABS because it allows incorporating different agents with different characteristics and preferences. An overview of the conceptual model is presented in Figure 1. The reader can refer to [40] for a detailed description of the conceptual model. As can be seen in the overview, the main components of the model are customers (created based on demand scenarios), bikes, and stations (waiting and charging stations). The interaction between the different components is handled by the management operator mainly through two algorithms: the matching algorithm that allows the assignment of bikes to customer requests and the rebalancing algorithm that redistributes the bikes among the different stations. Both algorithms use the output of the routing algorithm for optimization. The structure of the simulation model was developed to represent the real-world components of the system. As input, we provide the system with business data (such as capital costs and user fees) and demand scenarios in the form of an OD statistical distribution. On the output side, we can collect performance indicators (including service level, mileage traveled for rebalancing, and energy consumed for relocation) and statistics that allow us to evaluate the efficiency and profitability of the system.
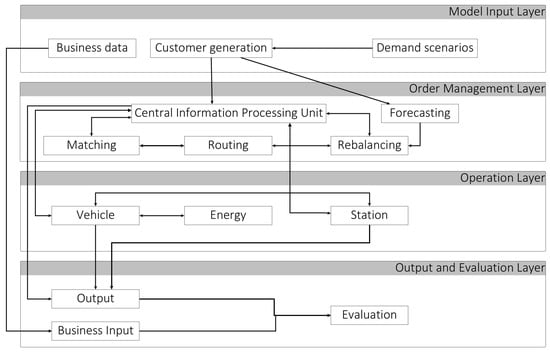
Figure 1.
The simulation conceptual model.
As an operational area for the simulation model, we considered two different options as shown in Figure 2:
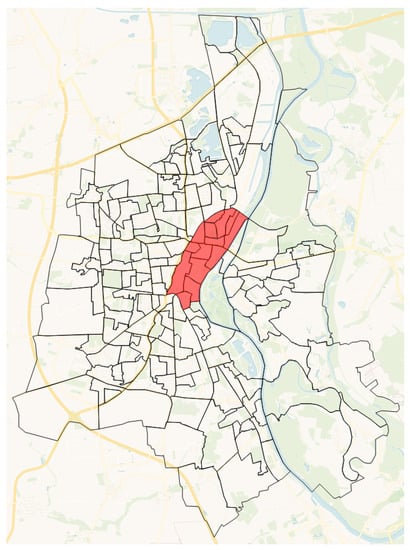
Figure 2.
The statistical regions of Magdeburg.
In the following parts, we will describe in detail the input (mainly demand generation), the bike operation, and the fleet management of our simulation model.
3.1. Demand Generation
In the literature, several approaches are providing a framework for creating demand scenarios for conventional bike-sharing systems (e.g., [41,42,43]). However, most of them aim at predicting demand in already existing systems. Although some approaches can be used to model demand in urban areas where no bike-sharing system has yet been implemented (e.g., [44]), they cannot be transferred due to the differences between conventional bike-sharing systems and OSABS. We, therefore, provide an approach to determine the demand for the new mobility concept in a temporally and spatially disaggregated manner and apply this to the city of Magdeburg. In the first step, a survey on mobility needs in Magdeburg (n = 781) is evaluated by an interdisciplinary team of environmental psychologists and engineers concerning the city-wide usage potential of autonomous cargo bikes. Secondly, the resulting usage likelihood per average traffic day is disaggregated both spatially and temporally. For spatial disaggregation, we use existing traffic data provided by the municipality of Magdeburg in the form of origin-destination pairs (OD pairs) for four different modes of transport. The resulting demand is then temporally disaggregated, to enable the prediction of usage to the hour. For this purpose, we derive usage patterns from existing conventional bike-sharing systems and transfer them to the new system.
3.2. Bike Operation
The behavior of the bike is simulated according to the state chart shown in Figure 3. Each bike has several states that it should go through. Each state is activated when the previous transition is verified. At the beginning of the simulation, all the bikes are parked in the waiting station with full batteries. During the simulation, the bike can go through the following transitions and states:
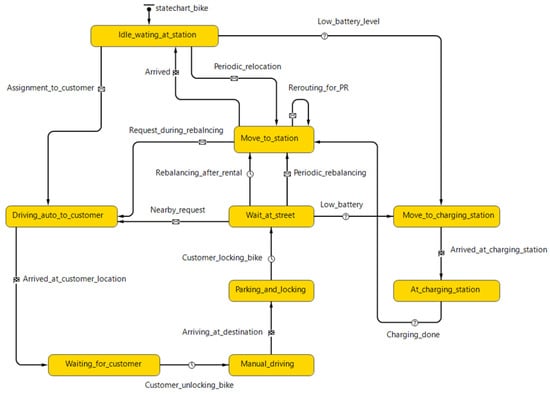
Figure 3.
The The bike state chart.
- Customer requests are generated based on an origin-destination schedule. The customer appears at a random location in the origin region, and a random location is assigned to the request in the destination region. The matching algorithm will assign the appropriate bike based on the energy consumption of the route ensuring a waiting time of less than 10 min. When a bike is assigned to the request, it travels autonomously to the customer.
- When the bike reaches the origin location, it waits for the customer to arrive.
- The customer picks up the bike and drives manually to the destination location using the manual mode.
- Arriving at the destination, the customer parks the bike and locks it. Now, the bike is available again. The bike waits for one minute in the street to check if there are requests in the surrounding. If no request appears, the rebalancing after rental strategy sends the bike to a waiting station according to the upcoming demand. It is necessary to mention that we prioritize serving current requests over bike relocation. That means when the bike is in-route to the waiting station but a request appears nearby, then the bike is assigned to the customer request.
- After each served request and when the bike is at the waiting station, we check the battery level. If it is below 20%, the bike should go for charging.
- When the charging is done, we move the bike according to the rebalancing after rental strategy.
- Each period T, the periodic rebalancing algorithm will check the imbalance between regions and move available bikes (at the street, in the waiting station, or on their way to a waiting station) according to the upcoming demand.
3.3. Fleet Management Strategies
The fleet management includes the assignment of bikes to customer requests and the relocation of idle bikes throughout the network. The matching algorithm works on a first-come-first-served (FCFS) basis. It checks for available bikes able to satisfy the customer’s request in less than 10 min. It assigns a suitable bike with less travel (energy consumption) costs. If there is no idle bike in the 10 min area, the request is rejected. In this section, we focus on the rebalancing algorithm. We differentiate between three relocation strategies:
- “To any” strategy: It consists of calculating the imbalance of each region (the difference between the available bikes at the beginning of the period and the estimated number of required bikes to serve the demand for the next period) and then relocating idle bikes to regions with a negative imbalance from the nearest regions with positive imbalance.
- “To vicinity” strategy: In this strategy, the idle bikes move only from regions with a positive imbalance to neighboring regions with a negative imbalance.
- “Mixed” strategy: this strategy is a combination of the “to vicinity” and “to any” strategies. For regions with a significant imbalance (imbalance ≥ 5), we allow rebalancing from any region. However, for regions with a moderate imbalance (imbalance < 5), only rebalancing from neighboring regions is allowed.
For each rebalancing strategy, we can also differentiate between two types of relocation:
- Periodic rebalancing (PR): it is performed periodically (for example, each 1 h). It consists of relocating idle bikes from a region with oversupply to undersupplied regions in its vicinity only. The priority is given to the region with the highest deficit in the neighborhood.
- Rebalancing after rental (RaR): this relocation operation is performed after the customer leaves the bike. The bike remains in the customer destination region if it already has a negative imbalance. Otherwise, it moves to the region with the highest deficit in the vicinity. If no region in the neighborhood has a deficit, the bike is assigned to the waiting station of the destination region.
The objective of this paper is to compare these two rebalancing types by answering the following questions: Are they both necessary for the optimal functioning of the system or one type is sufficient? Which one performs better and on which frequency should it be done? What is the best rebalancing schema for each operational area? To answer these questions, we perform simulation tests and analyze the results.
4. Scenarios and Results
4.1. Simulatiom Settings
The agent-based simulation model is developed using Anylogic Professional 8.6 version. For a detailed description of the simulation testbed, readers can refer to [45]. We run the experiments using a computer Intel(R) i9 CPU @2.40 GHz with 32.0 GB of RAM. We simulate a typical weekday in the city of Magdeburg with a very high demand scenario (38,965 requests for the complete city and 9100 requests for the inner city). For the bike routing in the simulation, we have developed a custom routing solution with Graphhopper instead of using Anylogic’s in-built routing. Graphhopper is an open-source java routing engine that parses OpenStreetMap data and calculates the shortest path between two coordinates [46]. It allows creating custom routing profiles and changing the weight function of the route. As our bike has specific characteristics (speed, type of route where it can drive) and can drive with different modes, we have developed two routing profiles in Graphhopper, one for the autonomous mode and one for the manual mode.
4.2. Scenario Description
In this work, we aim to compare the impact of the periodic rebalancing and the rebalancing after rental on the performance indicators, while varying the rebalancing frequency for two different operational areas. The rebalancing frequency mainly affects the periodic rebalancing. Therefore, we will first compare the different relocation types with a rebalancing frequency of 1 h intervals as the demand generation and prediction is determined on an hourly basis. After that, we will test with different rebalancing frequencies for the periodic relocation. We compare all the results to a base case where no rebalancing operation is performed (there is no periodic rebalancing and after rental, the bike goes to the nearest waiting station). For each scenario, we run several tests to determine the minimum fleet size required for ensuring an hourly service level above 94%. We compare the results of different scenarios with their minimum fleet size.
We evaluate the different scenarios based on the following set of performance indicators:
- Global service level: percentage of satisfied customers from the beginning of the simulation.
- Hourly service level: the service level for each hour during the day. It is mainly used to evaluate the service level during peak hours, which should be above 94% for OSABS.
- Number of bikes: minimum number of bikes required to ensure 94% hourly service level.
- Empty vehicle mileage traveled (VMT) for rebalancing: total mileage traveled to relocate bikes in km.
- Energy consumption for rebalancing: the energy consumed for rebalancing operation in kWh.
4.3. Inner City Results
4.3.1. One Hour Rebalancing Interval
In Table 1, we present the minimum number of bikes needed to achieve the 94% hourly service level (SL) and the global service level of the corresponding scenario. We compare the rebalancing distance and the rebalancing energy for each relocation type and 1 h rebalancing frequency, respectively, in Figure 4 and Figure 5.

Table 1.
The minimum number of bikes for 94% hourly SL and the corresponding global SL.
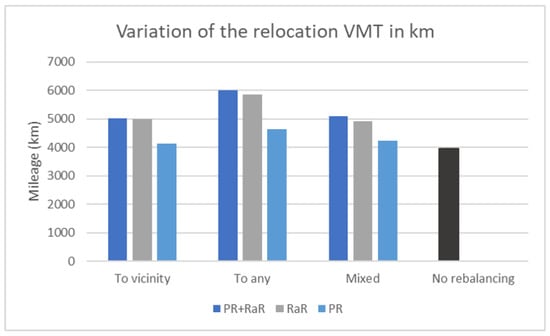
Figure 4.
Variation of idle VMT.
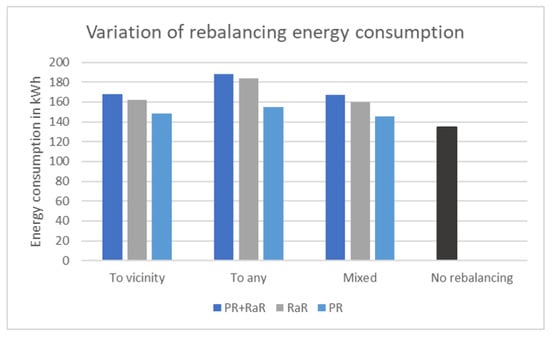
Figure 5.
Variation of rebalancing energy consumption.
As we can observe, the three rebalancing strategies require a similar number of bikes for the different relocation types. Nevertheless, there is a slight difference in the effort made to achieve the needed service level, as seen in the relocation distance and energy values in Figure 4 and Figure 5. These results confirm the finding of the previous study [37] where we had very similar service levels for the (PR + RaR) case of the three relocation strategies. A new finding for this paper is that the strategies where rebalancing after rental (RaR) is applied required the least number of bikes. One straightforward conclusion is that relocating bikes after use is essential for OSABS to guarantee system efficiency. We also remark that the difference between “PR + RR” and “RaR” is very slight in terms of global service level with the same number of bikes. We can conclude that applying a periodic relocation with the relocation after the rental strategy has no benefits on the service level. Furthermore, we remark that the number of bikes needed for the “PR” rebalancing is quite important. Therefore, we will reduce the rebalancing interval for the periodic relocation and evaluate the results.
As expected, the highest values of energy consumption and idle VMT are for the combination scenario (PR + RaR) of the “to any” strategy. The values for the (RaR) cases are also high while the periodic rebalancing values could be compared to those of the “no rebalancing” case. Of the three relocation strategies, the “to vicinity” scenarios have the least energy consumption. In conclusion, we can say that the relocation after rental for the “to vicinity” strategy gives the best system performance with lower energy consumption and idle VMT compared to the combination scenario. Thus, implementing the two types of relocation has no benefits. In addition, the periodic relocation improves the system performance with a low increase in resource use compared to the “no rebalancing” case.
4.3.2. Variation of Rebalancing Frequency
As we have observed in the previous experiments, periodic rebalancing (PR) has poor performance compared to relocation after rental (RaR). Therefore, we aim to increase the periodic rebalancing frequency and study its impact on system efficiency. We have tested for two additional rebalancing intervals: 10 min (which corresponds to the average rent duration of OSABS) and 30 min (as an in-between value between 1 h and 10 min) and we compare the results with the 1 h rebalancing case. In Table 2, we present the minimum number of bikes for 94% hourly service level and the global service level for the different scenarios of various rebalancing frequencies and we compare the results to the (RaR) case where we had the best system performance. In Figure 6 and Figure 7, we present respectively the rebalancing VMT and the energy consumption.
Table 2.
The number of bikes and the global SL for different rebalancing frequencies (Inner city scenario).
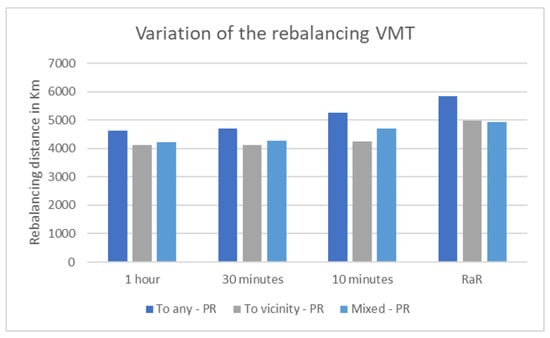
Figure 6.
Variation of the idle VMT for different rebalancing frequencies (Inner city scenario).
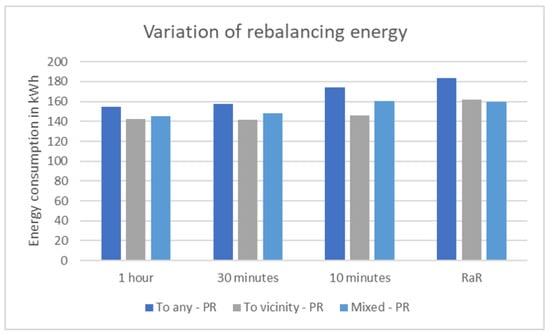
Figure 7.
Variation of the rebalancing energy consumption for different rebalancing frequencies (Inner city scenario).
As shown in Table 2, the number of bikes has considerably decreased when we increase the rebalancing frequency. For the 10 min rebalancing interval, we have very close results to the (RaR) case with only one bike difference and a slight surpass for the (RaR) in the service level. However, we can also observe that the distance traveled and the energy consumption are lower for the 10 min (PR) than (RaR). Among the different scenarios, we obtain the least energy consumption and the best service level when applying the “to vicinity” strategy. Therefore, we can conclude that it is the most efficient relocation strategy for OSABS in the inner city.
4.4. Complete City Results
4.4.1. One Hour Rebalancing Interval
In Table 3, we present the minimum number of bikes needed to achieve the 94% hourly service level (SL) and the global service level of the corresponding scenario. We compare the rebalancing distance and the rebalancing energy for each relocation type, considering 1 h rebalancing frequency, respectively, in Figure 8 and Figure 9.
Table 3.
The minimum number of bikes for 94% hourly SL and the corresponding global SL for the complete city.
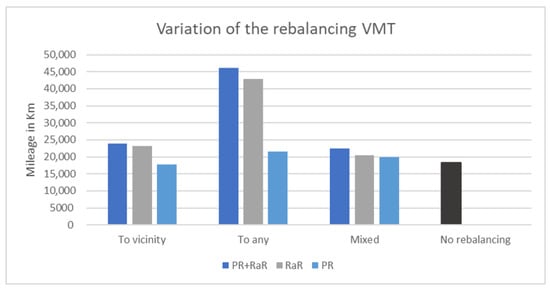
Figure 8.
Variation of idle VMT for the complete city.
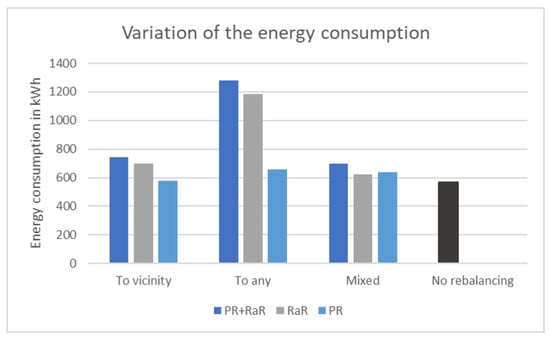
Figure 9.
Variation of the rebalancing energy consumption for the complete city.
Unlike the inner city scenario, the to-vicinity strategy has the worst performance among the three relocation strategies. The (PR) case leads to an increase in the number of bikes in the system, by approx. 4% for the “to any” strategy compared to (RaR), 14% for the mixed strategy, and 19% for the “to vicinity” strategy. We also notice that the combined scenario (PR + RaR) leads to barely better results compared to the (RaR) case, mainly for the “to any” and “mixed” strategies, while it has no effect on the “to vicinity” strategy. We also observe that the “mixed” strategy outperforms the “to any” rebalancing mainly for the (RaR) and (PR + RaR) cases, while the “to any” strategy gives better results for the (PR) case. This could be explained by the fact that the “to any” strategy entails excessive rebalancing and thereafter high energy consumption. This leads to low battery levels and the necessity to go for charging, which results in a decrease in the bike availability and service level.
By analyzing the idle mileage traveled and the energy consumption, we can conclude that the “mixed” strategy achieves the best performance. It has comparable values to the “no rebalancing” case and, in some cases, it consumes less energy than the “to vicinity” strategy. We also notice the trade-off between energy consumption and the decrease in the number of bikes. For the (PR + RaR) case, it leads to a higher resource use compared to the (RaR) case. A financial analysis should indicate whether it is worthy to use a combined scenario to slightly reduce the number of bikes while increasing the idle energy consumption. For the “to any” strategy, the only scenario that could be compared to the other rebalancing strategies in terms of energy consumption is the (PR) case. However, it requires a quite high number of bikes compared to the (RaR) and (PR + RaR) cases of the “mixed” strategy and where we have approximately the same energy consumption.
4.4.2. Variation of Rebalancing Frequency
For the complete city, we have also tested for the two rebalancing intervals: 10 min and 30 min. However, we will compare the results to the (PR + RaR) case as it resulted in the minimum number of bikes with a low increase in resource use compared to the (RaR) case. In Table 4, we present the minimum number of bikes for 94% hourly service level and the global service level for the different scenarios. We illustrate the rebalancing VMT and the energy consumption, respectively, in Figure 10 and Figure 11.
Table 4.
The number of bikes and the global SL for different rebalancing frequencies (complete city scenario).
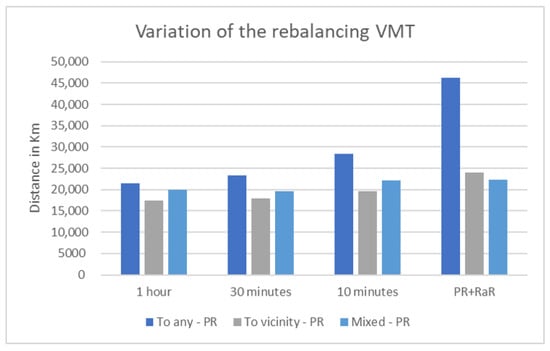
Figure 10.
Variation of the idle VMT for different rebalancing frequencies (complete city scenario).
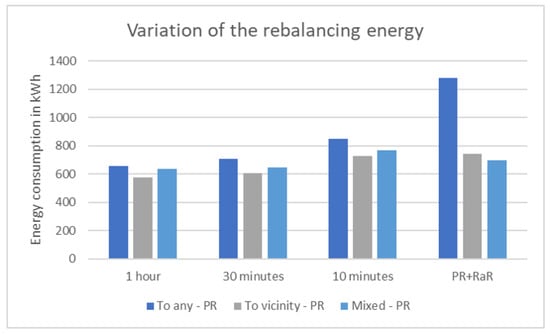
Figure 11.
Variation of the rebalancing energy consumption for different rebalancing frequencies (complete city scenario).
The results indicate that increasing the periodic rebalancing frequency could lead to a significant decrease in the number of bikes. For a periodic rebalancing every 10 min with the “to any” strategy, the performance indicators’ output surpasses the (PR + RaR) case. It leads to fewer bikes and a decrease of 33% in energy consumption. However, we still have the best system performance with the “mixed” (PR + RaR) case.
5. Discussion
This paper addresses the rebalancing problem for OSABS specifically and for AMoD services in general. We investigated how the rebalancing performance is affected by the operational area, the relocation type, and the frequency applied. The results collected with numerical experiments for the city of Magdeburg, Germany, provide detailed insights into how the fleet size, operational costs, and service levels develop under scenarios of different rebalancing configurations.
First, we show that the optimal choice of the fleet rebalancing strategy is strongly associated with the service area. For the inner city, the service operates in a small area and the demand imbalance between the different regions is low. Therefore, the “to vicinity” strategy has proved to ensure the best system performance with the lowest resource use. However, when we consider the complete city, we have a significant demand imbalance between the regions, and the service area is large. Thus, relocating bikes only from the vicinity could not allow adjusting the imbalance. These results confirm the fact that rebalancing operation is more crucial for suburban areas. It allows a considerable reduction in the fleet size reducing by this the investment and operations costs. Therefore, OSABS is presented as an innovative solution for connecting suburban areas to the inner city. One disadvantage of conventional bike-sharing is that it mainly operates in the inner city because of the inefficiency of the service for the rural areas. The major barriers to the use of CBS in suburban areas are the high prices of a bike rent (as a result of high rebalancing efforts), the need to transport children, and the unavailability of bike stations which results in a long distance between the customer location and a station [47]. Thanks to autonomous driving, OSABS bikes could drive to the customer location and perform proactive rebalancing allowing a high system efficiency with minimal costs. In addition, users can transport their children on the cargo bike. We believe that OSABS could present a viable mobility solution in suburban areas. Considering that people who live in rural areas are more likely to decrease car usage than those living in urban areas [48], the introduction of autonomous cargo bikes in suburban and rural areas could boost a modal shift from cars to bikes.
Second, we can conclude that, in most cases, (RaR) performs better than (PR). As we do not include the customer destination prediction in our rebalancing problem, it is hard to relocate bikes efficiently for 1 h or 30 min intervals. Considering a 10 min average rent duration, the bikes will move unpredictably around the network just after 10 min of the periodic rebalancing, canceling the relocation effect. However, the prediction of the customer destination will add more uncertainty to the model and could not be completely reliable. Therefore, (RaR) remains a better solution than (PR) because it allows real-time rebalancing and adjusts continuously the imbalance value after each customer request. Nevertheless, (PR) could help in moving bikes from areas where demand is rare or irregular. Therefore, we found that combining (PR) with (RaR) leads to system efficiency improvement for the complete city scenario. Unlike the results of [35] where (PR) was found unnecessary for autonomous cars, these results recommend adding (PR), especially for a large area where the imbalance between the different regions is significant.
Third, a conclusion that we can suggest is that our system outperforms the rebalancing of CBSS. The periodic rebalancing could be compared to the operator-based relocation done by the trucks. While this relocation is not frequent (generally static or only during peak hours), it is not efficient compared to the rebalancing after rental. Thus, with the autonomous driving option, our system improves considerably the system efficiency by decreasing the required number of bikes in the system. From a life cycle perspective, the embodied emissions and energy consumption in bike production should not be neglected. Producing an excessive number of bikes leads to a large waste of energy and generates enormous GHG emissions [49]. Therefore, it is important to reduce the number of bikes in the system and ensure optimized use of the fleet. In addition, the use of trucks for rebalancing in CBS leads to fuel consumption and gas emissions [50]. With OSABS, there is no need for trucks to relocate bikes. This way, the bike rebalancing operation becomes more sustainable, with no gas emissions and less congestion compared to conventional systems. The assessment of OSABS benefits and the evaluation of rebalancing strategy need to be assessed by life cycle assessment (LCA) in future work [51,52] for a better comparison between OSABS and CBS.
Fourth, the experiment’s results indicate that excessive rebalancing does not necessarily lead to better system performance. An overuse of bikes for relocation could lead to frequent battery charging and reduce the bikes’ availability. These results highlight the importance of jointly optimizing the rebalancing and the charging operation. Implementing an adequate charging strategy has a high impact on the performance of the system [29]. More research is needed to develop an advanced model integrating rebalancing with a charging policy.
Fifth, we believe that these results could be better evaluated if we consider the costs associated with the bike investment and energy consumption. While it is hard to give precise values at this stage of research, we will evaluate the results according to first estimations based on our talks with industry experts and our best knowledge of the market price [37]. Table 5 presents the cost assumptions of our study.
Table 5.
Cost assumptions [37].
Using the above costs, we calculate the energy and investment costs for the two scenarios “mixed (RaR)” and “mixed (PR + RaR)”. We obtained the following results presented in Table 6.
Table 6.
Cost calculation for the simulated day.
As we can see, the total costs for the combined case are less than the (RaR) case. In fact, for OSABS, the major costs are related to the investment costs. Therefore, reducing the number of bikes leads to fewer costs even if it is associated with a slight increase in energy consumption. In addition, considering that the service level of the combined scenario is higher, then it leads absolutely to higher profits. Nevertheless, in this work, we do not take into account the impact of demand uncertainty on the rebalancing performances as in [53]. A system with a small increase in the number of bikes could lead to more stable results in an uncertain environment.
6. Conclusions
This paper investigates the influence of rebalancing type, frequency, and service area on the performance indicators of an autonomous on-demand mobility system. Autonomous vehicles allow for two rebalancing options: periodic rebalancing and rebalancing after rental. The results reveal the trade-offs between decreasing fleet size and increasing energy consumption. Although the combined strategy ensures a minimal number of bikes in the system, it results in an increase in idle mileage and energy consumption. However, the reduction in fleet size results in significant financial benefits through lower capital investment, lower overall energy consumption, and reduced maintenance costs. Periodic relocation uses few resources and could yield satisfactory results if implemented with adequate frequency, as is the case for the 10-min “to any” scenario. The relationship between fleet size and energy consumption is not linear and cannot be specified by a ratio. The model has various constraints that make the interaction between the different elements unpredictable. The main constraint is that we use batteries for our bicycles, and excessive use of the bicycles could lead to their unavailability during peak hours and thus deteriorate the performance of the system (as is the case for the “to any (PR + RaR)” strategy). In addition, we have the 10 min constraint for assigning bikes to requests. Furthermore, the trade-off depends heavily on the rebalancing strategy implemented. While a 9.79% increase in rebalancing energy compared to the “no rebalancing” case decreased the fleet size by 39.46% for the “mixed (RaR)” strategy, it took a 108.97% increase in rebalancing energy to decrease the fleet size by 38.38% for the “to any (RaR)” strategy. These results show that some rebalancing operations can use high resources for little improvement in system efficiency and service level. Therefore, it would be recommended to use a dynamic pricing scheme for OSABS, where requests that require more rebalancing miles are penalized.
As a recommendation for decision makers, we could suggest implementing the mixed rebalancing strategy for relocation after rental and periodic relocation considering a frequency of one hour. The mixed strategy performed best for the full city scenario. For the inner city area, it is very close to the “to vicinity” strategy in terms of energy consumption and service level and requires exactly the same number of bikes. Therefore, the mixed strategy is the best strategy to implement for both scenarios by providing efficient system rebalancing with minimized costs.
The results of this work should be considered with caution due to a set of limitations that merit improvement in future works. We are simulating only one demand scenario for one day and we are missing the impact of the demand variation on rebalancing performance. Further research aims to investigate the likelihood of results with other cities and various magnitude demands. The design of an extended model with a one-year simulation and different demand scenarios (from low to high) is under development.
Author Contributions
All of the authors have contributed to the idea of this paper. I.H.S. developed and implemented the different relocation strategies in the simulation, designed the experiments, and wrote most of the manuscript. V.D.M. developed the simulation model and contributed to the manuscript in the model description section. M.K. contributed to the development of demand scenarios and wrote the demand generation section. T.A. is the leader of the project and contributed to the demand generation section. H.Z. supervised the work. All authors have read and agreed to the published version of the manuscript.
Funding
This project is funded by the federal state of Saxony-Anhalt and the European Regional Development Funds (EFRE, 2014-2020), project number 19-15003/004.
Data Availability Statement
Publicly available datasets were analyzed in this study in order to create the demand scenarios. The data of the conventional bike-sharing can be found here: https://data.deutschebahn.com/dataset/data-call-a-bike/resource/0fcce4dd-7fc6-43f8-a59c-983a7945f8ba.html (accessed on 10 March 2022), and the weather data could be found here https://opendata.dwd.de/ (accessed on 25 March 2022). Restrictions apply to the availability of the social demographic data and the population data (statistical data) used in this study. Data were obtained from the municipality of Magdeburg and are available on request from the corresponding author with the permission of the municipality.
Conflicts of Interest
The authors declare no conflict of interest.
Abbreviations
The following abbreviations are used in this manuscript:
| OSABS | On-demand Shared-use Autonomous Bikes Service |
| AMoD | Autonomous Mobility on-Demand |
| CBSS | Conventional Bike-Sharing System |
| OBR | Operator-Based Rebalancing |
| UBR | User-Based Rebalancing |
| SRP | Static Repositioning Problem |
| DRP | Dynamic Repositioning Problem |
| ABM | Agent Based Models |
| PR | Periodic Rebalancing |
| RaR | Relocation after Rental |
| SL | Service Level |
| HSL | Hourly Service Level |
| VMT | Vehicle Mileage Traveled |
References
- Earley, R.; Newman, P.W.G. Transport in the Aftermath of COVID-19: Lessons Learned and Future Directions. J. Transp. Technol. 2021, 11, 109–127. [Google Scholar] [CrossRef]
- Othman, K. Exploring the implications of autonomous vehicles: A comprehensive review. Innov. Infrastruct. Solut. 2022, 7, 165. [Google Scholar] [CrossRef]
- Czech, P. Autonomous vehicles: Basic issues. Sci. J. Silesian Univ. Technol. Ser. Transp. 2018, 100, 15–22. [Google Scholar] [CrossRef]
- Clausen, U.; Stütz, S.; Bernsmann, A.H.H. ZF-ZUKUNFTSSTUDIE 2016 Die letzte Meile; ZF Friedrichshafen AG.: Friedrichshafen, Germany, 2016. [Google Scholar]
- Assmann, T.; Matthies, E.; Gehlmann, F.; Schmidt, S. Shared autonomous cargo bike fleets-a better solution for future mobility than shared autonomous car fleets? In Proceedings of the European Transport Conference 2020, Online, 8–11 September 2020. [Google Scholar]
- Billhardt, H.; Fernández, A.; Lemus, L.; Lujak, M.; Osman, N.; Ossowski, S.; Sierra, C. Dynamic Coordination in Fleet Management Systems: Toward Smart Cyber Fleets. IEEE Intell. Syst. 2014, 29, 70–76. [Google Scholar] [CrossRef]
- DeMaio, P. Bike-sharing: History, Impacts, Models of Provision, and Future. J. Public Transp. 2009, 12, 3. [Google Scholar] [CrossRef]
- Shaheen, S.A.; Guzman, S.; Zhang, H. Bikesharing in Europe, the Americas, and Asia: Past, Present, and Future. Transp. Res. Rec. 2010, 2143, 159–167. [Google Scholar] [CrossRef]
- Bruck, B.P.; Cruz, F.; Iori, M.; Subramanian, A. The Static Bike Sharing Rebalancing Problem with Forbidden Temporary Operations. Transp. Sci. 2019, 53, 882–896. [Google Scholar] [CrossRef]
- Erdoğan, G.; Laporte, G.; Calvo, R.W. The static bicycle relocation problem with demand intervals. Eur. J. Oper. Res. 2014, 238, 451–457. [Google Scholar] [CrossRef]
- Faghih-Imani, A.; Hampshire, R.C.; Marla, L.; Eluru, N. An Empirical Analysis of Bike Sharing Usage and Rebalancing: Evidence from Barcelona and Seville. Transp. Res. Part A Policy Pract. 2017, 97, 177–191. [Google Scholar] [CrossRef]
- Di, H.; Di, H.; Xinyuan, C.; Liu, Z.; Lyu, C.; Wang, S.; Chen, X. A static bike repositioning model in a hub-and-spoke network framework. Transp. Res. Part E Logist. Transp. Rev. 2020, 141, 102031. [Google Scholar]
- Ren, Y.; Zhao, F.; Jin, H.; Jiao, Z.; Meng, L.; Zhang, C.; Sutherland, J.W. Rebalancing Bike Sharing Systems for Minimizing Depot Inventory and Traveling Costs. IEEE Trans. Intell. Transp. Syst. 2020, 21, 3871–3882. [Google Scholar] [CrossRef]
- Tian, Z.; Zhou, J.; Szeto, W.; Tian, L.; Zhang, W. The rebalancing of bike-sharing system under flow-type task window. Transp. Res. Part C Emerg. Technol. 2020, 112, 1–27. [Google Scholar] [CrossRef]
- Zhang, D.; Yu, C.; Desai, J.; Lau, H.; Srivathsan, S. A time-space network flow approach to dynamic repositioning in bicycle sharing systems. Transp. Res. Part B Methodol. 2017, 103, 188–207. [Google Scholar] [CrossRef]
- Zhao, D.; Ong, G.; Wang, W.; Hu, X. Effect of built environment on shared bicycle reallocation: A case study on Nanjing, China. Transp. Res. Part A Policy Pract. 2019, 128, 73–88. [Google Scholar] [CrossRef]
- Fricker, C.; Gast, N. Incentives and Redistribution in Homogeneous Bike-Sharing Systems with Stations of Finite Capacity. EURO J. Transp. Logist. 2016, 5, 261–291. [Google Scholar] [CrossRef]
- Haider, Z.; Nikolaev, A.G.; Kang, J.E.; Kwon, C. Inventory rebalancing through pricing in public bike sharing systems. Eur. J. Oper. Res. 2018, 270, 103–117. [Google Scholar] [CrossRef]
- You, P.S.; Hsieh, Y. Operator- and user-based rebalancing strategy for bike-sharing systems. J. Intell. Fuzzy Syst. 2021, 40, 1–12. [Google Scholar] [CrossRef]
- Cheng, Y.F.; Wang, J.; Wang, Y. A user-based bike rebalancing strategy for free-floating bike sharing systems: A bidding model. Transp. Res. Part E Logist. Transp. Rev. 2021, 154, 102438. [Google Scholar] [CrossRef]
- Ho, S.C.; Szeto, W. A hybrid large neighborhood search for the static multi-vehicle bike-repositioning problem. Transp. Res. Part B Methodol. 2017, 95, 340–363. [Google Scholar] [CrossRef]
- Espegren, H.M.; Kristianslund, J.; Andersson, H.; Fagerholt, K. The Static Bicycle Repositioning Problem—Literature Survey and New Formulation. In Proceedings of the 7th International Conference on Computational Logistics (ICCL’16), Lisbon, Portugal, 7–9 September 2016. [Google Scholar]
- Chiariotti, F.; Pielli, C.; Zanella, A.; Zorzi, M. A dynamic approach to rebalancing bike-sharing systems. Sensors 2018, 18, 512. [Google Scholar] [CrossRef]
- Vallez, C.M.; Castro, M.; Contreras, D. Challenges and Opportunities in Dock-Based Bike-Sharing Rebalancing: A Systematic Review. Sustainability 2021, 13, 1829. [Google Scholar] [CrossRef]
- Spieser, K.; Samaranayake, S.; Gruel, W.; Frazzoli, E. Shared-Vehicle Mobility-on-Demand Systems: A Fleet Operator’s Guide to Rebalancing Empty Vehicles. In Proceedings of the Transportation Research Board 95th Annual Meeting, Washington, DC, USA, 10–14 January 2016. [Google Scholar]
- Shen, W.; Lopes, C.V. Managing Autonomous Mobility on Demand Systems for Better Passenger Experience. In Proceedings of the PRIMA 2015: Principles and Practice of Multi-Agent Systems 18th International Conference, Bertinoro, Italy, 26–30 October 2015. [Google Scholar]
- Winter, K.; Cats, O.; van Arem, B.; Martens, K. Impact of relocation strategies for a fleet of shared automated vehicles on service efficiency, effectiveness and externalities. In Proceedings of the 2017 5th IEEE International Conference on Models and Technologies for Intelligent Transportation Systems (MT-ITS), Naples, Italy, 26–28 June 2017; pp. 844–849. [Google Scholar] [CrossRef]
- Fagnant, D.J.; Kockelman, K.M. The travel and environmental implications of shared autonomous vehicles, using agent-based model scenarios. Transp. Res. Part C Emerg. Technol. 2014, 40, 1–13. [Google Scholar] [CrossRef]
- Chen, T.D.; Kockelman, K.M.; Hanna, J.P. Operations of a shared, autonomous, electric vehicle fleet: Implications of vehicle & charging infrastructure decisions. Transp. Res. Part A Policy Pract. 2016, 94, 243–254. [Google Scholar] [CrossRef]
- Pavone, M.; Smith, S.L.; Frazzoli, E.; Rus, D. Robotic load balancing for mobility-on-demand systems. Int. J. Robot. Res. 2012, 31, 839–854. [Google Scholar] [CrossRef]
- Tsao, M.; Iglesias, R.; Pavone, M. Stochastic Model Predictive Control for Autonomous Mobility on Demand. In Proceedings of the 2018 21st International Conference on Intelligent Transportation Systems (ITSC), Maui, HI, USA, 4–7 November 2018; pp. 3941–3948. [Google Scholar] [CrossRef]
- Azevedo, C.L.; Marczuk, K.; Raveau, S.; Soh, H.; Adnan, M.; Basak, K.; Loganathan, H.; Deshmunkh, N.; Lee, D.H.; Frazzoli, E.; et al. Microsimulation of demand and supply of autonomous mobility on demand. Transp. Res. Rec. 2016, 2564, 21–30. [Google Scholar] [CrossRef]
- Wallar, A.; Van Der Zee, M.; Alonso-Mora, J.; Rus, D. Vehicle Rebalancing for Mobility-on-Demand Systems with Ride-Sharing. In Proceedings of the 2018 IEEE/RSJ International Conference on Intelligent Robots and Systems (IROS), Madrid, Spain, 1–5 October 2018; pp. 4539–4546. [Google Scholar] [CrossRef]
- Marczuk, K.; Soh, H.; Lima Azevedo, C.; Lee, D.H.; Frazzoli, E. Simulation Framework for Rebalancing of Autonomous Mobility on Demand Systems. MATEC Web Conf. 2016, 81, 01005. [Google Scholar] [CrossRef]
- Brendel, A.B.; Lichtenberg, S.; Nastjuk, I.; Kolbe, L.M. Adapting Carsharing Vehicle Relocation Strategies for Shared Autonomous Electric Vehicle Services. In Proceedings of the International Conference on Information Systems—Transforming Society with Digital Innovation, ICIS 2017, Seoul, Korea, 10–13 December 2017. [Google Scholar]
- Winter, K.; Cats, O.; Martens, K.; Arem, B. Relocating shared automated vehicles under parking constraints: Assessing the impact of different strategies for on-street parking. Transportation 2021, 48, 1931–1965. [Google Scholar] [CrossRef]
- Haj Salah, I.; Mukku, V.D.; Kania, M.; Assmann, T. Towards Sustainable Liveable City: Management Operations of Shared Autonomous Cargo-Bike Fleets. Future Transp. 2021, 1, 505–532. [Google Scholar] [CrossRef]
- Jing, P.; Hu, H.; Zhan, F.; Chen, Y.; Shi, Y. Agent-Based Simulation of Autonomous Vehicles: A Systematic Literature Review. IEEE Access 2020, 8, 79089–79103. [Google Scholar] [CrossRef]
- Scheltes, A.; de Almeida Correia, G.H. Exploring the use of automated vehicles as last mile connection of train trips through an agent-based simulation model: An application to Delft, Netherlands. Int. J. Transp. Sci. Technol. 2017, 6, 28–41. [Google Scholar] [CrossRef]
- Haj-Salah, I.; Mukku, V.D.; Schmidt, S.; Assmann, T. A Conceptual Model for the Simulation of the Next Generation Bike-Sharing System with Self-Driving Cargo-Bikes; Springer Science and Business Media Deutschland GmbH: Berlin/Heidelberg, Germany, 2021; Volume 1278, pp. 253–262. [Google Scholar] [CrossRef]
- Giot, R.; Cherrier, R. Predicting bikeshare system usage up to one day ahead. In Proceedings of the 2014 IEEE Symposium on Computational Intelligence in Vehicles and Transportation Systems (CIVTS), Orlando, FL, USA, 9–12 December 2014; pp. 22–29. [Google Scholar]
- Yang, Z.; Hu, J.; Shu, Y.; Cheng, P.; Chen, J.; Moscibroda, T. Mobility Modeling and Prediction in Bike-Sharing Systems. In Proceedings of the 14th Annual International Conference on Mobile Systems, Applications, and Services, Singapore, 26–30 June 2016; pp. 165–178. [Google Scholar] [CrossRef]
- Cantelmo, G.; Kucharski, R.; Antoniou, C. Low-Dimensional Model for Bike-Sharing Demand Forecasting that Explicitly Accounts for Weather Data. Transp. Res. Rec. 2020, 2674, 132–144. [Google Scholar] [CrossRef]
- Garcia-Gutierrez, J.; Romero-Torres, J.; Gaytan-Iniestra, J. Dimensioning of a Bike Sharing System (BSS): A Study Case in Nezahualcoyotl, Mexico. Procedia Soc. Behav. Sci. 2014, 162, 253–262. [Google Scholar] [CrossRef][Green Version]
- Mukku, V.D.; Salah, I.H.; Assmann, T. Simulation Testbed for the next-generation Bike-Sharing System with Self-driving Cargo-Bikes. IFAC-PapersOnLine 2021, 54, 1098–1103. [Google Scholar] [CrossRef]
- GitHub. Graphhopper/Graphhopper: Open Source Routing Engine for OpenStreetMap. Use It as Java Library or Server. Available online: https://github.com/graphhopper/graphhopper (accessed on 15 March 2022).
- Bielinski, T.; Dopierala, l.; Tarkowski, M.; Ważna, A. Lessons from Implementing a Metropolitan Electric Bike Sharing System. Energies 2020, 13, 6240. [Google Scholar] [CrossRef]
- Sun, Q.; Feng, T.; Kemperman, A.; Spahn, A. Modal shift implications of e-bike use in the Netherlands: Moving towards sustainability? Transp. Res. Part D Transp. Environ. 2020, 78, 102202. [Google Scholar] [CrossRef]
- Coelho, M.C.; Almeida, D. Cycling Mobility—A Life Cycle Assessment Based Approach. Transp. Res. Procedia 2015, 10, 443–451. [Google Scholar] [CrossRef]
- Pal, A.; Zhang, Y. Free-floating bike sharing: Solving real-life large-scale static rebalancing problems. Transp. Res. Part C Emerg. Technol. 2017, 80, 92–116. [Google Scholar] [CrossRef]
- Luo, H.; Zhao, F.; Chen, W.Q.; Cai, H. Optimizing bike sharing systems from the life cycle greenhouse gas emissions perspective. Transp. Res. Part C Emerg. Technol. 2020, 117, 102705. [Google Scholar] [CrossRef]
- Usama, M.; Shen, Y.; Zahoor, O. Towards an Energy Efficient Solution for Bike-Sharing Rebalancing Problems: A Battery Electric Vehicle Scenario. Energies 2019, 12, 2503. [Google Scholar] [CrossRef]
- Javanshour, F.; Dia, H.; Duncan, G. Exploring the performance of autonomous mobility on-demand systems under demand uncertainty. Transp. A Transp. Sci. 2019, 15, 698–721. [Google Scholar] [CrossRef]


Publisher’s Note: MDPI stays neutral with regard to jurisdictional claims in published maps and institutional affiliations. |
© 2022 by the authors. Licensee MDPI, Basel, Switzerland. This article is an open access article distributed under the terms and conditions of the Creative Commons Attribution (CC BY) license (https://creativecommons.org/licenses/by/4.0/).