
A New Orbiting Deployable System for Small Satellite Observations for Ecology and Earth Observation

 ,
,  ,
,  , ,
, ,  , ,
, ,  ,
,  ,
,  ,
,  , , ,
, , ,  ,
,  ,
, 
 ,
,  ,
,  add
Show full author list
add
Show full author list
Abstract
:1. Introduction
2. Small Satellites for VIS, TIR, and MW Remote Sensing
2.1. Evolution of Small Satellites
2.2. Current Status of Small Satellite Payload for Earth Observation
2.2.1. Optical Payloads
2.2.2. Microwave Payloads
2.3. CubeSats for Earth Observation as an Endpoint Case of Small Satellites
2.4. DORA: Deployable Optics for Remote Sensing Applications
3. Study Cases
3.1. Application 1: Composition of the Atmosphere
3.2. Application 2: Polynya Monitoring in Polar Areas
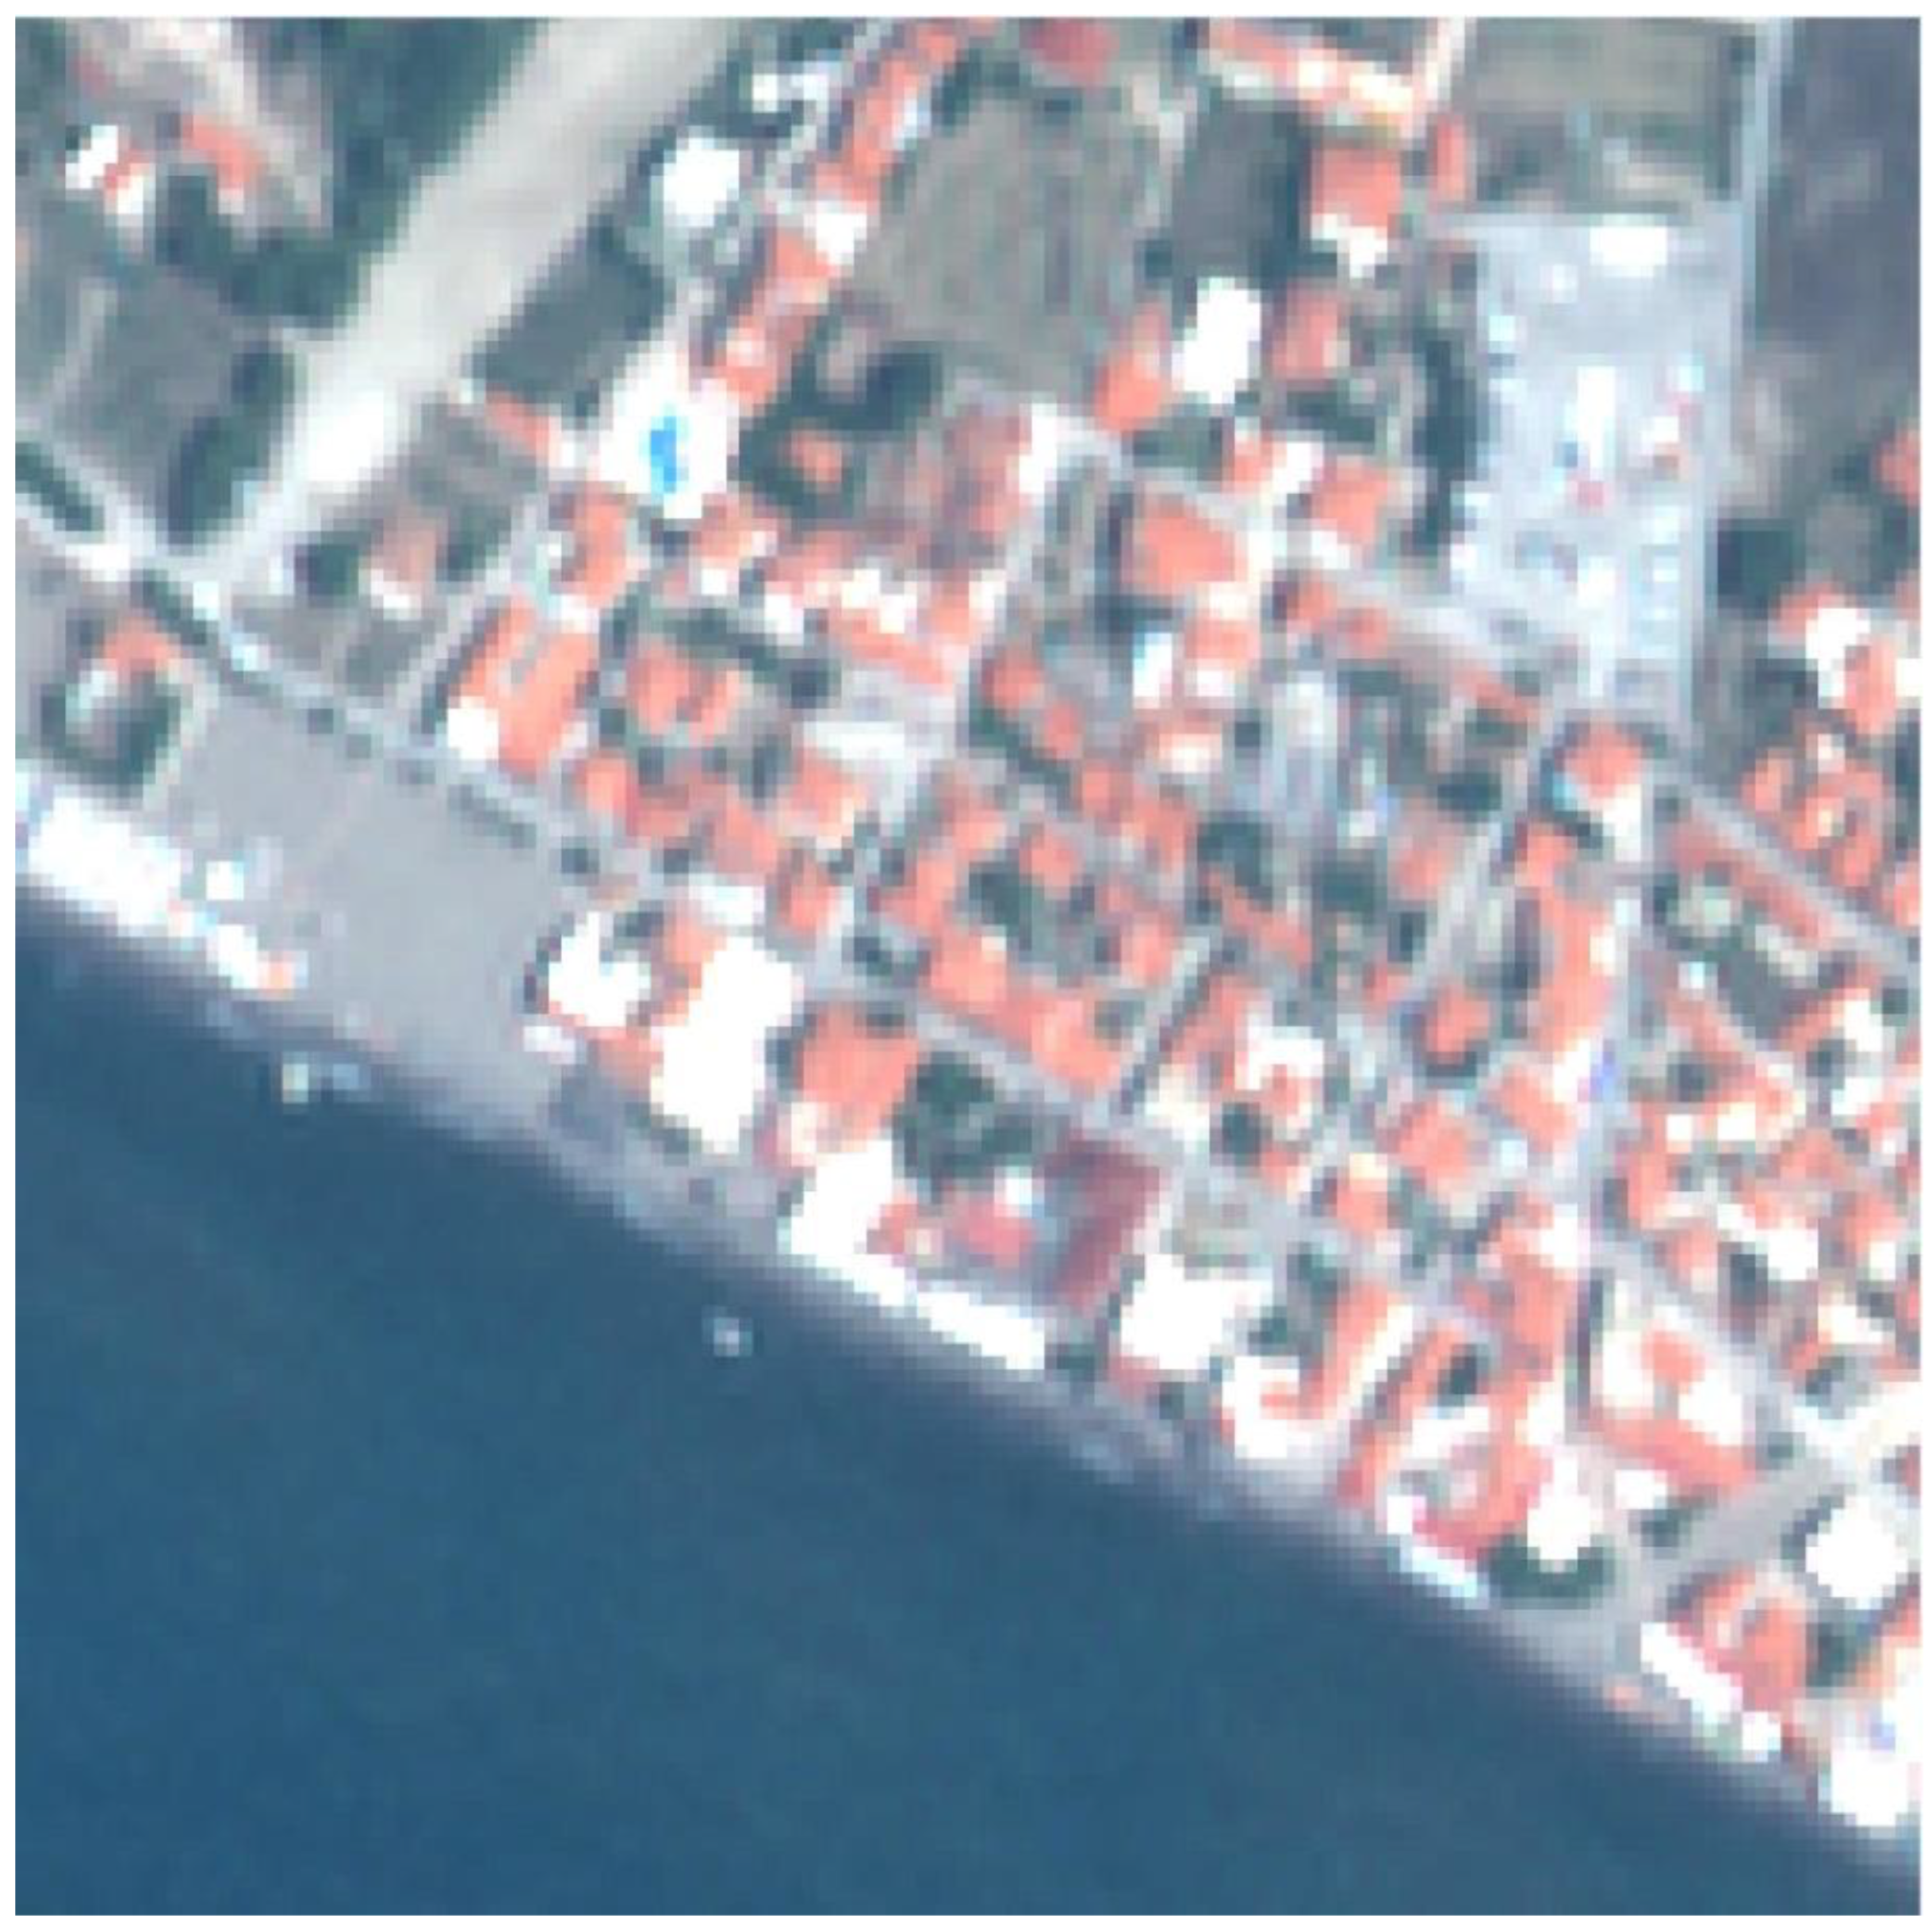
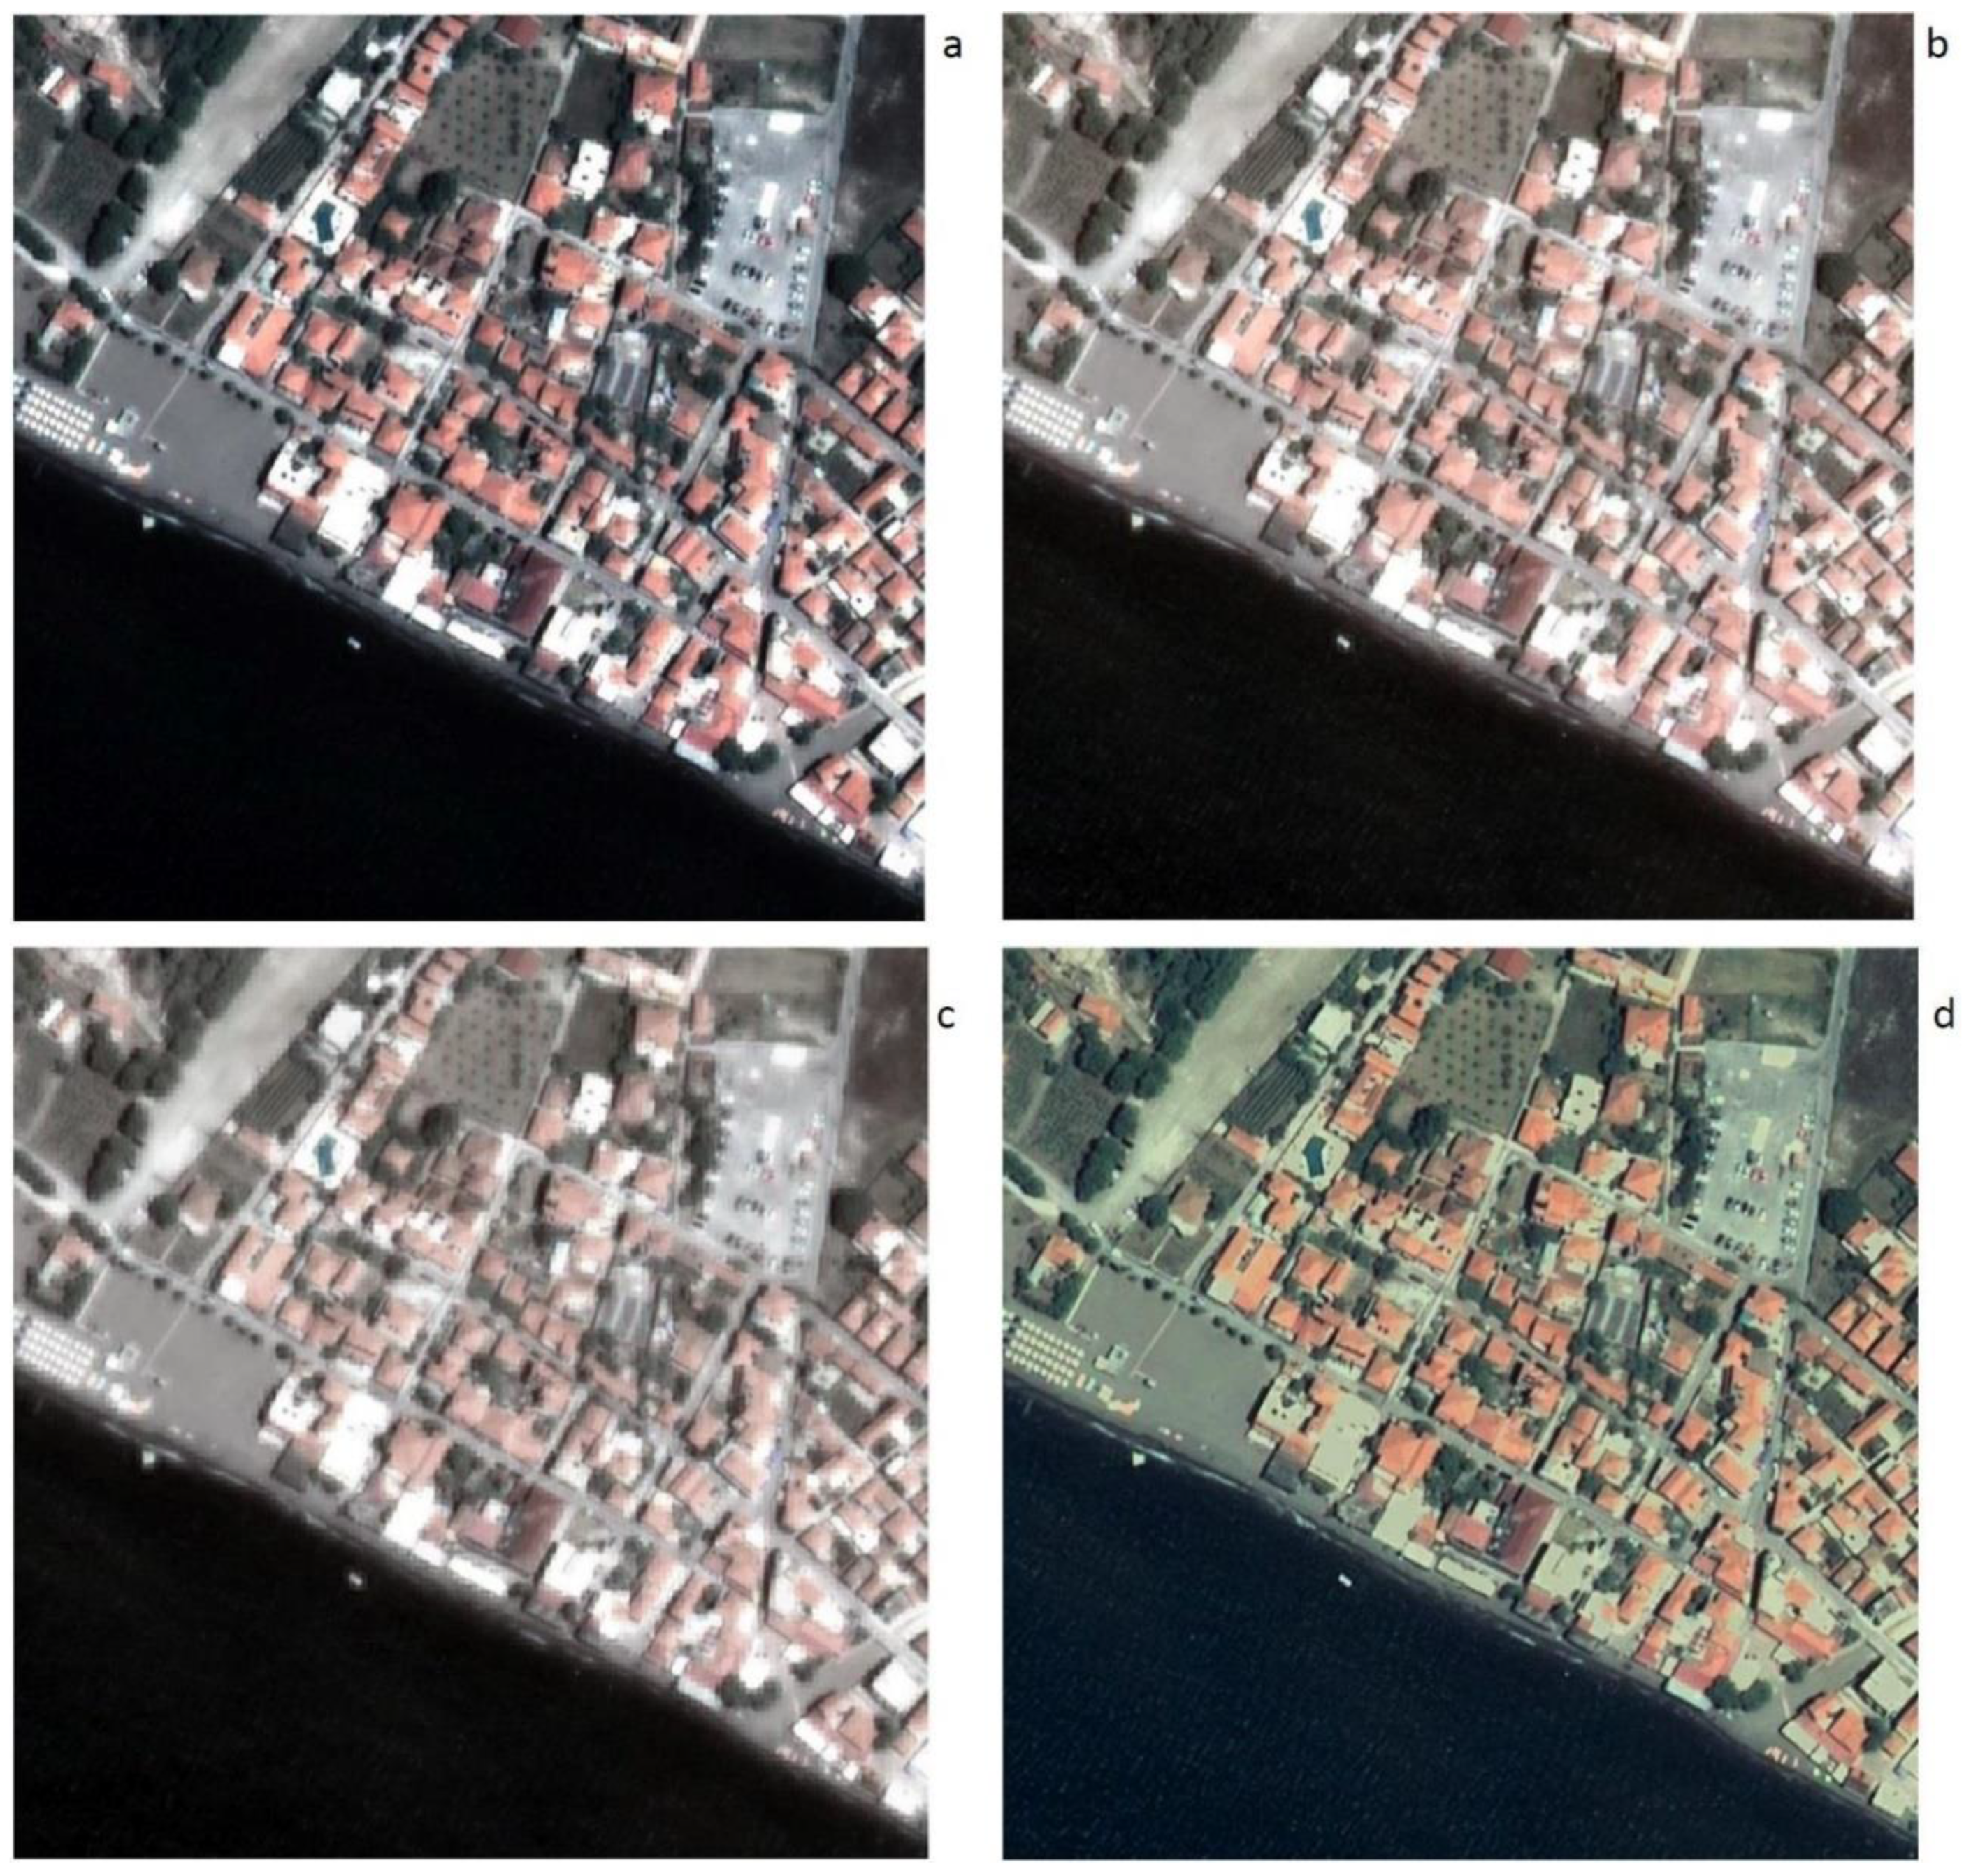
3.3. Application 3: Coastal Area Monitoring
- VIS: 0.46 and 0.54 µm channels provide chlorophyll and other plankton pigment contents; the 0.7 to 0.8 µm region detects the presence of sediments and coastal areas pollution and/or erosion;
- IR: the ~1 to 5 µm range allows to clearly distinguish water from other surfaces;
- TIR: the 8 to 14 µm spectral range detects sea radiation emissions, allowing for the determination of the sea surficial temperature;
- MW: this spectral range provides sea roughness, which allows to obtain information on surface wind, and which affects emissivity, a quantity used to derive sea salinity once the sea surface temperature and the observational conditions are known.
3.3.1. Ocean Color
3.3.2. Sea Surface Temperature
3.3.3. Sea Surface Salinity
3.3.4. Altimetry: Sea Surface Wind and Height
3.4. Application 4: Posidonia Oceanica Monitoring
3.5. Application 5: Precipitations in the Mediterranean Basin
3.6. Application 6: Earth Observation for Vessel Detection
3.7. Application 7: Sea State from SAR and Instrumentation Located Onboard the Vessel
4. Data Fusion Techniques Applied to Remote Sensing Data
5. Radiometric Model as Tool for DORA Feasibility Study
6. Conclusions
Supplementary Materials
Author Contributions
Funding
Acknowledgments
Conflicts of Interest
References
- Canuti, P.; Casagli, N.; Ermini, L.; Fanti, R.; Farina, P. Landslide activity as a geoindicator in Italy: Significance and new perspectives from remote sensing. Environ. Geol. 2004, 45, 907–919. [Google Scholar] [CrossRef]
- De Groeve, T. Flood monitoring and mapping using passive microwave remote sensing in Namibia. Geomat. Nat. Hazards Risk 2010, 1, 19–35. [Google Scholar] [CrossRef]
- Dennison, P.E. Fire detection in imaging spectrometer data using atmospheric carbon dioxide absorption. Int. J. Remote Sens. 2006, 27, 3049–3055. [Google Scholar] [CrossRef]
- Fea, M.; Capaldo, M.; Pesaresi, C. Remote sensing and interdisciplinary approach for forecasting and analysing the effects of hurricanes, tropical cyclones and typhoons. J. Res. Didact. Geogr. 2015, 1, 117–150. [Google Scholar] [CrossRef]
- Geiß, C.; Taubenböck, H. Remote sensing contributing to assess earthquake risk: From a literature review towards a roadmap. Nat. Hazards 2013, 68, 7–48. [Google Scholar] [CrossRef]
- Goldberg, M.D.; Li, S.; Goodman, S.; Lindsey, D.; Sjoberg, B.; Sun, D. Contributions of Operational Satellites in Monitoring the Catastrophic Floodwaters Due to Hurricane Harvey. Remote Sens. 2018, 10, 1256. [Google Scholar] [CrossRef] [Green Version]
- Gonzalez, L.; Briottet, X. North Africa and Saudi Arabia Day/Night Sandstorm Survey (NASCube). Remote Sens. 2017, 9, 896. [Google Scholar] [CrossRef] [Green Version]
- Joyce, K.E.; Belliss, S.E.; Samsonov, S.V.; McNeill, S.J.; Glassey, P.J. A review of the status of satellite remote sensing and image processing techniques for mapping natural hazards and disasters. Prog. Phys. Geog. 2009, 33, 183–207. [Google Scholar] [CrossRef] [Green Version]
- Kaufman, Y.J.; Tucker, C.J.; Fung, I. Remote sensing of biomass burning in the tropics. J. Geophys. Res. 1990, 95, 9927–9939. [Google Scholar] [CrossRef]
- Kunte, P.D.; Aswini, M.A. Detection and monitoring of super sandstorm and its impacts on Arabian Sea—Remote sensing approach. Atmos. Res. 2015, 160, 109–125. [Google Scholar] [CrossRef]
- Mantovani, F.; Soeters, R.; Van Western, C.J. Remote sensing techniques for landslide studies and hazard zonation in Europe. Geomorphology 1996, 15, 213–225. [Google Scholar] [CrossRef]
- Psomiadis, E.; Soulis, K.X.; Zoka, M.; Dercas, N. Synergistic Approach of Remote Sensing and GIS Techniques for Flash-Flood Monitoring and Damage Assessment in Thessaly Plain Area, Greece. Water 2019, 11, 448. [Google Scholar] [CrossRef] [Green Version]
- Sepuru, T.K.; Dube, T. An appraisal on the progress of remote sensing applications in soil erosion mapping and monitoring. Remote Sens. Appl. Soc. Environ. 2018, 9, 1–9. [Google Scholar] [CrossRef]
- Wright, R.; Garbeil, H.; Harris, A.J.L. Using infrared satellite data to drive a thermorheological/stochastic lava flow emplacement model: A method for near-real-time volcanic hazard assessment. Geophys. Res. Lett. 2008, 35, L19307. [Google Scholar] [CrossRef] [Green Version]
- Santilli, G.; Venditozzi, C.; Cappelletti, C.; Battistini, S.; Gessimi, P. CubeSat constellations for disaster management in remote areas. Acta Astronaut. 2018, 145, 11–17. [Google Scholar] [CrossRef]
- Boccardo, P.; Tonolo, F.G. Remote Sensing Role in Emergency Mapping for Disaster Response. In Engineering Geology for Society and Territory; Lollino, G., Manconi, A., Guzzetti, F., Culshaw, M., Bobrowsky, P., Luino, F., Eds.; Springer: Cham, Switzerland, 2015; Volume 5. [Google Scholar] [CrossRef]
- Corbane, C.; Lang, S.; Pipkins, K.; Alleaume, S.; Deshayes, M.; García Millán, V.E.; Strasser, T.; Vanden Borre, J.; Toon, S.; Michael, F. Remote sensing for mapping natural habitats and their conservation status—New opportunities and challenges. Int. Appl. Earth Obs. 2015, 37, 7–16. [Google Scholar] [CrossRef]
- Hoque, M.A.-A.; Phinn, S.; Roselfama, C. A systematic review of tropical cyclone disaster management research using remote sensing and spatial analysis. Ocean Coast. Manag. 2017, 146, 109–120. [Google Scholar] [CrossRef]
- Kaku, K. Satellite remote sensing for disaster management support: A holistic and staged approach based on case studies in Sentinel Asia. Int. J. Disaster Risk Reduct. 2019, 33, 417–432. [Google Scholar] [CrossRef]
- Klemas, V. The Role of Remote Sensing in Predicting and Determining Coastal Storm Impacts. J. Coast. Res. 2009, 2009, 1264–1275. [Google Scholar] [CrossRef] [Green Version]
- Finckenor, M.M.; de Groh, K.K. A Researcher’s Guide to: International Space Station—Space Environmental Effects. NASA ISS Program Science Office; 2019. Available online: https://www.nasa.gov/sites/default/files/files/NP-2015-03-015-JSC_Space_Environment-ISS-Mini-Book-2015-508.pdf (accessed on 22 October 2021).
- Sweeting, M.N. Modern Small Satellites—Changing the Economics of Space. Proc. IEEE 2018, 106, 343–361. [Google Scholar] [CrossRef]
- Belward, A.S.; Skøien, J.O. Who launched what, when and why; trends in global land-coverobservation capacity from civilian Earth Observation satellites. ISPRS J. Photogramm. Remote Sens. 2015, 103, 115–128. [Google Scholar] [CrossRef]
- Gooding, D.; Richardson, G.; Haslehurst, A.; Smith, D.; Saunders, C.; Aglietti, G.; Blows, R.; Shore, J.; Hampson, K.; Booth, M. A novel deployable telescope to facilitate a low-cost <1 m GSD video rapid-revisit small satellite constellation. In Proceedings of the International Conference on Space Optics, Chania, Greece, 9–12 October 2018; Volume 11180, p. 1118009. [Google Scholar] [CrossRef] [Green Version]
- Ehlers, M. Multisensor image fusion techniques in remote sensing. ISPRS J. Photogramm. Remote Sens. 1991, 46, 19–30. [Google Scholar] [CrossRef] [Green Version]
- Kramer, H.J.; Cracknell, A.P. An overview of small satellites in remote sensing. Int. J. Remote Sens. 2008, 29, 4285–4337. [Google Scholar] [CrossRef]
- Botelho A. S., R.C.; Xavier, A.L., Jr. A Unified Satellite Taxonomy Proposal Based on Mass and Size. Adv. Aerospace Sci. Technol. 2019, 4, 57–73. [Google Scholar] [CrossRef] [Green Version]
- Helvajian, H.; Janson, S. Small Satellites: Past, Present, and Future; The Aerospace Press: Washington, DC, USA, 2009. [Google Scholar] [CrossRef] [Green Version]
- Madry, S.; Pelton, J.N. Historical Perspectives on the Evolution of Small Satellites. In Handbook of Small Satellites; Pelton, J.N., Madry, S., Eds.; Springer: Cham, Switzerland, 2020. [Google Scholar] [CrossRef]
- Millan, R.M.; von Steiger, R.; Sergey Bartalev, M.A.; Borgeaud, M.; Campagnola, S.; Castillo-Rogez, J.C.; Fléron, R.; Gass, V.; Gregorio, A.; Klumpar, D.M.; et al. Small satellites for space science: A COSPAR scientific roadmap. Adv. Space Res. 2019, 64, 1466–1517. [Google Scholar] [CrossRef]
- Xue, Y.; Li, Y.; Guang, J.; Zhang, X.; Guo, J. Small satellite remote sensing and applications—History, current and future. Int. J. Remote Sens. 2008, 29, 4339–4372. [Google Scholar] [CrossRef]
- Baker, K.; Jansson, D. A Brief History of AMSAT. Available online: https://www.amsat.org/amsat-history/ (accessed on 22 October 2021).
- Bonometti, R.J.; Nicastri, E.D. The Role of Small Satellites in Our National Defence. In Proceedings of the Small Satellites Conference, “Market Drivers” Session, 1, 3rd Annual AIAA/USU Conference on Small Satellite, Logan, UT, USA, 26–28 September 1989; Available online: https://digitalcommons.usu.edu/cgi/viewcontent.cgi?article=2557&context=smallsat (accessed on 22 October 2021).
- Keravala, J.; Lappas, V. Launching Small Spacecraft—The Surrey Space Centre Experience. In The Space Transportation Market: Evolution or Revolution? Rycroft, M., Ed.; Space Studies, 5; Springer: Dordrecht, The Netherlands, 2000. [Google Scholar] [CrossRef]
- Choi, S.-D.; Kim, B.J.; Kim, E.E. An Introduction to the Kitsat program and the Activities at the Satrec in Korea. COSPAR Coll. 1999, 10, 9–16. [Google Scholar] [CrossRef]
- Sun, W.; Sweeting, M.N.; Hodgart, M.S. Low earth orbit satellite communications experiments using the digital signal processing payload on the PoSAT-1 microsatellite. Int. J. Satell. Commun. 1995, 13, 485–502. [Google Scholar] [CrossRef]
- Sweeting, M.N. Space at Surrey: Micro-mini-satellites for affordable access to space. Air Space Eur. 2000, 2, 38–52. [Google Scholar] [CrossRef]
- da Silva Curiel, A.; Cawthorne, A.; Sweeting, M. Progress In Small Satellite Technology For Earth Observation Missions. In Small Satellites for Earth Observation, Selected Proceedings of the 5th International Symposium of the International Academy of Astronautics, Berlin, Germany, 4–8 April 2005; Röser, H.-P., Sandau, R., Valenzuela, A., Eds.; Walter de Gruyter: Berlin, Germany, 2005; pp. 50–63. [Google Scholar] [CrossRef]
- Underwood, C.I.; Valenzuela, A.; Schoenherr, M.; Arancibia, M.; Fouquet, M. Initial in-orbit results from a low-cost atmospheric ozone monitor operating on board the FASat-Bravo microsatellite. Phil. Trans. R. Soc. A 2003, 361, 71–76. [Google Scholar] [CrossRef]
- da Silva Curiel, A.; Boland, L.; Cooksley, J.; Bekhti, M.; Stephens, P.; Sun, W.; Sweeting, M.N. First results from the disaster monitoring constellation (DMC). Acta Astronaut. 2005, 56, 261–271. [Google Scholar] [CrossRef]
- Stoll, E. The RapidEye constellation and its data products. In Proceedings of the 2012 IEEE Aerospace Conference, Big Sky, MT, USA, 3–10 March 2012; pp. 1–9. [Google Scholar]
- Bhushan, S.; Shean, D.; Alexandrov, O.; Henderson, S. Automated digital elevation model (DEM) generation from very-high-resolution Planet SkySat triplet stereo and video imagery. ISPRS J. Photogramm. Remote Sens. 2021, 173, 151–165. [Google Scholar] [CrossRef]
- eoPortal Directory of Space Missions. Available online: https://directory.eoportal.org/web/eoportal/satellite-missions (accessed on 22 October 2021).
- Deepak, R.A.; Twiggs, R.J. Thinking Out of the Box: Space Science Beyond the CubSat. J. Small Satell. 2012, 1, 3–7. [Google Scholar]
- Heidt, H.; Puig-Suari, J.; Moore, A.; Nakasuka, S.; Twiggs, R. CubeSat: A New Generation of Picosatellite for Education and Industry Low-Cost Space Experiment. In Proceedings of the 14th Annual AIAA/USU Conference on Small Satellite, Logan, UT, USA, 21–24 August 2000; p. 32. [Google Scholar]
- Straub, J.; Korvald, C.; Nervold, A.; Mohammad, A.; Root, N.; Long, N.; Torgerson, D. OpenOrbiter: A Low-Cost, Educational Prototype CubeSat Mission Architecture. Machines 2013, 1, 1–32. [Google Scholar] [CrossRef] [Green Version]
- Swarwout, M.; Kitts, C.; Twiggs, R.; Kenny, T.; Smith, B.R.; Lu, R.; Stattenfield, K.; Pranajaya, F. Mission results for Sapphire, a student-built satellite. Acta Astronaut. 2008, 62, 521–538. [Google Scholar] [CrossRef]
- Puig-Suari, J.; Turner, C.; Ahlgren, W. Development of the standard CubeSat deployer and a CubeSat class PicoSatellite. In Proceedings of the 2001 IEEE Aerospace Conference, Big Sky, MT, USA, 10–17 March 2001; Volume 1, pp. 1/347–1/353. [Google Scholar] [CrossRef] [Green Version]
- Puig-Suari, J.; Levegue, K.; Coelho, R.; Williams, S. Enabling Flexible Secondary Launches with the CubeSat Standar. In Proceedings of the 23rd Annual AIAA/USU Conference on Small Satellite, Logan, UT, USA, 10–13 August 2009; p. 61. [Google Scholar]
- Aragon, B.; Ziliani, M.G.H.; Houborg, R.; Franz, T.E.; McCabe, M.F. CubeSats deliver new insights into agricultural water use at daily and 3 m resolutions. Sci. Rep. 2021, 11, 12131. [Google Scholar] [CrossRef]
- Stephens, G.; Freeman, A.; Richard, E.; Pilewskie, P.; Larkin, P.; Chew, C.; Tanelli, S.; Brown, S.; Posselt, D.; Peral, E. The Emerging Technological Revolution in Earth Observations. Bull. Am. Meteorol. Soc. 2020, 101, E274–E285. [Google Scholar] [CrossRef]
- Selva, D.; Krejci, D. A Survey and Assessment of the Capabilities of Cubesats for Earth Observation. Acta Astronaut. 2012, 74, 50–68. [Google Scholar] [CrossRef]
- Toorian, A.; Diazm, K.; Lee, S. The CubeSat Approach to Space Access. In Proceedings of the 2008 IEEE Aerospace Conference, Big Sky, MT, USA, 1–8 March 2008; pp. 1–14. [Google Scholar] [CrossRef]
- Wilkinson, K. From the Perspective of the Pioneers: The Small Sat Revolution. In Proceedings of the 20th Annual AIAA/USU Conference on Small Satellite, Logan, UT, USA, 14–17 August 2006; Volume 4. [Google Scholar]
- Ferrari, F.; Franzese, V.; Pugliatti, M.; Giordano, C.; Topputo, F. Preliminary mission profile of HERA’s Milani CubeSat. Adv. Space Res. 2021, 67, 2010–2029. [Google Scholar] [CrossRef]
- eoPortal Directory of Earth Observations. Available online: https://earth.esa.int/web/eoportal/home (accessed on 22 October 2021).
- Paek, S.W.; Balasubramanian, S.; Kim, S.; de Weck, O. Small-Satellite Synthetic Aperture Radar for Continuous Global Biospheric Monitoring: A Review. Remote Sens. 2020, 12, 2546. [Google Scholar] [CrossRef]
- Capella Space. SAR Imagery Products Guide. 2020. 19p. Available online: https://vekom.com/wp-content/uploads/2020/12/Capella_Space_SAR_Imagery_Products_Guide.pdf (accessed on 22 October 2021).
- Planet Labs.Planet Labs Specifications: Spacecraft Operations & Ground Systems. 2015. Available online: http://content.satimagingcorp.com.s3.amazonaws.com/media/pdf/Dove-PDF-Download (accessed on 22 October 2021).
- Ignatenko, V.; Laurila, P.; Radius, A.; Lamentowski, L.; Antropov, O.; Muff, D. ICEYE Microsatellite SAR Constellation Status Update: Evaluation of First Commercial Imaging Modes. In Proceedings of the IEEE International Geoscience and Remote Sensing Symposium, Waikoloa, HI, USA, 26 September–2 October 2020; pp. 3581–3584. [Google Scholar] [CrossRef]
- NASA. Ocean Surface Topography Mission/Jason 2 Launc, Press Kit. 2008. Available online: https://sealevel.jpl.nasa.gov/missions/ostm-jason-2/launch/ (accessed on 22 October 2021).
- NASA; JPL; CNES; NOAA; EUMETSAT. JASON-3 Products Handbook, 2020; #SALP-MU-M-OP-16118-CN, Rev. 2.6. Available online: https://www.eumetsat.int/media/47149 (accessed on 22 October 2021).
- Soldi, G.; Gaglione, D.; Forti, N.; Di Simone, A.; Daffinà, F.C.; Bottini, G.; Quattrociocchi, D.; Millefiori, L.M.; Braca, P.; Carniel, S.; et al. Space-Based Global Maritime Surveillance. Part I: Satellite Technologies. IEEE Aerosp. Electron. Syst. Magaz. 2021, 36, 8–28. [Google Scholar] [CrossRef]
- Bastien-Thiry, C.; Bach, M.; Lifermann, A. PARASOL a Microsatellite in the A-Train for Earth Atmospheric Observations. In Proceedings of the 5th IAA Symposium on Small Satellites for Earth Observation, Paris, France, 4–8 April 2005. [Google Scholar]
- Peral, E.; Tanelli, S.; Statham, S.; Joshi, S.; Imken, T.; Price, D.; Sauder, J.; Chahat, N.; Williams, A. RainCube: The first ever radar measurements from a CubeSat in space. J. Appl. Remote Sens. 2019, 13, 032504. [Google Scholar] [CrossRef]
- RapidEye Website. Available online: https://earth.esa.int/eogateway/news/rapideye-constellation-retirement?te×t=rapideye (accessed on 22 October 2021).
- TEMPEST-D Website. Available online: https://esto.nasa.gov/wp-content/uploads/2020/07/Reising-TEMPEST-D.pdf (accessed on 22 October 2021).
- Champagne, J.A.; Hansen, S.M.; Newswander, T.T. CubeSat Image Resolution Capabilities with Deployable Optics and Current Imaging Technology. In Proceedings of the 28th Annual AIAA/USU Conference on Small Satellite, Logan, UT, USA, 4–7 August 2014; p. 10. [Google Scholar]
- Kurihara, J.; Takahashi, Y.; Sakamoto, Y.; Kuwahara, T.; Yoshida, K. HPT: A High Spatial Resolution Multispectral Sensor for Microsatellite Remote Sensing. Sensors 2018, 18, 619. [Google Scholar] [CrossRef] [PubMed] [Green Version]
- Franceschetti, G.; Lanari, R. Synthetic Aperture Radar Processing; CRC Press: Boca Raton, FL, USA, 1999. [Google Scholar]
- Roth, A.; Marschalk, U.; Winkler, K.; Schättler, B.; Huber, M.; Georg, I.; Künzer, C.; Dech, S. Years of Experience with Scientific TerraSAR-X Data Utilization. Remote Sens. 2018, 10, 1170. [Google Scholar] [CrossRef] [Green Version]
- Young, N. Applications of Interferometric Synthetic Aperture Radar (InSAR): A Small Research Investigation. 2018. Available online: https://www.researchgate.net/publication/328773243_Applications_of_Interferometric_Synthetic_Aperture_Radar_InSAR_a_small_research_investigation (accessed on 11 October 2021).
- Zalite, K.; Antropov, O.; Praks, J.; Voormansik, K.; Noorma, M. Monitoring of Agricultural Grasslands With Time Series of X-Band Repeat-Pass Interferometric SAR. IEEE J. Sel. Top. Appl. Earth Obs. Remote Sens. 2016, 9, 3687–3697. [Google Scholar] [CrossRef]
- Paloscia, S.; Macelloni, G.; Santi, E.; Koike, T. A multifrequency algorithm for the retrieval of soil moisture on a large scale using microwave data from SMMR and SSM/I satellites. IEEE Trans. Geosci. Remote Sens. 2001, 39, 1655–1661. [Google Scholar] [CrossRef]
- Chang, A.T.; Kelly, R.E.; Foster, J.L.; Hall, D.K. Global SWE monitoring using AMSR-E data. In Proceedings of the International Geoscience and Remote Sensing Symposium (IGARSS), Toulouse, France, 21–25 July 2003. [Google Scholar]
- Le Vine, D.M.; Kao, M.; Tanner, A.B.; Swift, C.T.; Griffis, A. Initial results in the development of a synthetic aperture microwave radiometer. IEEE Trans. Geosci. Remote Sens. 1990, 28, 614–619. [Google Scholar] [CrossRef]
- Le Vine, D.M. Synthetic Aperture Radiometer Systems. IEEE Trans. Microw. Theory Tech. 1999, 47, 2228–2236. [Google Scholar] [CrossRef]
- Yang, X.; Yang, Z.; Yan, J.; Wu, L.; Jiang, M. Multi-Parameter Regularization Method for Synthetic Aperture Imaging Radiometers. Remote Sens. 2021, 13, 382. [Google Scholar] [CrossRef]
- Alparone, M.; Nunziata, F.; Estatico, C.; Migliaccio, M. A multi-channel data fusion method to enhance the spatial resolution of microwave radiometer measurements. IEEE Trans. Geosci. Remote Sens. 2021, 59, 2213–2221. [Google Scholar] [CrossRef]
- Lenti, F.; Nunziata, F.; Estatico, C.; Migliaccio, M. Spatial Resolution Enhancement of Earth Observation Products Using an Acceleration Technique for Iterative Methods. IEEE Geosci. Remote Sens. Lett. 2015, 12, 269–273. [Google Scholar] [CrossRef]
- Long, D.G.; Brodzik, M.J.; Hardman, M.A. Enhanced-Resolution SMAP Brightness Temperature Image Products. IEEE Trans. Geosci. Remote Sens. 2019, 57, 4151–4163. [Google Scholar] [CrossRef]
- CubeSat Design Specification (1U–12U), Rev. 14, CP–CDS–R14. The CubeSat Program, California State Polytechnic University; Retrieved January 18, 2022. p. 34. Available online: https://www.cubesat.org/ (accessed on 5 October 2021).
- Hevner, R.; Holemans, W.; Puig-Suari, J.; Twiggs, R. An Advanced Standard for CubeSats. In Proceedings of the 25th Annual AIAA/USU Conference on Small Satellite, Logan, UT, USA, 8–11 August 2011; p. 15. [Google Scholar]
- Peral, E.; Im, E.; Wye, L.; Lee, S.; Tanelli, S.; Rahmat-Samii, Y.; Horst, S.; Hoffman, J.; Yun, S.-H.; Imken, T.; et al. Radar Technologies for Earth Remote Sensing From CubseSat Platforms. Proc. IEEE 2018, 106, 404–418. [Google Scholar] [CrossRef]
- Davoli, F.; Kourogiorgas, C.; Marchese, M.; Panagopoulos, A.; Patrone, F. Small satellites and CubeSats: Survey of structures, architectures, and protocols. Int. J. Satell. Commun. Netw. 2019, 37, 343–359. [Google Scholar] [CrossRef]
- Nagel, G.W.; de Moraes Novo, E.M.L.; Kampel, M. Nanosatellites applied to optical Earth Observation: A review. Rev. Ambient. Água 2020, 15, e2513. [Google Scholar] [CrossRef]
- Capaccioni, F.; Bellucci, G.; Rinaldi, G.; Saggin, B.; Valnegri, P.; Filacchione, G.; Della Corte, V.; Magrin, D.; Angarano, M.; Filippetto, D.; et al. DORA: Deployable Optics for Remote sensing Applications. Eur. Sci. Congr. 2020, 14, EPSC2020-1003. [Google Scholar]
- Fernandez, L.; Sobrino, M.; Milian, O.; Aguilella, A.; Solanellas, A.; Badia, M.; Munoz-Martin, J.F.; Ruiz-de-Azua, J.A.; Sureda, M.; Camps, A. Deployment mechanism for a L-band helix antenna in 1-Unit Cubesat. Acta Astronaut. 2020; in press. [Google Scholar] [CrossRef]
- Schlager, H.; Grewe, V.; Roiger, A. Chemical Composition of the Atmosphere. In Atmospheric Physics, Research Topics in Aerospace; Schumann, U., Ed.; Springer: Berlin/Heidelberg, Germany, 2012; p. 17. [Google Scholar] [CrossRef]
- Isaksen, I.S.A.; Granier, C.; Myhre, G.; Berntsen, T.K.; Dalsøren, S.B.; Gauss, M.; Klimont, Z.; Benestad, R.; Bousquet, P.; Collins, W.; et al. Atmospheric composition change: Climate–Chemistry interactions. Atmos. Environ. 2009, 43, 5138–5192. [Google Scholar] [CrossRef]
- LeGrande, A.; Tsigaridis, K.; Bauer, S.E. Role of atmospheric chemistry in the climate impacts of stratospheric volcanic injections. Nat. Geosci. 2016, 9, 652–655. [Google Scholar] [CrossRef]
- Mylona, S. Sulphur dioxide emissions in Europe 1880–1991 and their effect on sulphur concentrations and depositions. Tellus B 1996, 48, 662–689. [Google Scholar] [CrossRef]
- Liu, F.; Choi, S.; Li, C.; Fioletov, V.E.; McLinden, C.A.; Joiner, J.; Krotkov, N.A.; Bian, H.; Janssens-Maenhout, G.; Darmenov, A.-S.; et al. A new global anthropogenic SO2 emission inventory for the last decade: A mosaic of satellite-derived and bottom-up emissions. Atmos. Chem. Phys. 2018, 18, 16571–16586. [Google Scholar] [CrossRef] [Green Version]
- Clerbaux, C.; Hadji-Lazaro, J.; Turquety, S.; Mégie, G.; Coheur, P.F. Trace gas measurements from infrared satellite for chemistry and climate applications. Atmos. Chem. Phys. 2003, 3, 1495–1508. [Google Scholar] [CrossRef] [Green Version]
- Clerbaux, C.; Boynard, A.; Clarisse, L.; George, M.; Hadji-Lazaro, J.; Herbin, H.; Hurtmans, J.; Pommier, M.; Razavi, A.; Turquety, S.; et al. Monitoring of atmospheric composition using the thermal infrared IASI/MetOp Sounder. Atmos. Chem. Phys. 2009, 9, 1495–1508. [Google Scholar] [CrossRef] [Green Version]
- Riccio, A.; Giunta, G.; Landi, T.C.; Migliaccio, M. Remote optical observation of biomass burning: A feasibility and experimental case study with the SIM. GA hyperspectral system. Int. J. Remote Sens. 2011, 32, 6241–6259. [Google Scholar] [CrossRef]
- Kuhn, J.; Bobrowski, N.; Lübcke, P.; Vogel, L.; Platt, U. A Fabry–Perot interferometer-based camera for two-dimensional mapping of SO2 distributions. Atmos. Meas. Tech. 2014, 7, 3705–3715. [Google Scholar] [CrossRef] [Green Version]
- Kuhn, J.; Platt, U.; Bobrowski, N.; Wagner, T. Towards imaging of atmospheric trace gases using Fabry–Pérot interferometer correlation spectroscopy in the UV and visible spectral range. Atmos. Meas. Tech. 2019, 12, 735–747. [Google Scholar] [CrossRef] [Green Version]
- Fougnie, B.; Chimot, J.; Vàzquez-Navarro, M.; Marbach, T.; Bojkov, B. Aerosol retrieval from space—How does geometry of acquisition impact our ability to characterize aerosol properties. J. Quant. Spectrosc. Radiat. Transf. 2020, 256, 107304. [Google Scholar] [CrossRef]
- Chiapello, I.; Formenti, P.; Mbemba Kabuiku, L.; Ducos, F.; Tanré, D.; Dublac, F. Aerosol optical properties derived from POLDER–3/PARASOL (2005–2013) over the Western Mediterranean Sea—Part 2: Spatial distribution and temporal variability. Atmos. Chem. Phys. 2021, 21, 12715–12737. [Google Scholar] [CrossRef]
- Saari, H.; Näsilä, A.; Holmlund, C.; Mannila, R.; Näkki, I.; Ojanen, H.J.; Fussen, D.; Pieroux, D.; Demoulin, P.; Dekemper, E.; et al. Visible spectral imager for occultation and nightglow (VISION) for the PICASSO Mission. In Proceedings of the Sensors, Systems, and Next-Generation Satellites XIX, Toulouse, France, 21–24 September 2015; Volume 9639, p. 96391M. [Google Scholar] [CrossRef]
- Barré, J.; Petetin, H.; Colette, A.; Guevara, M.; Peuch, V.-H.; Rouil, L.; Engelen, R.; Inness, A.; Flemming, J.; Pérez García-Pando, C.; et al. Estimating lockdown/induced European NO2 changes using satellite and surface observations and air quality models. Atmos. Chem. Phys. 2021, 21, 7373–7394. [Google Scholar] [CrossRef]
- Vîrghileanu, M.; Săvulescu, I.; Mihai, B.-A.; Nistor, C.; Dobre, R. Nitrogen Dioxide (NO2) Pollution Monitoring with Sentinel-5P Satellite Imagery over Europe during the Coronavirus Pandemic Outbreak. Remote Sens. 2020, 12, 3575. [Google Scholar] [CrossRef]
- Gupta, P.; Joiner, J.; Vasilkov, A.; Bhartia, P.K. Top-of-the-atmosphere shortwave flux estimation from satellite observations: An empirical neural network approach applied with data from the A–train constellation. Atmos. Meas. Tech. 2016, 9, 2813–2826. [Google Scholar] [CrossRef] [Green Version]
- Munro, R.; Lang, R.; Klaes, D.; Poli, G.; Retscher, C.; Lindstrot, R.; Huckle, R.; Lacan, A.; Grzegorski, M.; Holdak, A.; et al. The GOME–2 instrument on the MetOp series of satellites: Instrument design, calibration, and level 1 data processing—An overview. Atmos. Meas. Tech. 2016, 9, 1279–1301. [Google Scholar] [CrossRef] [Green Version]
- García, O.E.; Sepúlveda, E.; Schneider, M.; Hase, F.; August, T.; Blumenstock, T.; Kühl, S.; Munro, R.; Gómez-Peláez, Á.J.; Hultberg, T.; et al. Consistency and quality assessment of the MetOp–A/IASI and MetOp–B/IASI operational trace gas products (O3, CO, N2O, CH4, and CO2) in the subtropical North Atlantic. Atmos. Meas. Tech. 2016, 9, 2315–2333. [Google Scholar] [CrossRef] [Green Version]
- Goldberg, M.D.; Kilcoyne, H.; Cikanek, H.; Mehta, A. Joint Polar Satellite System: The United States next generation civilian polar-orbiting environmental satellite system. J. Geophys. Res. Atmos. 2013, 118, 13463–13475. [Google Scholar] [CrossRef]
- Pan, C.; Yan, B.; Flynn, L.; Beck, T.; Chen, J.; Huang, J. Recent Improvements to NOAA-20 Ozone Mapper Profiler Suite Nadir Profiler Sensor Data Records. In Proceedings of the 2021 IEEE International Geoscience and Remote Sensing Symposium IGARSS, Brussels, Belgium, 11–16 July 2021; pp. 7924–7926. [Google Scholar] [CrossRef]
- Mannila, R.; Holmlund, C.; Ojanen, H.J.; Näsilä, A.; Saari, H. Short-wave infrared (SWIR) spectral imager based on Fabry-Perot interferometer for remote sensing. In Proceedings of the Sensors, Systems, and Next-Generation Satellites XVIII, Amsterdam, The Netherlands, 22–25 September 2014; Volume 9241, p. 92411M. [Google Scholar]
- Rissanen, A.; Guo, B.; Saari, H.; Näsilä, A.; Mannila, R.; Akujärvi, A.; Ojanen, H. VTT’s Fabry-Perot interferometer technologies for hyperspectral imaging and mobile sensing applications. In Proceedings of the MOEMS and Miniaturized Systems XVI, San Francisco, CA, USA, 28 January–2 February 2017; Volume 10116, p. 101160I. [Google Scholar] [CrossRef]
- Erfan, M.; Sabry, Y.M.; Sakr, M.; Mortada, B.; Medhat, M.; Khalil, D. On-chip micro–electro–mechanical system Fourier transform infrared (MEMS FT-IR) spectrometer-based gas sensing. Appl. Spectrosc. 2016, 70, 897–904. [Google Scholar] [CrossRef] [PubMed]
- Kita, D.M.; Miranda, B.; Favela, D.; Bono, D.; Michon, J.; Lin, H.; Gu, T.; Hu, J. High-performance and scalable on-chip digital Fourier transform spectroscopy. Nat. Commun. 2018, 9, 4405. [Google Scholar] [CrossRef]
- Manzardo, O.; Herzig, H.P.; Marxer, C.R.; de Rooij, N.F. Miniaturized time-scanning Fourier transform spectrometer based on silicon technology. Opt. Lett. 1999, 24, 1705–1707. [Google Scholar] [CrossRef]
- Nedeljkovic, M.; Velasco, A.V.; Khokhar, A.Z.; Delâge, A.; Cheben, P.; Mashanovich, G.Z. Mid-infrared silicon-on-insulator Fourier-transform spectrometer chip. IEEE Photonics Technol. Lett. 2016, 28, 528–531. [Google Scholar] [CrossRef] [Green Version]
- Podmore, H.; Scott, A.; Cheben, P.; Velasco, A.V.; Schmid, J.H.; Vachon, M.; Lee, R. Demonstration of a compressive-sensing Fourier-transform on-chip spectrometer. Opt. Lett. 2017, 42, 1440–1443. [Google Scholar] [CrossRef] [PubMed]
- Kern, S.; Spreen, G.; Kaleschke, L.; De La Rosa, S.; Heygster, G. Polynya signature simulation method polynya area in comparison to AMSR-E 89 GHz sea–ice concentrations in the Ross Sea and off the Adélie Coast, Antarctica, for 2002–05: First results. Ann. Glaciol. 2007, 46, 409–418. [Google Scholar] [CrossRef] [Green Version]
- Parmiggiani, F. Fluctuations of Terra Nova Bay polynya as observed by active (ASAR) and passive (AMSR-E) microwave radiometers. Int. J. Remote Sens. 2006, 27, 2459–2467. [Google Scholar] [CrossRef]
- Morales Maqueda, M.Á.; Willmott, A.J.; Biggs, N.R.T. Polynya dynamics: A review of observations and modeling. Rev. Geophys. 2004, 42, RG1004. [Google Scholar] [CrossRef] [Green Version]
- Martin, S. Polynyas. In Encyclopedia of Ocean Sciences, 3rd ed.; Collection: Earth Systems and Environmental Sciences; Academic Press: Cambridge, MA, USA, 2019; Volume 6, pp. 175–180. [Google Scholar] [CrossRef]
- Sansiviero, M.; Morales Maqueda, M.Á.; Fusco, G.; Aulicino, G.; Flocco, D.; Budillon, G. Modelling sea ice formation in the Terra Nova Bay polynya. J. Mar. Syst. 2017, 166, 4–25. [Google Scholar] [CrossRef]
- Vincent, R.F. A Study of the North Water Polynya Ice Arch using Four Decades of Satellite Data. Sci. Rep. 2019, 9, 20278. [Google Scholar] [CrossRef] [PubMed] [Green Version]
- Jena, B.; Ravichandran, M.; Turner, J. Recent reoccurrence of large open-ocean polynya on the Maud Rise seamount. Geophys. Res. Lett. 2019, 46, 4320–4329. [Google Scholar] [CrossRef]
- Stewart, C.L.; Christoffersen, P.; Nicholls, K.W.; Williams, M.J.M.; Dowdeswell, J.A. Basal melting of Ross Ice Shelf from solar heat absorption in an ice-front polynya. Nat. Geosci. 2019, 12, 435–440. [Google Scholar] [CrossRef]
- Hollands, T.; Dierking, W. Dynamics of the Terra Nova Bay Polynya: The potential of multi-sensor satellite observations. Remot. Sens. Environ. 2016, 187, 30–48. [Google Scholar] [CrossRef] [Green Version]
- Paul, S.; Willmes, S.; Heinemann, G. Long-term coastal-polynya dynamics in the southern Weddell Sea from MODIS thermal-infrared imagery. Cryosphere 2015, 9, 2027–2041. [Google Scholar] [CrossRef] [Green Version]
- Naftaly, U.; Levy-Nathansohn, R. Overview of the TECSAR Satellite Hardware and Mosaic Mode. IEEE Geosci. Remote Sens. Lett. 2008, 5, 423–426. [Google Scholar] [CrossRef]
- Suwaidi, A.A. DubaiSat–2 mission overview. In Proceedings of the Sensors, Systems, and Next-Generation Satellites XVI, Edinburgh, UK, 24–27 September 2012; Volume 8533, p. 85330W. [Google Scholar] [CrossRef]
- Cheng, Z.; Pang, X.; Zhao, X.; Tan, C. Spatio-temporal variability and model parameter sensitivity analysis of ice production in Ross Ice Shelf Polynya from 2003 to 2015. Remote Sens. 2017, 9, 934. [Google Scholar] [CrossRef] [Green Version]
- Safyan, M. Planet’s Dove Satellite Constellation. In Handbook of Small Satellites; Pelton, J., Ed.; Springer: Cham, Switzerland, 2020. [Google Scholar] [CrossRef]
- Tyc, G.; Tulip, J.; Schulten, D.; Krischke, M.; Oxfort, M. The RapidEye mission design. Acta Astron. 2005, 56, 213–219. [Google Scholar] [CrossRef]
- Aulicino, G.; Sansiviero, M.; Paul, S.; Cesarano, C.; Fusco, G.; Wadhams, P.; Budillon, G. A New Approach for Monitoring the Terra Nova Bay Polynya through MODIS Ice Surface Temperature Imagery and Its Validation during 2010 and 2011 Winter Seasons. Remote Sens. 2018, 10, 366. [Google Scholar] [CrossRef] [Green Version]
- Willmes, S.; Krumpen, T.; Adams, S.; Rabenstein, L.; Haas, C.; Hoelemann, J.; Hendricks, S.; Heinemann, G. Cross-validation of polynya monitoring methods from multisensor satellite and airborne data: A cases study for the Laptev Sea. Can. J. Remote Sens. 2010, 36, S196–S210. [Google Scholar] [CrossRef]
- Ciappa, A.; Budillon, G. The Terra Nova Bay (Antarctica) polynya observed by MODIS ice surface temperature imagery from May to June 2009. Int. J. Remote Sens. 2012, 33, 4567–4582. [Google Scholar] [CrossRef]
- Key, J.R.; Collins, J.B.; Fowler, C.; Stone, R.S. High-latitude surface temperature estimates from thermal satellite data. Remote Sens. Environ. 1997, 61, 302–309. [Google Scholar] [CrossRef]
- Fortescue, P.; Stark, J.; Swinerd, G. Spacecraft Systems Engineering, 4th ed.; Wiley: Hoboken, NJ, USA, 2011. [Google Scholar]
- Artigas, M.L.; Llebot, C.; Ross, O.N.; Neszi, N.Z.; Rodellas, V.; Garcia-Orellana, J.; Masqué, P.; Piera, J.; Estrada, M.; Berdalet, E. Understanding the spatio-temporal variability of phytoplankton biomass distribution in a microtidal Mediterranean estuary. Deep. Sea Res. Part II Top. Stud. Oceanogr. 2014, 101, 180–192. [Google Scholar] [CrossRef]
- Madricardo, F.; Foglini, F.; Campiani, E.; Grande, V.; Catenacci, E.; Petrizzo, A.; Kruss, A.; Toso, C.; Trincardi, F. Assessing the human footprint on the sea-floor of coastal systems: The case of the Venice Lagoon, Italy. Sci. Rep. 2019, 9, 6615. [Google Scholar] [CrossRef]
- Melet, A.; Teatini, P.; Le Cozannet, G.; Jamet, C.; Conversi, A.; Benveniste, J.; Almar, R. Earth Observations for Monitoring Marine Coastal Hazards and Their Drivers. Surv. Geophys. 2020, 41, 1489–1534. [Google Scholar] [CrossRef]
- Robinson, S. Measuring the Oceans from Space: The Principles and Methods of Satellite Oceanography, 1st ed.; Springer: Berlin/Heidelberg, Germany; New York, NY, USA, 2004. [Google Scholar]
- Ardhuin, F.; Stopa, J.E.; Chapron, B.; Collard, F.; Husson, R.; Jensen, R.E.; Johannessen, J.; Mouche, A.; Passaro, M.; Quartly, G.D.; et al. Observing Sea States. Front. Mar. Sci. 2019, 6, 124. [Google Scholar] [CrossRef] [Green Version]
- Cipollini, P.; Benveniste, J.; Birol, F.; Fernandes, M.; Obligis, E.; Passaro, M.; Strub, P.T.; Valladeau, G.; Vignudelli, S.; Wilkin, J. Satellite altimetry in coastal regions. In Satellite Altimetry over Oceans and Land Surfaces Earth Observation of Global Changes Book Series; Stammer, D., Cazenave, A., Eds.; CRC Press: New York, NY, USA, 2017; pp. 343–380. [Google Scholar]
- Collard, F.; Ardhuin, F.; Chapron, B. Extraction of coastal ocean wave fields from SAR images. IEEE J. Ocean. Eng. 2005, 30, 526–533. [Google Scholar] [CrossRef]
- Passaro, M.; Fenoglio-Marc, L.; Cipollini, P. Validation of significant wave height from improved satellite altimetry in the German Bight. IEEE Trans. Geosci. Remote Sens. 2015, 53, 2146–2156. [Google Scholar] [CrossRef]
- Behrenfeld, M.J.; O’Malley, R.T.; Siegel, D.A.; McClain, C.R.; Sarmiento, J.L.; Feldman, G.C.; Milligan, A.J.; Falkowski, P.G.; Letelier, R.M.; Boss, E.S. Climate-driven trends in contemporary ocean productivity. Nature 2006, 444, 752–755. [Google Scholar] [CrossRef] [PubMed]
- Groom, S.; Sathyendranath, S.; Ban, Y.; Bernard, S.; Brewin, R.; Brotas, V.; Brockmann, C.; Chauhan, P.; Choi, J.-K.; Chuprin, A.; et al. Satellite Ocean Colour: Current Status and Future Perspective. Front. Mar. Sci. 2019, 6, 485. [Google Scholar] [CrossRef] [Green Version]
- Wernand, M.R.; van der Woerd, H.J.; Gieskes, W.W.C. Trends in Ocean Colour and Chlorophyll Concentration from 1889 to 2000, Worldwide. PLoS ONE 2010, 8, e63766. [Google Scholar] [CrossRef] [PubMed]
- Zielinski, O.; Busch, J.A.; Cembella, A.D.; Daly, K.L.; Engelbrektsson, J.; Hannides, A.K.; Schmidt, H. Detecting marine hazardous substances and organisms: Sensors for pollutants, toxins, and pathogens. Ocean Sci. 2009, 5, 329–349. [Google Scholar] [CrossRef] [Green Version]
- Bunt, J.S. Primary Productivity of Marine Ecosystems. In Primary Productivity of the Biosphere. Ecological Studies (Analysis and Synthesis); Lieth, H., Whittaker, R.H., Eds.; Springer: Berlin/Heidelberg, Germany, 1975; Volume 14. [Google Scholar] [CrossRef]
- Lévy, M.; Franks, P.J.S.; Smith, K.S. The role of submesoscale currents in structuring marine ecosystems. Nat. Commum. 2018, 9, 4758. [Google Scholar] [CrossRef] [Green Version]
- Mahadevan, A. The Impact of Submesoscale Physics on Primary Productivity of Plankton. Annu. Rev. Mar. Sci. 2016, 8, 161–184. [Google Scholar] [CrossRef] [Green Version]
- Molinero, J.C.; Ibanez, F.; Souissi, S.; Bosc, E.; Nival, P. Surface patterns of zooplankton spatial variability detected by high frequency sampling in the NW Mediterranean. Role of density fronts. J. Mar. Syst. 2008, 69, 271–282. [Google Scholar] [CrossRef]
- Ramírez, T.; Muñoz, M.; Reul, A.; García-Martínez, M.C.; Moya, F.; Vargas-Yáñez, M.; Bautista, B. The Biogeochemical Context of Marine Planktonic Ecosystems. In Alboran Sea—Ecosystems and Marine Resources; Báez, J.C., Vázquez, J.T., Camiñas, J.A., Malouli Idrissi, M., Eds.; Springer: Cham, Switzerland, 2021. [Google Scholar] [CrossRef]
- Bini, M.; Rossi, V. Climate Change and Anthropogenic Impact on Coastal Environments. Water 2021, 13, 1182. [Google Scholar] [CrossRef]
- De Maio, A.; Moretti, M.; Sansone, E.; Spezie, G.; Vultaggio, M. Outline of marine currents in the bay of Naples and some considerations on pollutant transport. Il Nuovo Cim. C 1985, 8, 955–969. [Google Scholar] [CrossRef]
- Schueler, C.; Holmes, A. SeaHawk CubeSat system engineering. In Proceedings of the Remote Sensing System Engineering VI, San Diego, CA, USA, 28 August–1 September 2016; Volume 9977, p. 99770A. [Google Scholar] [CrossRef]
- Mhangara, P. The Emerging Role of Cubesats for Earth Observation Applications in South Africa. Photogramm. Eng. Remote Sens. 2020, 86, 333–340. [Google Scholar] [CrossRef]
- Artale, V.; Iudicone, D.; Santoleri, R.; Rupolo, V.; Marullo, S.; D’Ortenzio, F. Role of surface fluxes in ocean general circulation models using satellite sea surface temperature: Validation of and sensitivity to the forcing frequency of the Mediterranean thermohaline circulation. J. Geophys. Res. 2002, 107, 3120. [Google Scholar] [CrossRef]
- O’Carroll, A.G.; Armstrong, E.M.; Beggs, H.M.; Bouali, M.; Casey, K.S.; Corlett, G.K.; Dash, P.; Donlon, C.J.; Gentemann, C.L.; Høyer, J.L.; et al. Observational Needs of Sea Surface Temperature. Front. Mar. Sci. 2019, 6, 420. [Google Scholar] [CrossRef]
- López García, M.J. SST Comparison of AVHRR and MODIS Time Series in the Western Mediterranean Sea. Remote Sens. 2020, 12, 2241. [Google Scholar] [CrossRef]
- Chelton, D.B.; Wentz, F.J. Global Microwave Satellite Observations of Sea Surface Temperature for Mumerical Weather Prediction and Climate Research. Am. Meteorol. Soc. 2005, 86, 1097–1116. [Google Scholar] [CrossRef] [Green Version]
- Wentz, F.J.; Gentemann, C.; Smith, D.; Chelton, D. Satellite measurements of sea surface temperature through clouds. Science 2000, 288, 847–850. [Google Scholar] [CrossRef] [PubMed] [Green Version]
- Boutin, J.; Reul, N.; Koehler, J.; Martin, A.; Catany, R.; Guimbard, S.; Rouffi, F.; Vergely, J.L.; Arias, M.; Chakroun, M.; et al. Satellite-based sea surface salinity designed for ocean and climate studies. J. Geophys. Res. Oceans 2021, 126, e2021JC017676. [Google Scholar] [CrossRef]
- Liu, C.; Liang, X.; Ponte, R.M.; Vinogradova, N.; Wang, O. Vertical redistribution of salt and layered changes in global ocean salinity. Nat. Commun. 2019, 10, 3445. [Google Scholar] [CrossRef] [Green Version]
- Bao, S.; Wang, H.; Zhang, R.; Yan, H.; Chen, J. Comparison of satellite-derived sea surface salinity products from SMOS, Aquarius, and SMAP. J. Geophys. Res. Oceans 2019, 124, 1932–1944. [Google Scholar] [CrossRef]
- Yu, L.; Josey, S.A.; Bingham, F.M.; Lee, T. Intensification of the global water cycle and evidence from ocean salinity: A synthesis review. Ann. N. Y. Acad. Sci. 2020, 1472, 76–94. [Google Scholar] [CrossRef]
- Reul, N.; Grodsky, S.A.; Arias, M.; Boutin, J.; Catany, R.; Chapron, B.; D’Amico, F.; Dinnat, E.; Donlon, C.; Fore, A.; et al. Sea surface salinity estimates from spaceborne L-band radiometers: An overview of the first decade of observation (2010–2019). Remote Sens. Environ. 2020, 242, 111769. [Google Scholar] [CrossRef]
- Font, J.; Camps, A.; Borges, A.; Martín-Neira, M.; Boutin, J.; Reul, N.; Kerr, Y.H.; Hahne, A.; Mecklenburg, S. SMOS: The Challenging Sea Surface Salinity Measurement from Space. Proc. IEEE 2010, 98, 649–665. [Google Scholar] [CrossRef] [Green Version]
- Chelton, D.B.; Schlax, M.G. The Accuracies of Smoothed Sea Surface Height Fields Constructed from Tandem Satellite Altimeter Datasets. J. Atmos. Oceanic. Tech. 2003, 20, 1276–1302. [Google Scholar] [CrossRef] [Green Version]
- Woodworth, P.L.; Melet, A.; Marcos, M.; Ray, R.D.; Wöppelmann, G.; Sasaki, Y.N.; Cirano, M.; Hibbert, A.; Huthance, J.M.; Monserrat, S.; et al. Forcing Factors Affecting Sea Level Changes at the Coast. Surv. Geophys. 2019, 40, 1351–1397. [Google Scholar] [CrossRef] [Green Version]
- Klemas, V.; Yan, X.-H. Subsurface and deeper ocean remote sensing from satellites: An overview and new results. Prog. Oceanogr. 2014, 122, 1–9. [Google Scholar] [CrossRef]
- Salameh, E.; Frappart, F.; Marieu, V.; Spodar, A.; Parisot, J.-P.; Hanquiez, V.; Turki, I.; Laignel, B. Monitoring Sea Level and Topography of Coastal Lagoons Using Satellite Radar Altimetry: The Example of the Arcachon Bay in the Bay of Biscay. Remote Sens. 2018, 10, 297. [Google Scholar] [CrossRef] [Green Version]
- Hersbach, H.; Stoffelen, A.; de Haan, S. An improved C-band scatterometer ocean geophysical model function: CMOD5. J. Geophys. Res. Oceans 2007, 112, 1–18. [Google Scholar] [CrossRef]
- Zhang, L.; Shi, H.; Wang, Z.; Yu, H.; Yin, X.; Liao, Q. Comparison of Wind Speeds from Spaceborne Microwave Radiometers with In Situ Observations and ECMWF Data over the Global Ocean. Remote Sens. 2018, 10, 425. [Google Scholar] [CrossRef] [Green Version]
- Lin, H.; Xu, Q.; Zheng, Q. An overview on SAR measurements of sea surface wind. Progress Nat. Sci. 2008, 18, 913–919. [Google Scholar] [CrossRef]
- Corcione, V.; Grieco, G.; Portabella, M.; Nunziata, F.; Migliaccio, M. A novel azimuth cutoff implementation to retrieve sea surface wind speed from SAR imagery. IEEE Trans. Geosci. Remote Sens. 2018, 57, 3331–3340. [Google Scholar] [CrossRef]
- Ho, C.-R.; Zheng, Q.; Soong, Y.S.; Kuo, N.-J.; Hu, J.-H. Seasonal variability of sea surface height in the South China Sea observed with TOPEX/Poseidon altimeter data. J. Geophys. Res. 2000, 105, 13981–13990. [Google Scholar] [CrossRef]
- Dufau, C.; Orsztynowicz, M.; Dibarboure, G.; Morrow, R.; Le Traon, P.-Y. Mesoscale resolution capability of altimetry: Present and future. J. Geophys. Res. Oceans 2016, 121, 4910–4927. [Google Scholar] [CrossRef] [Green Version]
- Quartly, G.D.; Smith, W.H.F.; Passaro, M. Removing Intra-1-Hz Covariant Error to Improve Altimetric Profiles of σ0 and Sea Surface Height. IEEE Trans. Geosci. Remote Sens. 2019, 57, 3741–3752. [Google Scholar] [CrossRef]
- Chelton, D.B.; Ries, J.C.; Haines, B.J.; Fu, L.-L.; Callahan, P.S. Satellite altimetry. In Satellite Altimetry and Earth Science: A Handbook of Techniques and Applications 69, International Geophysics Series; Fu, L.-L., Cazenave, A., Eds.; Academic Press: Cambridge, MA, USA, 2001; pp. 1–131. [Google Scholar]
- Deng, X.; Featherstone, W.E. A coastal retracking system for satellite radar altimeter waveforms: Application to ERS-2 around Australia. J. Geophys. Res. 2005, 111, C06012. [Google Scholar] [CrossRef] [Green Version]
- Passaro, M.; Cipollini, P.; Vignudelli, S.; Quartly, G.D.; Snaith, H.M. ALES: A multi-mission adaptive subwaveform retracker for coastal and open ocean altimetry. Remote Sens. Environ. 2014, 145, 173–189. [Google Scholar] [CrossRef] [Green Version]
- Bannoura, W.J.; Wade, A.; Srinivas, D.N. NOAA Ocean Surface Topography Mission Jason-2 project overview. In Proceedings of the OCEANS 2005 MTS/IEEE, Washington, DC, USA, 17–23 September 2005; Volume 3, pp. 2155–2159. [Google Scholar] [CrossRef]
- Scharroo, R.; Bonekamp, H.; Ponsard, C.; Parisot, F.; von Engeln, A.; Tahtadjiev, M.; de Vriendt, K.; Montagner, F. Jason continuity of services: Continuing the Jason altimeter data records as Copernicus Sentinel-6. Ocean Sci. 2016, 12, 471–479. [Google Scholar] [CrossRef] [Green Version]
- Donlon, C.J.; Cullen, R.; Giulicchi, L.; Vuilleumier, P.; Francis, C.R.; Kuschnerus, M.; Simpson, W.; Bouridah, A.; Caleno, M.; Bertoni, R.; et al. The Copernicus Sentinel-6 mission: Enhanced continuity of satellite sea level measurements from space. Remote Sens. Environ. 2021, 258, 112395. [Google Scholar] [CrossRef]
- Lowe, S.T.; Zuffada, C.; Chao, Y.; Kroger, P.; Young, L.E.; LaBrecque, J.L. 5-cm-Precision aircraft ocean altimetry using GPS reflections. Geophys. Res. Lett. 2002, 29, 13-1–13-4. [Google Scholar] [CrossRef] [Green Version]
- Clarizia, M.P.; Ruf, C.; Cipollini, P.; Zuffada, C. First spaceborne observation of sea surface height using GPS-Reflectometry. Geophys. Res. Lett. 2016, 43, 767–774. [Google Scholar] [CrossRef] [Green Version]
- Martin-Neira, M. A Passive Reflectometry and Interferometry System (PARIS): Application to ocean altimetry. ESA J. 1993, 17, 331–355. [Google Scholar]
- Martin-Neira, M.; D’Addio, S.; Buck, C.; Floury, N.; Prieto-Cerdeira, R. The PARIS ocean altimeter in-orbit demonstrator. IEEE Trans. Geosci. Remote Sens. 2011, 49, 2209–2237. [Google Scholar] [CrossRef]
- Boudouresque, C.F.; Bernard, G.; Bonhomme, P.; Charbonnel, E.; Diviacco, G.; Meinesz, A.; Pergent, G.; Pergent-Martini, C.; Ruitton, S.; Tunesi, L. Protection and Conservation of Posidonia oceanica Meadows; RAMOGE and RAC/SPA Publisher: Tunis, Tunisia, 2012. [Google Scholar]
- Buhl-Mortensen, L.; Vanreusel, A.; Gooday, A.J.; Levin, L.A.; Priede, I.G.; Buhl-Mortensen, P.; Gheerardyn, H.; King, N.J.; Raes, M. Biological structures as a source of habitat heterogeneity and biodiversity on the deep ocean margins. Mar. Ecol. 2010, 31, 21–50. [Google Scholar] [CrossRef]
- Buonocore, E.; Donnarumma, L.; Appolloni, L.; Miccio, A.; Russo, G.F.; Franzese, P.P. Marine natural capital and ecosystem services: An environmental accounting model. Ecol. Modell. 2020, 424, 109029. [Google Scholar] [CrossRef]
- Costanza, R.; d’Arge, R.; de Groot, R.; Farber, S.; Grasso, M.; Hannon, B.; Limburg, K.; Naeem, S.; O’Neill, R.V.; Paruelo, J.; et al. The value of the world’s ecosystem services and natural capital. Nature 1997, 387, 253–260. [Google Scholar] [CrossRef]
- Hemminga, M.A.; Duarte, C.M. Seagrass Ecology; Cambridge University Press: Cambridge, UK, 2000. [Google Scholar] [CrossRef]
- Mazarrasa, I.; Samper-Villarreal, J.; Serrano, O.; Lavery, P.S.; Lovelock, C.E.; Marbà, N.; Duarte, C.M.; Cortés, J. Habitat characteristics provide insights of carbon storage in seagrass meadows. Mar. Pollut. Bull. 2018, 134, 106–117. [Google Scholar] [CrossRef]
- Akçalı, B.; Taşkın, E.; Kaman, G.; Evcen, A.; Çalık, H.; Akyol, O. Posidonia Oceanica Monitoring System on the Coast of Aegean Sea of Turkey. In Eighth International Symposium “Monitoring of Mediterranean Coastal Areas. Problems and Measurement Techniques”; Bonora, L., Carboni, D., De Vincenzi, M., Eds.; Firenze University Press: Florence, Italy, 2000; pp. 475–482. [Google Scholar] [CrossRef]
- Buia, M.C.; Gambi, M.C.; Dappiano, M. The seagrass ecosystems. In Mediterranean Marine Benthos: A Manual for Its Sampling and Study, Biologia Marina Mediterranea; Gambi, M.C., Dappiano, M., Eds.; Società Italiana di Biologia Marina: Genoa, Italy, 2004; Volume 11, (Suppl. 1), pp. 133–183. [Google Scholar]
- Franzese, P.P.; Buonocore, E.; Paoli, C.; Massa, F.; Donati, S.; Fanciulli, G.; Miccio, A.; Mollica, E.; Navone, A.; Russo, G.F.; et al. Environmental Accounting in Marine Protected Areas: The EAMPA Project. J. Environ. Account. Manag. 2015, 3, 324–332. [Google Scholar] [CrossRef]
- Orth, R.J.; Carruthers, T.J.B.; Dennison, W.C.; Duarte, C.M.; Fourqurean, J.W.; Heck, K.L.; Hughes, A.R.; Kendrick, G.A.; Kenworthy, W.J.; Olyarnik, S.; et al. A Global Crisis for Seagrass Ecosystems. Bioscience 2006, 56, 987. [Google Scholar] [CrossRef] [Green Version]
- Wright, J.P.; Jones, C.G. The Concept of Organisms as Ecosystem Engineers Ten Year On: Progress, Limitations, and Challenges. BioScience 2006, 56, 203–209. [Google Scholar] [CrossRef] [Green Version]
- Roelfsema, C.M.; Lyons, M.; Kovacs, E.M.; Maxwell, P.; Saunders, M.I.; Samper-Villarreal, J.; Phinn, S.R. Multi-temporal mapping of seagrass cover, species and biomass: A semi-automated object based image analysis approach. Remote Sens. Environ. 2014, 150, 172–187. [Google Scholar] [CrossRef]
- Traganos, D.; Reinartz, P. Interannual Change Detection of Mediterranean Seagrasses Using RapidEye Image Time Series. Front. Plant Sci. 2018, 9, 96. [Google Scholar] [CrossRef] [Green Version]
- Mateo, M.-Á.; Sánchez-Lizaso, J.-L.; Romero, J. Posidonia oceanica “banquettes”: A preliminary assessment of the relevance for meadow carbon and nutrients budget. Estuar. Coast. Shelf Sci. 2003, 56, 85–90. [Google Scholar] [CrossRef]
- Nellemann, C.; Corcoran, E.; Duarte, C.M.; Valdés, L.; De Young, C.; Fonseca, L.; Grimsditch, G. (Eds.) Blue Carbon. In A Rapid Response Assessment; GRID-Arendal; United Nations Environment Programme: Nairobi, Kenya, 2009; Available online: www.grida.no (accessed on 8 October 2021).
- Carruthers, T.J.B.; Dennison, W.C.; Kendrick, G.A.; Waycott, M. Seagrasses of south—West Australia: A conceptual synthesis of the world’s most diverse and extensive seagrass meadows. J. Exp. Mar. Biol. Ecol. 2007, 350, 21–45. [Google Scholar] [CrossRef]
- Telesca, L.; Belluscio, A.; Criscoli, A.; Ardizzone, G.; Apostolaki, E.T.; Fraschetti, S.; Gristina, M.; Knittweis, L.; Martin, C.S.; Pergent, G.; et al. Seagrass meadows (Posidonia oceanica) distribution and trajectories of change. Sci. Rep. 2015, 5, 1–14. [Google Scholar] [CrossRef] [PubMed] [Green Version]
- Short, F.T.; Polidoro, B.; Livingstone, S.R.; Carpenter, K.E.; Bandeira, S.; Bujang, J.S.; Calumpong, H.P.; Carruthers, T.J.B.; Coles, R.G.; Dennison, W.C.; et al. Extinction risk assessment of the world’s seagrass species. Biol. Conserv. 2011, 144, 1961–1971. [Google Scholar] [CrossRef]
- Waycott, M.; Duarte, C.M.; Carruthers, T.J.B.; Orth, R.J.; Dennison, W.C.; Olyarnik, S.; Calladine, A.; Fourqurean, J.W.; Heck, K.L.; Hughes, A.R.; et al. Accelerating loss of seagrasses across the globe threatens coastal ecosystems. Proc. Natl. Acad. Sci. USA 2009, 106, 12377–12381. [Google Scholar] [CrossRef] [PubMed] [Green Version]
- Ruiz, J.M.; Pérez, M.; Romero, J. Effects of Fish Farm Loadings on Seagrass (Posidonia oceanica) Distribution, Growth and Photosynthesis. Mar. Pollut. Bull. 2001, 42, 749–760. [Google Scholar] [CrossRef]
- Häyhä, T.; Franzese, P.P. Ecosystem services assessment: A review under an ecological-economic and systems perspective. Ecol. Modell. 2014, 289, 124–132. [Google Scholar] [CrossRef]
- Franzese, P.P.; Buonocore, E.; Donnarumma, L.; Russo, G.F. Natural capital accounting in marine protected areas: The case of the Islands of Ventotene and S. Stefano (Central Italy). Ecol. Modell. 2017, 360, 290–299. [Google Scholar] [CrossRef]
- Appolloni, L.; Buonocore, E.; Russo, G.F.; Franzese, P.P. The use of remote sensing for monitoring Posidonia oceanica and Marine Protected Areas: A systemic review. Ecol. Quest. 2020, 1, 7–17. [Google Scholar] [CrossRef] [Green Version]
- Cozza, R.; Rende, F.; Ferrari, M.; Bruno, L.; Pacenza, M.; Dattola, L.; Bitonti, M.B. Biomonitoring of Posidonia oceanica beds by a multiscale approach. Aquat. Bot. 2019, 156, 14–24. [Google Scholar] [CrossRef]
- Phinn, S.; Roelfsema, C.; Kovacs, E.; Canto, R.; Lyons, M.; Saunders, M.; Maxwell, P. Mapping, monitoring and modelling seagrass using remote sensing techniques. In Seagrasses of Australia; Larkum, A.W.D., Kendrick, G.A., Ralph, P.J., Eds.; Springer: Berlin/Heidelberg, Germany, 2018; pp. 445–487. [Google Scholar] [CrossRef]
- Veettil, B.K.; Ward, R.D.; Lima, M.D.A.C.; Stankovic, M.; Hoai, P.N.; Quang, N.X. Opportnities for seagrass research derived from remote sensing: A review of current methods. Ecol. Indic. 2020, 117, 106560. [Google Scholar] [CrossRef]
- Giardino, C.; Bartoli, M.; Candianai, G.; Bresciani, M.; Pellegrini, L. Recent changes in macrophyte colonisation patterns: An imaging spectrometry-based evaluation of southern Lake Garda (northern Italy). J. Appl. Remote Sens. 2007, 1, 11509. [Google Scholar] [CrossRef]
- Catucci, E.; Scardi, M. A Machine Learning approach to the assessment of the vulnerability of Posidonia oceanica meadows. Ecol. Indic. 2020, 108, 105744. [Google Scholar] [CrossRef]
- Pham, T.D.; Xia, J.; Ha, N.T.; Bui, D.T.; Le, N.N.; Takeuchi, W. A Review of Remote Sensing Approaches for Monitoring Blue Carbon Ecosystems: Mangroves, Seagrasses and Salt Marshes during 2010–2018. Sensors 2019, 19, 1933. [Google Scholar] [CrossRef] [PubMed] [Green Version]
- Thessen, A.E. Adoption of machine learning techniques in ecology and earth science. One Ecosyst. 2016, 1, 1–38. [Google Scholar] [CrossRef]
- Pasqualini, V.; Pergent-Martini, C.; Pergent, G.; Agreil, M.; Skoufas, G.; Sourbes, L.; Tsirika, A. Use of SPOT 5 for mapping seagrasses: An application to Posidonia oceanica. Remote Sens. Environ. 2005, 94, 39–45. [Google Scholar] [CrossRef]
- Maglione, P. Very High Resolution Optical Satellites: An Overview of the Most Commonly used. Am. J. Appl. Sci. 2016, 13, 91–99. [Google Scholar] [CrossRef] [Green Version]
- Rende, S.F.; Bosman, A.; Di Mento, R.; Bruno, F.; Lagudi, A.; Irving, A.D.; Dattola, L.; Giambattista, L.D.; Lanera, P.; Proietti, R.; et al. Ultra-High-Resolution Mapping of Posidonia oceanica (L.) Delile Meadows through Acoustic, Optical Data and Object-based Image Classification. J. Mar. Sci. Eng. 2020, 8, 647. [Google Scholar] [CrossRef]
- Coffer, M.M.; Schaeffer, B.A.; Zimmerman, R.C.; Hill, V.; Li, J.; Islam, K.A.; Whitman, P.J. Performance across WorldView-2 and RapidEye for reproducuble seagrass mapping. Remote Sens. Environ. 2020, 250, 112036. [Google Scholar] [CrossRef]
- Fornes, A.; Basterretxea, G.; Orfila, A.; Jordi, A.; Alvarez, A.; Tintore, J. Mapping Posidonica oceanica from IKONOS. ISPRS J. Photogramm. 2006, 60, 315–322. [Google Scholar] [CrossRef]
- Giardino, C.; Bresciani, M.; Fava, F.; Matta, E.; Brando, V.E.; Colombo, R. Mapping Submerged Habitats and Mangroves of Lampi Island Marine National Park (Myanmar) from in Situ and Satellite Observations. Remote Sens. 2016, 8, 2. [Google Scholar] [CrossRef] [Green Version]
- Matta, E.; Aiello, M.; Bresciani, M.; Gianinetto, M.; Musanti, M.; Giardino, C. Mapping Posidonia meadow from high spatial resolution images in the Gulf of Oristano (Italy). In Proceedings of the 2014 IEEE Geoscience and Remote Sensing Symposium, Quebec City, QC, Canada, 13–18 July 2014; pp. 5152–5155. [Google Scholar] [CrossRef]
- Giorgi, F. Climate change hot spots. Geophys. Res. Lett. 2006, 33, L08707. [Google Scholar] [CrossRef]
- Alexander, L.V.; Zhang, X.; Peterson, T.C.; Caesar, J.; Gleason, B.; Klein Tank, A.M.G.; Haylock, M.; Collins, D.; Trewin, B.; Rahimzadeh, F.; et al. Global observed changes in daily climate extremes of temperature and precipitation. J. Geophys. Res. 2006, 111, D05109. [Google Scholar] [CrossRef] [Green Version]
- Bucchignani, E.; Montesarchio, M.; Zollo, A.L.; Mercogliano, P. High-resolution climate simulations with COSMO-CLM over Italy: Performance evaluation and climate projections for the XXI century. Int. J. Climatol. 2015, 36, 735–756. [Google Scholar] [CrossRef]
- Donat, M.G.; Alexander, L.V.; Yang, H.; Durre, I.; Vose, R.; Dunn, R.J.H.; Willett, K.M.; Aguilar, E.; Brunet, M.; Caesar, J.; et al. Updated analyses of temperature and precipitation extreme indices since the beginning of the twentieth century: The HadEX2 dataset. J. Geophys. Res. 2013, 118, 2098–2118. [Google Scholar] [CrossRef]
- Cardell, M.F.; Amengual, A.; Romero, R.; Ramis, C. Future extremes of temperature and precipitation in Europe derived from a combination of dynamical and statistical approaches. Int. J. Climatol. 2020, 40, 4800–4827. [Google Scholar] [CrossRef]
- Hou, A.Y.; Kakar, R.K.; Neeck, S.; Azarbarzin, A.A.; Kummerow, C.D.; Kojima, M.; Oki, R.; Nakamura, K.; Iguchi, T. The Global Precipitation Measurement Mission. Bull. Am. Meteorol. Soc. 2014, 95, 701–722. [Google Scholar] [CrossRef]
- Levizzani, V.; Cattani, E. Satellite Remote Sensing of Precipitation and the Terrestrial Water Cycle in a Changing Climate. Remote Sens. 2019, 11, 2301. [Google Scholar] [CrossRef] [Green Version]
- Covello, F.; Battazza, F.; Coletta, A.; Lopinto, E.; Fiorentino, C.; Pietranera, L.; Valentini, G.; Zoffoli, S. COSMO_SkyMed an existing opportunity for observing the Earth. J. Geodyn. 2010, 49, 171–180. [Google Scholar] [CrossRef] [Green Version]
- Caltagirone, F.; Capuzzi, A.; Coletta, A.; De Luca, G.F.; Scorzafava, E.; Leonardi, R.; Rivola, S.; Fagioli, S.; Angino, G.; L’Abbate, M.; et al. The COSMO-SkyMed Dual Use Earth Observation Program: Development, Qualification, and Results of the Commissioning of the Overall Constellation. IEEE J. Sel. Top. Appl. Earth Obs. Remote Sens. 2014, 7, 2754–2762. [Google Scholar] [CrossRef]
- Battaglia, A.; Kollias, P.; Dhillon, R.; Roy, R.; Tanelli, S.; Lamer, K.; Grecu, M.; Lebsock, M.; Watters, D.; Mroz, K.; et al. Spaceborne cloud and precipitation radars: Status, challenges, and ways forward. Rev. Geophys. 2020, 58, e2019RG000686. [Google Scholar] [CrossRef]
- Li, N.; Wang, Z.; Chen, X.; Austin, G. Studies of General Precipitation Features with TRMM PR Data: An Extensive Overview. Remote Sens. 2019, 11, 80. [Google Scholar] [CrossRef] [Green Version]
- Panegrossi, G.; Casella, D.; Dietrich, S.; Marra, A.C.; Sanò, P.; Mugnai, A.; Baldini, L.; Roberto, N.; Adirosi, E.; Cremonini, R.; et al. Use of the GPM constellation for monitoring heavy precipitation events over the Mediterranean region. IEEE J. Sel. Top. Appl. Earth Obs. Remote Sens. 2016, 9, 2733–2753. [Google Scholar] [CrossRef]
- Yong, B.; Liu, D.; Gourley, J.J.; Tian, Y.; Huffman, G.J.; Ren, L.; Hong, Y. Global View Of Real-Time TRMM Multisatellite Precipitation Analysis: Implications For Its Successor Global Precipitation Measurement Mission. Bull. Am. Meteorol. Soc. 2015, 96, 283–296. [Google Scholar] [CrossRef]
- McCabe, M.F.; Rodell, M.; Alsdorf, D.E.; Miralles, D.G.; Uijlenhoet, R.; Wagner, W.; Lucieer, A.; Houborg, R.; Verhoest, N.E.C.; Franz, T.E.; et al. The future of Earth Observation in hydrology. Hydrol. Earth Syst. Sci. 2017, 21, 3879–3914. [Google Scholar] [CrossRef] [Green Version]
- Caspi, A.; Barthelemy, M.; Bussy-Virat, C.D.; Cohen, I.J.; DeForest, C.E.; Jackson, D.R.; Vourlidas, A.; Nieves-Chinchilla, T. Small satellite mission concepts for space weather research and as pathfinders for operations. Space Weather 2022, 20, e2020SW002554. [Google Scholar] [CrossRef]
- Berg, W.; Brown, S.T.; Lim, B.H.; Reising, S.C.; Goncharenko, Y.; Kummerow, C.D.; Gaier, T.C.; Padmanabhan, S. Calibration and Validation of the TEMPEST-D CubeSat Radiometer. IEEE Trans. Geosci. Remote Sens. 2021, 59, 4904–4914. [Google Scholar] [CrossRef]
- Blackwell, W.J.; Braun, S.; Bennartz, R.; Velden, C.; DeMaria, M.; Atlas, R.; Dunion, J.; Marks, F.; Rogers, R.; Annane, B.; et al. An overview of the TROPICS NASA Earth Venture Mission. Q. J. R Meteorol. Soc. 2018, 144 (Suppl. S1), 16–26. [Google Scholar] [CrossRef] [Green Version]
- Mehta, A.V.; Yang, S. Precipitation climatology over Mediterranean Basin from ten years of TRMM Measurement. Adv. Geosci. 2008, 17, 87–91. [Google Scholar] [CrossRef] [Green Version]
- Murphy, M.S.; Konrad, C.E., II. Spatial and Temporal Patterns of Thunderstorm Events that Produce Cloud-to-Ground Lightning in the Interior Southeastern United States. Mon. Weather Rev. 2005, 133, 1417–1430. [Google Scholar] [CrossRef]
- Retalis, A.; Katsanos, D.; Michaelides, S. Precipitation climatology over the Mediterranean Basin—Validation over Cyprus. Atmos. Res. 2016, 169, 449–458. [Google Scholar] [CrossRef]
- Stampoulis, D.; Emmanouil, N.A. Assessment of High-Resolution Satellite-Based Rainfall Estimates over the Mediterranean during Heavy Precipitation Events. J. Hydrometeorol. 2013, 14, 1500–1514. [Google Scholar] [CrossRef]
- Ruf, C.S.; Chew, C.; Lang, T.; Morris, M.G.; Nave, K.; Ridley, A.; Balasubramaniam, R. A New Paradigm in Earth Environmental Monitoring with the CYGNSS Small Satellite Constellation. Sci. Rep. 2018, 8, 8782. [Google Scholar] [CrossRef] [PubMed] [Green Version]
- Baldini, L.; Chandrasekar, V.; Moisseev, D. Microwave radar signatures of precipitation from S band to Ka band: Application to GPM mission. Eur. J. Remote Sens. 2012, 45, 75–88. [Google Scholar] [CrossRef] [Green Version]
- Kirstetter, P.-E.; Andrieu, H.; Delrieu, G.; Boudevillain, B. Identification of Vertical Profiles of Reflectivity for Correction of Volumetric Radar Data Using Rainfall Classification. J. Appl. Meteorol. Clim. 2010, 49, 2167–2180. [Google Scholar] [CrossRef]
- Friedrich, K.; Hagen, M.; Einfalt, T. A Quality Control Concept for Radar Reflectivity, Polarimetric Parameters, and Doppler Velocity. J. Atmos. Ocean. Tech. 2006, 23, 865–887. [Google Scholar] [CrossRef] [Green Version]
- Martins Costa do Amaral, L.; Barbieri, S.; Vila, D.; Puca, S.; Vulpiani, G.; Panegrossi, G.; Biscaro, T.; Sanò, P.; Petracca, M.; Marra, A.C.; et al. Assessment of Ground-Reference Data and Validation of the H-SAF Precipitation Products in Brazil. Remote Sens. 2018, 10, 1743. [Google Scholar] [CrossRef] [Green Version]
- Qi, Y.; Zhang, J.; Zhang, P. A real-time automated convective and stratiform precipitation segregation algorithm in native radar coordinates. Q. J. R. Meteor. Soc. 2013, 193, 2233–2240. [Google Scholar] [CrossRef]
- Chaturvedi, S.K. Study of synthetic aperture radar and automatic identification system for ship target detection. J. Ocean Eng. Sci. 2019, 4, 173–182. [Google Scholar] [CrossRef]
- Moreira, A.; Prats-Iraola, P.; Younis, M.; Krieger, G.; Hajnsek, I.; Papathanassiou, K.P. A tutorial on synthetic aperture radar. IEEE Geosci. Remote Sens. Mag. 2013, 1, 6–43. [Google Scholar] [CrossRef] [Green Version]
- Crisp, D.J. The State-of-the-Art in Ship Detection in Synthetic Aperture Radar Imagery. Defence Sci. Technol. Org., Port Wakefield, South Australia, 2004, Research Report DSTO-RR-0272. Available online: http://www.dsto.defence.gov.au/corporate/reports (accessed on 26 September 2021).
- Ouchi, K. Current Status on Vessel Detection and Classification by Synthetic Aperture Radar for Maritime Security and Safety. In Proceedings of the 38th Symposium on Remote Sensing for Environmental Sciences, Gamagori, Aichi, Japan, 3–5 September 2016; pp. 5–12. [Google Scholar]
- Pelich, R.; Longépé, N.; Mercier, G.; Hajduch, G.; Garello, R. Performance evaluation of Sentinel-1 data in SAR ship detection. In Proceedings of the 2015 IEEE International Geoscience and Remote Sensing Symposium (IGARSS), Milan, Italy, 26–31 July 2015. [Google Scholar] [CrossRef]
- Snapir, B.; Waine, T.W.; Biernamnn, L. Maritime Vessel Classification to Monitor Fisheries with SAR: Demonstration in the North Sea. Remote Sens. 2019, 11, 353. [Google Scholar] [CrossRef] [Green Version]
- Buckreuss, S.; Schättler, B.; Fritz, T.; Mittermayer, J.; Kahle, R.; Maurer, E.; Böer, J.; Bachmann, M.; Mrowka, F.; Schwarz, E.; et al. Ten Years of TerraSAR-X Operations. Remote Sens. 2018, 10, 873. [Google Scholar] [CrossRef] [Green Version]
- Brusch, S.; Lehner, S.; Fritz, T.; Soccorsi, M.; Soloviev, A.; van Schie, B. Ship Surveillance With TerraSAR-X. IEEE Trans. Geosci. Remote Sens. 2011, 49, 1092–1103. [Google Scholar] [CrossRef]
- Marin, C.; Bovolo, F.; Bruzzone, L. Building Change Detection in Multitemporal Very High Resolution SAR Images. IEEE Trans. Geosci. Remote Sens. 2015, 53, 2664–2682. [Google Scholar] [CrossRef]
- Bovolo, F.; Marin, C.; Bruzzone, L. A Hierarchical Approach to Change Detection in Very High Resolution SAR Images for Surveillance Applications. IEEE Trans. Geosci. Remote Sens. 2013, 51, 2042–2054. [Google Scholar] [CrossRef]
- Lanz, P.; Marino, A.; Brinkhoff, T.; Köster, F.; Möller, M. The InflateSAR Campaign: Testing SAR Vessel Detection Systems for Refugee Rubber Inflatables. Remote Sens. 2021, 13, 1487. [Google Scholar] [CrossRef]
- Migliaccio, M.; Gambardella, A.; Nunziata, F. Ship detection over single-look complex SAR images. In Proceedings of the IEEE/OES US/EU-Baltic International Symposium, Tallinn, Estonia, 27–29 May 2008. [Google Scholar] [CrossRef]
- Schwartz, C.; Ramos, L.P.; Duarte, L.T.; da S. Pinho, M.; Pettersson, M.I.; Vu, V.T.; Machado, R. Change Detection in UWB SAR Images Based on Robust Principal Component Analysis. Remote Sens. 2020, 12, 1916. [Google Scholar] [CrossRef]
- Gambardella, A.; Nunziata, F.; Migliaccio, M. A Physical Full-Resolution SAR Ship Detection Filter. IEEE Geosci. Remote Sens. Lett. 2008, 5, 760–763. [Google Scholar] [CrossRef]
- Migliaccio, M.; Ferrara, G.; Gambardella, A.; Nunziata, F.; Sorrentino, A. A Physically Consistent Speckle Model for Marine SLC SAR Images. IEEE J. Ocean. Eng. 2007, 32, 839–847. [Google Scholar] [CrossRef]
- Wang, Y.; Liu, H. A hierarchical Ship Detection Scheme for High-Resolution SAR images. IEEE Trans. Geosci. Remote Sens. 2012, 50, 4173–4184. [Google Scholar] [CrossRef]
- Saha, S.; Bovolo, F.; Bruzzone, L. Destroyed-buildings detection from VHR SAR images using deep features. In Proceedings of the Image and Signal Processing for Remote Sensing XXIV, Berlin, Germany, 10–13 September 2018; Volume 10789, p. 107890Z. [Google Scholar] [CrossRef]
- Pennino, S.; Angrisano, A.; Della Corte, V.; Ferraioli, G.; Gaglione, S.; Innac, A.; Martellato, E.; Palumbo, P.; Piscopo, V.; Rotundi, A.; et al. Sea State Monitoring by Ship Motion Measurements Onboard a Research Ship in the Antarctic Waters. J. Mar. Sci. Eng. 2021, 9, 64. [Google Scholar] [CrossRef]
- Pascoal, R.; Guedes Soares, C.; Sørensen, J. Ocean wave spectral estimation using vessel wave frequency motions. J. Offshore Mech. Arct. Eng. 2007, 129, 90–96. [Google Scholar] [CrossRef]
- Piscopo, V.; Scamardella, A.; Gaglione, S. A new wave spectrum resembling procedure based on ship motion analysis. Ocean Eng. 2020, 201, 107137. [Google Scholar] [CrossRef]
- Krata, P.; Szlapczynska, J. Weather hazard avoidance in modeling safety of motor-driven ship for multicriteria weather routing. Int. J. Mar. Navig. Saf. Sea Transp. 2012, 6, 71–78. [Google Scholar] [CrossRef]
- Scamardella, A.; Piscopo, V. Passenger ship seakeeping optimization by the Overall Motion Sickness Incidence. Ocean Eng. 2014, 76, 86–97. [Google Scholar] [CrossRef]
- Born, G.H.; Dunne, J.A.; Lame, D.B. Seat Mission Overview. Science 1979, 204, 1405–1406. [Google Scholar] [CrossRef] [PubMed]
- Geudtner, D.; Tossaint, M.; Davidson, M.; Torres, R. Copernicus Sentinel-1 Next Generation Mission. In Proceedings of the IEEE International Geoscience ad Remote Sensing Symposium IGARSS, Brussels, Belgium, 11–16 July 2021; pp. 874–876. [Google Scholar] [CrossRef]
- Bruck, M.; Lehner, S. Coastal wave field extraction using TerraSAR-X data. J. Appl. Remote Sens. 2013, 7, 073694. [Google Scholar] [CrossRef] [Green Version]
- Pleskachevsky, A.; Jacobse, S.; Tings, B.; Schwarz, E. Estimation of sea state from Sentinel-1 Synthetic aperture radar imagery for maritime situation awareness. Int. J. Remote Sens. 2019, 40, 4104–4142. [Google Scholar] [CrossRef] [Green Version]
- Innac, A.; Angrisano, A.; Dardanelli, G.; Della Corte, V.; Martellato, E.; Rotundi, A.; Ferraioli, G.; Palumbo, P.; Gaglione, S. A Kalman filter single point positioning for maritime applications using a smartphone. Geogr. Tech. 2021, 16, 15–29. [Google Scholar] [CrossRef]
- Montazeri, N.; Nielsen, U.D.; Jensen, J.J. Estimation of wind sea and swell using shipboard measurements—A refined parametric modelling approach. Appl. Ocean Res. 2016, 54, 73–86. [Google Scholar] [CrossRef]
- Chupin, C.; Ballu, V.; Testut, L.; Tranchant, Y.-T.; Calzas, M.; Poirier, E.; Coulombier, T.; Laurain, O.; Bonnefond, P.; Team FOAM Project. Mapping Sea Surface Height Using New Concepts of Kinematic GNSS Instruments. Remote Sens. 2020, 12, 2656. [Google Scholar] [CrossRef]
- Foster, J.H.; Carter, G.S.; Merrifield, M.A. Ship-based measurements of sea surface topography. Geophys. Res. Lett. 2009, 36, L11605. [Google Scholar] [CrossRef]
- Pascoal, R.; Perera, L.P.; Soares, C.G. Estimation of directional spectra from ship motions sea trials. Ocean Eng. 2017, 132, 126–137. [Google Scholar] [CrossRef]
- Dalla Mura, M.; Prasad, S.; Pacifici, F.; Gamba, P.; Chanussot, J.; Benediktsson, J.A. Challenges and Opportunities of Multimodality and Data Fusion in Remote Sensing. Proc. IEEE 2015, 103, 1585–1601. [Google Scholar] [CrossRef] [Green Version]
- Ghassemian, H. A review of remote sensing image fusion methods. Inform. Fusion. 2016, 32, 75–89. [Google Scholar] [CrossRef]
- Ghamisi, P.; Rasti, B.; Yokoya, N.; Wang, Q.; Höfle, B.; Bruzzone, L.; Bovolo, F.; Chi, M.; Anders, K.; Gloaguen, R.; et al. Multisource and Multitemporal Data Fusion in Remote Sensing: A Comprehensive Review of the State of the Art. IEEE Geosci. Remote Sens. Mag. 2019, 7, 6–39. [Google Scholar] [CrossRef] [Green Version]
- Belgiu, M.; Stein, A. Spatiotemporal Image Fusion in Remote Sensing. Remote Sens. 2019, 11, 818. [Google Scholar] [CrossRef] [Green Version]
- Zhang, J. Multi-source remote sensing data fusion: Status and trends. Int. J. Image Data Fusion. 2010, 1, 5–24. [Google Scholar] [CrossRef] [Green Version]
- Castanedo, F. A review of data fusion techniques. Sci. World J. 2013, 2013, 704504. [Google Scholar] [CrossRef]
- Arun, P.V.; Sadeh, R.; Avneri, A.; Tubul, Y.; Camino, C.; Buddhiraju, K.M.; Porwal, A.; Lati, R.N.; Zarco-Tejada, P.J.; Peleg, Z.; et al. Multimodal Earth Observation data fusion: Graph-based approach in shared latent space. Inform. Fusion 2022, 78, 20–39. [Google Scholar] [CrossRef]
- Rodger, M.; Guida, R. Classification-Aided SAR and AIS Data Fusion for Space-Based Maritime Surveillance. Remote Sens. 2021, 13, 104. [Google Scholar] [CrossRef]
- Zhang, J.; Zhou, Y.; Luo, J. Deep learning for processing and analysis of remote sensing big data: A technical review. Big Earth Data 2021. [Google Scholar] [CrossRef]
- Keenan, T.F.; Davidson, E.; Moffat, A.M.; Munger, W.; Richardson, A.D. Using model-data fusion to interpret past trends, and quantify uncertainties in future projections, of terrestrial ecosystem carbon cycling. Glob. Chang. Biol. 2012, 18, 2555–2569. [Google Scholar] [CrossRef] [Green Version]
- Fernández Prieto, D. Change detection in multisensor remote-sensing data for desertification monitoring. In Proceedings of the Third International Symposium on Retrieval of Bio- and Geophysical Parameters from SAR Data for Land Applications, Sheffield, UK, 11–14 September 2001; Wilson, A., Quegan, S., Eds.; ESA SP-475. ESA Publications Division: Noordwijk, The Netherlands, 2002; pp. 255–260. [Google Scholar]
- Schultz, M.; Clevers, J.G.P.W.; Carter, S.; Verbesselt, J.; Avitabile, V.; Quang, H.V.; Herold, M. Performance of vegetation indices from Landsat time series in deforestation monitoring. Int. J. Appl. Earth Obs. 2016, 52, 318–327. [Google Scholar] [CrossRef]
- Basile, M.; Maglione, P.; Parente, C.; Santamaria, R. Cartography and remote sensing for coastal erosion analysis. Coastal Processes II. WIT Trans. Ecol. Environ. 2011, 149, 65–76. [Google Scholar] [CrossRef] [Green Version]
- Hu, Y.; Jia, G.; Pohl, C.; Feng, Q.; He, Y.; Gao, H.; Xu, R.; van Genderen, J.; Feng, J. Improved monitoring of urbanization processes in China for regional climate impact assessment. Environ. Earth Sci. 2015, 73, 8387–8404. [Google Scholar] [CrossRef]
- Ehlers, M.; Klonus, S.; Åstrand, P.J.; Rosso, P. Multi-sensor image fusion for pansharpening in remote sensing. Int. J. Image Data Fusion 2010, 1, 25–45. [Google Scholar] [CrossRef]
- Garzelli, A. A Review of Image Fusion Algorithms Based on the Super-Resolution Paradigm. Remote Sens. 2016, 8, 797. [Google Scholar] [CrossRef] [Green Version]
- Palubinskas, G. Fast, simple, and good pan-sharpening method. J. Appl. Remote Sens. 2013, 7, 073526. [Google Scholar] [CrossRef]
- Bork, E.W.; Su, J.G. Integrating LIDAR data and multispectral imagery for enhanced classification of rangeland vegetation: A meta analysis. Remote Sens. Environ. 2007, 111, 11–24. [Google Scholar] [CrossRef]
- Bovolo, F.; Bruzzone, L. The Time Variable in Data Fusion: A Change Detection Perspective. IEEE Geosci. Remote Sens. Mag. 2015, 3, 8–26. [Google Scholar] [CrossRef]
- Alcaras, E.; Parente, C.; Vallario, A. Automation of Pan-Sharpening Methods for Pléiades Images Using GIS Basic Functions. Remote Sens. 2021, 13, 1550. [Google Scholar] [CrossRef]
- Alcaras, E.; Della Corte, V.; Ferraioli, G.; Martellato, E.; Palumbo, P.; Parente, C.; Rotundi, A. Comparison of Different Pan-sharpening Methods applied to IKONOS Imagery. Geog. Tech. 2021, 16, 198–210. [Google Scholar] [CrossRef]
- Da Deppo, V.; Martellato, E.; Simioni, E.; Naletto, G.; Cremonese, G. Radiometric model for the stereo camera STC onboard the BepiColombo ESA mission. In Proceedings of the Modeling, Systems Engineering, and Project Management for Astronomy VII, Edinburgh, UK, 26 June–1 July 2016; Volume 9911, p. 99111T. [Google Scholar] [CrossRef]
- Cremonese, G.; Capaccioni, F.; Capria, M.T.; Doressoundiram, A.; Palumbo, P.; Vincendon, M.; Massironi, M.; Debei, S.; Zusi, M.; Altieri, F.; et al. SIMBIO-SYS: Scientific Cameras and Spectrometer for the BepiColombo Mission. Space Sci. Rev. 2020, 216, 75. [Google Scholar] [CrossRef]
- NASA/GSFC—Courtesy of Parkinson, C.L., Aqua Brochure, 2002, #NP-2002-1-422-GSFC. Available online: https://www.nasa.gov/pdf/151986main_Aqua_brochure.pdf (accessed on 18 September 2021).
- Stephens, G.L.; Vane, D.G.; Boain, R.J.; Mace, G.G.; Sassen, K.; Wang, Z.; Illingworth, A.J.; O’connor, E.J.; Rossow, W.B.; Durden, S.L.; et al. The Cloudsat mission and the A-Train: A new dimension of space-based observations of clouds and precipitation. Am. Meteorol. Soc. 2002, 83, 1771–1790. [Google Scholar] [CrossRef] [Green Version]
- NTRS-NASA Technical Reports Server, Science Requirements Document for OMI-EOS. 2000; 194p. Available online: https://ntrs.nasa.gov/citations/20010082524 (accessed on 18 September 2021).
- Italian Space Agency. COSMO-SkyMed Mission and Products Description, 2019, #ASI-CSM-PMG-NT-001, Rev. 3, 151p. Available online: https://www.asi.it/wp-content/uploads/2019/08/COSMO-SkyMed-Mission-and-Products-Description_rev3-2.pdf (accessed on 18 September 2021).
- Italian Space Agency. COSMO-SkyMed Seconda Generazione: System and Products Description, 2021, #CE-UOT-2021-002, 217p. Available online: https://www.asi.it/wp-content/uploads/2021/03/CSG-Mission-and-Products-Description-defpdf.pdf (accessed on 18 September 2021).
- JPSS Pr307ogram Office Website. Available online: https://www.nesdis.noaa.gov/about/our-offices/joint-polar-satellite-system-jpss-program-office (accessed on 18 September 2021).
- IASI Website. Available online: https://iasi.cnes.fr/en/IASI/index.htm (accessed on 18 September 2021).
- Sentinel Website. Available online: https://sentinel.esa.int/web/sentinel/home (accessed on 18 September 2021).
- Royal Netherlands Meteorological Institute. Algorith Theoretical Basis Document for the TROPOMI L01b Data Processor. 2019. #S5P-KNMI-L01B-0009-SD, 186p. Available online: https://sentinel.esa.int/documents/247904/2476257/Sentinel-5P-TROPOMI-Level-1B-ATBD (accessed on 18 September 2021).
- MAXAR. WorldView-1, MXR-DS-wv1 06/20. Available online: https://resources.maxar.com/data-sheets/worldview-1 (accessed on 18 September 2021).
- MAXAR. WorldView-3, MXR-DS-wv3 08/20. Available online: https://resources.maxar.com/data-sheets/worldview-3 (accessed on 18 September 2021).


| Small Satellite Class | Mass [kg] |
|---|---|
| Mini | 100 to 500 |
| Micro | 10 to 100 |
| Nano | 1 to 10 |
| Pico | 0.1 to 1 |
| Femto | <0.1 |
| Satellite Acronym | Satellite Name | Satellite Class | Satellite Description and Main Goals | Satellite Weight (kg) | Satellite Size | Orbit Altitude (km) | Payload | Telescope or Antenna Aperture Diameter (mm) | f/Number Focal Length | FoV/Beamwidth | Spatial Ground Resolution (m) | SNR | Swath Width | Spectral Range (µm) * /Frequency | Spectral Resolution | Polarimetric Capabilities | Revisiting Time | Constellation | Year * | Company (Country) | References |
|---|---|---|---|---|---|---|---|---|---|---|---|---|---|---|---|---|---|---|---|---|---|
| Capella X-SAR | Micro |
| <40 | - | 485–525 sun-synch | X-SAR/3 acquisition modes: SL: spotlight, SP: sliding spotlight, SM: StripMap | 8 m2 once deployed | - | - | SL: 0.5–0.7 m SP: 0.8–1.2 m SM: 1.6–2.4 m | SL: −14 to −10 dB SP: −17 to −14 dB SM: −20 to −16 dB | SL: 5 km × 5 km SP: 5 km × 10 km SM: 5 km × 20 km | X-band: 9.4–9.9 GHz | bandwidth of up to 500 MHz | yes: S (HH) | <1 week | Cappella is born as a constellation of 36 micro-satellites | 2018 | Capella Space Company (USA) | [43,56,57,58] | |
| DubaiSat-2 | Mini |
| ≤300 | 1.95 (height) × 1.5 m (diameter) | 600 sun-synch | HiRAIS (High Resolution Advanced Imaging System) | 420 mm | 5.7 m | - | <1 m PAN, <4 m MS @ 600 km altitude | - | 12 km @ nadir | PAN: 550–900 nm MS1-Blue: 450–520 nm MS2-Green: 520–590 nm MS3-Red: 630–690 nm MS4-NIR: 770–890 nm | - | no | <8 days | PanGeo constellation (9 satellites) in 2014 DubaiSat-2 worked in conjunction with Deimos-2 | 2013 (>5 years) | MBRSC/SI (Dubai, Korea) | [43,56] | |
| Flock Imaging Constellation | CubeSat |
| 5 | 3U | 370–475 (ISS orbit or sun-synch orbit) | Planet Scope/PS (3 generations of optical systems, PS0, PS1, PS2) | 90 | - | PS2: HFOV: 21.8 km VFOV: 14.5 km | 3–5 m @nadir (e.g.,: PS2: 3.3 m @ ISS altitude) | - | 21.8 km | PS2: Red: 630–714 nm Green: 515–610 nm Blue: 424–478 nm NIR: 70–900 nm | < 90 nm | no | <1 day | Constellation of initially 28 nano satellites: constellation replenished over time | 2014 (1 year per satellite in ISS orbit, or 2–3 years per satellite in sun-synch orbit) | Planet Labs (USA) | [43,56,59] | |
| HARP | Hyper-Angular Rainbow Polarimeter | CubeSat |
| 6 | 3U | 400 | Imaging Polarimeter | - | - | 94° cross-track 113° along-track | 2.5 km | - | ≥900 km | 440, 550, 670, 870 nm | - | yes | - | no | 2019 (>1 year) | NASA/ESTO (USA) | [43,56] |
| ICEYE | Micro |
| 85 | 70 cm × 60 cm | 560–700 sun-synch and ECT | X-SAR/3 acquisition modes: SM: strip mode, SP: spot mode, SC: scan mode | 3.2 m (along-track) × 0.4 m | - | - | ST: 3 m SP: 1 m SC: <15 m | ST: −22 to −21.5 dB SP: −18 to −15 dB SM: −22.2 to −21.5 dB | ST: 30 × 50 km SP: 5 × 5 km SC: 100 × 100 km | X-band: 9.65 GHz | bandwidth: 37.6–299 MHz | yes: S (VV) | 20 h mean revisit time at equator | 18 micro-satellites | 2018 | ICEYE Ltd. of Espoo (Finland) | [43,56,57,60] | |
| JASON–1 | Mini |
| 500 | 954 mm × 954 mm × 1000 mm | 1324 drift | Poseidon-2 (altimeter) JMR (microwave radiometer) DORIS (Doppler Orbitography and Radiopositioning) BlackJack (GPS flight receiver) | Poseidon-2: 1.2 m | - | JMR: beamwidth = 1.2° @ 18.7 GHz, 1.0° @ 23 GHz, 0.7° @ 34 GHz | - | Poseidon-2: Ku-band: 3.2 dB C-band: 0.9 dB | - | Poseidon-2: Ku-band, C-band JMR: 23.8 GHz, 34 GHz, 18.7 GHz | - | no | 9.9 days | Jason-1 works in conjunction with TOPEX/Poseidon and Jason-2 | 2001–2013 | CNES/NASA (France, USA) | [43,56] | |
| OSTM/JASON-2 | Ocean Surface Topography Mission/JASON-2 | Mini |
| 553 | 1 m × 1 m × 3.7 m | 1336 drift | Poseidon-3 (solid-state radar altimeter) AMR (Advanced Microwave Radiometer) DORIS (Doppler Orbitography and Radiopositioning Integrated by Satellite) TRSR-2/GPSP (Turbo Rogue Space Receiver-2) LRA (Laser Retroreflector Array) | Poseidon-3: 1.2 m | - | Poseidon-3: 1.28° (Ku-band), 3.4º (C-band) | - | Poseidon-3: 3.2 dB (Ku-band), 0.9 dB (C-band) | - | Poseidon-3: C-band: 5.3 GHz Ku-ban: (13.575 GHz | Poseidon-3: 320 MHz bandwidth | no | 10 days | Jason-2 works in conjunction with TOPEX/Poseidon and Jason-1 | 2008–2019 | NOAA/EUMETSAT (USA/Europe) | [43,56,61] |
| JASON-3 | Mini |
| 553 | 1 m × 1 m × 3.7 m | 1336 drift | Poseidon-3B (altimeter) AMR-2 (Advanced Microwave Radiometer) DORIS (Doppler Orbitography and Radiopositioning Integrated by Satellite) LRA (Laser Retroreflector Array) GPSP (Global Positioning System Payload) | Poseidon-3B: 1.2 m | - | Poseidon-3B: 1.28° (Ku-band), 3.4° (C-band) | - | Poseidon-3B: 3.2 dB (Ku-band), 0.9 dB (C-band) | - | Poseidon-3B: C-band: 5.3 GHz Ku-band: 13.575 GHz AMR: 18.7, 23.8 and 34 GHz | Poseidon-3B: 320 MHz bandwidth | no | 9.9 days | Jason-3 works in conjunction with Jason-1 and Jason-2; it belongs to the NOAA/EUMETSAT/CNES/NASA program for monitoring weather, climate, and the environment | 2016 | NOAA/EUMETSAT/CNES/NASA (USA/Europe) | [43,56,62] | |
| N2 | NigeriaSat-2 | Mini |
| 270 | - | 700 × 733 km sun-synch | VHRI (Very High-Resolution Imager) MRI (medium resolution imager) | VHRI: 385 | - | - | VHRI: PAN: 2.5 m MS: 5 m MRI: 32 m | - | VHRI: 20 km for 2.5 m & 5 m GSD MRI: 300 km for 32 m GSD | VHRI: PAN: 450–900 nm Blue: 450–520 nm Green: 520–600 nm Red: 630–690 nm NIR: 760–900 nm MRI: 4 spectral bands | VHRI: > 140 nm | no | 2 days | DMC-1G constellation | 2011–2018 | NASRDA/SSTL (Nigeria, UK) | [43,56] |
| NX | NigeriaSat-X | Micro |
| 87 | 0.6 m × 0.6 m × 0.6 m | 663 km × 700 km sun-synch | SLIM6 (Surrey Linear Imager Multispectral 6 channels, but 3 spectral bands) | - | - | 26.6° | 22 m @ nadir | >100 | >600 km (>300 km per channel) | Green: 520–620 nm Red: 630–690 nm NIR: 760–900 nm | <900 nm | no | 3–5 days | DMC-2G constellation | 2011 (5 years) | NASRDA/SSTL (Nigeria, UK) | [43,56] |
| NovaSAR-1 | Mini |
| 450 | - | 580 sun-synch | S-SAR/4 acquisition modes: SS: ScanSAR mode, MS: maritime surveillance mode, SM: StripMap, WS: ScanSAR Wide | 3×1 m2 | - | - | SS: 20 m MS: 30 m SM: 6 m WS: 30 m | SS: < −18 dB MS: < −12 dB SM: < −18.5 dB WS: < −19 dB | SS: 50–100 km MS: 750 km SM: 13–20 km WS: 55–140 km | S-band | - | yes: S, D, T (HH, VV, HV, VH) | Polar orbit: 0.9–4.4 days equatorial orbit: 0.5–1.3 days constellation: < 8 h | yes 3 satellites | 2018 (7 years) | SSTL/UKSA (UK) | [43,56,57,63] | |
| PARASOL | Polarization andAnisotropy of Reflectances for Atmospheric Science coupled with Observations from a Lidar | Micro |
| 120 | 60 cm × 60 cm × 80 cm | 705 sun-synch | POLDER-3 (radiometer/ polarimeter | - | - | ±43° to ±57° | 6 km × 7 km at nadir | 200 | 2400 km | 9 wavelengths, with 3 polarizations at 3 wavelengths in the 443–1020 nm range: 443.5 ± 6.7 nm 490.9 ± 8.2 nm 563.8 ± 7.7 nm 669.9 ± 75.6 nm 762.9 ± 5.5 nm 762.7 ± 19.1 nm 863.7 ± 16.9 nm 907.1 ± 10.6 nm 1019.6 ± 8.6 nm | - | yes: T | 2 days | A-train constellation | 2004–2013 | CNES (France) | [43,56,64] |
| PICASSO | Pico-Satellite for Atmospheric and Space Science Observations | Pico |
| 3.8 | 3U | 530 | VISION (Visible Spectral Imager for Occultation and Nightglow) SLP (sweeping Langmuir probe) | - | - | VISION: 2.5° | vertical res = 2 km | - | - | VISION: 430–800 nm | FWHM <10 nm | no | 2–3 weeks | no | 2020 (29 months) | BISA, VTT, Clyde Space (Belgium, Finland, UK) | [43,56] |
| RainCube | Radar in a CubeSat | CubeSat |
| 5.5 | 6U | 400 | miniKaAR-C (miniaturized Ka-band Atmospheric Radar for CubeSats) KaRPDA (Ka-band radar parabolic deployable antenna) | KaRPDA: 0.5 m deployable | - | - | Horizontal: 7.9 km Vertical: 120 m | - | - | Ka-Band: 35.75 GHz | - | no | - | yes | 2018–2020 | NASA ESTO (USA) | [43,56,65] |
| RapidEye | Micro |
| 156 | 0.78 m × 0.938 m × 1.17 m | 620 sun-synch | MSI (Multi-Spectral Imager) | 145 mm | f/4.3 633 mm | ± 6.75° @ nadir | 6.5 m @ nadir | 50–250 | > 70 km @ 620 km altitude | 5 bands in the 400–850 nm range: 440–510 nm 520–590 nm 630–685 nm 690–730 nm 760–850 nm | - | no | < 1 day @ off-nadir 5.5 days @ nadir | 5 satellites | 2008–2020 | RapidEye AG (Germany) then acquired in 2015 by Planet Labs (USA) | [43,56,63,66] | |
| RAVAN | Radiometer Assessment usingVertically Aligned Nanotubes | CubeSat |
| <5 | 3U | 617 syn synch | 4 RAVAN radiometers: 2 VACNT (vertically aligned carbon nanotube) adsorbers + 2 black-painted cavity absorbers | - | - | 130° | - | - | - | PTOT Primary (VACNT) Total channel: UV–far IR PSW Primary (VACNT) SW channel: UV–5.5 m STOT Secondary (cavity) Total channel: UV–far IR SSW Secondary (cavity) SW channel: UV–5.5 m | - | no | ≤ 3 days | No technology demonstration for the ERB constellation | 2016 (20 months) | NASA’s ESTO (USA) | [43,56] |
| SeaHawk-1 | CubeSat |
| 5 | 3U | 575 | HawkEye Ocean Color Sensor | - | - | ± 11.3° | 120 m | 150–490 | 250 × 400 km | 8 SeaWiFS bands: 412 nm, 443 nm, 490 nm, 510 nm, 555 nm, 670 nm, 750.9 nm, 865 nm | 14.7–40 nm | no | 9 days | Socon Constellation | 2018 (18–24 months) | UNCW (USA) | [43,56] | |
| SkySat constellation | Generation A: SkySat-1 Generation B: SkySat-2 Generation C: SkySat-3 to 21 | Micro |
| G-A: 83G-C: 110 | G-A: 60 cm × 60 cm × 80 cm G-C: 60 cm × 60 cm × 95 cm | Skysat 1–2: 600 km, sun-synch Skysat 3–15: 500 km at launch, lowered to 450 km in early 2020, sun-synch Skysat 16–18: 400 km inclined, non- sun-synch | SkySat camera: mono- and stere-imaging, and video acquisition modes | SkySat-C: 350 mm | f/10.3 3.6 m | 2.0 km × 1.1 km | SkySat-1–2: PAN: 0.86 m MS: 1 m SkySat-3–15: PAN: 0.65 m MS: 0.81 m SkySat-16–21: PAN: 0.57 m MS: 0.75 m | - | SkySat-1–2: 8 km SkySat-3–15: 5.9 km SkySat-16–21: 5.5 km | PAN: 450–900 nm Blue: 450–515 nm Green: 515–595 nm Red: 605–695 nm NIR: 740–900 nm | - | no | Constellation: sub-daily, 6–7 times at worldwide average, 12 times max Satellites: 4–5 days (reference altitude: 500 km) | Constellation replenished over time (21 satellites in 2021) | 2013 (>4–6 years) | Skybox Imaging, then renamed as Terra Bella in 2016 (USA) | [43,56] |
| TecSAR | SAR Technology Demonstration Satellite | Mini |
| 260 | - | 403 km × 581 km | X-SAR (X-band Synthetic Aperture Radar)/4 acquisition modes: WS: wide coverage ScanSAR, SM: StripMap, SS: Super StripMap, SL: spotlight | 3 m | - | - | WS: 8m SM: 3 m SS: 1.8 m SL: <1 m | >200 | <100 km | X band: 9.59 GHz | - | yes: HH, HV, VH, VV | 3–4 days | no | 2008 (>5 years) | Israel’s MoD (Israel) | [43,56,57] |
| TEMPEST-D | Temporal Experiment for Storms and Tropical Systems Technology—Demonstration | CubeSat |
| 3.8 | 6U | 410 | MM Radiometer (millimeter-wave radiometer) | - | - | - | from 12.5 km @ 181 GHz to 25 km @ 87 GHz | NEΔT: 0.20 K @ 89 GHz 0.35 K @ 165 GHz 0.55 K @ 176 GHz 0.55 K @ 180 GHz 0.75 K @ 182 GHz | 825 km | 5 frequencies: 89 GHz, 165 GHz, 176 GHz, 180 GHz, and 182 GHz | bandwidth requirements: 4 ± 1 GHz @ center frequencies of 89 and 165 GHz 2 ± 0.5 GHz @ 176, 180, and 182 GHz center frequencies | yes: Quasi-H or Quasi-V Pol | 3–5 min for up to 30 min | Demonstrative CubeSat for the future TEMPEST constellation | 2018 (90 days after on-orbit commissioning) | Colorado State University/NASA (USA) | [43,56,67] |
| TROPICS | Time-Resolved Observations of Precipitation structure and storm Intensity with a Constellation of SmallSats | CubeSat |
| 6 | 3U | 600 (550 ± 50 km tolerance) sun-synch | TROPICS radiometer: W-band: 92 GHz F-band (7 channels): 114–119 GHz G-band (4 channels): 183–204 GHz | - | - | - | W-band (90GHz): 29.6 km @ nadir, 50.7 km @ EAS (Effective Across Scan) F-band (118 GHz): 24.1 km @ nadir, 41.2 km @ EAS G-band (183 GHz): 16.1 km @ nadir, 27.5 @ EAS G-band (205 GHz): 15.2 km @ nadir, 26.0 @ EAS | NEΔT: 2.0 K @ 90 GHz 1.5 K @ ~110–120 GHz 1.0 K @ ~180–200 GHz | 2000 km | Ch1: 91.655 GHz Ch2: 114.50 GHz Ch3: 115.95 GHz Ch4: 116.65 GHz Ch5: 117.25 GHz Ch6: 117.80 GHz Ch7: 118.24 GHz Ch8: 118.58 GHz Ch9: 184.41 GHz Ch10: 186.51 GHz Ch11: 190.31 GHz Ch12: 204.80 GHz | bandwidth: ~300–2000 MHz | no | 30 min | 6 satellites TROPICS | 2021 (9 years): Pathfinder 2022 (9 Years): Constellation | MIT/Lincoln Labs, NASA (USA) | [43,56] |
| ZACUBE-2 | CubeSat |
| 4 | 3U | 480 km × 508 km | K-line camera (medium resolution CMOS imager) VHF AIS/VDE receiver | - | - | K-line camera: 7.8° × 6.2° | K-line camera: 53 m | - | K-line camera: 68 km | K-line camera: 770 nm | K-line camera: 1 nm bandwidth VHF AIS/VDE: extended VDES bands from 156.75 MHz to 162.05 MHz | VHF AIS/VDE: yes (linear) | - | Yes: MDASat-1 constellation | 2018 | Cape Peninsula University of Technology (South Africa) | [43,56] |
| ID | Scientific Area | Goals | State-of-the-Art | What We Need |
|---|---|---|---|---|
| A1 | Composition of the atmosphere (SO2) | Continuous monitoring of traces gases, e.g., SO2, from natural (volcanic) and anthropogenic (traffic, industry) sources | Large satellites (e.g., ESA Sentinel, NOAA/NASA POESS, or EUMESAT MetOp programs) and recently small satellites (e.g., PARASOL, HARP, and MIOSat) were inserted into polar and geostationary orbits to monitor the atmosphere |
|
| A2 | Polynyas monitoring in polar areas | High resolution continuous monitoring of polynyas dynamics to study the evolution of the seasonal ice production | MODIS onboard Aqua EOS has a short revisiting time, but a low spatial resolution (1 km) | A short revisiting time provided by a constellation is associated with higher resolution to investigate the small-scale variability that characterizes the ice-water border |
| A3 | Coastal area monitoring | Ocean color, sea surface temperature monitoring, and the sea state and altimetry | Available data are not at resolutions of space and time needed to have a comprehensive monitoring of the dynamics and variability of coastal natural phenomena | Monitor narrower regions, allowing the acquisition of data at higher spatial resolution (few hundred meters), in various spectral ranges, on a daily basis, allowing for instance to track the evolution of pollutant spillage |
| A4 | P. oceanica monitoring | Before a gradual regression over the whole Mediterranean basin, an update of the dynamics and extension/distribution variation is needed | Instruments onboard large or medium sized satellites (e.g., QuickBird, WorldView, and Ikonos-2) have high spectral and spatial resolution for mapping the meadows, but long revisiting times |
|
| A5 | Precipitations in the Mediterranean basin | The Mediterranean basin is a hot-spot: measuring vertical precipitation profiles in this area can be of essential relevance for capturing the entire development process of a thunderstorm clouds and, therefore, to reduce their impacts | In many regions, such as the Mediterranean basin, precipitation surveillance networks are still incomplete and inadequate: available data consist of rain-gauges punctual measurements, or ground-based weather radar, and very few satellite missions (e.g., TRMM) | Data with spatial and temporal resolutions good enough for a continuous and real-time characterization of fast-changing vertical structure of convective cells originated during extreme rainfall in the Mediterranean region |
| A6 | Sea state from the vessel motions analysis |
| SAR imaging (e.g., Sentinel-1, TerraSAR-X) to accurately estimate the wave parameters such as height, average length, and direction |
|
| A7 | EO for vessel detection | All-day and all-weather capabilities, large area coverage, dense revisit time, fine spatial resolution details are key assets to generate added-value products to be delivered to end-users (e.g., policymakers, local authorities) | SAR observation of vessels is a well-established and mature application | The possibility of having a constellation of platforms with a very short revisiting time (2–3 h) VHR images at lower costs |
| 0 | 1 | 2 | 3 | 4 | 5 | 6 | 7 | 8 | 9 |
|---|---|---|---|---|---|---|---|---|---|
| ID | Scientific Area | Albedo | Measure Kind | Spectral Range (µm When Not Explicitly Written) | Minimum Ground Resolution (m/pix) | Maximum Integration Time (ms) | Requested SNR | Model SNR a | Optimal Ground Resolution (m/pix) b |
| A1 | Composition of the atmosphere: SO2 and NO2 | 0.43 | spectral measures in UV–VIS–IR | 0.308 (SO2) | 100 | 10.13 | 50–100 | 47 | 200 |
| 0.434 (NO2) | >few hundreds | 20 | |||||||
| A2 | Polynyas monitoring in polar areas | 0.75 | 2 spectral bands in SWIR | 1.075–1.125 | <10–150 * | 50.65 | 100 | >few hundreds | 5 |
| 1.175–1.225 | 50 | ||||||||
| A3 | Coastal area monitoring: ocean color | 0.10 | 12 spectral bands in VIS–NIR (0.4–1.0 µm) | 0.400–0.450 | 30–100 * | 3.04 | >few hundreds | >few hundreds | 30 ** |
| 0.450–0.500 0.500–0.550 0.550–0.600 0.600–0.650 | 25 | ||||||||
| 0.650–0.700 0.700–0.750 0.750–0.800 0.800–0.850 0.850–0.900 0.900–0.950 0.950–1.000 | 15 | ||||||||
| 0.10 | 12 spectral bands in SWIR (0.9–2.5 µm) | 1.000–1.125 | 30–100 ** | 3.04 | >100–200 | >few hundreds | 10 | ||
| 1.125–1.250 1.250–1.375 1.375–1.500 1.500–1.625 1.625–1.750 1.750–1.875 1.875–2.000 | ~35 ÷ 60 | 60 | |||||||
| 2.000–2.125 2.125–2.250 2.250–2.375 2.375–2.500 | ~30 ÷ 35 | 80 | |||||||
| Coastal area monitoring: ocean altimetry | - | radiometer | Ku-band C-band | 50–100 ** | - | <20 | - | - | |
| A4 | P. oceanica monitoring | 0.1 | 1 panchromatic filter | 0.450–0.800 | 1 | 0.10 | 100 | 22 | 3 |
| 8 spectral bands | 0.400–0.450 0.450–0.510 0.510–0.580 0.585–0.625 0.630–0.690 0.705–0.745 0.770–0.895 0.860–1.040 | 2 | 0.20 | 100 | ~20 ÷ 40 | 6 | |||
| A5 | Precipitations in the Mediterranean basin | - | Punctual | Ka-band (35.75 GHz) | Hor. Res.: <5000 Vert. Res.: <250 | - | 20 dBZ | - | |
| A6 c | Sea state from the vessel motions analysis | - | Single-pol either VV or HH | X- or C-band | <10 | ≈0.5 s (standard for SAR | Better than −20 dB | - | 5 |
| A7 | EO for vessel detection | - | Single-pol (HH)/dual-pol (HH + HV)− | X- or C-band | <10 | ≈0.5 s (standard for SAR | −20 dB | - | <5 |
Publisher’s Note: MDPI stays neutral with regard to jurisdictional claims in published maps and institutional affiliations. |
© 2022 by the authors. Licensee MDPI, Basel, Switzerland. This article is an open access article distributed under the terms and conditions of the Creative Commons Attribution (CC BY) license (https://creativecommons.org/licenses/by/4.0/).
Share and Cite
Martellato, E.; Piccirillo, A.M.; Ferraioli, G.; Rotundi, A.; Della Corte, V.; Palumbo, P.; Alcaras, E.; Appolloni, L.; Aulicino, G.; Bertini, I.; et al. A New Orbiting Deployable System for Small Satellite Observations for Ecology and Earth Observation. Remote Sens. 2022, 14, 2066. https://doi.org/10.3390/rs14092066
Martellato E, Piccirillo AM, Ferraioli G, Rotundi A, Della Corte V, Palumbo P, Alcaras E, Appolloni L, Aulicino G, Bertini I, et al. A New Orbiting Deployable System for Small Satellite Observations for Ecology and Earth Observation. Remote Sensing. 2022; 14(9):2066. https://doi.org/10.3390/rs14092066
Chicago/Turabian StyleMartellato, Elena, Alice Maria Piccirillo, Giampaolo Ferraioli, Alessandra Rotundi, Vincenzo Della Corte, Pasquale Palumbo, Emanuele Alcaras, Luca Appolloni, Giuseppe Aulicino, Ivano Bertini, and et al. 2022. "A New Orbiting Deployable System for Small Satellite Observations for Ecology and Earth Observation" Remote Sensing 14, no. 9: 2066. https://doi.org/10.3390/rs14092066
APA StyleMartellato, E., Piccirillo, A. M., Ferraioli, G., Rotundi, A., Della Corte, V., Palumbo, P., Alcaras, E., Appolloni, L., Aulicino, G., Bertini, I., Capozzi, V., Catucci, E., Dionnet, Z., Di Palma, P., Esposito, F., Ferrentino, E., Innac, A., Inno, L., Pennino, S., ... Zambianchi, E. (2022). A New Orbiting Deployable System for Small Satellite Observations for Ecology and Earth Observation. Remote Sensing, 14(9), 2066. https://doi.org/10.3390/rs14092066