Article

Contribution of Hot-Spot Zone in Decarburization of BOF Steel-Making: Fundamental Analysis Based upon the FactSage-Macro Program

by
Prasenjit Singha
* and
Ajay Kumar Shukla
Department of Metallurgical and Materials Engineering, Indian Institute of Technology Madras, Chennai 600036, Tamil Nadu, India
*
Author to whom correspondence should be addressed.
Metals 2022, 12(4), 638; https://doi.org/10.3390/met12040638
Submission received: 31 December 2021 / Revised: 4 March 2022 / Accepted: 7 March 2022 / Published: 7 April 2022
(This article belongs to the Special Issue Oxygen Steelmaking Process)

Abstract

:
An improved computational model to describe the decarburization process in basic oxygen furnaces for steel making is presented in this work. A dynamic model was thus developed to calculate the decarburization rate and its breakup as a contribution coming from the hot-spot zone (under jet impact) and emulsion zone (by droplet and slag reactions). In this work, multiple interconnected equilibrium/adiabatic stoichiometric-reactor-based approaches are used to describe the overall basic oxygen steel-making process. The macroprogramming facility of FactSage™ software was used to understand the thermodynamics and kinetics of basic oxygen steel-making processes. The temperature, compositions, and volumes of various phases are estimated with the use of this model. Hot-spot temperatures in the range from 2000 to 3000 °C as a benchmark was considered for calculations. The major contribution of decarburization was established to come from hot-spot reactions in the major part of the blow, except in the last part when emulsion phase reactions govern it. This development represents an original contribution to our understanding of the BOF steel-making process.

1. Introduction

Although the basic oxygen steel-making process involves multiphase reactions, the decarburization process dominates the overall refining process [1,2]. To better control the refining process, a more detailed understanding of the decarburization reaction helps to control the process parameters and increase productivity. Several dynamic models [2,3,4,5,6,7,8] were developed to understand the decarburization process in basic oxygen steel-making furnaces. Sarkar et al. [4] demonstrated that decarburization reactions take place only at the emulsion zone followed by the impact zone by considering the three interconnected tanks as reactors. They proposed that the dissolution of carbon takes place in metal–gas droplets and FeO. They assumed that the temperature increased linearly during the blow. Knoop et al. [6] predicted that FeO reduction occurred by the carbon in the emulsion zone, and FeO formed at the impact zone reacting with jet oxygen. In [9,10,11], the authors reported the kinetics of decarburization. However, these studies were conducted at a laboratory scale with limited process parameters. Hence, it is difficult to compare laboratory experiments with real basic oxygen steel-making processes for decarburization. B. K Rout et al. [12] simulated basic oxygen steel-making processes using three reaction zones: the impact, slag–bulk metal, and slag–metal–gas emulsion zones. B.K. Rout et al. [12] reported the effect of recirculating metal droplets on the entire refining process and rate for single droplets in the emulsion zone. Other authors [13,14] later extended the previous model [12]. They calculated that 76% decarburization occurred in the emulsion zone, and 24% decarburization took place in the impact zone, which is in close agreement with the industry data. Combined experimental and computational studies [15,16,17,18,19,20,21,22,23] presented the mechanism and kinetics of the decarburization process based on Fe–C droplets involving mixtures of CO2 and O2 or CO/O2/H2O gases. R.J. Fruehan et al. [15] introduced the carbon reaction rate with CO2, H2O gases, and FeO in slag. R.J. Fruehan and L.J. Martonik [16] illustrated the decarburization reaction of liquid iron with CO–CO2 mixtures and hydrogen gases at 1800 K and reported the decarburization controlled primarily by the diffusion of the gas–metal boundary at high carbon content in liquid metal, and by carbon diffusion in the metal phases at below the critical limit of carbon. Simento et al. [17] reported that the decarburization rate of Fe–C droplets involving mixtures of CO2 and O2 is limited by the enrapture of CO2 and O2 in the gas phase. Most previous investigations [24,25,26,27] of the decarburization of Fe–C droplets using CO2 as oxidant found that the mass transfer of carbon is the rate-controlling step in the liquid phase below a critical carbon content in the melt. Several studies [28,29,30,31,32] introduced the kinetic refining of basic oxygen steel-making processes, and evaluated metal, slag, and gas compositions and temperature. However, these works are not available in the open literature and are used only for internal research in steel plants. Dogan et al. [33] distinguished decarburization between impact and emulsion zones incorporating flux and scrap dissolution, and showed that 45% decarburization occurred in the emulsion zone, and 55% decarburization took place in the impact zone during the main blow. Dogan et al. [34] extended the effects of bloating behavior through emulsified droplets on the overall decarburization process and lance height, bottom stirring, and CO and CO2 effects on decarburization behaviors in the impact zone. Dogan et al. [35] reported that 40% decarburization occurred in the impact zone during the main blow time, sulfur had a retarding effect on the decarburization reaction when CO2 was used as an oxidizing gas, and an initial 2 min of blowing was unable to predict decarburization in the emulsion and impact zones. The insufficient decarburization rate proposed by the Dogan model [34] during the final blowing periods was due to the low prediction of refining rate by emulsion zone. Recently, J. Biswas et al. [36] developed a model for decarburization on the basis of Fe–C–S droplets with oxidizing slag. The decarburization prediction of J. Biswas et al. [36] is in good agreement with experimental results for initial and middle blowing time. However, they were unable to capture the decarburization rate in the final blowing time. Kozakevitch et al. [37], and Meyer et al. [38] demonstrated that most of the decarburization reaction occurs in the emulsion phase. In contrast, Okano et al. [39], and Price [40] claimed that the majority of decarburization reactions take place at the impact zone. Accordingly, the present study introduces the issue of the proportion of the decarburization reaction in different zones of the process. In the BOF process, Chatterjee et al. [41] reported that Fe–C droplets account for 35% to 40% decarburization of total decarburization. Other studies [13,14,35,37,38,39,40,41] reported that the contribution of decarburization comes less or more from hot-spot and emulsion zones. None of them described the contribution of decarburization from hot-spot zones to emulsion zones with the slag compositions and temperature of hot-spot and emulsion zones. Many studies considered indirect decarburization (emulsion zone) to be a major contribution to overall decarburization; however, very few acknowledged hot-spot contribution as the dominating one. The hot-spot temperature in the BOF process is in the range from 2000 to 2500 ℃, and it was measured a long time ago. Koch et al. [42] reported variations in hot-spot temperature with top oxygen blowing time when the melt weight was 40 kg and oxygen supply rate was 164, 197, 283, and 369 L/min for decarburization. However, Koch et al. [42] reported that hot-spot temperature increases with increasing oxygen flow rate, but could only be measured during the 20% and 80% of total blowing time, and beyond 80% of the total processing time, it is not possible to measure it. Nakamura et al. [43] also reported that hot-spot temperature could not be observed during the last period of the decarburization period. Kawakami et al. [44] agreed with the behavior of hot-spot temperature as predicted by Nakamura et al. [43].
In this present work, considering all the above considerations, a dynamic control model was developed that could account for such interconnected phenomena and the thermochemical behavior of various reactions, which are required to better understand the decarburization process. The aim of the present work is to acquire better knowledge on the contribution of the decarburization rates at the impact and emulsion zones, and the metal bath throughout the blow in terms of transient temperature and volumes of liquid steel and slag involving a multireactor-model-based approach involving thermodynamics and kinetics of reactions using the FactSage macroprogram to understand the role of the impact zone, emulsion, and the bulk metal bath in the overall decarburization process.

2. Methodology

The total BOF process was divided into four adiabatic stoichiometric reactors. Two bulk chambers, namely, 1 and 2, and two free energy minimizers, namely, 3 and 4, were considered in the present model, as shown in Figure 1. The free energy minimization principle, with the use of FactSage 7.3 software [45] (CRCT, Montreal, QC, Canada), was used for all computations in the various reactors involving their inputs. The overall heat and mass balance was established at the end of the calculation. The FToxid, FTmisc, and FactPS databases were selected for the calculation. FToxid, FTmisc, and FactPS solution and compound databases represent data for oxide solutions, liquid alloys, and pure substances, respectively. The Equilib module and macroprogram of FactSage software were used to calculate thermodynamics and kinetics, respectively. In the present study, the kinetics was considered to be governed by mass transfer limitations that are related to the mixing of the system, which depends upon the rate of energy input to the system by means of top blowing, decarburization reactions, and bottom stirring flow rates. The appropriate mathematical expressions were used in the program, as explained in earlier work by Shukla et al. [46,47]. Various reaction zones defining slag–metal, metal–gas, and slag–gas interfacial reactions were considered. The linear model for lime, scrap, and dolomite dissolution was considered for slag formation, and the appropriate values of heat losses were also considered in the current model to simulate the basic oxygen steel-making furnace operation.

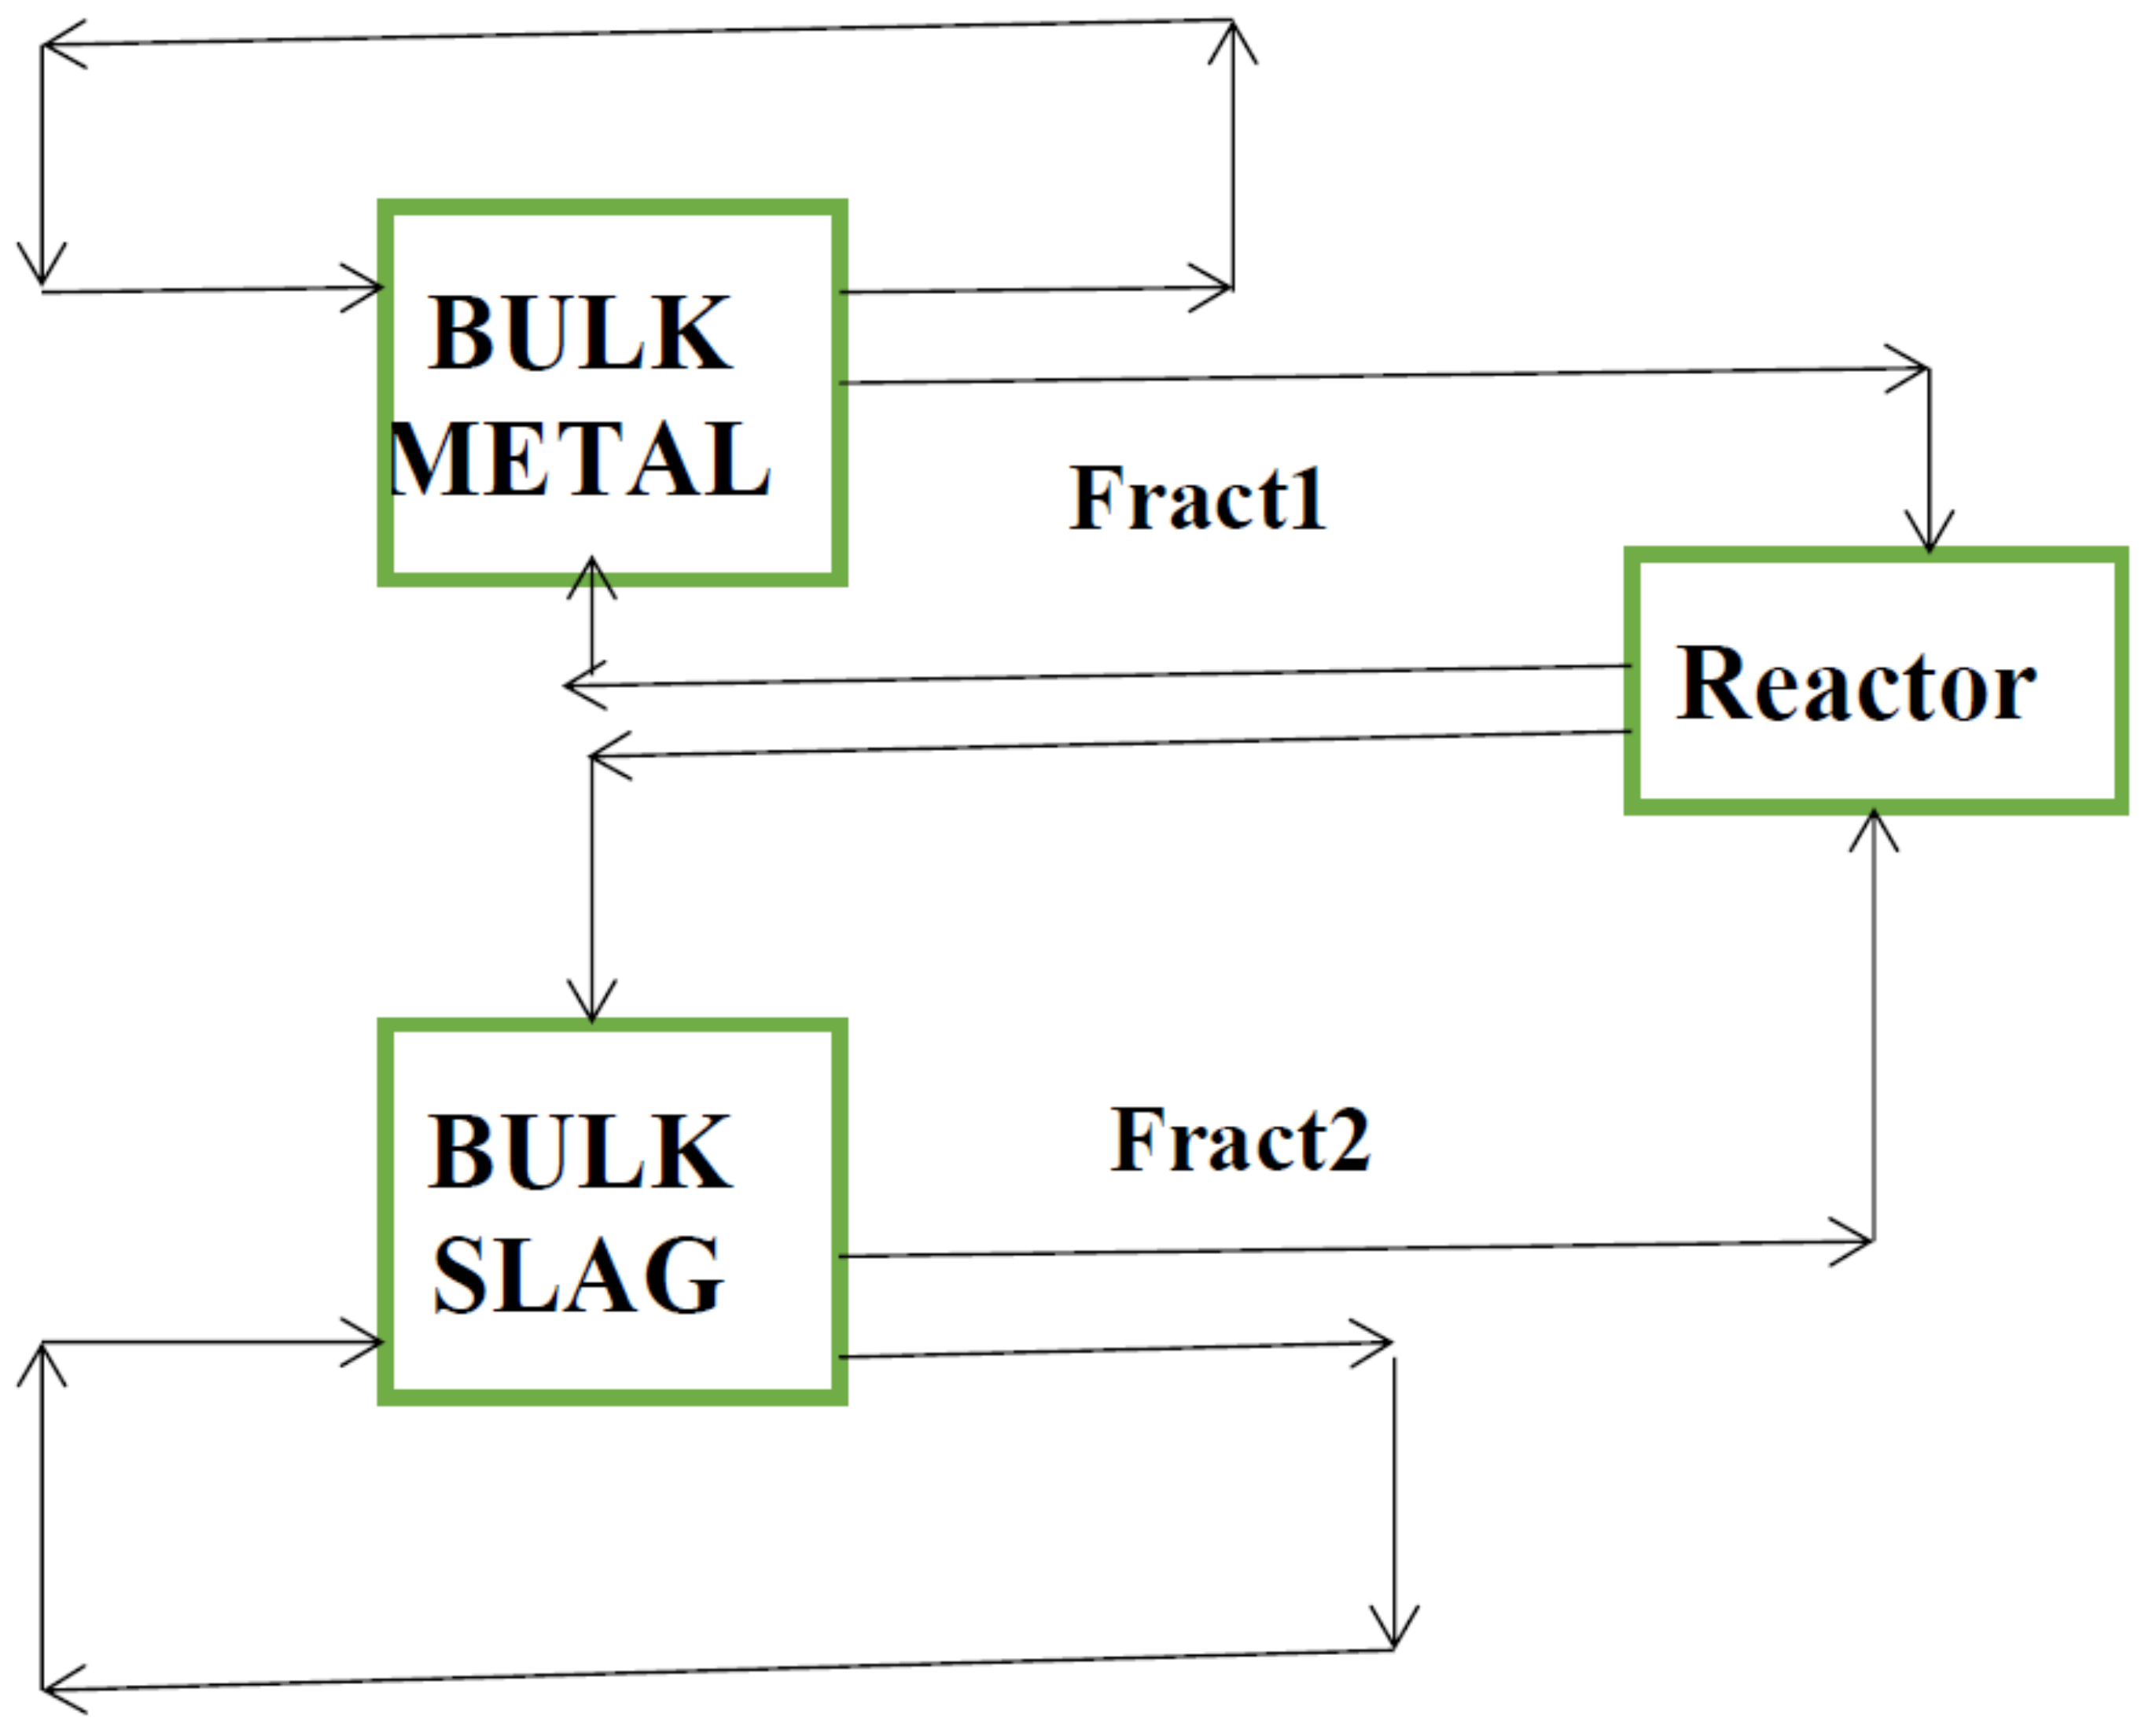
2.1. Model Description

The process was divided into time steps of one minute. There was circulation and exchange of reactants and products across the interconnected reactors at every time step, as represented in Figure 1. The fractions of reactants supplied to reactors from bulk metal and bulk slag are calculated by kinetic considerations, which are the function of mixing energy supplied to the system by the top lance, decarburization reactions, and bottom stirring. Reactor 1 represents a metal bulk mix bath where hot metal and scrap are charged as Streams 5 and 6, respectively, accounts for the scrap dissolution at every time step, and exchanges liquid metal with Reactors 3 and 4. Reactor 2 represents a slag bulk mix bath where slag (Stream 7), lime (Stream 8), dolomite (Stream 9), and iron ore (Stream 10) are charged, and it accounts for lime and dolomite dissolution, and a reduction in iron ore. Reactor 3 represents the hot-spot or gas–metal reaction zone in which a fraction of liquid metal (Stream 15) is fed from Reactor 1, and a fraction of O2 (Stream 17) from the oxygen reservoir. Carbon, silicon, manganese, and phosphorus oxidation takes place here. After the reaction, the refined metal (Stream 13) comes back to Reactor 1, liquid slag (Stream 14) to Reactor 2, and produces CO and CO2 gases (Stream 16) to Reactor 4. The circulation stream from the metal bath (Stream 15) and oxygen (Stream 17) supplement fresh metal at every time step in the metal–gas reactor. This reactor shares the interface with Reactors 1 (metal bulk bath) and 2 (slag bulk bath). Reactor 4 contains the emulsion or gas–metal–slag reaction zone in which a fraction of liquid metal (Stream 11) is fed from Reactor 1, a fraction of slag (Stream 12) is fed from Reactor 2, and gases (Stream 16) from Reactor 3. This is also known as free energy minimization (FEM 2). In this reactor, simultaneous oxidation–reduction occurs at the metal–gas, metal–slag, and slag–gas interfaces. After the reaction, the refined liquid metal (Stream 20) comes back to metal bulk Reactor 1, liquid slag (Stream 21) to slag bulk Reactor 2, and produced gases (Stream 18) go out as top gases. This reactor shares the interface with Reactors 1 (metal bulk bath) and 2 (slag bulk bath). The produced gas (Reactor 1) goes to Reactor 4.
Accounted reactions for the model are as follows [48,49]:
[O2] = 2[O]
[Si] + 2[O] = (SiO2)
  G O = 936,379 + 192.8   T   J / mole  
C + [ O ] = { CO }  
  G O = 111,700 87.65   T   J / mole  
Fe + [ O ] = ( FeO )  
  G O = 225,500 41.3   T   J / mole  
[ S i ] + 2 ( FeO ) = ( SiO 2 ) + 2   [ Fe ]  
  G O = 501,500 + 120.2   T   J / mole  
[C] + (FeO) = {CO} + [Fe]
  G O = 115,000 98.18 T   J / mole  
(FeO) + {CO} = [Fe] + {CO2}
  G O = 11,010 + 17.69   T   J / mole  
Figure 1. Flowsheet of multiple-reactor-based BOF steel-making process.
Metals 12 00638 g001

2.2. Mass Transfer Coefficient and Decarburization Calculation

Mass transfer coefficients are the function of mixing energy rate to the system, the effect coming from top oxygen supply, bottom stirring system, and decarburization rates. The mass transfer effect can be defined as the fraction of reacting phases at each time step. The following mathematical interpretations were used to calculate the mass transfer coefficient. Total energy [46,47] input to the basic oxygen steel-making converter was calculated by the integrated impact of the top lance and bottom gas stirring system, and decarburization energy.
E T o p 0 = 6.32 × 10 7 C o s   θ   M   Q o 3 W   X   n 2 d 3
E b 0 = 6.18 Q b T a v g W l n 1 + ρ g H P a t m + 1 T 0 T a v g  
Q d e c a r b = d C d t 22.4 × 60 × 10 6 12  
E d e c a r b 0 = 6.18 Q d e c a r b T a v g W l n 1 + ρ g H h f r a c P a t m + 1 T 0 T a v g  
E T o p 0 +   E B o t t o m 0 +   E d e c a r b 0   = t o t a l   i n p u t   e n e r g y = E t o t a l 0  
α = i n i a l p h a   E t o t a l O 8000 0.5  
β = i n i b e t a E t o t a l O 8000 0.5  
δ = i n i g a m m a E t o t a l O 8000 0.5  
where Ɵ is the angle of the lance tip from vertical, Qo is the oxygen flow rate (nm3/min), W is the weight of steel (ton), n is the number of openings of the lance, X is the lance height above the metal bath while blowing (m), H is the metal bath depth (m), hfrac is the average depth fraction at which CO bubble formation takes place (m), d is the throat diameter (m), T0 is the temperature of the bottom stirring gas at an input (℃), d C d t is the decarburization rate (tons/min), N is the number of openings of the lance, ρ is the density of steel (kg/m3), g is gravity (m/s2), P a t m is the atmospheric pressure (bar), T a v g is the average temperature of liquid steel (℃), and E t o t a l 0 is the total input energy (W/ton).
α, β, and δ are metal fractions going to the hot-spot and the emulsion reactors, and the fraction of slag going to the emulsion reactor, respectively. This depends on the mixing energy rate (   E t o t a l 0 ) due to the effects coming from the top lance, decarburization reactions, and bottom stirring [46,47]. The detailed calculation of   E t o t a l 0 is given in Appendix A. The relationships of α, β, and δ are explained in Appendix B on the basis of a multicomponent mixed transport coupled reaction theory model as suggested by Deo and Robertson [50].
Calculations were performed for different inialpha values from 0.01 to 0.1, representing the lower to higher fractions of a metal bath going to the hot-spot reactor at each step. The values of other fraction coefficients such as inibeta and inigama were constant (0.4 and 0.2, respectively) for the entire simulation.
Total decarburization rates were calculated as follows:
Total decarburization rate = (initial wt % carbon in metal bath × total wt of initial liquid metal – wt % carbon in ith step × total wt of initial liquid metal in ith step).
Decarburization rate (hot-spot zone) = (wt % carbon at initial in FEM1 × total wt of initial liquid metal in FEM 1 × alpha (α) – wt % carbon at the ith step in FEM1) × total wt metal at the ith step in FRM 1).
Decarburization rate (emulsion zone) = (initial wt % carbon at in FEM 2 × total wt of initial liquid metal in FEM 2 × beta (β) – wt % carbon in the ith step × total wt of initial liquid metal in the ith step).
Decarburization rate (metal bath) = total decarburization rate − decarburization rate (hot-spot zone) − decarburization rate (emulsion zone).

2.3. Model assumptions

  • We entered 5,488,000 kcal heat into the model for thermal heat balance. It was assumed that 274,400 kcal/min heat was lost through conduction via refractory lining and lance system, and radiation via converter mouth [51].
  • Hot metal = 145,000 kg, with charging complete in 1 min (Stream 5); scrap = 12,000 kg, charged incessantly in 20 min at a constant rate (Stream 6); lime = 10,000 kg, charged incessantly in 20 min at a constant rate (Stream 8); dolomite = 3000 kg, charged incessantly in 20 min at a constant rate (stream 9); oxygen = 9000 nm3, charged incessantly in 20 min at a constant rate (stream 17). Total blowing time taken for modelling is around 20 min with a time step of 1 min.
  • All reactions are at equilibrium at the gas–metal slag–metal interfaces, and reactions both in metal and slag phases are mass-transfer-controlled.
  • Flux and scrap dissolution take place linearly with blowing time.
  • Alpha (α), beta (β), and delta (δ) values were chosen so that there was reasonable agreement between model results and actual plant observations.

3. Results

Calculations were performed using FactSage macroprogramming on the basis of the input parameters (Table 1), and model predictions in terms of decarburization were compared with real industrial BOF (145-ton BOF converter) operation.

3.1. Decarburization Rate Evolution

The predicted overall decarburization rates in the metal bath, emulsion zone, hot-spot zone, and in the metal bath for a blowing period of 20 min for inialpha values 0.01, 0.02, 0.04, 0.06, 0.08, and 0.1 are presented in Figure 2, which shows that the total decarburization rate during the initial 1–4 min of blowing was lesser (0.143 tons/min) because oxygen was reacting with other elements such as silicon. During the middle 5–15 min of blowing period, the decarburization rate (0.305 tons/min) increased because almost all oxygen was only reacting with carbon and iron. By the end of the process (16–20 min), blowing decarburization rate (0.117 tons/min) decreased because decarburization became the metal-phase-controlled process due to the shortage of carbon in the bath. At a lower inialpha of 0.01, a significant contribution to the total decarburization rate came from the emulsion zone. By increasing the values of inialpha from 0.02 to 0.08, the hot-spot zone contribution increased slowly, and the contribution from the emulsion zone decreased. At inialpha values of 0.02, 0.04, and 0.06, the decarburization contribution came less or more from the bulk metal bath, emulsion, and hot-spot zones. However, at inialpha values of 0.08 and 0.1, the hot-spot zone significantly contributed to the total decarburization rate. At inialpha values of 0.08 and 0.1, at 8–20 min of blowing, the decarburization rate in the hot-spot zone gradually decreased towards the end of the blowing, and the decarburization rate increased in the bulk metal and emulsion zones. The higher value of inialpha means that more metal fraction was going to the hot-spot reactor, resulting in less FeO forming (and subsequently less slag formation), and in more contribution coming from the hot spot as far as decarburization was concerned. This is attributed to the lower values of inialpha (0.01 and 0.02) as, when oxygen reacts with liquid metal, the reaction is thermodynamically favorable with carbon, but due to the relative ampleness of iron in juxtaposition to carbon, more oxygen combined with iron and produced FeO, and vice versa at higher values of inialpha (0.06 to 0.1). In all cases, hot-spot contribution was minimal in the initial and final parts of the blow because in both situations, the condition of the process was such that it promoted higher FeO formation resulting in liquid slag, which facilitated reactions inside emulsion. On the one hand, in the initial part of the process, lance height was kept higher with a softer blow, and on the other hand, in the final part of the process, more oxygen was combined with iron due to the depletion of carbon in the bath.
Input details for the present study of thermodynamic modelling are shown in Table 1.
Table 1. Input details of thermodynamic modelling of basic oxygen steel-making *.
Input MaterialsElementswt.%
Hot metal
145 tons
Carbon4.44
Manganese0.4
Silicon0.50
Sulfur0.0028
Phosphorous0.12
Scrap
12 tons
Carbon0.2
Manganese0.36
Silicon0.021
Sulfur0.0022
Dolomite
3 tons
MgO40.5
CaO58
SiO20.85
Sulfur0.25
Lime
10 tons
CaO93.5
SiO26.5
Sulfur0
Initial temperature1317 °C
Blowing time (Min)20
O2 flow rate (Nm3/min)450
Iron oreMass in tons2
Retained slag weight3 tons19% SiO2, 39% CaO, 12% MgO, 8% FeO, MnO 1%
* Input parameters derived from JSW Steel Ltd., Toranagallu, Bellary, India.

3.2. Temperature Evolution

Temperature variations in the liquid steel, slag, hot-spot, and emulsion zones are presented in Figure 3 as a function of blowing time for inialpha values from 0.01 to 0.1. This revealed that liquid steel temperature varied from 1312 to 1847 °C, and slag temperature from 906 to 1871 °C. Hot-spot temperature variation was in the range from 2976 to 4070 °C for inialpha values of 0.01, 0.02, 0.04, and 0.06, and 2548 to 3145 °C for inialpha values of 0.08 and 0.1. Emulsion-zone temperature variation was in the range from 1400 to 1840 °C for inialpha values from 0.01 to 0.1. Simulation results showed that the difference among liquid steel, slag, and emulsion-zone temperatures was not large. Temperature variation between metal-bath and hot-spot zones was significantly high, since carbon oxidation and Fe oxidation are exothermic reactions. The practically measured hot-spot temperature ranged between 2000 and 3000 °C, which suggests that inialpha values from 0.06 to 0.1 may represent simulations that are much closer to the practical observations, where the hot-spot and bath decarburization contribution dominated the emulsion contribution in overall decarburization process.

3.3. Slag Composition Evolution

Figure 4 shows the variation in the wt % of CaO, SiO2, and FeO with blowing time. Model predictions showed that, at higher inialpha values of 0.06, 0.08, and 0.1 during the initial blowing period of 2–9 min, the wt % of SiO2 increased due to the formation of SiO2. At 3–15 min of blowing, the wt % of CaO increased due to the addition of lime and dolomite. At inialpha values from 0.01 to 0.04, FeO concentration in the slag increased during 1–4 min of blowing and was maintained at a higher level throughout the blow, creating better conditions for slag formation and less metal going to the hot-spot zone due to poor mixing, resulting in decarburization being dominant in the emulsion. At inialpha values from 0.06 to 0.1, FeO concentration in the bath escalated during 1–4 min of blowing, followed by a decrease at 4–15 min of blowing time, which again increased by the end of the process, as we observed in practical BOF converters. For the same range of inialpha values (0.06 to 0.1), the estimated hot-spot temperature also matched with the practically observed values (2000–3000 °C).

3.4. Liquid Steel and Slag Weight

Figure 5 demonstrates liquid steel and slag weight variation with blowing time. Initially (at 1–5 min), slag weight increased due to the faster oxidation of silicon and remained almost constant at 6–15 min. It increased linearly towards the end of the blow (16–20 min).

3.5. Carbon Removal Trajectory

Variation in carbon wt % in a metal bath with time is shown in Figure 6 at different inialpha values of 0.01, 0.02, 0.04, 0.06, 0.08, and 0.1. There was little variation in carbon content with blowing time at different inialpha values. The overall decarburization reaction could be divided into three main regimes. In Regime 1 (initial period) of the blow (1–4 min), we found decarburization rates of 0.11525, 0.119, 0.111, 0.13, 0.165, and 0.187 tons/min for inialpha values of 0.01, 0.02, 0.04, 0.06, 0.08, and 0.1, respectively. In Regime 2 (main blow; 5–15 min), decarburization rates were 0.281, 0.273, 0.32, 0.32, 0.32, 0.319, and 0.305 tons/min for inialpha values of 0.01, 0.02, 0.04, 0.06, 0.08, and 0.1, respectively. In Regime 3 (towards the end of the blow; 16–20 min), the overall decarburization rates were 0.188, 0.202, 0.177, 0.134, 0.1164, and 0.101 tons/min for inialpha values of 0.01, 0.02, 0.04, 0.06, 0.08, and 0.1, respectively. Again, the observed inialpha values of 0.06 to 0.1 were much closer to the practical observations.

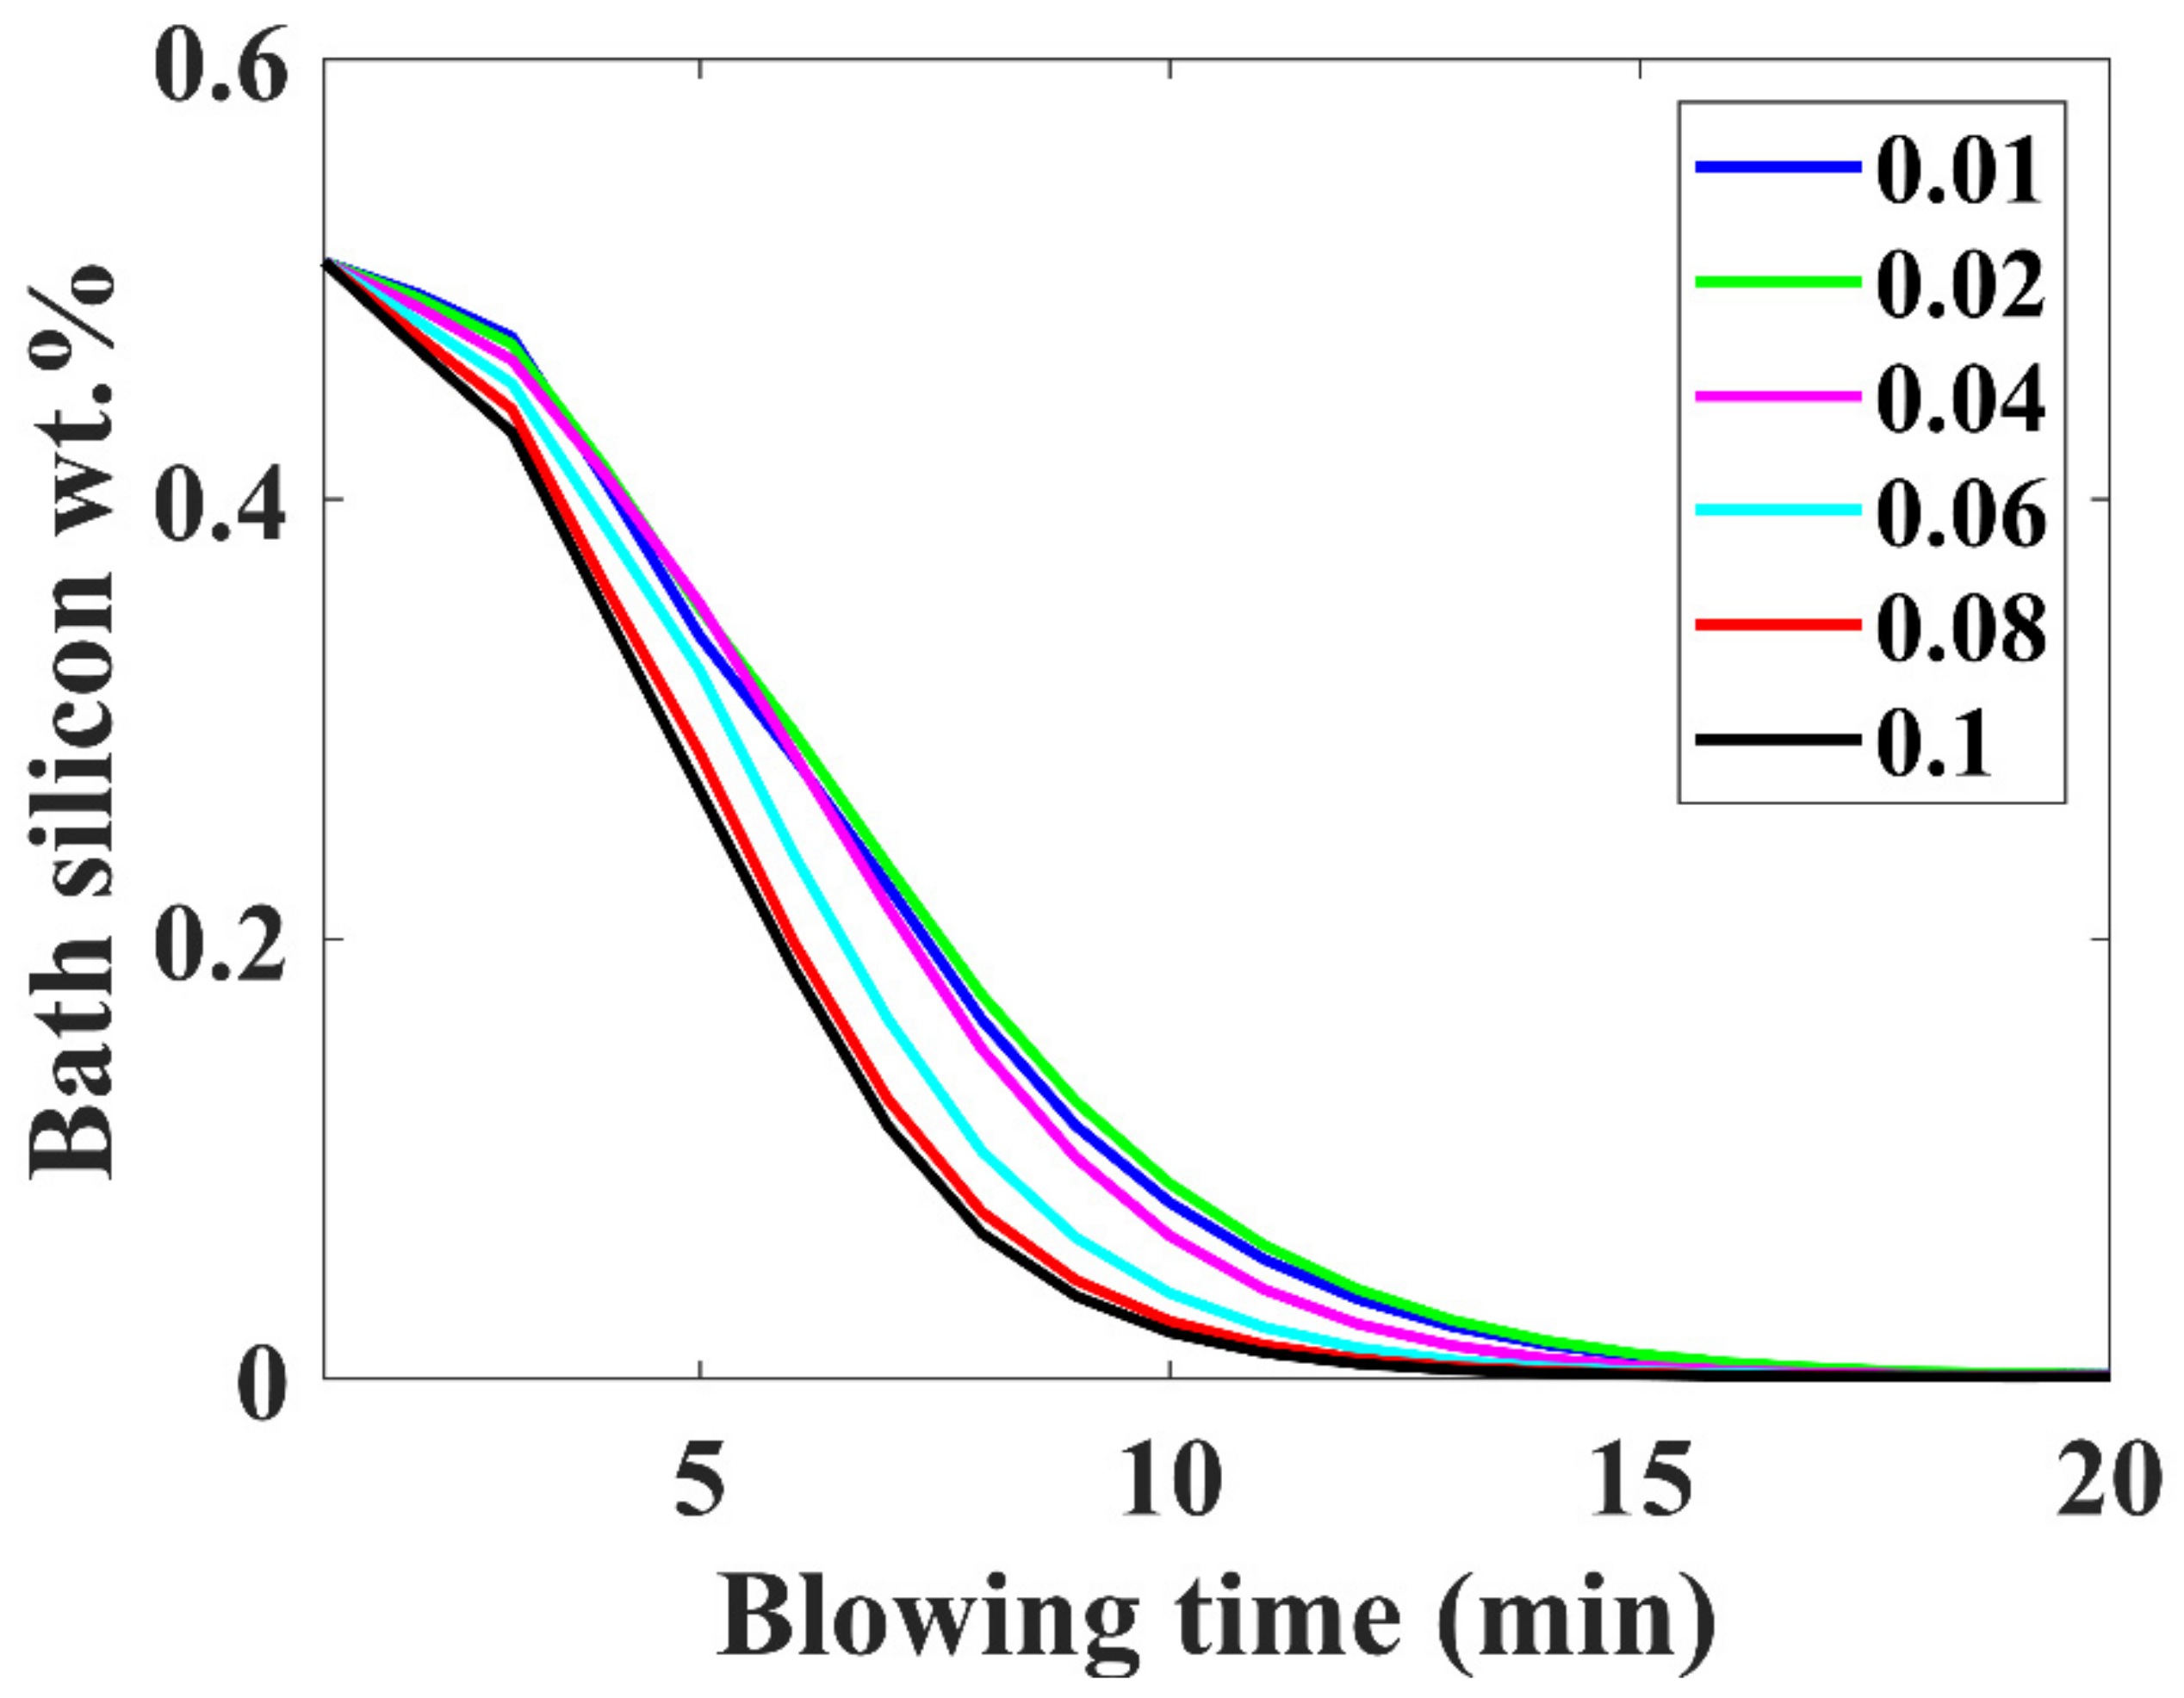
3.6. Silicon Removal Trajectory

Figure 7 demonstrates the silicon removal with blowing time. A significant amount of silicon removal rapidly occurred in the first 9 min of blowing time. At anm inialpha value of 0.01, silicon wt % in the metal bulk reactor was 0.11 wt %, and at inialpha value of 0.1, it was 0.037 wt % after 8 min of blowing. Desiliconization rate increased with increasing inialpha values because more metal went to the hot-spot reactor for reaction with the top oxygen. Again, for inialpha values of 0.06 or higher, the trajectory was closer to the practical observations.

3.7. Verification with Plant Data

Variation in carbon weight percentage with blowing time is shown in Figure 8. The final carbon content obtained was around 0.097 wt %, which agreed with the plant trial data (0.075) when the inialpha value was 0.06.

4. Discussion

The value of inialpha signifies the fraction of metal going to FEM 1 at each time step, which indicates mixing and mass transfer on the metal side. At low values of inialpha (0.01 to 0.04), more oxygen was available to react with liquid metal, which resulted in higher FeO. Due to exothermic reactions in an adiabatic reactor of smaller volume, the temperature in the hot-spot zone increased rapidly. Oxygen rate was fixed as constant, and if the metal rate was increased (by changing inialpha), at lower values of inialpha (0.01 and 0.02), there would be less decarburization, more FeO formation, and higher temperature in the hot-spot zone compared to with other inialpha values (0.04, 0.06, 0.08, 0.1). At lower inialpha values, FEM 2 formed a gas–metal–slag emulsion phase. Chemical reactions occurred among metal droplets, slag, and rising gases at the metal–gas, metal–slag, and slag–gas interfaces. So, most decarburization occurred within the slag–metal emulsion phase, i.e., the emulsion zone, and vice versa at higher values of inialpha (0.04, 0.06, 0.08, and 0.1), which means more decarburization in the hot-spot zone and less FeO formation. By increasing inialpha values (0.04, 0.06, 0.08, 0.1), the carbon removal trajectory followed the lower path, reducing FeO formation, and the rate of oxygen supply controlled the rate of decarburization. With the introduction of the bottom stirring system in the last part of the blow, mixing effects were compensated for the reduced decarburization in the last part of the blow when the carbon transfer became the rate-limiting step. Calculations considered a metal bath to be an equilibrium reactor. There was also a contribution coming from bulk bath decarburization due to the oversaturated dissolved oxygen content in the bath, which was more towards the end of the blow. In the overall sense, the total decarburization rate remains more or less the same for all values of inialpha, but the contribution from emulsion to hot-spot zones changes from the lower value of inialpha to the higher values. If the benchmark for hot-spot temperature was between 2000 and 3000 °C, as observed in the practical converters, results matched well for higher inialpha values (>0.06), where decarburization was largely dominated by hot-spot reactions in the initial and middle parts of the blow, followed by emulsion reactions in the last part of the blow. Dogan et al. [34,35] also claimed that 55% and 40% decarburization takes place at the hot-spot zone. The bulk bath decarburization contribution was minimal, which gradually picked up from the middle part of the blow and increased by the end.

5. Conclusions

A dynamic model to simulate the oxygen steel-making process was developed. A multireactor-based approach and multicomponent mixed control method were used to study the decarburization rates and their contributions coming from the jet impact (hot-spot) zone, slag–metal–gas emulsion, and bath boiling for different levels of mixing in the metal bath by varying the inialpha parameter from lower to higher values (0.01 to 0.1).
On the basis of this study, it is possible to draw the following important conclusions:
  • Higher inialpha values mean higher mass transfer coefficient in the metal bath resulting in a higher contribution by hot-spot decarburization, lower levels of FeO formation and emulsion contribution in decarburization, and vice versa.
  • The observed practical phenomena in converters match with the calculated results for inialpha values greater than 0.06.
  • If the benchmark of the hot-spot temperature was in the range from 2000 to 3000 ℃, then as per the model results, the major contribution of decarburization came from hot-spot reactions in most of the blow; however, by the end of the process, it was governed by emulsion.
  • The model can be used as a guiding tool to control the BOF steel-making process and for obtaining better insights into the process. The model is still under development to incorporate other submodels such as scarp, iron ore, flux dissolution, and heat loss. The purpose of the current study was to understand decarburization phenomena in BOF and their various contributions, which it could successfully achieve.

Author Contributions

Conceptualization, P.S. and A.K.S.; methodology, P.S. and A.K.S.; software, P.S. and A.K.S.; validation, P.S. and A.K.S.; formal analysis, P.S.; investigation, P.S. and A.K.S.; resources, P.S.; data curation, P.S.; writing—original draft preparation, P.S.; writing—review and editing, P.S. and A.K.S.; visualization, P.S.; supervision, A.K.S.; project administration, A.K.S.; funding acquisition, A.K.S. All authors have read and agreed to the published version of the manuscript.

Funding

The funding is received from the Center for Pyrometallurgy-IoE project of IIT Madras, Chennai India (Project number: SB20210849MMMHRD008555). Authors wish to acknowledge the funding received.

Institutional Review Board Statement

Not applicable.

Informed Consent Statement

Not applicable.

Data Availability Statement

Not applicable.

Acknowledgments

The authors would like to acknowledge JSW Steel Ltd., Toranagallu, Bellary, India for providing the plant data used to validate some of the model results developed in this work. The authors would also like to thank Prince Gollapalli and Srishilan C for their valuable comments in MATLAB and macroprogram coding, respectively. MATLAB assistance from the computer center, IIT Madras is highly acknowledged.

Conflicts of Interest

The authors declare no conflict of interest.

Appendix A

Process conditions for total energy calculation ( E t o t a l O )
Weight of liquid melt = 145,000 Kg
Initial temperature = 1590 K
Melt carbon composition = 4.5%
Scrap carbon composition = 0.20%
hfrac = 0.50
Lance angle = 14 degrees
Number of openings in lance = 6
Throat diameter = 2.46 cm
Bath depth = 1.30 m
Lance oxygen flow rate = 450 nm3/min
Bottom stirring flow rate = 2 nm3/min
Blowing regime is defined as follows:
If 0 < t < 135; lance height = 2.20 m
If 135 < t < 300; lance height = 1.80 m
If t > 300; lance height = 160 cm

Appendix B

Calculation of fractions α, β, and δ by coupled reaction theory model [51]. Schematic of composition in metal and slag are shown in Figure A1.
Figure A1. Composition profiles in metal and slag.
Metals 12 00638 g0a1
The slag-metal reaction occurs at the interface where there is thermodynamic equilibrium due to the very high temperature of the process. The flux equations for the above represented slag-metal reactions can be given as:
k m · A ·   ( C bm C im ) = V m · ( dC bm / d t )
k sl · A · ( C bsl C isl ) = V sl · ( dC bsl / dt )
where km and ksl are the mass transfer coefficients on slag and metal sides, respectively; A is the slag-metal interface area; Cbm and Cim are the bulk and interfacial concentrations in the metal phase, respectively; Cbsl and Cisl are the bulk and interfacial concentrations in the slag phase, respectively; and Vm and Vsl are the volumes of the metal and slag phases, respectively.
The above flux equations can be rewritten as:
( k m · A ·   dt / V m ) = dC bm / ( C bm   C im ) = Fract 1
( k sl · A ·   dt / V sl ) = dC bsl / ( C bsl   C isl ) = Fract 2
The above system of reactions can be presented in a flow sheet-based model where the interface, which is in thermodynamic equilibrium, is represented as an equilibrium reactor where fractions of bulk metal and bulk slag metal enter into the reactor where fractions are calculated as above (Fract1 and Fract2). It is shown in Figure A2. Fractions depend on the mixing of the reactor, as explained in the paper. The above problem can lastly be represented as a reactor-based flow sheet in the following manner:
Figure A2. Interaction of different modules.
Metals 12 00638 g0a2
The process could be divided into time steps. At each step, the fractions of reacting phases can be calculated by mass transfer considerations, as explained above.

References

  1. Deo, B. Fundamentals of Steelmaking Metallurgy Chapter 3. Available online: https://www.researchgate.net/publication/28265101 (accessed on 6 June 2021).
  2. Barron, M.A.; Medina, D.Y.; Hilerio, I. Numerical simulation of decarburization in a top-blown basic oxygen furnace. Model. Simul. Mat. Sci. Eng. 2014, 4, 94–100. [Google Scholar] [CrossRef] [Green Version]
  3. Jalkanen, H. Experiences in physicochemical modelling of oxygen converter process (BOF). Adv. Process. Met. Mater. 2006, 2, 541–554. [Google Scholar]
  4. Sarkar, R.; Gupta, P.; Basu, S.; Ballal, N.B. Dynamic modelling of LD. Converter steelmaking: Reaction modelling using Gibbs free energy minimization. Metall. Mater. Trans. B 2015, 46, 961–976. [Google Scholar] [CrossRef]
  5. Kruskopf, A.; Visuri, V.V. A Gibbs Energy Minimization Approach for Modelling of Chemical Reactions in a Basic Oxygen Furnace. Metall. Mater. Trans. B 2017, 48, 3281–3300. [Google Scholar] [CrossRef] [Green Version]
  6. Knoop, W.; Deo, B.; Snoeijer, A.; Unen, G.; Boom, R. A Dynamic slag-droplet model for the steelmaking process. In Proceedings of the 4th International Conference on Molten Slags and Fluxes, Tokyo, Japan, 8–11 June 1992; pp. 302–307. [Google Scholar]
  7. Lytvynyuk, Y.; Schenk, J.; Hiebler, M.; Sormann, A. Thermodynamic and Kinetic Model of the Converter Steelmaking Process. Part 1: The Description of the BOF Model. Steel Res. Int. 2014, 85, 537–543. [Google Scholar] [CrossRef]
  8. Kattenbelt, C.; Roffel, B. Dynamic modelling of the main blow in basic oxygen steelmaking using measured step responses. Metall. Mater. Trans. B 2008, 39, 764–769. [Google Scholar] [CrossRef] [Green Version]
  9. Urquhart, R.C.; Davenport, W.G. Foams and emulsions in oxygen steelmaking. Can. Metall. Q. 1973, 12, 507–516. [Google Scholar] [CrossRef]
  10. Kootz, T.; Behrens, K.; Maas, H.; Baumgarten, P. Dephosphorization of steel. Stahl Eisen 1965, 85, 857–865. [Google Scholar]
  11. Koch, K.; Fix, W.; Valentin, P. Einfluss von Sauerstoffangebot und Kohlenstoffausgangsgehalt Sowie von Badgeometrie und Feuerfestmaterial auf den Ablauf der Entwicklung von Fe-C-Schmelzen in einem 50-kg-Aufblastkonverter. Arch. Eisenhüttenwesen 1978, 49, 109–114. [Google Scholar] [CrossRef]
  12. Rout, B.K.; Brooks, G.A.; Rhamdhani, M.A.; Li, Z.; Frank, N.H.; Schrama, F.N.H.; Sun, J. Dynamic model of basic oxygen steelmaking process based on multizone reaction kinetics: Model derivation and validation. Metall. Mater. Trans. B 2018, 49, 537–557. [Google Scholar] [CrossRef] [Green Version]
  13. Rout, B.K.; Brooks, G.A.; Rhamdhani, M.A. Transient behavior of dephosphorization kinetics in oxygen steelmaking. In Proceedings of the AISTech 2015 Iron and Steel Technology Conference, Cleveland, OH, USA, 4–7 May 2015; Volume 3, pp. 3225–3237. [Google Scholar]
  14. Rout, B.K.; Brooks, G.A.; Rhamdhani, M.A.; Li, Z.; Schrama, F.N.H.; Overbosch, A. Dynamic model of basic oxygen steelmaking process based on multizone reaction kinetics: Modelling of decarburization. Metall. Mater. Trans. B 2018, 49, 1022–1033. [Google Scholar] [CrossRef]
  15. Fruehan, R.J.; Goldstein, D.; Sarma, B.; Story, S.R.; Glaws, P.C.; Pasewicz, H.U. Recent advances in the fundamentals of the kinetics of steelmaking reactions. Metall. Mater. Trans. B 2000, 31, 891–898. [Google Scholar] [CrossRef]
  16. Fruehan, R.J.; Martonik, L.J. The rate of decarburization of liquid iron by CO2 and H2. Metall. Mater. Trans. B 1974, 5, 1027–1032. [Google Scholar] [CrossRef]
  17. Simento, N.J.; Hayes, P.C.; Peter, H.C. Decarburisation of liquid Fe-C-S drops using multiple oxidants of O2, CO2, and H2O. ISIJ Int. 1999, 39, 1217–1223. [Google Scholar] [CrossRef]
  18. Widlund, D.; Sarma, D.S.; Jonsson, P.G. Studies on decarburization and desiliconization of levitated Fe-C-Si alloy droplets. ISIJ Int. 2006, 46, 1149–1157. [Google Scholar] [CrossRef] [Green Version]
  19. Sun, H.; Gao, K.; Sahajwalla, V.; Mori, K.; Pehlke, R.D. Kinetics of gas oxidation of liquid Fe-C-S alloys and carbon boil phenomenon. ISIJ Int. 1999, 39, 1125–1133. [Google Scholar] [CrossRef]
  20. Sun, H.; Pehlke, R.D. Kinetics of oxidation of multicomponent liquid iron alloys by oxidizing gases using levitation melting. Trans. Am. Foundry Soc. 1992, 100, 371–376. [Google Scholar]
  21. Zughbi, H.D. Decarburization of Fe/C melts in a crucible: Effects of gas flow rate and Composition. Scand. J. Metall. 2003, 32, 194–202. [Google Scholar] [CrossRef]
  22. Zughbi, H.D. Decarburization of Fe/C melts in a crucible: Effects of bath sulfur level and bath surface area. Scand. J. Metall. 2004, 33, 242–250. [Google Scholar] [CrossRef]
  23. Wu, P.; Yang, Y.; Barati, M.; McLean, A. Decarburization of levitated Fe-Cr-C droplets by carbon dioxide. Metall. Mater. Trans. B 2014, 45, 2211–2221. [Google Scholar] [CrossRef]
  24. Nagasaka, T.; Fruehan, R.J. Kinetics of the reaction of H2O gas with liquid iron. Metall. Mater. Trans. B 1994, 25, 245–253. [Google Scholar] [CrossRef]
  25. Baker, L.A.; Warner, N.A.; Jenkins, A.E. Kinetics of decarburization of liquid iron in an oxidizing atmosphere using the levitation technique. Trans. Metall. Soc. AIME 1964, 230, 1228–1235. [Google Scholar]
  26. El-Kaddah, N.H.; Robertson, D.G.C. The kinetics of gas-liquid metal reactions involving levitated drops. Carburization and decarburization of molten iron in CO-CO2 gas mixtures at high pressures. Metall. Mater. Trans. B 1978, 9, 191–199. [Google Scholar] [CrossRef]
  27. Sun, H.; Pehlke, R.D. Kinetics of oxidation of carbon in liquid iron-carbon-silicon manganese-sulfur alloys by carbon dioxide in nitrogen. Metall. Mater. Trans. B 1995, 26, 335–344. [Google Scholar] [CrossRef]
  28. Distin, P.A.; Hallett, G.D.; Richardson, F.D. Some reactions between drops of iron and flowing gases. J. Iron Steel Inst. 1968, 206, 821–833. [Google Scholar]
  29. Modigel, M.; Traebert, A.; Monheim, P.; Petersen, S.; Pickartz, U. A new tool for process modelling of metallurgical processes. Comput. Chem. Eng. 2001, 25, 723–727. [Google Scholar] [CrossRef]
  30. Graveland-Gisolf, E.; Mink, P.; Overbosch, A.; Boom, R.; Gendt, G.D.; Deo, B. Slag droplet model, a dynamic tool to simulate and optimize the refining conditions in BOF. Steel Res. Int. 2003, 74, 125–130. [Google Scholar] [CrossRef]
  31. Chigwedu, C.; Kempken, J.; Pluschkell, W. A new approach for the dynamic simulation of the BOF process. Stahl Essen 2006, 126, 25–30. [Google Scholar]
  32. Traebert, A.; Modigell, M.; Monheim, P.; Hack, K. Development of a modelling technique for non-equilibrium metallurgical process. Scand. J. Metall. 1999, 28, 285–290. [Google Scholar]
  33. Dogan, N.; Brooks, G.A.; Rhamdhani, M.A. Comprehensive model of oxygen steelmaking part 1: Model development and validation. ISIJ Int. 2011, 51, 1086–1092. [Google Scholar] [CrossRef] [Green Version]
  34. Dogan, N.; Brooks, G.A.; Rhamdhani, M.A. Comprehensive model of oxygen steelmaking part 2: Application of bloated droplet theory for decarburization in emulsion zone. ISIJ Int. 2011, 51, 1093–1101. [Google Scholar] [CrossRef] [Green Version]
  35. Dogan, N.; Brooks, G.A.; Rhamdhani, M.A. Comprehensive model of oxygen steelmaking Part 3: Decarburization in Impact Zone. ISIJ Int. 2011, 51, 1102–1109. [Google Scholar] [CrossRef] [Green Version]
  36. Biswas, J.; Gu, K.; Coley, K.S. A decarburization Model for a Fe-C Droplet Reacting in Oxidizing Slag. Metall. Mater. Trans. B 2021, 52, 3888–3906. [Google Scholar] [CrossRef]
  37. Kozakevitch, P. Study of Basic Phosphate Slag Foams. In International Congress of Oxygen Steelmaking; Le Touquet: Paris, France, 1963. [Google Scholar]
  38. Meyer, H.W.; Porter, W.F.; Smith, G.C.; Szekely, J. Slag-metal emulsions and their importance in BOF steelmaking. JOM 1968, 20, 35–42. [Google Scholar] [CrossRef]
  39. Okano, S.; Matsuno, J.; Ooi, H.; Tsuruoka, K.; Koshikawa, T.; Okazaki, A. Model analysis in three different reaction zones in basic oxygen converter. In International Conference on Science and Technology of Iron and Steel; Iron and Steel Institute: Tokyo, Japan, 1971; pp. 227–231. [Google Scholar]
  40. Price, D.J. LD Steelmaking: Significance of the emulsion in carbon removal. In Process Engineering of Pyrometallurgy Symposium; IMM: London, UK, 1974. [Google Scholar]
  41. Chatterjee, A.; Lindfors, N.O.; Weste, J.A. Process metallurgy of LD. Steelmaking. Ironmak. Steelmak. 1976, 3, 21–32. [Google Scholar]
  42. Koch, K.; Fix, W.; Valentin, P. Investigation of the decarburization of Fe-C melts in a 50 kg top-blown converter. Steel Res. Int. 1976, 47, 659–663. [Google Scholar]
  43. Nakamura, M.; Tate, M. Study of decarburization process of inductively stirred Fe-C Melts. ISIJ Int. 1977, 63, 236–245. [Google Scholar]
  44. Kawakami, K. Kinetics of blowing reaction in a basic oxygen furnace. J. Met. 1966, 18, 836–844. [Google Scholar] [CrossRef]
  45. FactSage. Center for Research in Chemical Thermodynamics, Polytechnique de Montreal, Canada. Available online: www.factsage.com (accessed on 1 February 2021).
  46. Shukla, A.K.; Deo, B.; Millman, S.; Snoeijer, B.; Overbosch, A.; Kapilashrami, A. An insight into the mechanism and kinetics of reactions in BOF Steelmaking process: Theory vs. practice. Steel Res. Int. 2010, 81, 940–948. [Google Scholar] [CrossRef]
  47. Shukla, A.K.; Deo, B.; Robertson, D.G.C. Scrap dissolution in molten iron containing Carbon for the case of coupled heat and mass transfer control. Metall. Mater. Trans. B 2013, 44, 1407–1427. [Google Scholar] [CrossRef]
  48. Ghosh, A.; Chatterjee, A. Iron Making and Steel Making; PHI Learning Private Limited: New Delhi, India, 2012; pp. 50–55. [Google Scholar]
  49. Pal, J.; Ghorai, S.; Bandyopadhyay, D.; Ghosh, S. Performance assessment of partially pre-fused synthetic flux in basic oxygen steelmaking. J. Iron Steel Res. Int. 2015, 22, 916–923. [Google Scholar] [CrossRef]
  50. Robertson, D.G.C.; Deo, B.; Ohguchi, S. Multicomponent Mixed-Transport-Control Theory for Kinetics of Coupled Slag/Metal and Slag/Metal/Gas Reactions: Application to Desulphurization of Molten Iron. Ironmak. Steelmak. 1984, 11, 41–56. [Google Scholar]
  51. Shukla, A.K. Thermodynamics based modelling of iron and steelmaking processes using flowsheet-based approach employing METSIM. Trans. Indian Inst. Met. 2019, 72, 767–775. [Google Scholar] [CrossRef]
Figure 2. Comparison of rates of total decarburization (blue), decarburization in hot-spot zone (red), decarburization in emulsion zone (green), and decarburization in metal bath (magenta) with blowing time at (a) 0.01 inialpha, (b) 0.02 inialpha, (c) 0.04 inialpha, (d) 0.06 inialpha, (e) 0.08 inialpha, and (f) 0.1 inialpha.
Metals 12 00638 g002
Figure 3. Temperature variations in liquid steel (blue), liquid slag(red), hot spot (green) and emulsion (magenta) with blowing time at (a) 0.01 inialpha, 0 (b) 0.02 inialpha, (c) 0.04 inialpha, (d) 0.06 inialpha, (e) 0.08 inialpha, and (f) 0.1 inialpha.
Metals 12 00638 g003aMetals 12 00638 g003b
Figure 4. Slag compositions variations of wt.% SiO2 (blue), CaO (red) and FeO (green) with blowing time at (a) 0.01 inialpha, (b) 0.02 inialpha, (c) 0.04 inialpha, (d) 0.06 inialpha, (e) 0.08 inialpha, and (f) 0.1 inialpha.
Metals 12 00638 g004aMetals 12 00638 g004b
Figure 5. Weight variations in liquid steel (blue) and liquid slag (red) for inialpha value 0.06 with blowing time.
Metals 12 00638 g005
Figure 6. Variation in carbon wt % with blowing time at different inialpha values of 0.01 (blue), 0.02 (green), 0.04 (magenta), 0.06 (cyan), 0.08 (red), and 0.1 (black).
Metals 12 00638 g006
Figure 7. Variation in silicon wt % with blowing time at different inialpha values of 0.01 (blue), 0.02 (green), 0.04 (magenta), 0.06 (cyan), 0.08 (red), and 0.1 (black).
Metals 12 00638 g007
Figure 8. Variation in carbon wt % with blowing time for plant data and model prediction.
Metals 12 00638 g008
Publisher’s Note: MDPI stays neutral with regard to jurisdictional claims in published maps and institutional affiliations.

