Article

A Three-Dimensional Box-Counting Method to Study the Fractal Characteristics of Urban Areas in Shenyang, Northeast China

Jangho Architecture College, Hunnan Campus, Northeastern University, Shenyang 110169, China
*
Author to whom correspondence should be addressed.
Buildings 2022, 12(3), 299; https://doi.org/10.3390/buildings12030299
Submission received: 22 December 2021 / Revised: 28 February 2022 / Accepted: 28 February 2022 / Published: 3 March 2022
(This article belongs to the Topic Climate Change and Environmental Sustainability)

Abstract

:
Modern expansion and three-dimensional growth are rapidly altering the morphological features of traditional cities. This morphological phenomenon fully reflects the internal organization mode and composition rules of modern cities. This study draws on the research method of three-dimensional fractal, focusing on the situation where there is less research on the fractal form at the block scale, and conducts a fractal research on the three-dimensional form of a city at the meso and micro scales, in order to reveal the fractal characteristics of modern urban density. Based on fractal theory, the urban form of Shenyang, Northeast China, was quantitatively analyzed using the box-counting (Minkowski–Bouligand) method to calculate the two-dimensional (2D) and three-dimensional (3D) box dimensions of urban areas. Next, by analyzing the correlations between morphological indicators and 2D and 3D fractal dimensions, this study proposes cluster features of the correlation between the 3D fractal dimension and floor-area ratio. Then, this study summarizes the fractal characteristics of Shenyang’s urban form, based on the cluster analysis and spatial features of various urban areas within the city. The analysis results show the fractal dimension of Shenyang’s urban form to have characteristic expected values; fractal dimension clusters reflect spatial differences in the forms of different urban areas. The 3D D value of architectural morphology fractal in urban areas of Shenyang is between 2.41 and 2.70. From this, the representative characteristics of Shenyang’s urban form were obtained: first, it has the fractal characteristics of morphological hierarchy and system embeddedness; second, under unified and standardized management, its basic urban form structure displays the fractal characteristics of morphological similarity and system hierarchy; and third, its 3D urban form characteristics include the spatial accumulation of clusters and morphological patches, creating a patchwork of different building heights and densities, with the spatial clustering of density form highly correlated with the fractal dimension. The results of this research will provide reference samples for the morphological identification, design control, and design review of modern cities, and enrich the research results of the application of fractal theory to urban morphology at the meso and micro scales.

1. Introduction

Fractals are used to describe the complexity of patterns, both in terms of the basic order of naturally occurring patterns and artificial phenomena [1]. French American mathematician Mandelbrot coined the term “fractal” in 1975 [2]. Mandelbrot first introduced his fractal theory in 1967, when he calculated the fractal dimension of the coastline of Great Britain [2]. Fractal theory enables the exploration of dynamic and complex systems, such as cities, which generally have intricate morphology and systems, especially in terms of geometric complexity and urban form [3], by modelling their growth processes.
Following Batty’s application of fractal theory to urban studies [4,5,6], the term “fractal city” has become standard. His book Fractal Cities introduced fractal models (the diffusion-limited aggregation and dielectric breakdown models) to simulate the growth of urban forms [7]. It was a seminal work on the application of fractal geometry to urban studies, and paved the way for further research. Subsequently, fractal theory was applied widely in studies on macro-scale two-dimensional (2D) forms, such as urban borders, land use form, urban form and growth, urban spatialization, city scale and distribution, and urban systems [8,9,10]. Influential studies of this nature began appearing in the 1990s. Many scholars have used fractal models to quantitatively analyze actual urban spaces in studies on micro-/meso-scale urban forms, and have explored planning and design strategies, as well as guiding principles, based on fractal theory.
Research on 2D forms of fractal cities, both from China and the rest of the world, can be divided into macro- and micro-/meso-scale studies. There are several examples of macro-scale studies. Frankhauser applied the fractal method to measure the fractal dimension of built-up surfaces on the periphery of Brussels [11]. Czamanski et al. used the fractal dimension of the entire metropolitan area of Tel Aviv, estimated as a function of time, to study the city’s dynamic evolution [12]. Barredo used the radial fractal dimension to study the speed and direction of Dublin’s urbanization. Fan et al. (2012) used a fractal index to study the process of urban expansion in Guangzhou from 1979 to 2003 [13]. Macro-scale fractal research has also been conducted on central place and urban systems, to describe the spatial forms and processes of cities [14], such as using the fractal dimension to describe the distribution of built-up surfaces, as well as the density or sparsity of urban spatial patterns and systems [15]. Many researchers have conducted fractal research on urban land use, structural similarity of overall urban form, spatio-temporal evolution, and expansion mode, among others [5,16]. Some scholars have conducted correlational research on the link between the urban form and socio-economic variables, such as social equity, quality of life, access to facilities, jobs, and green space [17,18].
Micro-/meso-scale studies have been conducted on the fractal geometry of urban architecture [19,20], and have explored the urban fractal form at various scales, such as neighborhoods and street edges [21,22]. As a community or block can be used as a practical geographical unit to study the compactness of a whole city [23,24], many studies have analyzed aspects such as the physical environment of buildings, natural terrain, and walking systems at the neighborhood scale. The neighborhood form is commonly used to study the urban organization model of small areas in metropolises. For example, Southworth and Owens [25] analyzed street layouts, growth patterns, land use, and the size and shape of plots and houses in eight suburban communities in the San Francisco Bay Area [25,26].
Cities have been characterized as organized and complex systems with hierarchical morphological structures; fractal structures exist in urban 3D morphology. In recent years, Chinese scholars have conducted pioneering research on 3D fractals of cities, including preliminary explorations of urban 3D spatial morphology, spatial expansion characteristics, and landscape patterns [7,26,27,28,29,30,31]; however, this work primarily focused on macro-scale mathematical relationships, and lacked real understanding and guidance regarding actual urban spatial forms. Studies on the 3D morphology of cities have tended to use the 3D box-counting method to measure the fractal dimension of a 3D urban space, or to compare and analyze 2D and 3D fractal characteristics of urban spaces [31].
Modern cities have highly complex, spatially dissimilar, clearly hierarchical 3D features, which can be identified as density forms created by various cluster and matrix morphologies [32,33,34,35,36,37]. Batty and Kim (1992), Longley and Mesev [38], and Molinero and Thurner (2019) have suggested that the third dimension (i.e., the building height) should be considered in fractal research.
Based on this morphological understanding, this study holds that the density morphological relationship reflects the internal organization method and composition rules of the 3D form, and shapes the overall order of modern cities. While the 2D fractal form of a city describes the distribution of urban land, the 3D box dimension describes vertical urban morphological principles [28]. Nevertheless, there are no perfect fractal laws that are applicable to the highly complex urban form, and it therefore only has fractal properties at certain scales. Neighborhood-scale city studies have been shown to be relatively accurate. For example, Wheeler (2003) used street patterns, the size and shape of plots, design features of buildings and sites, and land use combinations to describe communities developed during various historical periods [39]. Song and Knapp developed indicators for dimensions such as street design [40], density, land use mix, commercial activities, and modes of transportation, to quantify the community morphologies of the Portland metropolitan area [26,41,42]. Therefore, in the study of urban form, the spatial scale that can be perceived by the human body, that is, community-neighborhood scale, is usually chosen as the research scope.
Based on the review of fractal theory and its research directions, and explorations of urban form, this study holds that sparse and dense morphological relationships reflect the internal organization method and composition rules of 3D morphology, and shape the overall order of modern cities. However, there are few studies on the fractal characteristics of 3D urban forms at the block scale, the existing studies focus only on the mathematical fractal range. Moreover, there has been limited investigation of concrete urban design in combination with the specific physical environment. Therefore, considering the advantages of urban form research at the community-neighborhood scale, this study advances the fractal quantitative research of urban form from the novel perspective of 3D meso-micro scale [26,43], and explains the fractal characteristics of modern urban density morphology by calculating the 3D box dimension. This will provide a reference sample for the identification of modern urban form, and enrich research on urban form at the meso-micro scale through application of the fractal theory. This study further analyzes the clustering characteristics of urban agglomeration degree form, which can also have a positive impact on the hierarchical control measures of urban form [44].
In summary, this study takes the urban form of Shenyang as its research object (Figure 1), selects a multi-sample area space for box-counting dimension analysis of urban 3D fractals, and attempts to clarify the hierarchical order of urban 3D form, as well as the basic law of fractal form. In this study, the side length of a box of a certain size is determined according to the conventional scale (300 m) of the morphological units formed by the urban road system [45], and it is then combined with the growth law of urban building height to further determine the power law relationship of the 3D box, thereby calculating the urban 3D fractal dimension value. Next, the clustering characteristics of density morphological indicators in different areas are statistically analyzed through differences in fractal dimension value. Finally, combined with the quantitative analysis of the typical specific morphological characteristics of “one river and two banks” in Shenyang, this study proposes a basic understanding of the hierarchical order and fractal characteristics of the urban density form of Shenyang. The findings will provide important theoretical support and control parameter references for the design review and concrete form control of modern urban designs.

2. Data Sources, Research Method, and Object of Research

2.1. Data Sources

The data used in this study are based on the data of building outlines and urban land use of built-up areas in Shenyang in 2018, obtained from Shuijingzhu Downloader. Considering the historical development and structural characteristics of Shenyang’s urban areas, and in combination with the city’s separation status by natural and anthropogenic boundaries, 24 relatively complete blocks of 1.2 km × 1.2 km were selected. These sample areas can adequately reflect the spatial characteristics of 3D fractals in different historical development stages of Shenyang, e.g., areas with multi-storey buildings, mixed areas with both multi-storey and high-rise buildings, or areas with high-rise buildings. The types of buildings in the sample areas were mainly residential and business offices. In the selection of samples, attempts were made to exclude large parks, rivers and lakes, and other non-urban development and construction areas as far as possible, so that the data results can accurately reflect the block morphological characteristics of modern cities. In addition, the research team conducted on-site supplementary investigations to verify and correct acquired data related to building outline, floor numbers, and height, to verify the morphological data and information for buildings, land use, roads, etc.

2.2. Research Method

The current study used the 3D box-counting method to study the 2D and 3D fractal characteristics of modern urban matrix morphology. The box-counting dimension, proposed by Gangepain in 1986 [45], is one of the most widely used dimensions. The primary reason for its widespread application is that its mathematical calculations and empirical estimations are relatively straightforward [13]. The box-counting and radial analysis methods are commonly used for calculating the fractal dimension of an urban form [46,47].
In 2D box-counting, a two-dimensional fractal pattern is covered with a square grid of side length to obtain the number of non-empty squares or boxes. The side length is gradually increased and a series of values is obtained. Two-dimensional box-counting is expressed by the following equation:
N ( r ) r D ,
ln Nr = D ln r + C ,
where is the box-counting dimension of the object of research.
In the 3D box-counting method, a regular cube grid is used to cover the space or building. First, on the two-dimensional plane XOY , grid squares with different side lengths are used to cover the urban building space, and the non-empty grid squares are counted. Then, the building elevation and height are determined by the number of non-empty grid squares on the plane XOY that have occupied cubes on the Z-axis. The sum of the cubes on non-empty grid squares is denoted as N .
The number of non-empty grid squares on plane XOY corresponding to occupied cubes on the Z-axis can be calculated using the following equation:
N i , j = INT [ max ( h j ) ] / r i ] INT [ min ( h j ) / r i ] + 1 ,
where N i , j is the number of cubes occupied by the urban building on the Z-axis corresponding to the j-th non-empty grid square when covered by a grid of squares with side length r i ; r i denotes the side length of the grid squares; max ( h j ) and min ( h j ) are the maximum and minimum heights of urban buildings, respectively, corresponding to the j -th non-empty grid square; and INT is the rounding down operation. The total number of cubes with side length r i required to cover the urban building, N i , is [5,48]:
N i = j N i , j ,
The 3D box-counting dimension of the urban building is:
D f = lim r i 0 ( ln N i / ln r i ) ,
where D f is the 3D box-counting dimension of the object of research [6,14,31].

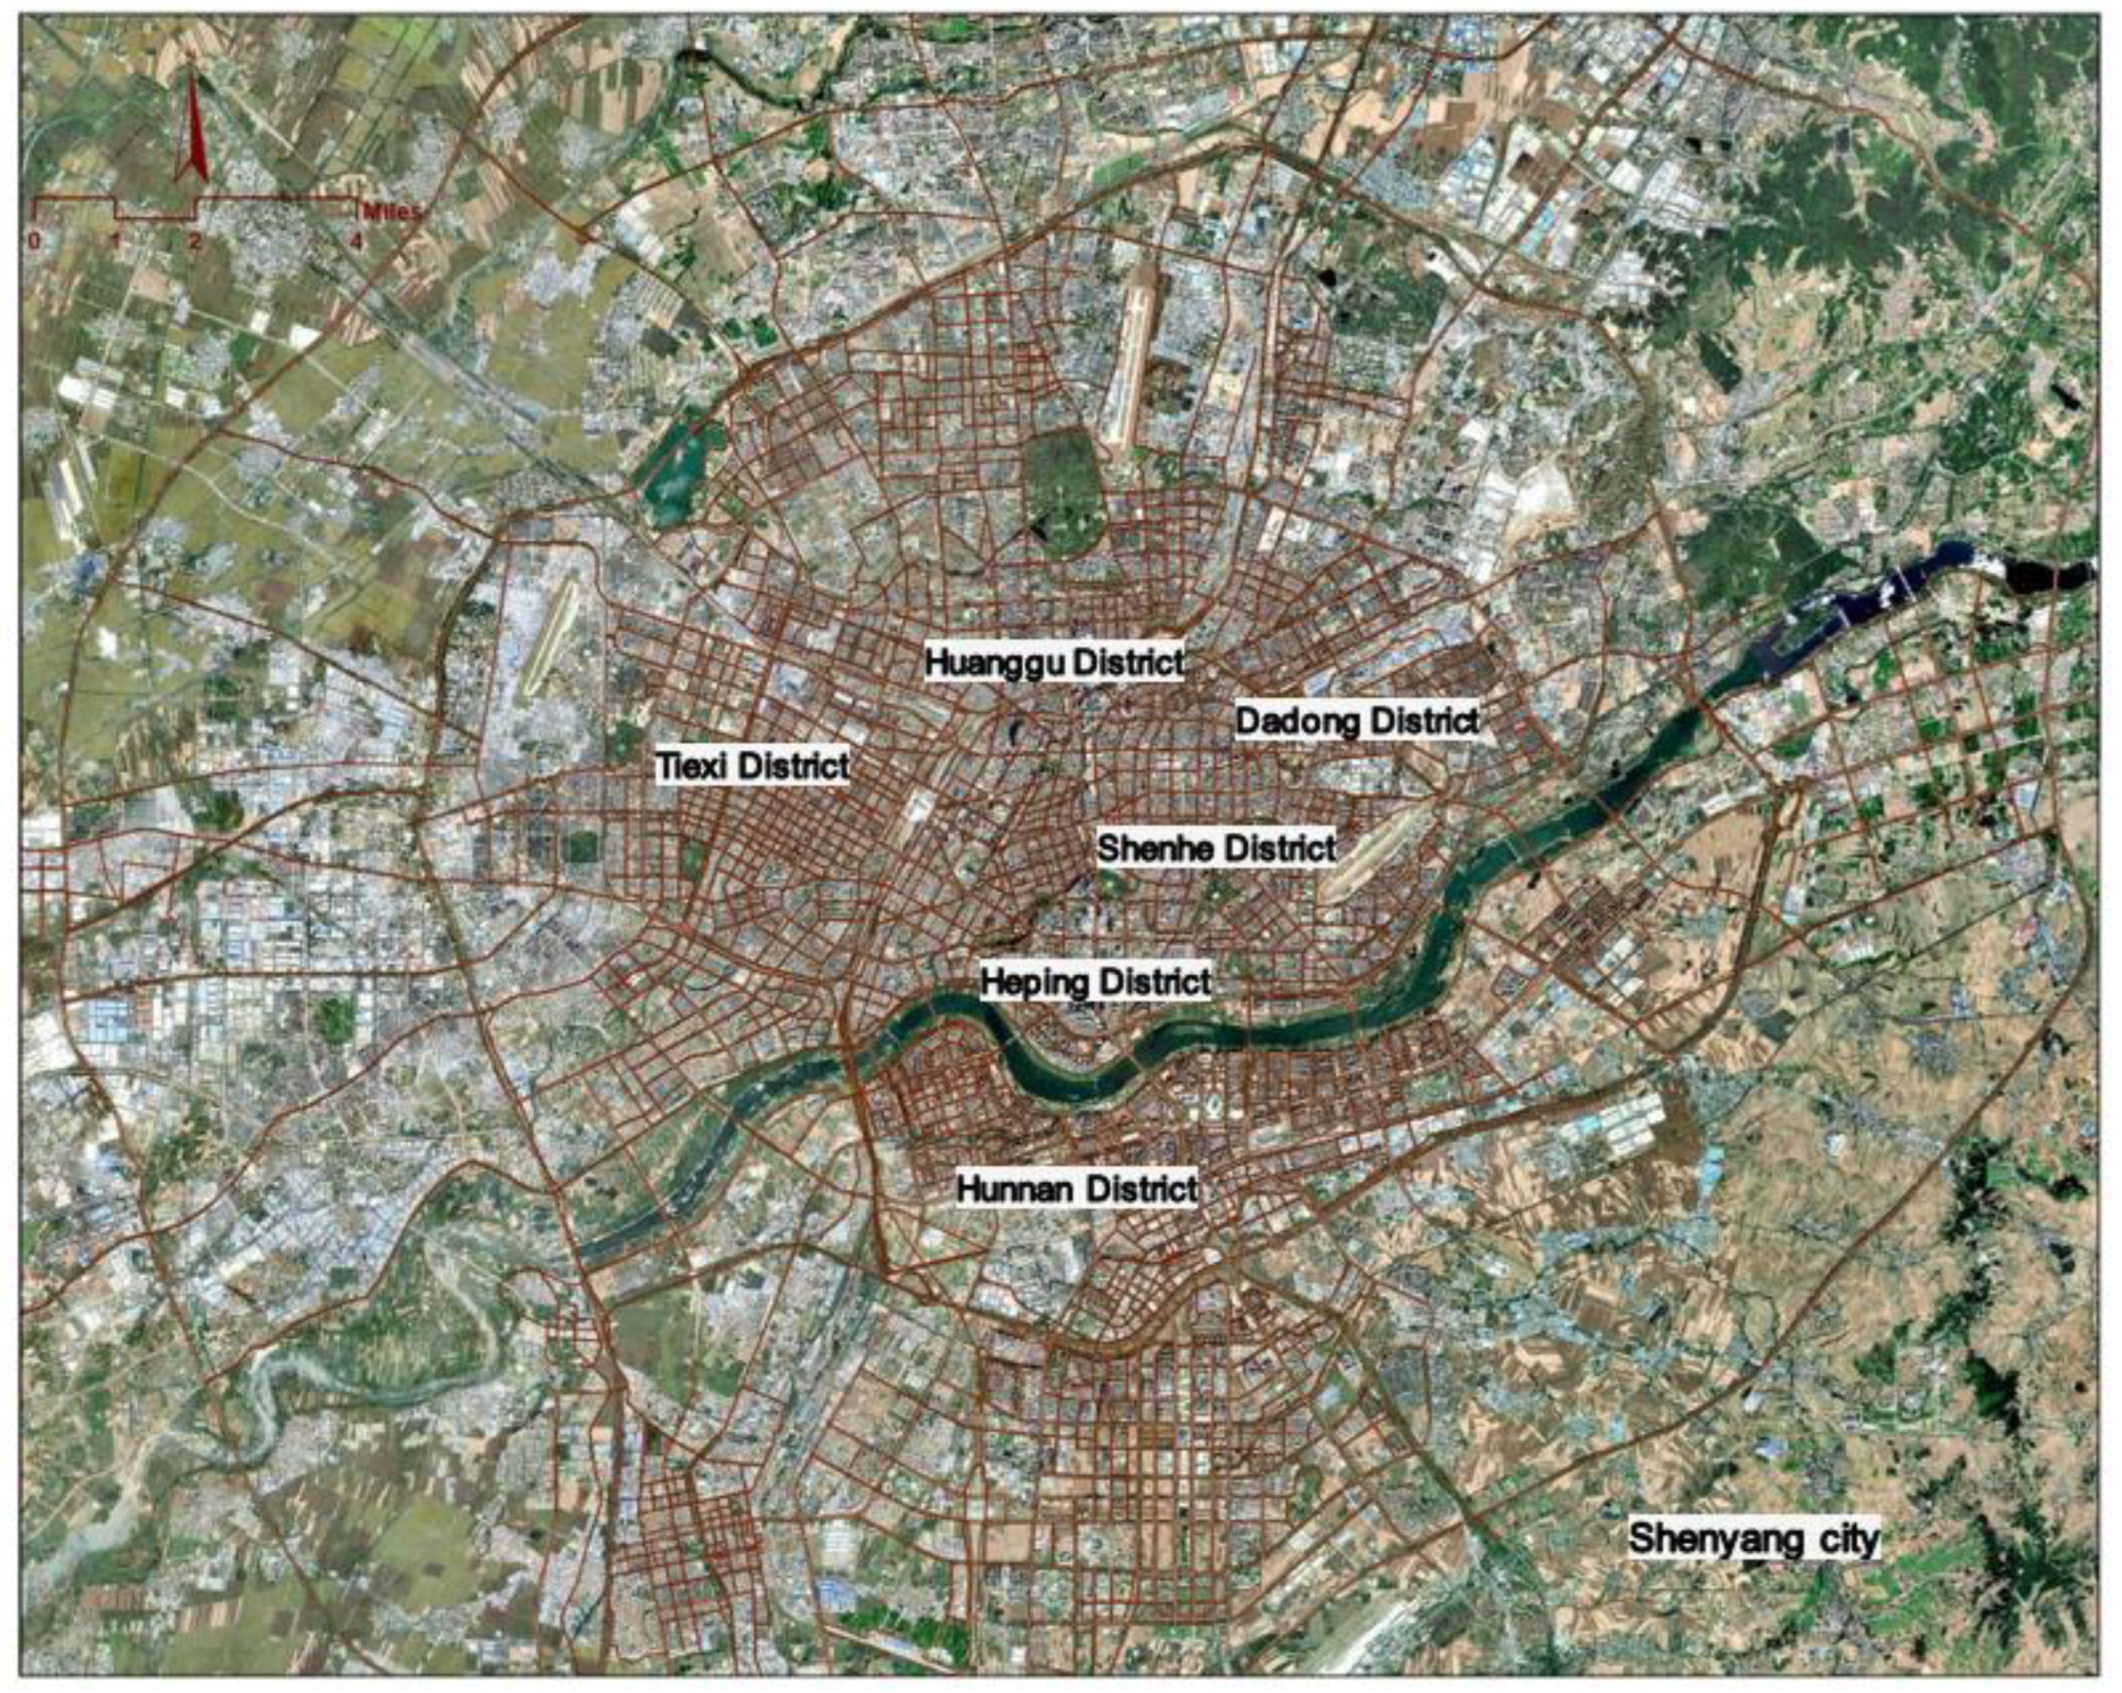
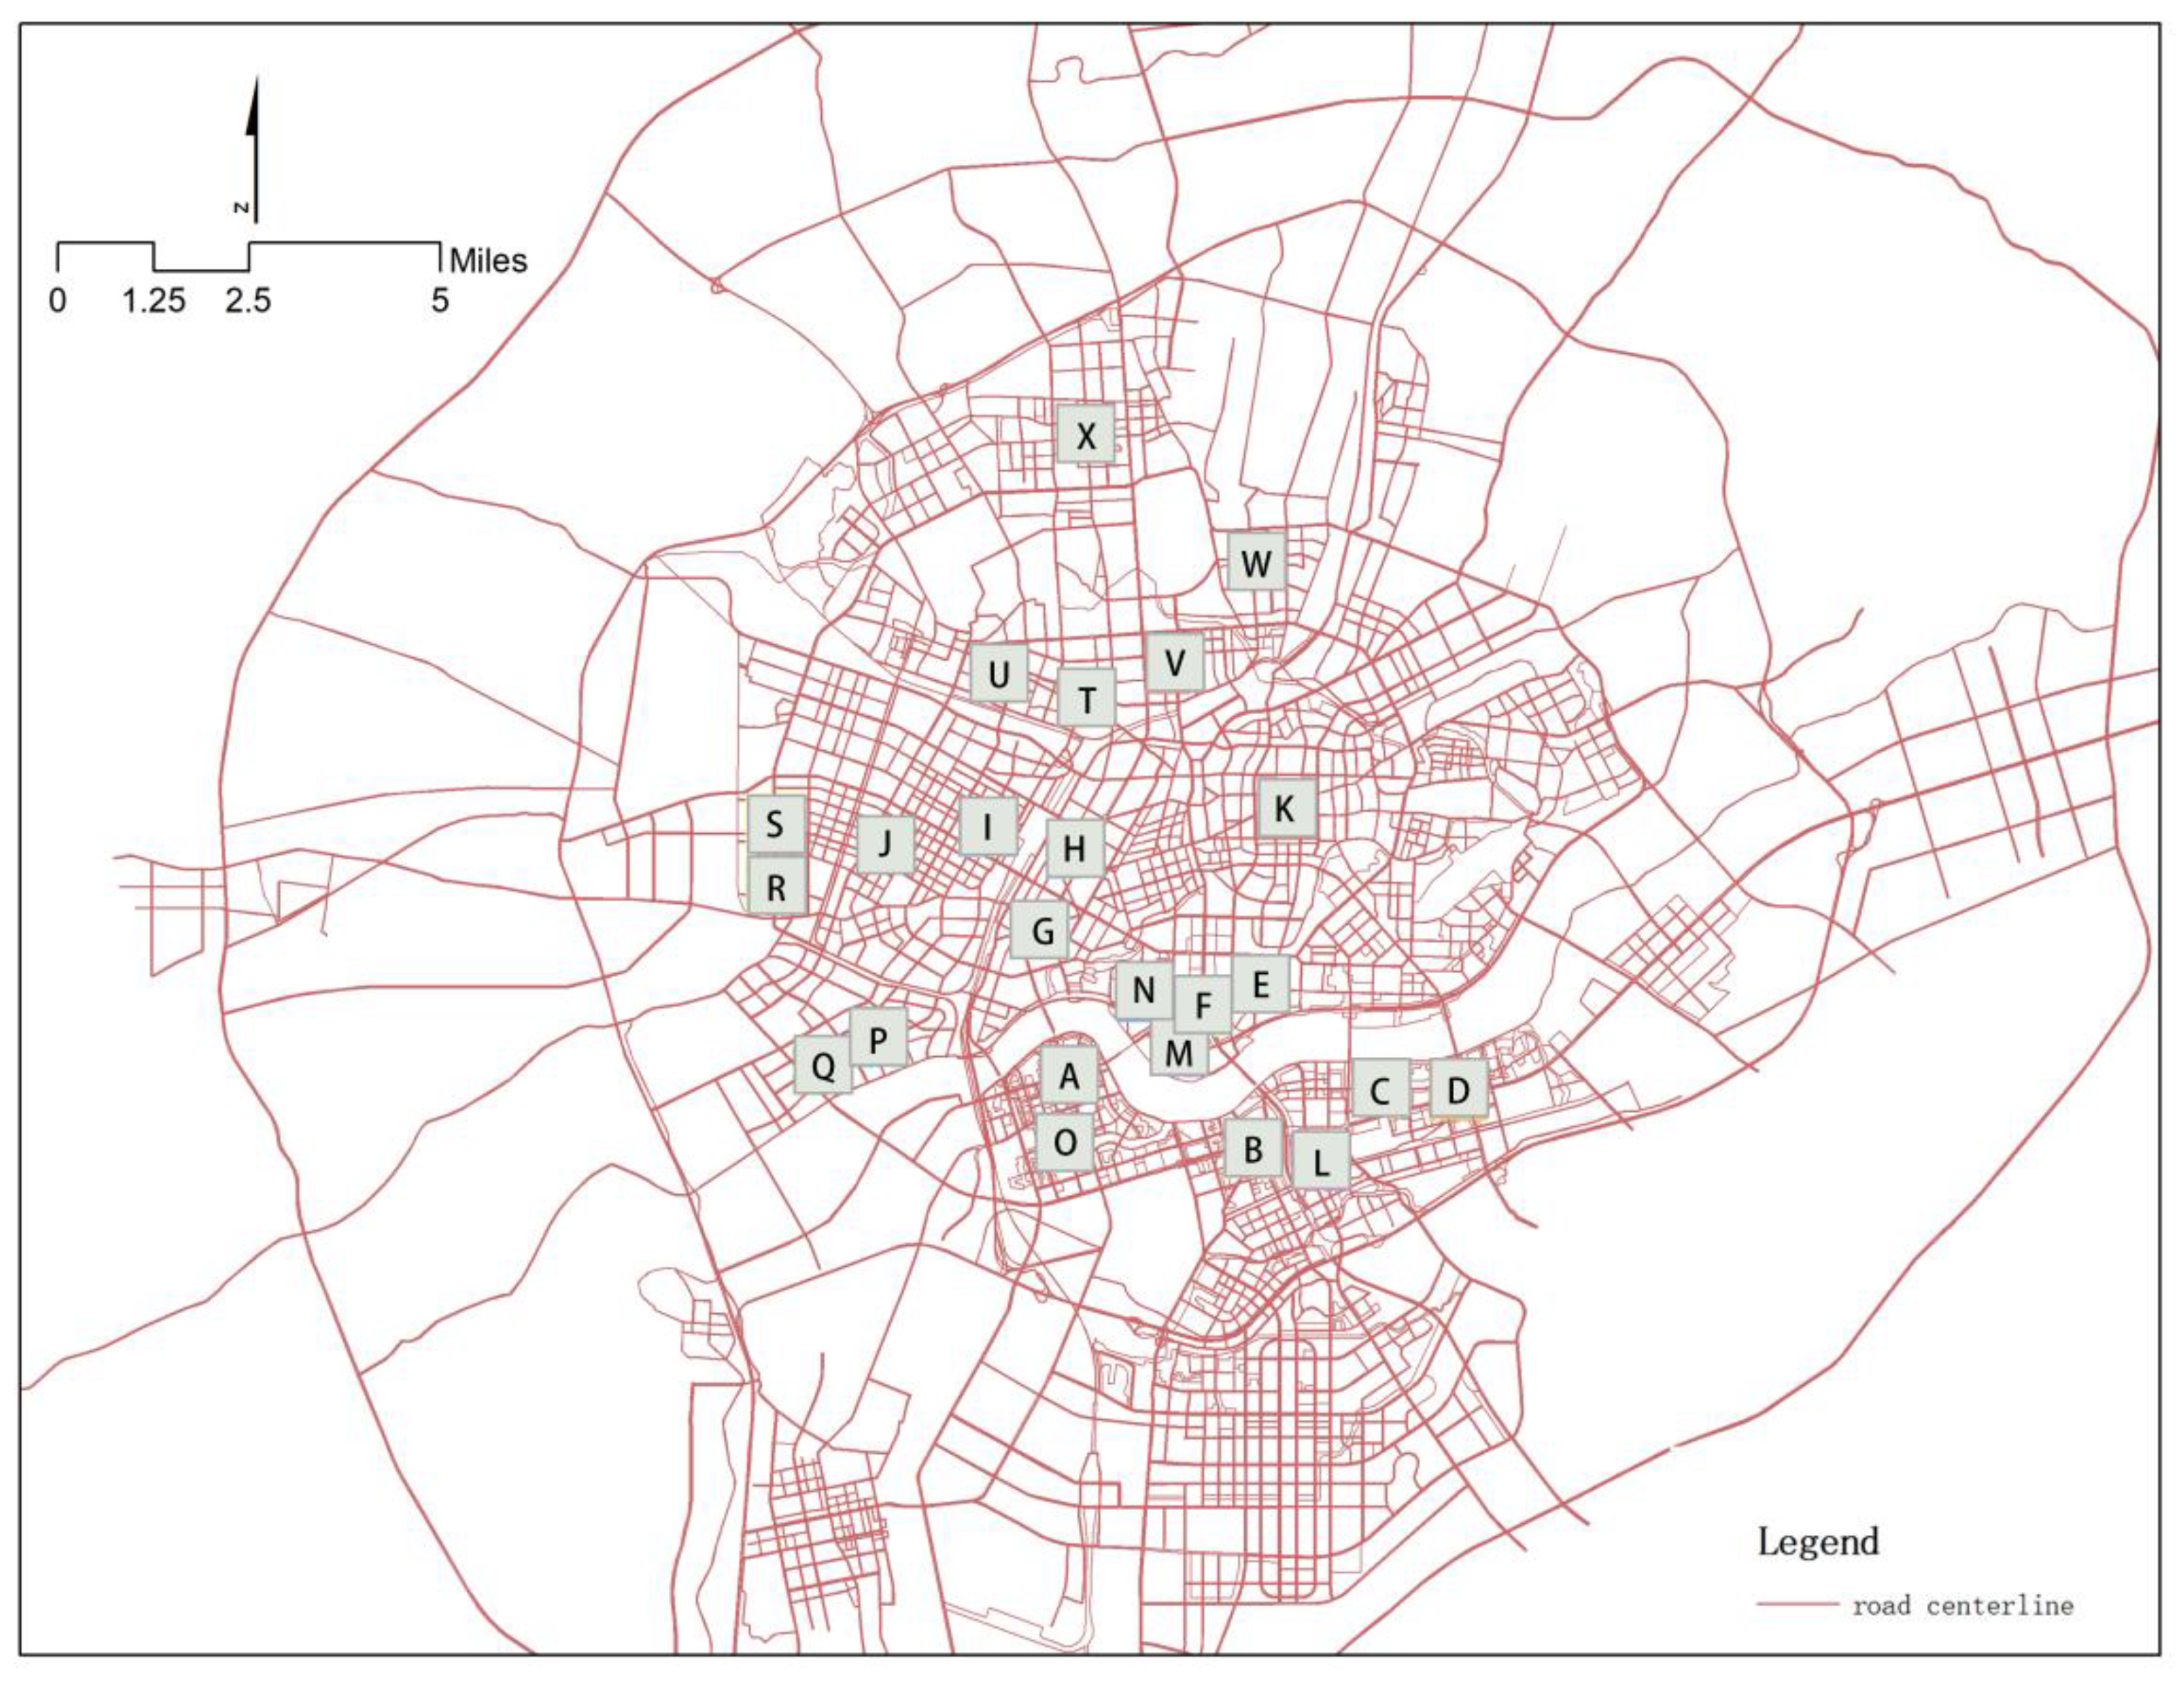
2.3. Object of Research

In this study, considering the natural boundaries, urban road separation, form integrity of the areas, etc., the study area was divided into 24 area units of 1.2 km × 1.2 km (labelled A–X) as sub-study areas for performing dimension calculations and analogy research, respectively (Table 1, Figure 2, Figure 3 and Figure 4).
The 24 sample areas selected in this study fully reflect the representative characteristics of the 3D fractal dimension values of city blocks in modern Shenyang. Furthermore, in order to further develop the concrete perception of the 3D fractal value of block form for the construction land index, this study further selected the space on both sides of Hunhe River in Shenyang (one river and two banks) as the research area of the visual form index. This area includes sample areas A, B, C, D, L, and O. By analyzing the clustering relationship between the main land use indicators and the spatial aggregation characteristics, this study explored the general law of modern urban form and guides the planning and design control. It should be pointed out that the study area on both sides of the Hunhe River includes the different morphological characteristics of the renewal and development of the old city (to the north of the river) and the construction of the new city (to the south of the river; Figure 2), and can provide fully representative comparison results of the dynamic evolution of modern urban form in Shenyang (Figure 3 and Figure 4).
In this study, the range selection of 3D box scale was based on the judgment of human experience, and the selected areas were based on the grid scale of urban trunk roads and neighborhoods. First, the side length of the 2D boxes of the 3D morphological patches were determined, along with the box height power law relationship according to the change in the urban building height. In the analysis, the average height was calculated from the building height data at different grid sizes. Selecting the average value more accurately reflected the actual space occupied by buildings of different heights, and it minimized the statistical error arising from a sudden change in building height (Table 2).

3. Fractal Dimension Results and Analysis

3.1. Fractal Dimension Results

The fractal dimension results for the 24 sub-research areas are presented below (Table 3 and Table 4).
The statistical analyses in Table 3 and Table 4 show that the coefficient of determination R2 of the 2D and 3D D values are all above 0.994. Table 5 contains the results of the 2D and 3D D values, floor-area ratio, building density, standard deviation of building floors, and the average number of floors for the sub-research areas.

3.2. Analysis of Fractal Results

First, the study found the 2D D values to correspond to the area of land use. The simulation Batty et al. [14] suggested D = 1.71 to be the expected value of the 2D urban fractal dimension. The 24 sub-research areas selected for this study were all blocks filled with buildings, so their 2D D values were relatively high, in the range of 1.78–1.97. Second, the 3D fractal dimension values reflect vertical morphological laws. Relevant studies regarding the 3D growth of modern cities have shown that a high D value is positively correlated with an unpleasant or merely satisfactory environment, and negatively correlated with an environment regarded as pleasant. The 3D D values of the sub-research areas in this study ranged between 2.41 and 2.70.
Upon comparing the results with those of relevant studies, it was noted that Chen and Liu, in their study on the fractal dimensions of various types of urban land use, found that the buildings for each land use type were lower than the overall fractal dimension of buildings, but the difference was only minor [49]. An analysis by Li and Zhang found that the fractal dimensions for the city of Zhengzhou in Henan Province were too high overall [31], with 2D fractal dimensions in the range of 1.9–2.0 and 3D fractal dimensions in the range of 2.9–3.0. The box dimensions obtained in Li and Zhang’s study were generally quite high. A study by Qin et al. found fractal dimensions of entire 3D scale-free areas, and of buildings with various functions, to be between 2.0 and 2.5 [23]; hence, they questioned whether there would be predetermined values for 3D fractal dimensions. The 3D D value results of 2.41–2.70 in this study reflect the relative appropriateness of the fractal relationship of the architectural form of Shenyang.
This study also analyzed the correlation between the 3D D values and the urban form measurement indicators of floor-area ratio, building density, standard deviation of building floors, and average number of floors for the sub-research areas. An analysis of the bivariate Pearson Correlation, using IBM SPSS Statistics, showed that the 2D D value is significantly correlated with building density and the standard deviation of building floors at the 0.01 level (two-tailed), and the 3D D value is significantly correlated with floor-area ratio and average number of floors at the 0.01 level (two-tailed). The results indicate that building density is the main correlation indicator of the 2D D value, and the standard deviation of building floors reflects the degree of change in building height. It also reflects changes in the density of buildings of different heights. The 3D D value reflects the degree of occupation of a city’s 3D space, which is perceived as a change in the density of the 3D vertical form of a city.
In this study, the changes in differences in 3D D value of form of each sub-study area were concretized, and the clustering morphological characteristics, based on the classification of floor area ratio, were proposed. As shown in Figure 5, by referring to the “Spacemate” method proposed by Metaberg Berghaus Pont of Delft University of Technology in the Netherlands, four indicators, namely the floor area ratio (FSI), building coverage rate (ground space index (GSI)), open space ratio (OSR), and average number of floors (L), were combined to establish a graph to evaluate the correlation between 3D D value and urban form. The difference in 3D D value in the vertical axis (FSI) was the most significant, with cluster intervals of 1.5–2.4, 2.4–4.5, and 4.5–6.5, respectively; the cluster intervals of the 3D D value were 2.47–2.53, 2.53–2.60, and 2.60–2.70, respectively. This study holds that the 3D fractal values of the 24 selected sub-study areas were significantly different, and it can be seen that the macro-measurement of the 3D D value of the overall urban form adopted by relevant literature cannot reflect the significant differences in micro-spatial form at the level of urban areas. The results showed that the low-density urban forms in Shenyang were mostly reflected in the range of 1.5–2.4, the high-density urban forms in Shenyang were between 2.4 and 4.5, and the cluster forms with urban agglomeration had a higher FSI of 4.5–6.5. It can be considered that the different density distribution states of modern cities can present different 3D fractal expectation values, and this range change can be understood as hierarchical differences in form among urban areas.

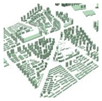
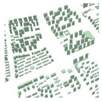
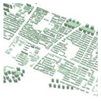
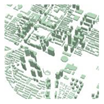
4. Description of Morphological Characteristics of Shenyang City Based on 3D Fractals

4.1. Form Hierarchy and System Embeddedness

The fractal characteristics of Shenyang’s urban form reflect the hierarchy of its overall morphology and self-similar morphological order, i.e., its hierarchical structure and self-similar recursion. The main layout logic of urban planning is to match centralized service efficiency with decentralized service demand, with urban public facilities usually configured hierarchically according to the size and scope of the population served, and with different systems of facilities coordinated to form a city’s spatial system. As a result, the spatial characteristics of an urban form inevitably reflect this morphological logic. In other words, the urban form is the result of the hierarchy’s embeddedness and repeated superposition of self-similar forms, as well as the spatial relationship of its layout organization. In summary, Shenyang’s urban form has the fractal characteristics of form hierarchy and system embeddedness, and the form hierarchy has clustering characteristics at different floor-area ratio intervals (see Figure 6).

4.2. Morphological and System Similarities

The self-similarity of the fractal structures means that the morphological structure follows a regular pattern. The modern urban form follows similar morphological patterns; for example, the layout of various urban land-use types, combinations of different functions, and organizational relationships of systems all have self-similarity, thereby generating diverse (but similar) urban forms. In a specific cluster interval, it is difficult to identify differences in the form of urban areas with similar box-counting dimensions simply from their density relationships. This indicates that standardized modern urban construction produces similar block forms which are difficult to distinguish. Thus, morphological and system similarities are common features of the modern urban form, and standardized construction methods make it difficult to develop modern cities with unique, readily distinguishable characteristics.

4.3. General Rules and Density Distribution of Shenyang’s Matrix Morphology

The 3D fractal dimension of a city reflects the 3D boxes occupying vertical height and corresponds to a patchwork of varying building heights in an actual urban form. The matrix morphology of a modern city is gradually shaped and controlled by unified norms and general rules, and different box dimension values reflect the morphological results of development in different urban areas. In addition, under different density relationships, higher D values are associated with unsatisfactory environments, and urban areas with high D values are more likely to contain unsuitable spaces (see Figure 7). Therefore, during urban planning, especially in areas controlled by general rules, land-use control at the micro-scale should be considered to create appropriate densities in urban areas.

5. Conclusions and Discussion

5.1. Conclusions

This study calculated the 3D fractal dimensions of 24 urban areas in Shenyang, Northeast China. The following results showed the following:
(1)
The 3D D values of the 24 sub-study areas varied from 2.41 to 2.70, and the 2D D values varied from 1.78 to 1.97. D value results between 2.41 and 2.70 can reflect the relative suitability of the fractal relationships between urban building forms in Shenyang;
(2)
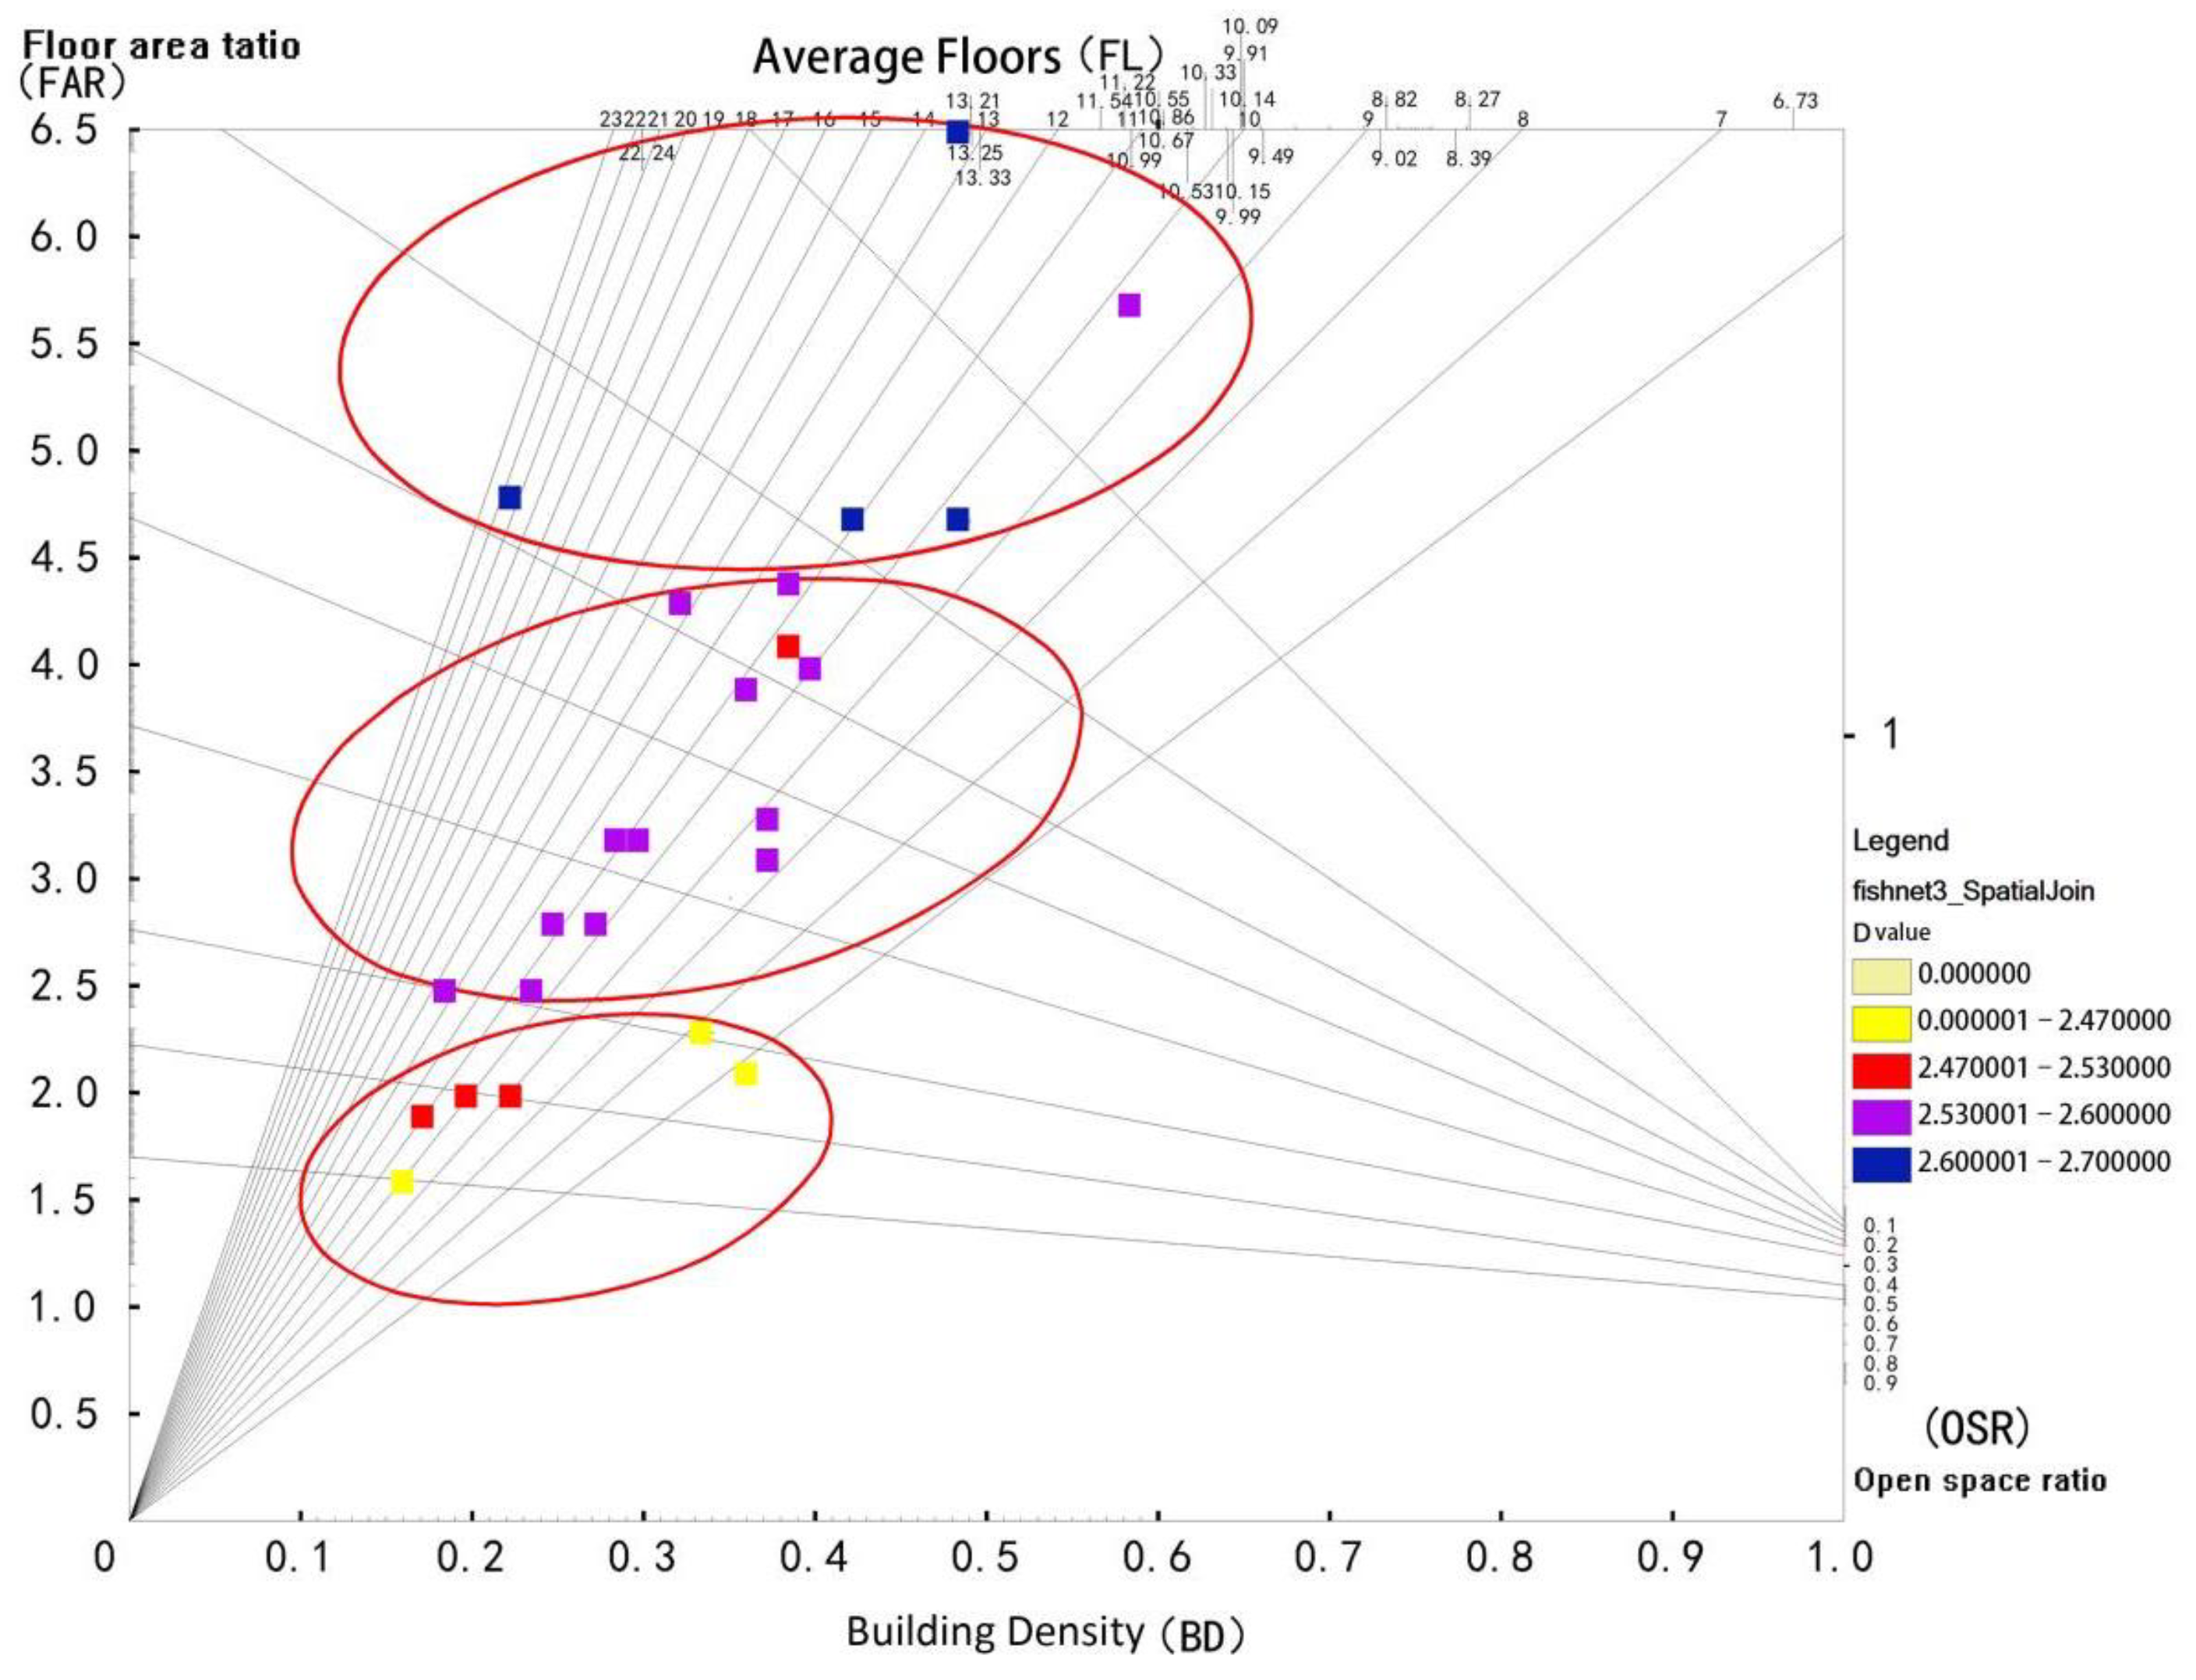
Shenyang’s urban form has the fractal characteristics of morphological hierarchy and system embeddedness, and the correlation between the fractal dimension and floor-area ratio can be divided into three cluster intervals: 2.47–2.53, 2.53–2.60, and 2.60–2.70;
(3)
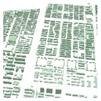
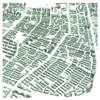
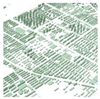
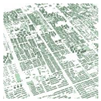
Through the analysis of the 3D fractal dimension value and its clustering characteristics, it can be seen that, under the construction rules of modern Chinese cities, the urban form will inevitably acquire the density morphological characteristics of 3D growth, similar forms, and density distribution. That is, the modern urban form is characterized by the spatial accumulation of clusters and patches of various forms, generally shaping the dense morphological characteristics of scattered height and density distribution. The density distribution of different areas produces different 3D fractal dimension results;
(4)
The research of this study shows that a new perspective of modern urban morphology research can be established through the study of 3D fractal at the meso-microscopic scale. At the theoretical level, the morphological phenomenon of fractal city can be identified and described, and its planning principles can be explained through its construction rules. In terms of design control, the appropriate index features of the three-dimensional fractal box can be used as a reference for design review.

5.2. Discussion

(1)
Different results for 3D fractal dimension values reflect the overall occupancy degree of the density relationship of morphology patches of urban areas in 3D space, and the spatial distribution of density patterns is highly correlated with the 3D growth degree and fractal dimension values. Therefore, in the form control of urban design, it is necessary to actively control the density relationship of urban matrix forms, and the index control of regulatory detailed planning can directly affect the form results of modern cities;
(2)
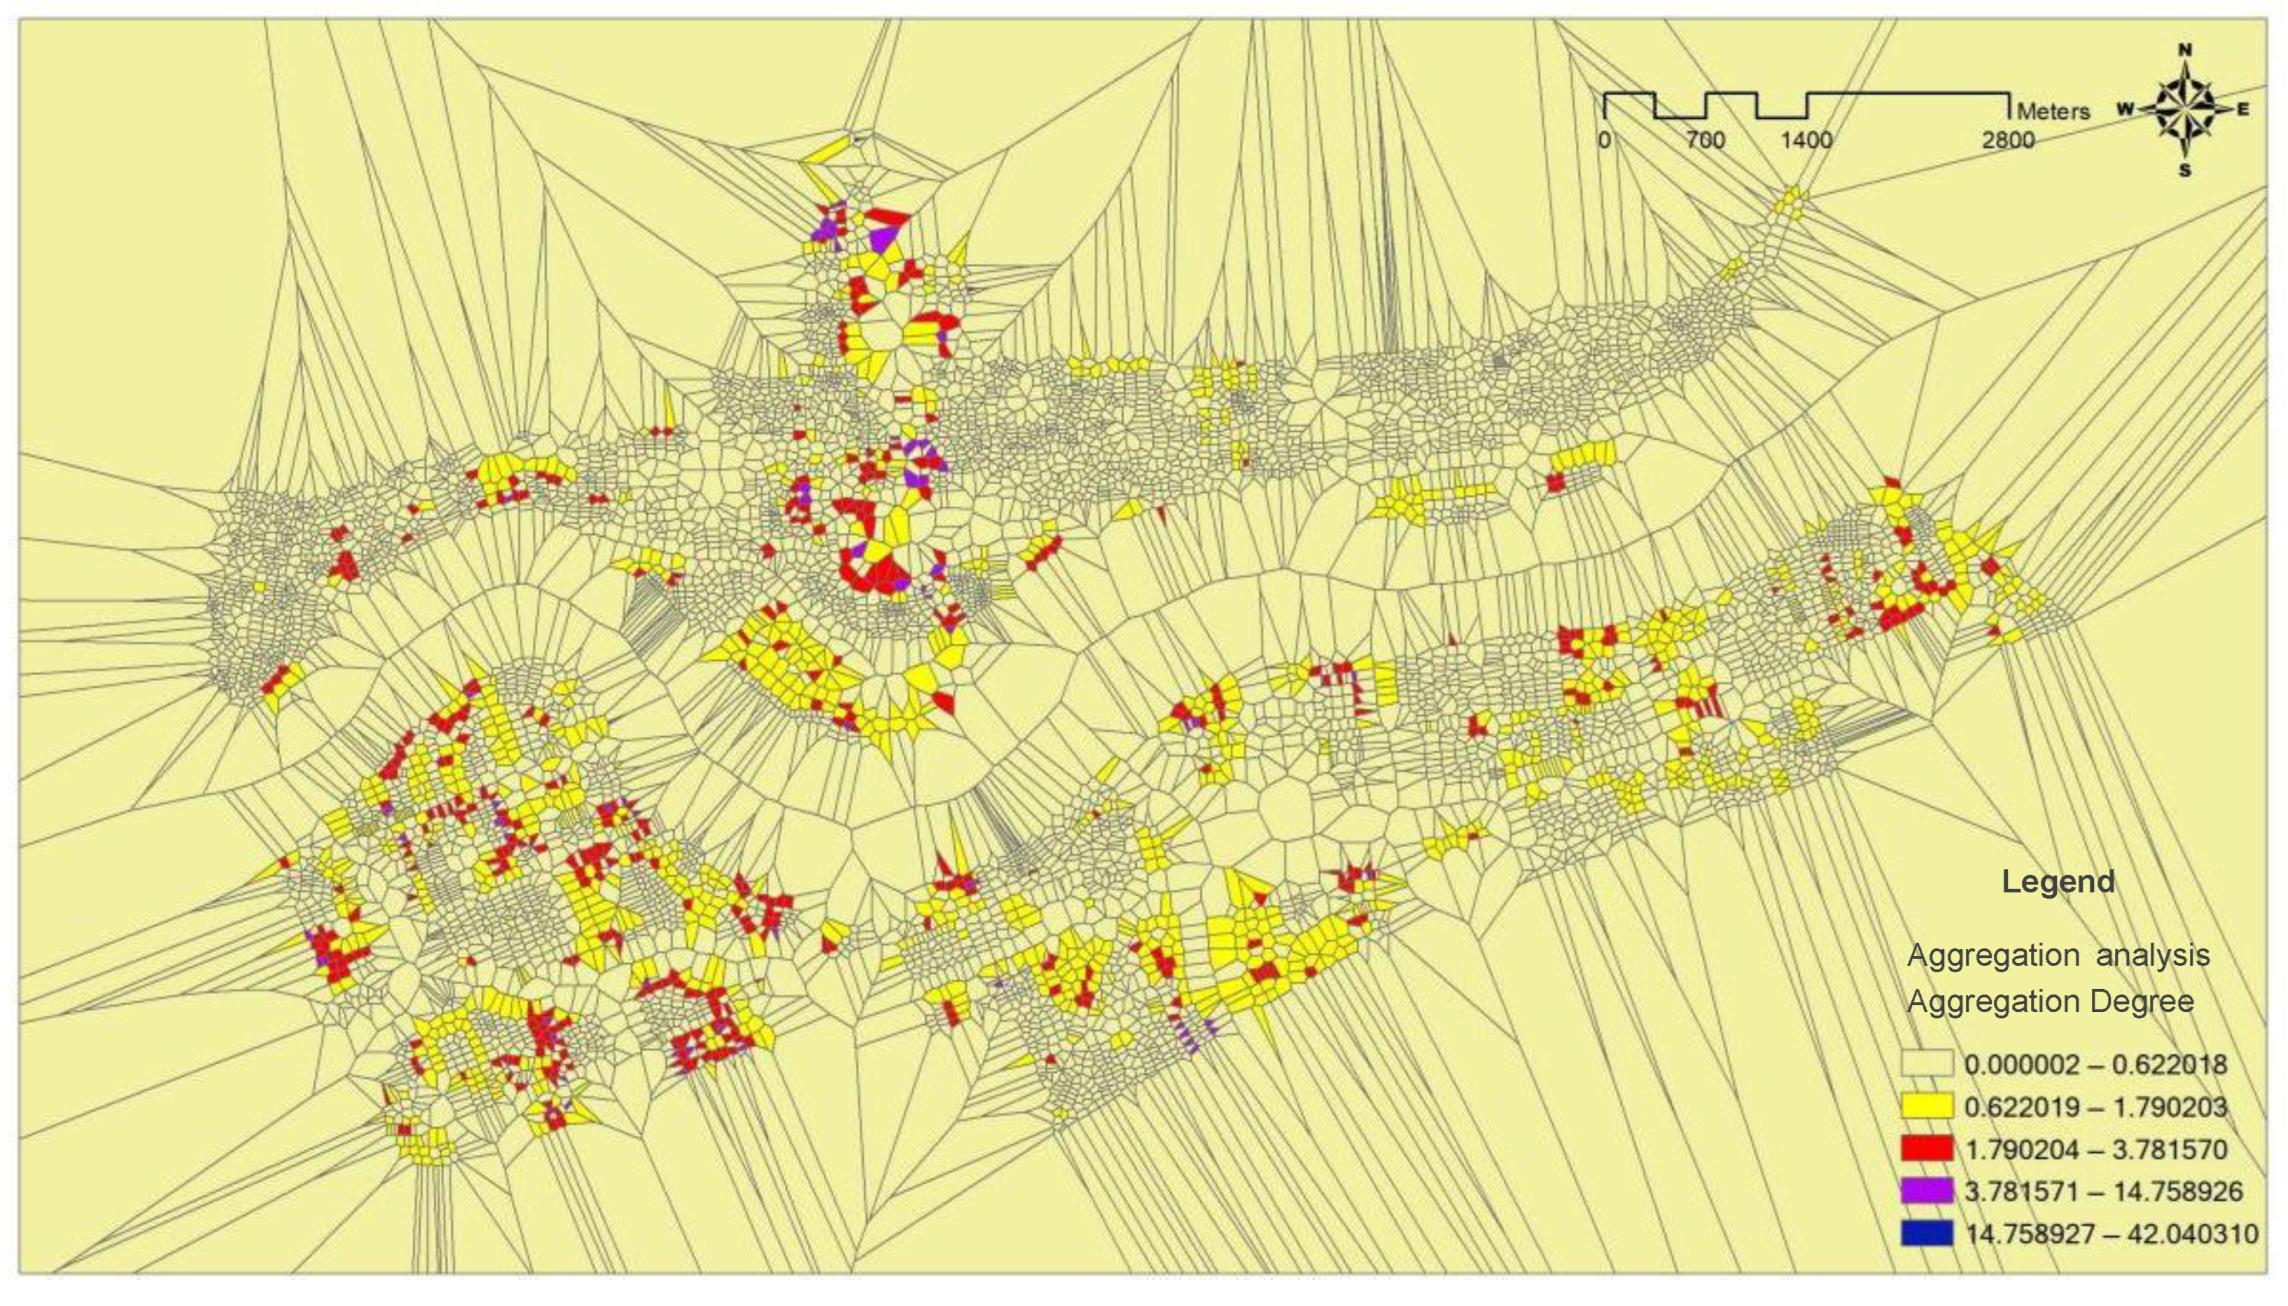
Natural or anthropogenic factors, such as rivers, green spaces, and railways, are important determinants of spatial agglomeration. However, in this study, the linear elements of cities, such as rivers and railways, are regarded as separation boundaries between areas, rather than the main spatial elements of block forms. This study investigated some morphological areas under centralized construction to reflect the influences of development and construction indexes on the 3D fractal characteristics of modern cities;
(3)
The description of the basic characteristics of modern urban forms can be analyzed based on the measurement results of morphological fractal dimension values of urban 3D areas in Shenyang. Range differences between the current results and that of previous studies are mainly reflected in the setting of measurement parameters and the precision of research objects. By comparing current and previous results, this study concluded that the density form of a modern city can be characterized as either dense or gradual. The dense form has a high degree of order and dense space, associated with feelings of restlessness, excitement, oppression, and vigor. This form also leads to deterioration in urban environment quality, insufficient facilities and services, and aesthetic fatigue. The gradual form has obvious balance and order, and an appropriate spatial scale. It is associated with peace, quiet, comfort, and pleasant aesthetic experiences. Thus, the form relationships of spatial details are highly correlated with people’s perceptual experiences;
(4)
Modern urban form has the characteristics of strip and block division in terms of land use, significant spatial differentiation, and random differences in density, among others. These factors contribute to the regional distribution of similar density form relationships. This study holds that this description reveals the typical characteristics of the modern urban form, which is also the main reason for the similarity between modern urban spaces. Therefore, targeted research on the spatial order of density forms should be conducted. For example, the typological characteristics of density forms in different areas can be studied further to inform the planning and design guidelines for specific spatial units. At the same time, the control of urban form should be scientifically guided, not only from the perspective of spatial perception, but also from the perspective of digital rationality, based on the scale of cities and their morphological relationships.

Author Contributions

Conceptualization, S.L.; methodology, S.L.; software, S.L.; validation, S.L.; formal analysis, S.L.; investigation, Y.C.; resources, S.L.; data curation, S.L. and Y.C.; writing—original draft preparation, Y.C.; writing—review and editing, S.L. and Y.C.; visualization, Y.C.; supervision, S.L.; project administration, S.L.; funding acquisition, S.L. All authors have read and agreed to the published version of the manuscript.

Funding

This work was funded by the Liaoning Planning Fund Project of Philosophy and Social Science, Liaoning Provincial Office of Social Science Planning, grant number: No. L20CGL004.

Institutional Review Board Statement

Not applicable.

Informed Consent Statement

Not applicable.

Data Availability Statement

The data presented in this study are available on request from the corresponding author. The data are not publicly available due to privacy reasons.

Acknowledgments

We thank Ma Fangfang for the early data analysis.

Conflicts of Interest

The authors declare no conflict of interest.

References

  1. Mohajeri, N.; Longley, P.A.; Batty, M. City shape and the fractality of street patterns. Quaest. Geogr. 2012, 31, 29–37. [Google Scholar] [CrossRef] [Green Version]
  2. Mandelbrot, B.B. How long is the coast of Britain? Statistical self-similarity and fractional dimension. Science 1967, 156, 636–638. [Google Scholar] [CrossRef] [PubMed] [Green Version]
  3. Wang, Q.H. Quantitative Analysis of Urban Skyline Based on Fractal Theory. Master’s Thesis, Jiangxi University of Science and Technology, Ganzhou, China, 2020. [Google Scholar]
  4. Batty, M.; Zhao, Y.C.; Sutton, C. Fractals—Geometry between dimensions. World Sci. 1986, 12, 19–22. (In Chinese) [Google Scholar]
  5. Batty, M.; Longley, P.A. Fractal Cities: A Geometry of Form and Function; Academic Press: London, UK, 1994. [Google Scholar]
  6. Frankhauser, P. La Fractalitédes. Structures Urbaines; Anthropos: Paris, UK, 1994. [Google Scholar]
  7. Qi, L.B.; Wang, H.Y.; Li, Y.P. A Preliminary Study on the Design Idea of “Fractal Residential District” Based on the Concept of “Fractal City”. J. Zhejiang Univ. (Sci. Ed.) 2007, 2, 233–240. (In Chinese) [Google Scholar]
  8. Chen, Y.; Ai, N.S. Fractal research on urban structure. Geogr. Territ. Res. 1994, 4, 35–41. (In Chinese) [Google Scholar]
  9. Feng, J.; Chen, Y. Spatiotemporal evolution of urban form and land-use structure in Hangzhou, China: Evidence from fractals. Environ. Plan. B Urban Anal. City Sci. 2010, 37, 838–856. [Google Scholar] [CrossRef]
  10. Xu, J.; Mei, A.; Wu, J.; Xiong, Y. Quantitative analysis and fractal modeling on the landscape mosaic and its evolutionary process of Shanghai in the period from 1947–1996. Ecol. Sci. 2002, 21, 131–137. (In Chinese) [Google Scholar]
  11. Frankhauser, P. Comparing the morphology of urban patterns in Europe: A fractal approach. European Cities-Insights and Outskirts. Rep. COST Action 2004, 2, 79–105. [Google Scholar]
  12. Czamanski, D.; Benguigui, L.; Marinov, M.; Portugali, Y. When and where is a city fractal? Environ. Plan. B 2000, 27, 507–519. [Google Scholar]
  13. Fan, L.; Hu, R.; Zhang, X.; Wang, S.; Yuan, Y. Calculation of 3D Box Dimension of River System Based on GIS and DEM. Geogr. Geo-Inf. Sci. 2012, 28, 28–30. [Google Scholar]
  14. Arlinghaus, S.L.; Arlinghaus, W.C. The fractal theory of central place geometry: A diophantine analysis of fractal generators for arbitrary Löschian Numbers. Geogr. Anal. 1989, 21, 103–121. [Google Scholar] [CrossRef]
  15. Apostolos, L. Fractal analysis of the urbanization at the outskirts of the city: Models, measurement and explanation. Cybergeo 2007. [Google Scholar] [CrossRef]
  16. Wang, C.P.; Wang, H.W.; Li, C.M.; Dong, R.C. Analysis of spatial expansion characteristics of major urban agglomerations in China based on DMSP/OLS image. J. Ecol. 2012, 32, 942–954. [Google Scholar]
  17. Frankhauser, P. GIS and the Fractal Formalisation of Urban Patterns: Towards a New Paradigm for Spatial Analysis? In Spatial Models and GIS: New Potential and New Models; Fotheringham, A.S., Wegener, M., Eds.; Taylor and Francis: London, UK, 2000; pp. 121–142. [Google Scholar]
  18. Ye, J.; Chen, B. Application of fractal theory in urban research. Urban Plan. Forum 2001, 4, 38–42. (In Chinese) [Google Scholar]
  19. Bovill, C. Fractal Geometry in Architecture and Design; Birkhauser: Boston, MA, USA, 1996. [Google Scholar]
  20. Crompton, A. The fractal nature of the everyday environment. Environ. Plan. B Plan. Des. 2001, 28, 243–254. [Google Scholar] [CrossRef]
  21. Caruso, G.; Cavailhès, J.; Peeters, D.; Thomas, I. Greener and larger neighbourhoods make cities more sustainable! A 2D urban economics perspective. Comput. Environ. Urban Syst. 2015, 54, 82–94. [Google Scholar] [CrossRef]
  22. Oppong, R.A.; Marful, A.B.; Asare, E.S. Improving urban visibility through fractal analysis of street edges: The case of John Evans Atta Mills High Street in Accra, Ghana. Front. Archit. Res. 2017, 6, 248–260. [Google Scholar] [CrossRef]
  23. Lee, J.; Kurisu, K.; An, K.; Hanaki, K. Development of the compact city index and its application to Japanese cities. Urban Stud. 2015, 52, 1054–1070. [Google Scholar] [CrossRef]
  24. Rahman, H.; Islam, H.; Neema, M.N. GIS-based compactness measurement of urban form at neighborhood scale: The case of Dhaka, Bangladesh. Urban Manag. 2021. [Google Scholar] [CrossRef]
  25. Southworth, M.; Owens, P.M. The evolving metropolis: Studies of community, neighborhood, and street form at the urban edge. J. Am. Plan. Assoc. 1993, 59, 271–287. [Google Scholar] [CrossRef]
  26. Song, Y.; Popkin, B.; Gordon-Larsen, P. A national-level analysis of neighborhood form metrics. Landsc. Urban Plan. 2013, 116, 73–85. (In Chinese) [Google Scholar] [CrossRef] [PubMed] [Green Version]
  27. Qin, J.; Fang, C.; Wang, Y.; Li, Q.; Zhang, Y. A three dimensional box-counting method for estimating fractal dimension of urban form. Geogr. Res. 2015, 34, 85–96. (In Chinese) [Google Scholar]
  28. Qiao, W.F.; Liu, Y.S.; Wang, Y.H.; Lu, Y.Y. The three-dimensional spatial expansion characteristics of Nanjing since 2000. Geogr. Res. 2015, 34, 666–676. (In Chinese) [Google Scholar]
  29. Yang, J.; Guo, A.D.; Xi, J.C.; Ge, Q.S.; Li, X.M. Research on the temporal and spatial differentiation characteristics of urban three-dimensional landscape pattern: A case study of Zhongshan District in Dalian City. Acta Geogr. Sin. 2017, 72, 646–656. (In Chinese) [Google Scholar]
  30. Crompton, A. Fractals and Picturesque Composition. Environ. Plan. B Urban Anal. City Sci. 2002, 29, 451–459. [Google Scholar] [CrossRef]
  31. Li, Y.T.; Zhang, L.J. Fractal research on urban spatial morphology based on three-dimensional box dimension algorithm. Mod. City Res. 2019, 4, 92–99. (In Chinese) [Google Scholar]
  32. Jiang, S.; Zhou, Y. The fractal urban form of Beijing and its practical significance. Geogr. Res. 2006, 25, 204–212. [Google Scholar]
  33. Stamps, A.E. Fractals, skylines, nature and beauty. Landsc. Urban Plan. 2002, 60, 163–184. [Google Scholar] [CrossRef]
  34. Batty, M.; Xie, Y. Preliminary Evidence for a Theory of the Fractal City. Environ. Plan. A Econ. Space 1996, 28, 1745–1762. [Google Scholar] [CrossRef]
  35. Gligor, L.; Gligor, M. The fractal city theory revisited: New empirical evidence from the distribution of Romanian cities and towns. Nonlinear Dyn. Psychol. Life Sci. 2008, 12, 15–28. [Google Scholar]
  36. Sadeghi, G.; Li, B. Urban Morphology: Comparative Study of Different Schools of Thought. Curr. Urban Stud. 2019, 7, 562–572. [Google Scholar] [CrossRef] [Green Version]
  37. Ljiljana, P.; Mirjana, D.; Bojan, M. Self-replicating systems in spatial form generation: The concept of cellular automata. Spatium 2009, 19, 8. [Google Scholar] [CrossRef]
  38. Longley, P.A.; Mesev, V. Measurement of density gradients and space-filling in urban systems. Pap. Reg. Sci. 2002, 81, 1–28. [Google Scholar] [CrossRef]
  39. Wheeler, S.M. The evolution of urban form in Portland and Toronto: Implications for sustainability planning. Local Environ. Int. J. Justice Sustain. 2003, 8, 317–336. [Google Scholar] [CrossRef]
  40. Song, Y.; Knaap, G.J. Quantitative classification of neighbourhoods: The neighbourhoods of new single-family homes in the Portland metropolitan area. J. Urban Des. 2007, 12, 1–24. [Google Scholar] [CrossRef]
  41. Wang, H.W.; Qiu, Q.Y.; Wang, C.P.; Dong, R.C. Application of coupling technology of fractal and cellular automata to urban ecological planning in Xiamen. Environ. Sci. Technol. 2012, 35, 168–172. [Google Scholar]
  42. Cai, C.Y.; Guo, Z.F.; Zhang, B.Z.; Wang, X.; Li, B.; Tang, P. Urban morphological feature extraction and multi-dimensional similarity analysis based on deep learning approaches. Sustainability 2021, 13, 6859. [Google Scholar] [CrossRef]
  43. White, R.; Engelen, G. Cellular automata and fractal urban form: A cellular modelling approach to the evolution of urbanland-use patterns. Environ. Plan. A 1993, 25, 1175–1199. [Google Scholar] [CrossRef] [Green Version]
  44. Xie, P.; Yang, J.; Sun, W.; Xiao, X.; Xia, J.C. Urban scale ventilation analysis based on neighborhood normalized current model. Sustain. Cities Soc. 2022, 80, 103746. [Google Scholar] [CrossRef]
  45. Falconer, K. Fractal Geometry: Mathematical Foundations and Applications; Northeastern University Press: Shenyang, China, 1990. (In Chinese) [Google Scholar]
  46. Frankhauser, P. Fractal geometry of urban patterns and their morphogenesis. Discret. Dyn. Nat. Soc. 1998, 2, 127–145. [Google Scholar] [CrossRef]
  47. Frankhauser, P. La formation fractale des tissus urbains. Cah. Géographie Québec 1998, 42. [Google Scholar] [CrossRef] [Green Version]
  48. Tian, D.R. Research on the Urban Spatial Form and Planning Method of the Loess Plateau in Northern Shaanxi Based on Fractal Landform—Taking Mizhi Gully Area as an Example. Xi’an Univ. Archit. Technol. 2016, 4, 102–105. [Google Scholar]
  49. Chen, Y.G.; Liu, M.H. The law of entropy value of urban land use structure. Hum. Geogr. 2001, 16, 20–24. (In Chinese) [Google Scholar]
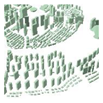
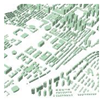
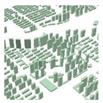
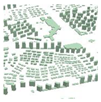
Figure 1. Shenyang city satellite map. Source: Google Maps.
Buildings 12 00299 g001
Figure 2. Schematic diagram of the location of 24 research samples in the city. Prepared by the authors.
Buildings 12 00299 g002
Figure 3. Visual accumulation of urban three-dimensional form from sample area L to sample area F. Source: Visual China Group.
Buildings 12 00299 g003
Figure 4. Local three-dimensional urban form in sample area A. Prepared by the authors.
Buildings 12 00299 g004
Figure 5. Clustering of 3D D values of sub-research areas. Prepared by the authors.
Buildings 12 00299 g005
Figure 6. Sketch map of the density morphological characteristics in the study areas along the banks of Shenyang River. Source: Visual China Group.
Buildings 12 00299 g006
Figure 7. Aggregation degree analysis of fractal morphology on density morphological characteristics of the study area. Source: Authors.
Buildings 12 00299 g007
Table 1. Three-dimensional forms of the sub-research areas.
ABCDEF
Buildings 12 00299 i001 Buildings 12 00299 i002 Buildings 12 00299 i003 Buildings 12 00299 i004 Buildings 12 00299 i005 Buildings 12 00299 i006
GHIJKL
Buildings 12 00299 i007 Buildings 12 00299 i008 Buildings 12 00299 i009 Buildings 12 00299 i010 Buildings 12 00299 i011 Buildings 12 00299 i012
MNOPQR
Buildings 12 00299 i013 Buildings 12 00299 i014 Buildings 12 00299 i015 Buildings 12 00299 i016 Buildings 12 00299 i017 Buildings 12 00299 i018
STUVWX
Buildings 12 00299 i019 Buildings 12 00299 i020 Buildings 12 00299 i021 Buildings 12 00299 i022 Buildings 12 00299 i023 Buildings 12 00299 i024
Table 2. Power law relationship between grid size r and 3D box height.
Grid Size r (m)12006003001507537.518.75
Box height300/21300/22300/23300/24300/25300/26300/27
1507537.518.759.3754.6882.344
Table 3. Summary of results for various sizes of 2D boxes for the sub-research areas.
Grid Size r (m)12006003001507537.518.75
ANon-empty boxes N1416632377762191
BNon-empty boxes N1416642286201851
CNon-empty boxes N1416582016761736
DNon-empty boxes N1416632066761620
ENon-empty boxes N1416642398482738
FNon-empty boxes N1416602147072118
GNon-empty boxes N1416642509723397
HNon-empty boxes N1416632478832890
INon-empty boxes N1416642569713050
JNon-empty boxes N1416642569913470
KNon-empty boxes N1416642499573391
LNon-empty boxes N1416622126101600
MNon-empty boxes N1415561885621597
NNon-empty boxes N1416632337952346
ONon-empty boxes N1416592036661913
PNon-empty boxes N1416642417532027
QNon-empty boxes N1416632407872199
RNon-empty boxes N1416642529442900
SNon-empty boxes N1416642559282982
TNon-empty boxes N1416642569963465
UNon-empty boxes N1416642539372855
VNon-empty boxes N1416642408462754
WNon-empty boxes N1416642549382824
XNon-empty boxes N1416642529452804
Table 4. Summary of results for various sizes of 3D boxes for the sub-research areas.
Grid Size r (m)12006003001507537.518.75
Box Height (m)300/21300/22300/23300/24300/25300/26300/27
ANon-empty boxes N14231621067648133,048
BNon-empty boxes N14161131232682230,851
CNon-empty boxes N141776736476122,290
DNon-empty boxes N142197971525225,113
ENon-empty boxes N142169566353421,852
FNon-empty boxes N14221091157696037,731
GNon-empty boxes N1418134918687221,060
HNon-empty boxes N14231621163796851,312
INon-empty boxes N1418127902623238,073
JNon-empty boxes N1417138981722249,455
KNon-empty boxes N1416118774563539,316
LNon-empty boxes N1448322202711,32554,575
MNon-empty boxes N15151871151636331,342
NNon-empty boxes N141692645412222,943
ONon-empty boxes N1423153889527826,794
PNon-empty boxes N1422133977581028,272
QNon-empty boxes N14241651137728436,176
RNon-empty boxes N1416122800568633,261
SNon-empty boxes N1416115770528332,322
TNon-empty boxes N1417136961712147,104
UNon-empty boxes N14221411014697140,573
VNon-empty boxes N14211601064699541,339
WNon-empty boxes N14221621154822345,713
XNon-empty boxes N1418135969691836,849
Table 5. Statistics of 2D and 3D fractal dimensions of neighborhoods.
IndicatorsABCDEFGHIJKL
Two-dimensional D values1.871.831.811.801.911.851.961.931.951.971.961.79
Three-dimensional D values2.572.552.472.502.412.602.512.662.592.652.582.70
Floor area ratio2.742.471.601.842.134.244.046.483.284.675.524.78
Building density0.270.240.160.170.360.320.390.490.370.420.580.22
Standard deviation of floors11.5012.608.6910.064.8615.806.5912.737.554.714.7026.49
Average floors10.1510.149.9110.555.8713.2110.3313.258.8210.999.4922.24
IndicatorsMNOPQRSTUVWX
Two-dimensional D values1.781.881.831.861.871.941.941.971.931.921.931.93
Three-dimensional D values2.562.462.502.532.592.562.552.592.582.582.602.58
Floor area ratio2.492.282.021.962.802.913.114.013.164.363.883.14
Building density0.190.340.200.220.250.350.370.400.300.380.360.29
Standard deviation of floors14.877.4910.6811.2311.024.464.346.9610.231114.346.57
Average floors13.336.739.999.0211.128.278.3910.0910.5311.5410.8610.67
Publisher’s Note: MDPI stays neutral with regard to jurisdictional claims in published maps and institutional affiliations.

