
Soil Enzyme Activity Response under the Amendment of Different Types of Biochar


Abstract
:1. Introduction
2. Materials and Methods
2.1. Materials and Experimental Setup
- S—soil without biochar;
- S + MC—soil mixed with mellow compost BC;
- S + MSS—soil mixed with sewage sludge BC;
- S + PS—soil mixed with pine sawdust BC;
- S + SS—soil mixed with sycamore sawdust BC;
- S + OL—soil mixed with oak leaves BC.
2.2. Analysis
2.2.1. Physico-Chemical Properties
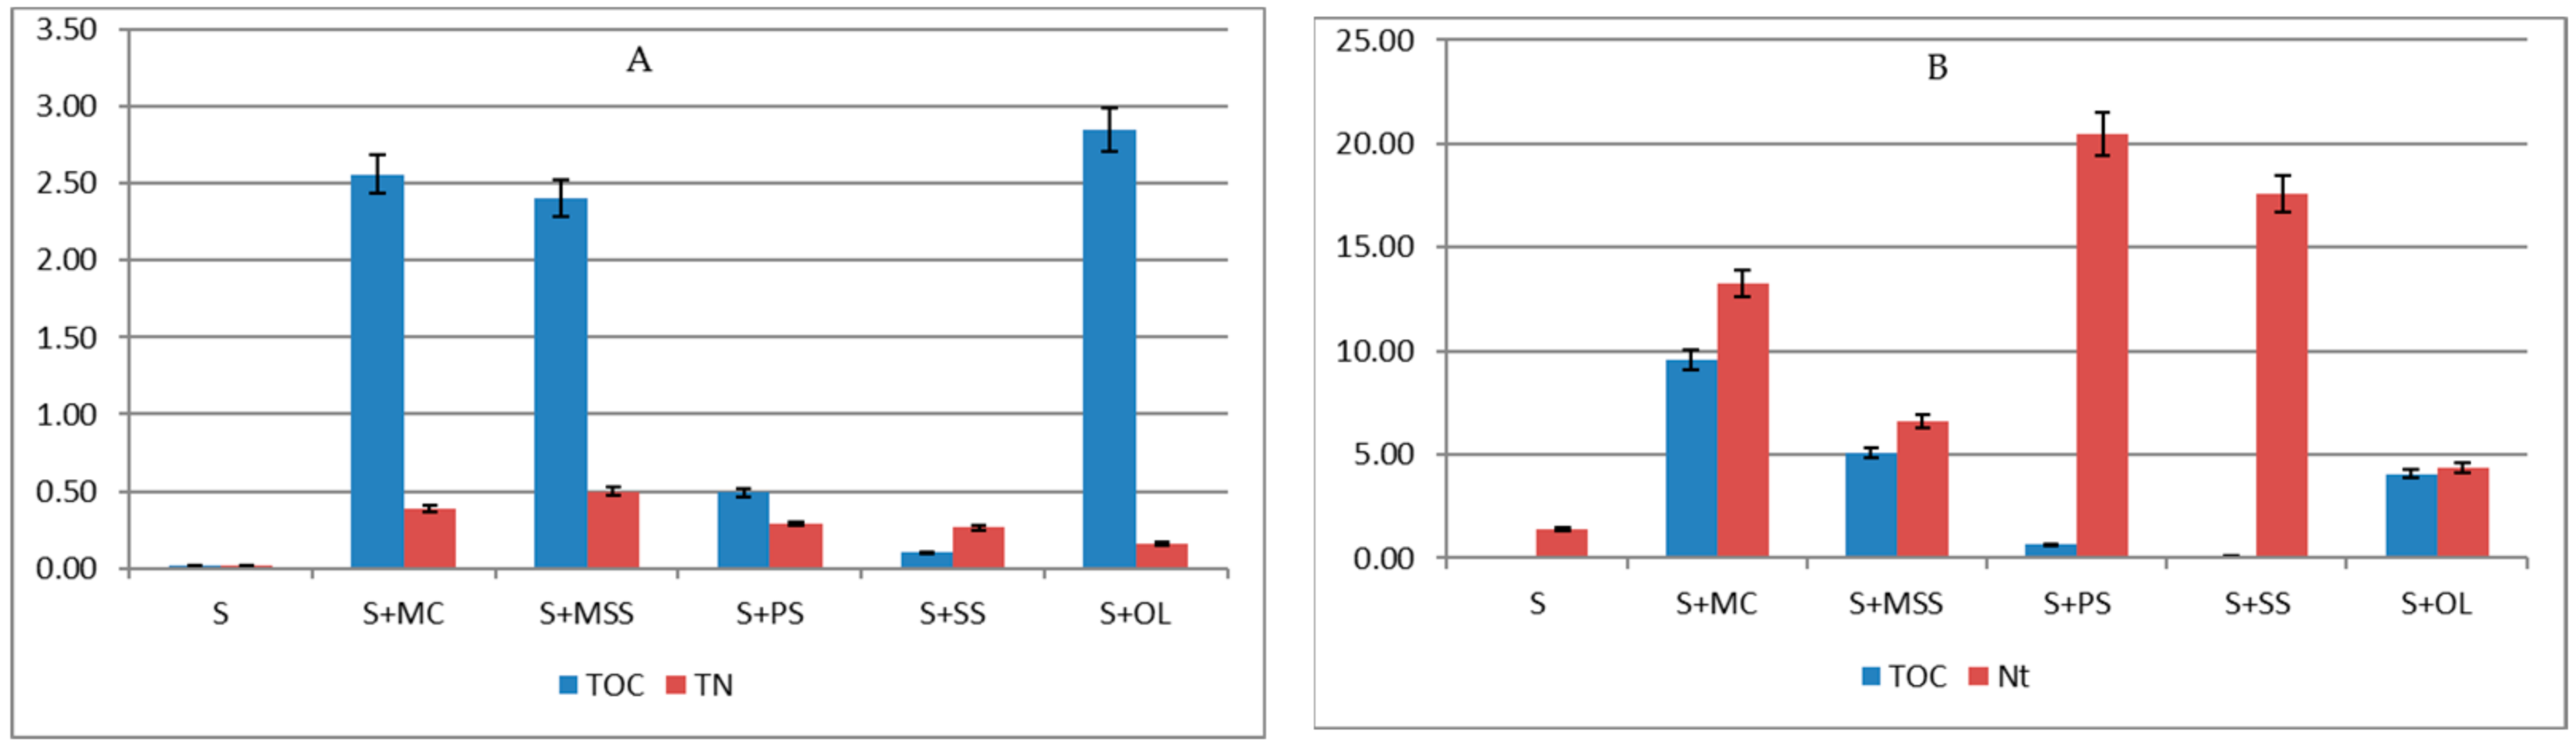
- The contents of total organic carbon (TOC) and total nitrogen (TN) were assayed with the Vario Max CN analyzer provided by company Elementar (Langenselbold, Germany). The content of TOC and Nt was expressed in g kg−1 of d.m. of soil.
- The content of dissolved organic carbon (DOC) and dissolved nitrogen (DTN), in samples after incubation, were assayed in the solutions from the extraction of soil samples of 0.004 mol dm−3 CaCl2, at the ratio of soil sample: extractant of 1:50. Extraction took 1 h, and then, the solution was centrifuged. The content of DOC and DTN was assayed with Multi N/C 3100 Analityk Jena (Jena, Germany) analyzer and expressed in mg kg−1 d.m. of the soil sample, as well as the percentage share in the pool: TOC and TN, respectively.
- pH in H2O was determined with a potentiometric method according to the standard PN-ISO 10390 [20].
- The content of available forms of phosphorus (AP) in the samples after incubation was analyzed according to the standard PN-R-04023 [21].
- Soil particle-size distribution was determined with Malvern Instruments Mastersizer 2000 analyzer (Malvern, UK), equipped with dispersing device Hydro 2000MU.
- Soil dry mass and humidity were tested with weigh-dryer MAC-50 NH Radwag (Radom, Poland).
2.2.2. Enzyme Analysis
- The activity of dehydrogenases (DEH) was assayed with consideration of Thalmann protocol [22], with sample incubation with 2,3,5-triphenyltetrazolium chloride and measurement of the absorbance of triphenylformazane (TPF) at 546 nm. The results were presented in mg TPF kg−1 24 h−1.
- The activity of catalase (CAT) was determined with the Johnson and Temple method [23], with 0.3% hydrogen peroxide solution as a substrate. Residual H2O2 was determined by titration with 0.02 M KMnO4 under acidic conditions.
- The activity of soil alkaline phosphatase (AlP) and acid phosphatase (AcP) was measured on the ground of detection of p-nitrophenol (pNP) released after incubation (37 °C, 1 h) at pH ~ 6.5 for AcP and pH ~ 11.0 for AlP [24].
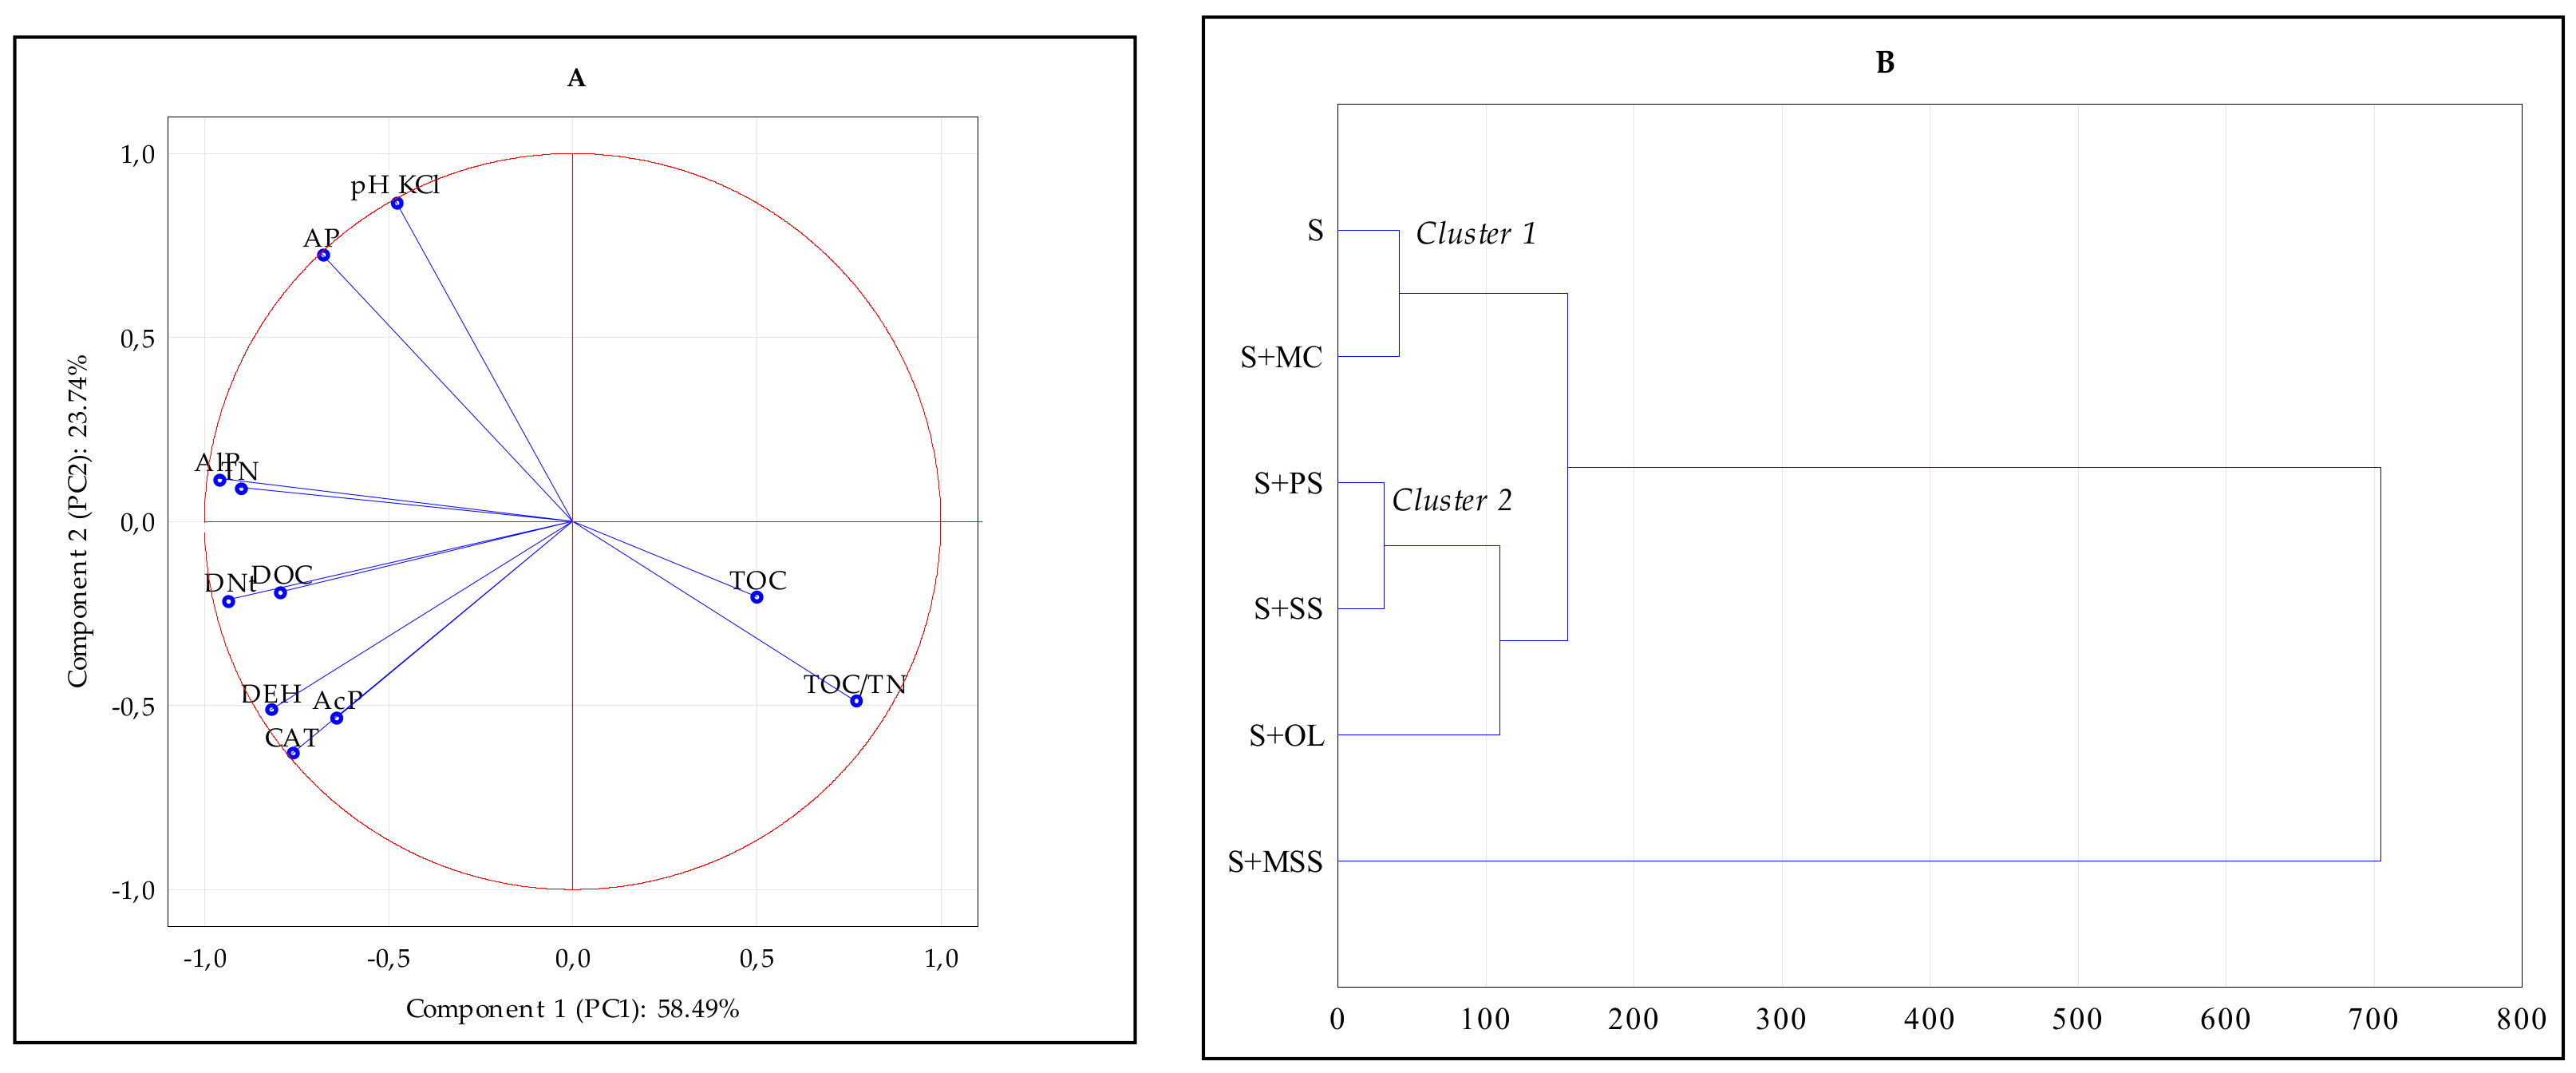
2.2.3. Statistical Analysis
3. Results and Discussion
4. Conclusions
Author Contributions
Funding
Institutional Review Board Statement
Informed Consent Statement
Data Availability Statement
Conflicts of Interest
References
- Meng, F.; Wang, D. Effects of vacuum freez drying pretreatment on biomass and biochar properties. Renew. Energy 2020, 155, 1–9. [Google Scholar] [CrossRef]
- Lee, J.; Sarmah, A.K.; Kwon, E.E. Production and formation of biochar. In Biochar from Biomass and Waste; Sik Ok, Y., Tsang, D.C.W., Bolan, N., Novak, J.M., Eds.; Elsevier Inc.: Amsterdam, The Netherlands, 2019; pp. 1–18. [Google Scholar]
- Yang, X.; Ali, A. Biochar for Soil Water Conservation and Salinization Control in Arid Desert Regions. In Biochar from Biomass and Waste; Sik Ok, Y., Tsang, D.C.W., Bolan, N., Novak, J.M., Eds.; Elsevier Inc.: Amsterdam, The Netherlands, 2019; pp. 161–168. [Google Scholar]
- Taskin, E.; Bueno, C.C.; Allegretta, I.; Terzano, R.; Rosa, A.H.; Loffredo, E. Multianalytical characterization of biochar and hydrochar produced from waste biomasses for environmental and agricultural applications. Chemosphere 2019, 233, 422–430. [Google Scholar] [CrossRef] [PubMed]
- Speratti, A.B.; Johnson, M.S.; Sousa, H.M.; Torres, G.N.; Couto, E.G. Impact of Different Agricultural Waste Biochars on Maize Biomass and Soil Water Content in a Brazilian Cerrado Arenosol. Agronomy 2017, 7, 49. [Google Scholar] [CrossRef] [Green Version]
- Haddad, S.A.; Mowrer, J.; Thapa, B. Biochar and compost from cotton residues inconsistently affect water use efficiency, nodulation, and growth of legumes under arid conditions. J. Environ. Manag. 2022, 307, 114558. [Google Scholar] [CrossRef]
- Shahidah, N.; Adib, M.; Fairuz., S.; Hamzah., F. Suitability of biochar produced from biomass waste as soil amendment. Procedia Soc. Behav. Sci. 2015, 195, 2457–2465. [Google Scholar]
- Han, L.; Zhang, B.; Chen, L.; Feng, Y.; Yang, Y.; Sun, K. Impact of biochar amendment on soil aggregation varied with incubation duration and biochar pyrolysis temperature. Biochar 2021, 3, 339–347. [Google Scholar] [CrossRef]
- Cooper, J.; Greenberg, I.; Ludwig, B.; Hippich, L.; Fischer, D.; Glaser, B.; Kaiser, M. Effect of biochar and compost on soil properties and organic matter in aggregate size fractions under field conditions. Agric. Ecosyst. Environ. 2020, 295, 106882. [Google Scholar] [CrossRef]
- Sherene, T. Role of soil enzymes in nutrient transformation: A review. Bio Bull. 2017, 3, 109–131. [Google Scholar]
- Peiris, C.; Gunatilake, S.R.; Wewalwela, J.J.; Vithanage, M. Biochar for sustainable agriculture: Nutrient Dynamics, Soil Enzymes, and crop growth. In Biochar from Biomass and Waste; Sik Ok, Y., Tsang, D.C.W., Bolan, N., Novak, J.M., Eds.; Elsevier Inc.: Amsterdam, The Netherlands, 2019; pp. 211–224. [Google Scholar]
- Cenini, V.L.; Fornara, D.A.; McMullan, G.; Ternan, N.; Carolan, R.; Crawley, M.J.; Clement, J.C.; Lavorel, S. Linkages between extracellular enzyme activities and the carbon and nitrogen content of grassland soils. Soil Biol. Biochem. 2016, 96, 198–206. [Google Scholar] [CrossRef] [Green Version]
- Burns, R.G.; Deforest, J.L.; Marxsen, J.; Sinsabaugh, R.L.; Stromberger, M.E.; Wallenstein, M.D.; Weintraub, M.N.; Zoppini, A. Soil enzymes in a changing environment: Current knowledge and future directions. Soil Biol. Biochem. 2013, 58, 216–234. [Google Scholar] [CrossRef]
- Lehmann, J.; Rillig, M.; Thies, J.; Masiello, C.; Hockaday, W.; Crowley, D. Biochar effects on soil biota—A review. Soil Biol. Biochem. 2011, 43, 1812–1836. [Google Scholar] [CrossRef]
- Bailey, V.L.; Fansler, S.J.; Smith, J.L.; Bolton, H., Jr. Reconciling apparent variability in effects of biochar amendment on soil enzyme activities by assay optimization. Soil Biol. Biochem. 2010, 43, 296–301. [Google Scholar] [CrossRef]
- Elzobair, K.A.; Stromberger, M.E.; Ippolito, J.A.; Lentz, R.D. Contrasting effects of biochar versus manure on soil microbial communities and enzyme activities in an Aridisol. Chemosphere 2016, 142, 145–152. [Google Scholar] [CrossRef]
- Haddad, S.A.; Lemanowicz, J. Benefits of corn-cob biochar to the microbial and enzymatic activity of soybean plants grown in soils contaminated with heavy metals. Energies 2021, 14, 5763. [Google Scholar] [CrossRef]
- IUSS Working Group WRB. World Reference Base for Soil Resources 2014, Update 2015. International for Soil Classification System for Naming Soil and Creating Legends for Soil Maps; World Soil Resources Reports No 106; FAO: Rome, Italy, 2015. [Google Scholar]
- USDA. Keys to Soil Taxonomy. In United States Department of Agriculture, Natural Resources Conservation Service 2006, 20th ed.; USDA: Washington, DC, USA, 2006; pp. 1–332. [Google Scholar]
- PN-ISO 10390; Chemical and Agricultural Analysis—Determining Soil pH. Polish Standards Committee: Warszawa, Poland, 1997.
- PN-R-04023; Chemical and Agricultural Analysis—Determination of the Content of Available Phosphorus in Mineral Soils. Polish Standards Committee: Warszawa, Poland,, 1996.
- Thalmann, A. Zur methodic derestimung der Dehydrogenaseaktivität und Boden mittels Triphenyltetrazoliumchlorid (TTC). Landwirtsch. Forsch. 1968, 21, 249–258. [Google Scholar]
- Johnson, J.I.; Temple, K.l. Some variables affecting the measurements of catalase activity in soil. Soil Sci. Soc. Am. 1964, 28, 207–209. [Google Scholar] [CrossRef]
- Tabatabai, M.A.; Bremner, J.M. Use of p–nitrophenol phosphate for assay of soil phosphatase activity. Soil Biol. Biochem. 1969, 1, 301–307. [Google Scholar] [CrossRef]
- Hinojosa, M.B.; Garcia-Ruiz, R.; Viñegla, B.; Carreira, J.A. Microbiological rates and enzyme activities as indicators of functionality in soils affected by the Aznalcóllar toxic spill. Soil Biol. Biochem. 2004, 36, 1637–1644. [Google Scholar] [CrossRef]
- Orwin, K.H.; Wardle, D.A. New indices for quantifying the resistance and resilience of soil biota to exogenous disturbances. Soil Biol. Biochem. 2004, 36, 1907–1912. [Google Scholar] [CrossRef]
- Ward, J.H. Hierarchical grouping to optimize an objective function. J. Am. Stat. Ass. 1963, 58, 236–244. [Google Scholar] [CrossRef]
- Bolan, N.S.; Adriano, D.C.; Kunhikrishnan, A.; James, T.; McDowell, R.; Senesi, N. Dissolved organic matter: Biogeochemistry, dynamics, and environmental significance in soils. Adv. Agron. 2011, 110, 1–75. [Google Scholar] [CrossRef]
- Zsolnay, A. Dissolved organic matter: Artefacts, definitions and functions. Geoderma 2003, 113, 187–209. [Google Scholar] [CrossRef]
- Glaser, B.; Lehr, V.-I. Biochar effects on phosphorus availability in agricultural soils: A meta-analysis. Sci. Rep. 2019, 9, 9338. [Google Scholar] [CrossRef] [Green Version]
- Jain, S.; Mishra, D.; Khare, P.; Yadav, V.; Deshmukh, Y.; Meena, A. Impact of biochar amendment on enzymatic resilience properties of mine spoils. Sci. Total Environ. 2016, 544, 410–421. [Google Scholar] [CrossRef]
- Breza-Boruta, B.; Lemanowicz, J.; Bartkowiak, A. Variation in biological and physicochemical parameters of the soil affected by uncontrolled landfill sites. Environ. Earth Sci. 2016, 75, 201. [Google Scholar] [CrossRef] [Green Version]
- Foster, E.J.; Fogle, E.J.; Cotrufo, M.F. Sorption to biochar impacts â-glucosidase and phosphatase enzyme Activities. Agriculture 2018, 8, 158. [Google Scholar] [CrossRef] [Green Version]
- Paz-Ferreiro, J.; Fu, S.; Méndez, A.; Gasc, G. Interactive effects of biochar and the earthworm Pontoscolex corethrurus on plant productivity and soil enzyme activities. J. Soils Sediments 2014, 14, 483–494. [Google Scholar] [CrossRef]
- Jing, Y.; Zhang, Y.; Han, I.; Wang, P.; Mei, Q.; Huang, Y. Effects of different straw biochars on soil organic carbon, nitrogen, available phosphorus, and enzyme activity in paddy soil. Sci. Rep. 2020, 10, 8837. [Google Scholar] [CrossRef]
- Li, J.; Xie, T.; Zhu, H.; Zhou, J.; Li, C.; Xiong, W.; Xu, L.; Wu, Y.; He, Z.; Li, X. Alkaline phosphatase activity mediates soil organic phosphorus mineralization in a subalpine forest ecosystem. Geoderma 2021, 404, 115376. [Google Scholar] [CrossRef]
- Guan, B.; Xie, B.; Yang, S.; Hou, A.; Chen, M.; Han, G. Effects of five years’ nitrogen deposition on soil properties and plant growth in a salinized reed wetland of the Yellow River Delta. Ecol. Eng. 2019, 136, 160–166. [Google Scholar] [CrossRef]
- Feng, J.; Wu, J.; Zhang, Q.; Zhang, D.; Li, Q.; Long, C.; Yang, F.; Chen, Q.; Cheng, X. Stimulation of nitrogen-hydrolyzing enzymes in soil aggregates mitigates nitrogen constraint for carbon sequestration following afforestation in subtropical China. Soil Biol. Biochem. 2018, 123, 136–144. [Google Scholar] [CrossRef]
- Bielińska, E.J.; Kołodziej, B.; Sugier, D. Relationship between organic carbon content and the activity of selected enzymes in urban soils. J. Geochem. Explor. 2013, 129, 52–56. [Google Scholar] [CrossRef]
- Schulten, H.R.; Montreal, C.M.; Schnitzer, M. Effect of long-term cultivation on the chemical structure of soil organic matter. Naturwissenschaften 1995, 81, 42–44. [Google Scholar] [CrossRef]
- Karimi, A.; Moezzi, A.; Chorom, M.; Enayatizamir, N. Application of Biochar Changed the Status of Nutrients and Biological Activity in a Calcareous Soil. J. Soil Sci. Plant Nutr. 2020, 20, 450–459. [Google Scholar] [CrossRef]
- Haney, R.L.; Franzluebbers, A.J.; Jin, V.L.; Johnson, M.V.; Haney, E.B.; White, M.J.; Harmel, R.D. Soil organic C:N vs. water-extractable organic C:N. Open J. Soil Sci. 2012, 2, 269–274. [Google Scholar] [CrossRef] [Green Version]
- Wang, Q.; Xiao, F.; He, T.; Wang, S. Responses of labile soil organic carbon and enzyme activity in mineral soils to forest conversion in the subtropics. Ann. For. Sci. 2013, 70, 579–587. [Google Scholar] [CrossRef] [Green Version]
- Lee, S.H.; Kim, M.S.; Kim, J.G.; Kim, S.O. Use of soil enzymes as indicators for contaminated soil monitoring and sustainable management. Sustainability 2020, 12, 8209. [Google Scholar] [CrossRef]
- Lemanowicz, J.; Brzezińska, M.; Siwik-Ziomek, A.; Koper, J. Activity of selected enzymes and phosphorus content in soils of former sulphur mines. Sci. Total Environ. 2020, 708, 134545. [Google Scholar] [CrossRef]
- Dick, W.A.; Cheng, L.; Wang, P. Soil acid and alkaline phosphatase activity as pH adjustment indicators. Soil Biol. Biochem. 2000, 32, 1915–1919. [Google Scholar] [CrossRef]
- Hossain, M.K.; Strezov, V.; Chan, K.Y.; Ziolkowski, A.; Nelson, P.F. Influence of pyrolysis temperature on production and nutrient properties of wastewater sludge biochar. J. Environ. Manag. 2011, 92, 223–228. [Google Scholar] [CrossRef]
- Sri Shalini, S.; Palanivelu, K.; Ramachandran, A.; Raghavan, V. Biochar from biomass waste as a renewable carbon material for climate change mitigation in reducing greenhouse gas emissions—A review. Biomass Convers. Biorefin. 2021, 11, 2247–2267. [Google Scholar] [CrossRef] [Green Version]


| Sample * | TOC (g kg−1) | TN (g kg−1) | TOC/TN | pH in H2O |
|---|---|---|---|---|
| MC | 164.8 ± 11.3 | 16.3 ± 3.58 | 10.1 | 9.25 |
| MSS | 371.3 ± 31.3 | 62.9 ± 2.73 | 5.9 | 6.65 |
| PS | 642.2 ± 37.6 | 1.30 ± 0.16 | 494.0 | 6.20 |
| SS | 732.5 ± 42.52 | 2.10 ± 0.28 | 340.7 | 4.00 |
| OL | 594.4 ± 29.4 | 24.0 ± 3.55 | 24.8 | 8.30 |
| S | 11.5 ± 0.93 | 1.42 ± 0.05 | 8.1 | 6.40 |
| Variant * | TOC0 (g kg−1) | TOC1 (g kg−1) | TN0 (g kg−1) | TN1 (g kg−1) | TOC0/TN0 | TOC1/TN1 |
|---|---|---|---|---|---|---|
| S | 11.50 | 11.48 f ** ± 0.89 | 1.42 | 1.40 d ± 0.04 | 8.10 | 8.20 |
| S + MC | 26.83 | 24.27 e ± 0.93 | 2.91 | 2.52 c ± 0.30 | 9.22 | 9.63 |
| S + MSS | 47.48 | 45.08 d ± 2.00 | 7.57 | 7.07 a ± 0.77 | 6.27 | 6.38 |
| S + PS | 74.59 | 74.10 b ± 4.44 | 1.41 | 1.12 e ± 0.19 | 52.90 | 66.16 |
| S + SS | 83.60 | 83.50 a ± 2.87 | 1.49 | 1.23 de ± 0.16 | 56.11 | 67.89 |
| S + OL | 69.79 | 66.94 c ± 3.26 | 3.68 | 3.52 b ± 0.05 | 18.96 | 19.02 |
| Variant * | pH in H2O | AP (mg kg−1) | DOC (mg kg−1) | DOC (%) | DTN (mg kg−1) | DTN (%) |
|---|---|---|---|---|---|---|
| S | 6.49 | 130 b ** ± 0.7 | 219.5 f ± 9.5 | 1.91 a ± 0.12 | 46.0 c ± 4.09 | 3.25 b ± 0.36 |
| S + MC | 7.04 | 145 a ± 1.8 | 255.5 e ± 6.1 | 1.05 c ± 0.02 | 59.3 b ± 2.38 | 2.35 c ± 0.32 |
| S + MSS | 6.24 | 148 a ± 1.1 | 606.8 a ± 13.2 | 1.35 b ± 0.04 | 350.8 a ± 10.13 | 4.96 a ± 0.63 |
| S + PS | 5.75 | 102 d ± 4.2 | 301.0 c ± 8.7 | 0.41 e ± 0.03 | 16.4 e ± 0.53 | 1.46 e ± 0.19 |
| S + SS | 5.84 | 121 c ± 3.8 | 274.8 d ± 7.5 | 0.33 f ± 0.02 | 24.5 d ± 3.06 | 1.99 d ± 0.15 |
| S + OL | 7.44 | 146 a ± 4.0 | 349.5 b ± 18.7 | 0.52 d ± 0.04 | 39.9 c ± 2.34 | 1.14 e ± 0.07 |
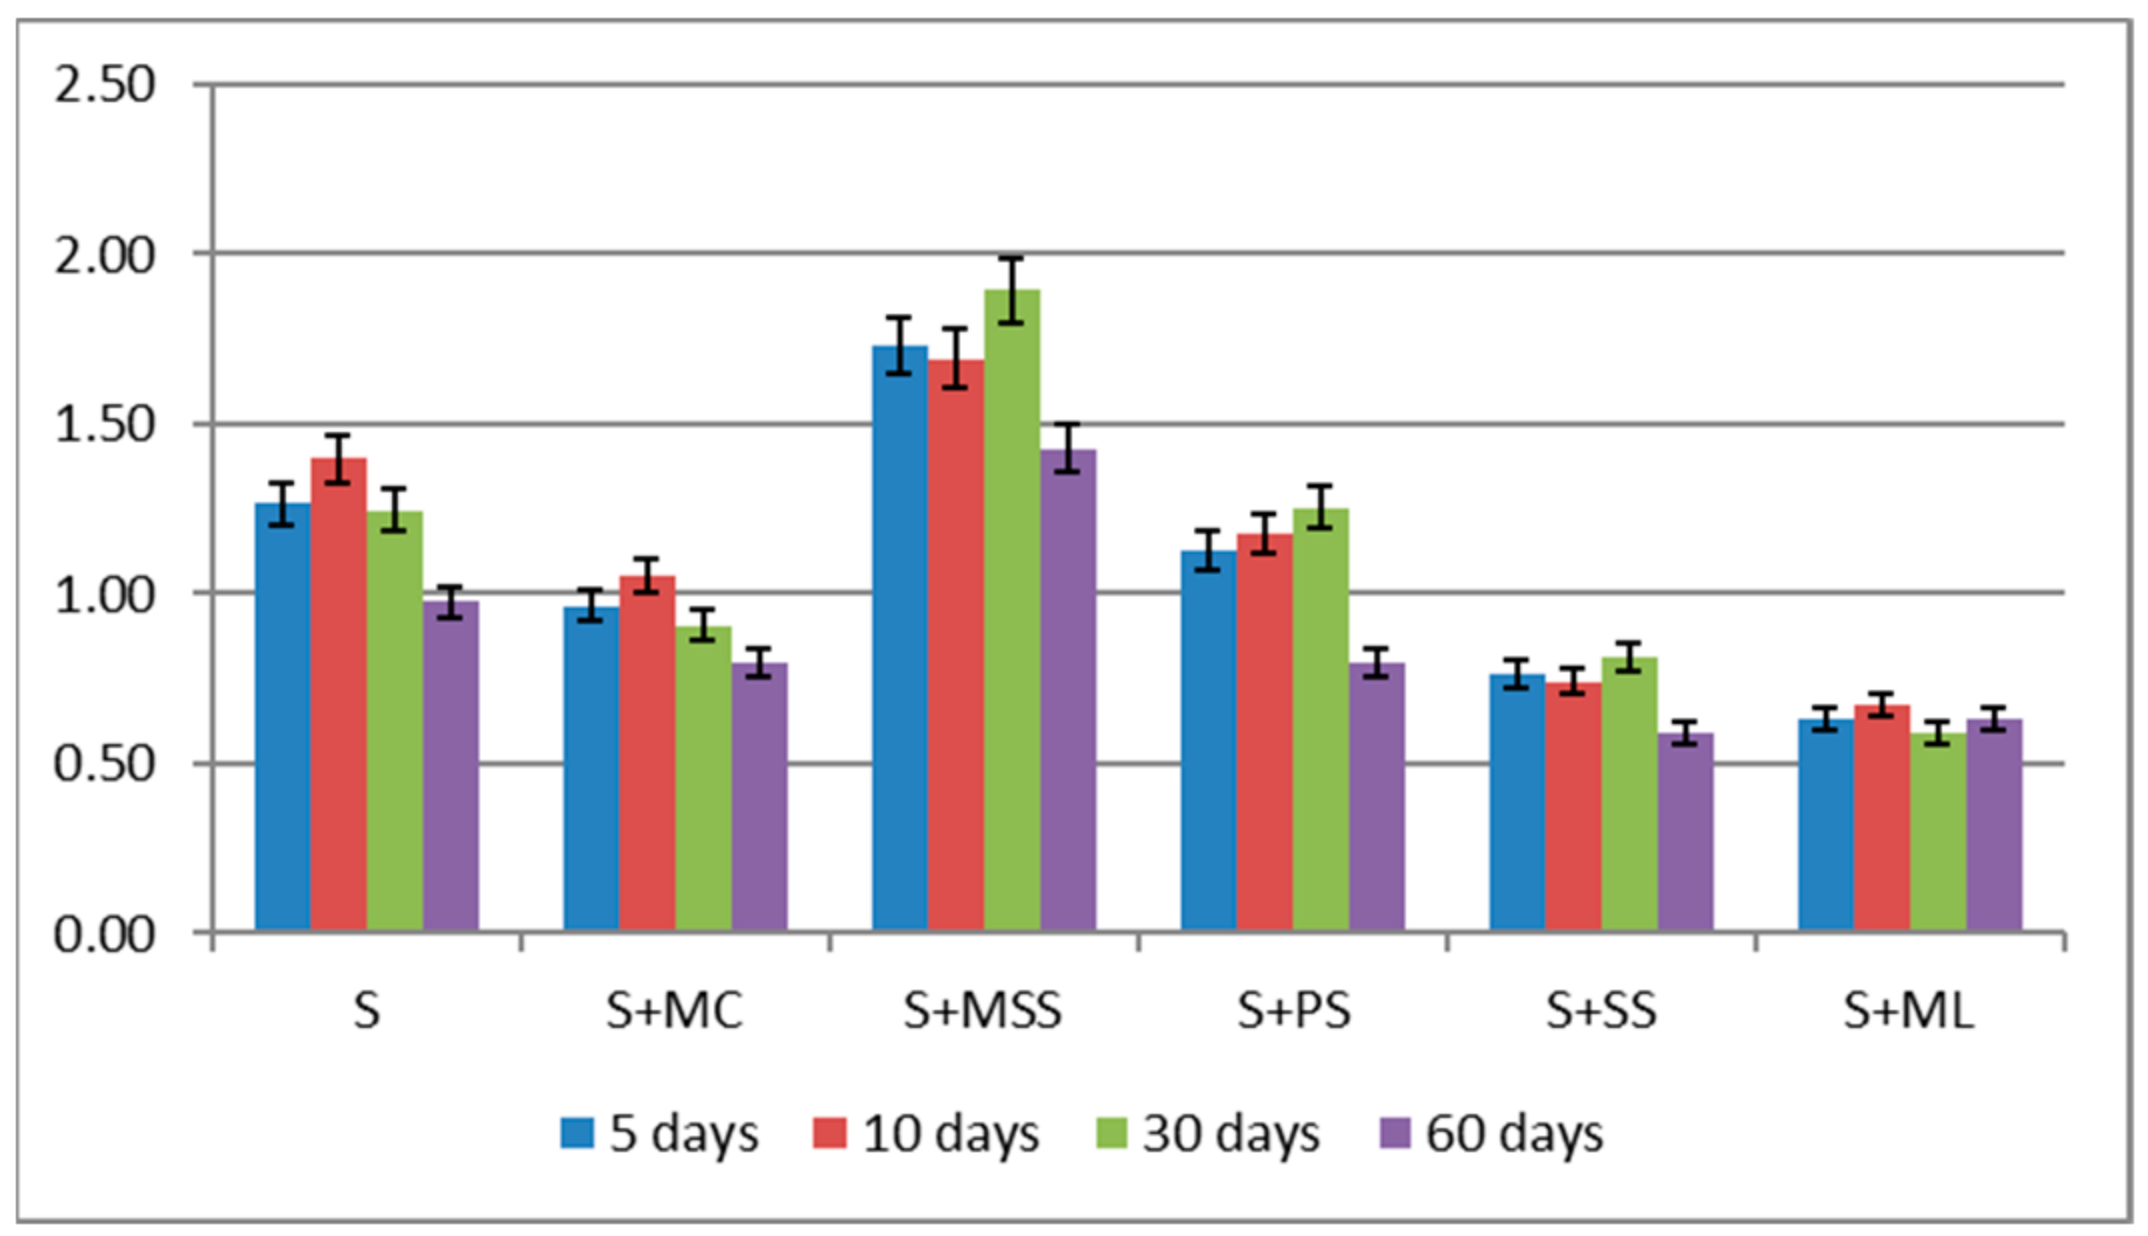
| Variant * | Time of Incubation | |||
|---|---|---|---|---|
| 5 Days | 10 Days | 30 Days | 60 Days | |
| S | 1.09 bC ** ± 0.01 | 1.21 bA ± 0.010 | 1.16 bB ± 0.038 | 0.93 bD ± 0.017 |
| S + MC | 0.87 dAB ± 0.0 | 0.90 cA ± 0.007 | 0.82 cB ± 0.005 | 0.75 cC ± 0.018 |
| S + MSS | 1.38 aB ± 0.028 | 1.44 aB ± 0.023 | 1.53 aA ± 0.026 | 1.30 aC ± 0.010 |
| S + PS | 0.95 cC ± 0.011 | 1.0 cB ± 0.054 | 1.23 bA ± 0.069 | 0.79 cD ± 0.029 |
| S + SS | 0.64 eAB ± 0.02 | 0.59 dB ± 0.008 | 0.65 dA ± 0.029 | 0.55 dB ± 0.019 |
| S + OL | 0.46 fA ± 0.035 | 0.40 eAB ± 0.01 | 0.29 eB ± 0.013 | 0.44 eA ± 0.023 |
| η2 for variant of biochar 91.93%, η2 for time of incubation 3.14%,η2 for interaction 4.36%, η2 for error 0.534% | ||||
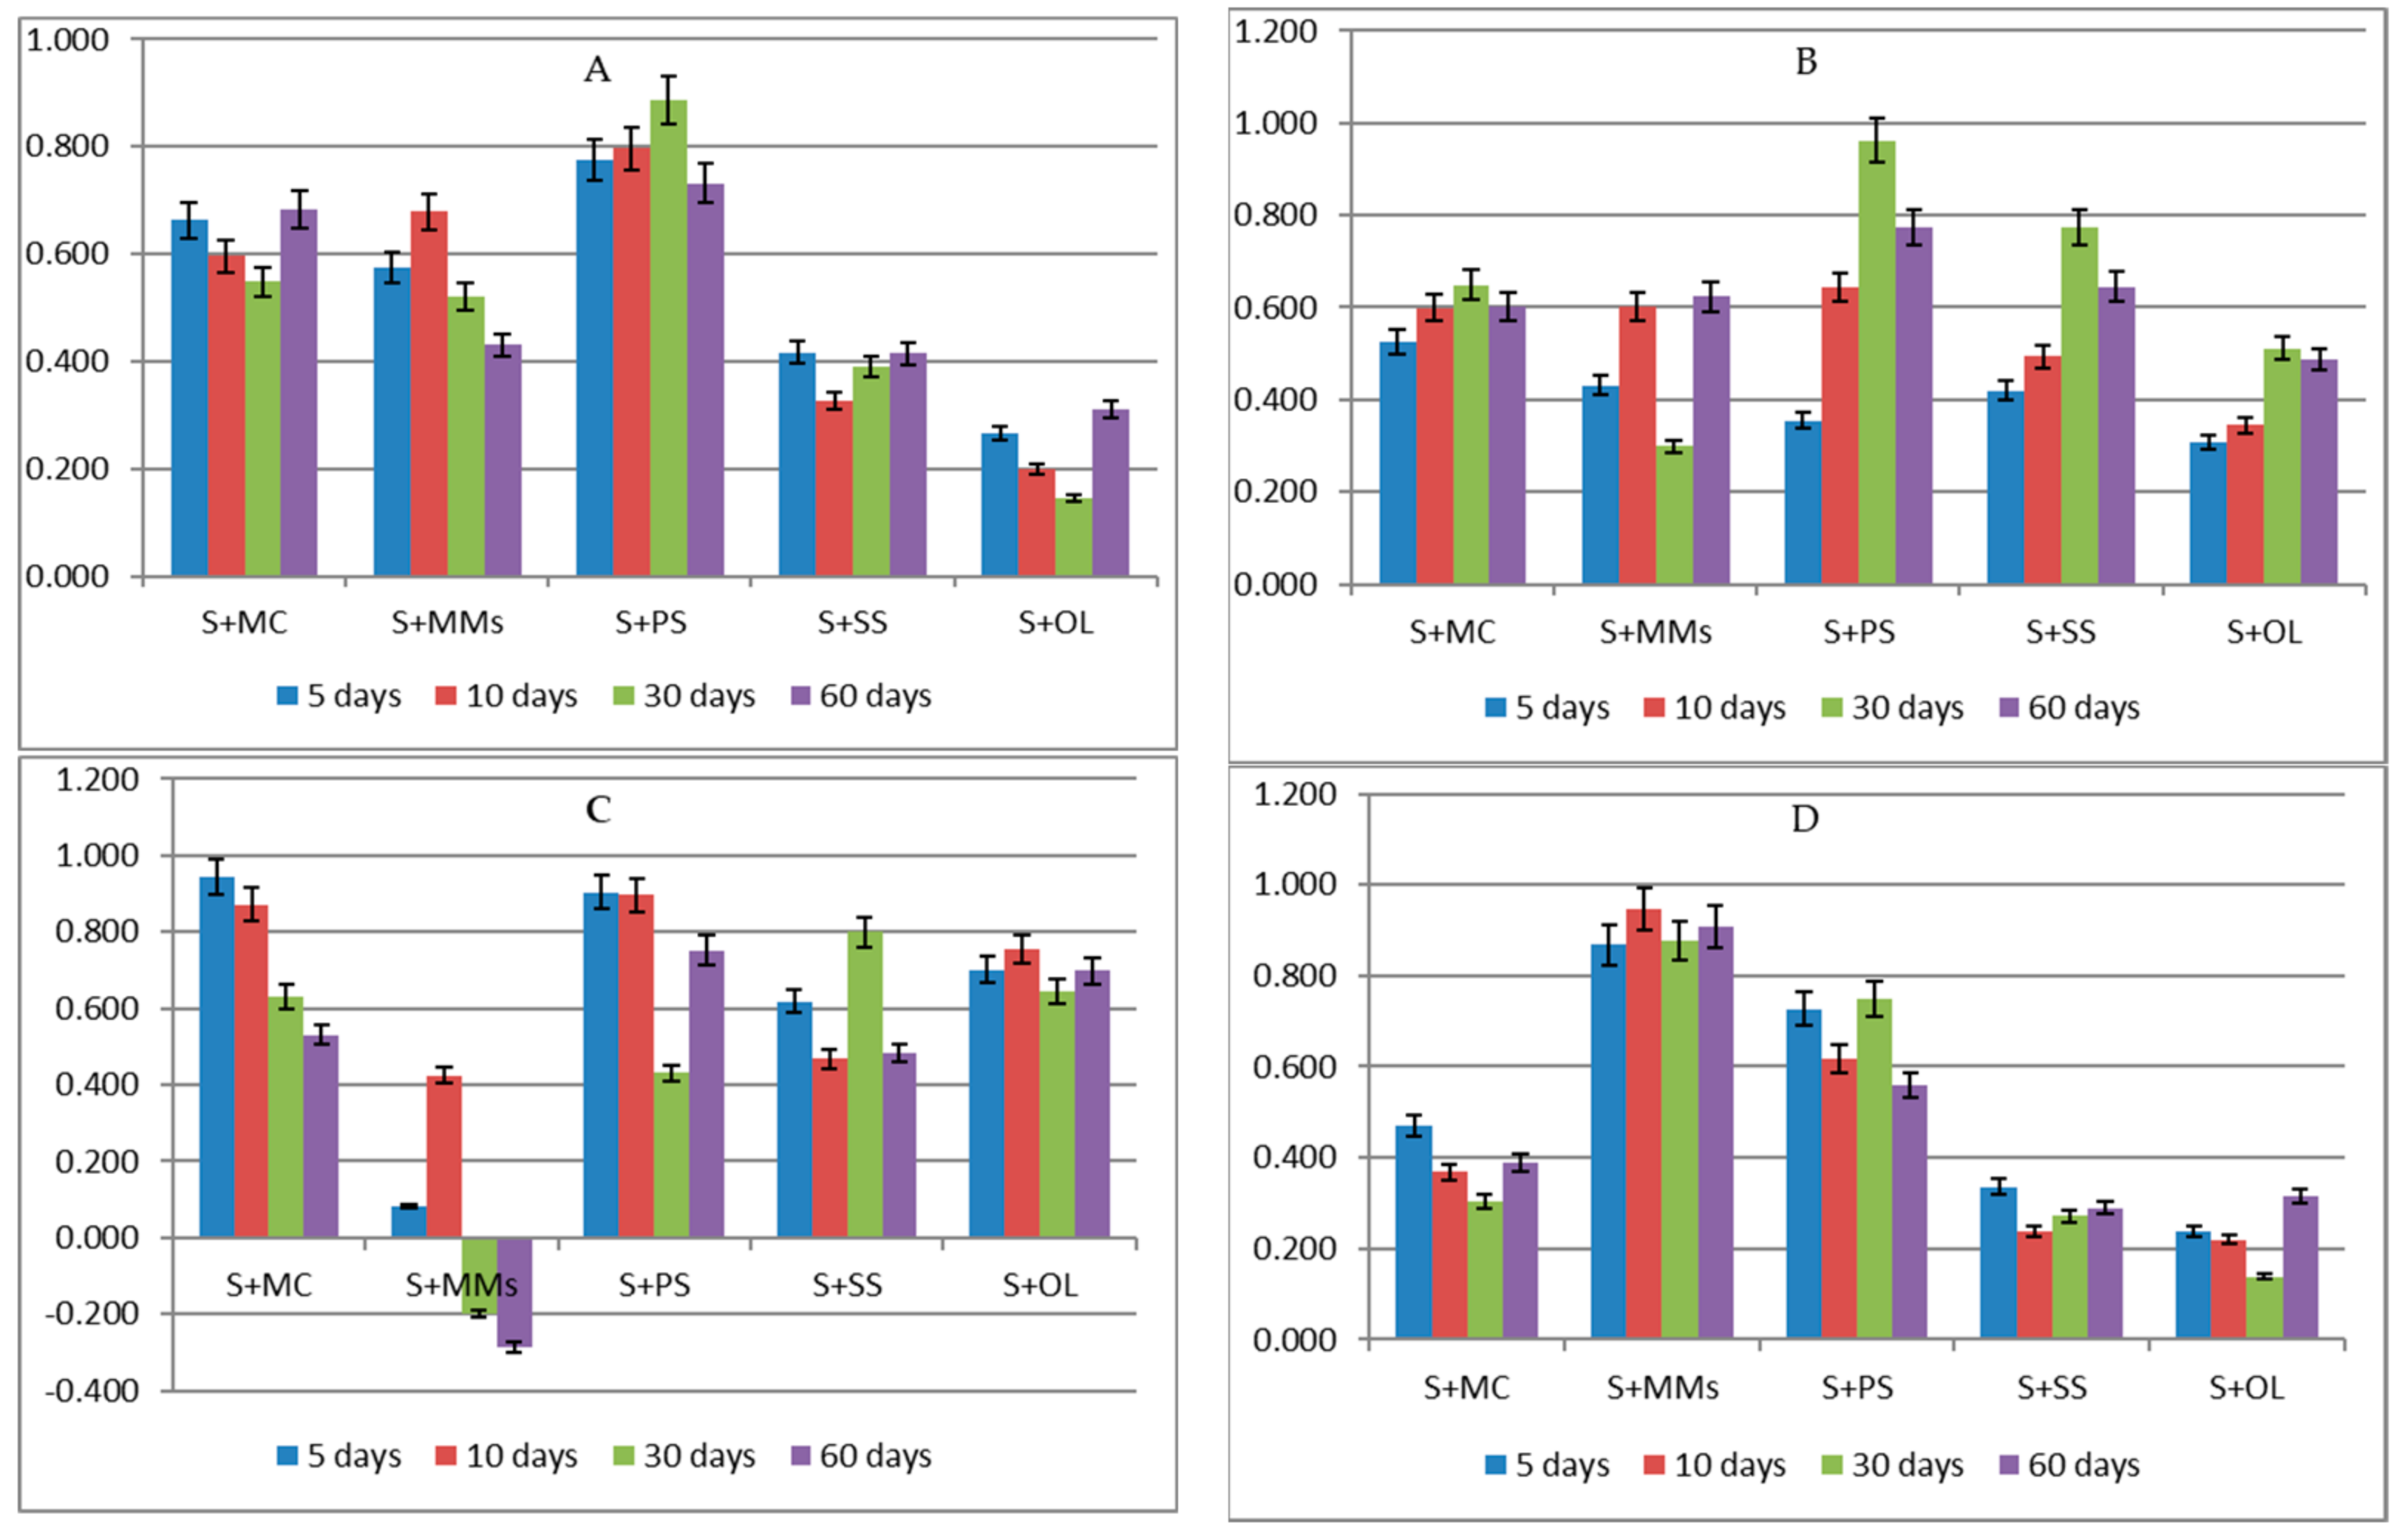
| Variant * | Time of Incubation | |||
|---|---|---|---|---|
| 5 Days | 10 Days | 30 Days | 60 Days | |
| S | 0.92 bB ** ± 0.013 | 1.08 bA ± 0.041 | 0.94 bB ± 0.013 | 0.82 bC ± 0.014 |
| S + MC | 0.63 dC ± 0.015 | 0.81 cA ± 0.006 | 0.74 dB ± 0.021 | 0.62 dC ± 0.010 |
| S + MSS | 1.28 aC ± 0.024 | 1.35 aB ± 0.025 | 1.45 aA ± 0.027 | 1.01 aD ± 0.072 |
| S + PS | 0.75 cC ± 0.027 | 0.85 cB ± 0.023 | 0.92 bA ± 0.010 | 0.72 cC ± 0.009 |
| S + SS | 0.54 eD ± 0.029 | 0.71 dB ± 0.012 | 0.82 cA ± 0.013 | 0.65 dC ± 0.025 |
| S + OL | 0.43 fC ± 0.024 | 0.55 eB ± 0.027 | 0.64 cA ± 0.023 | 0.54 eB ± 0.020 |
| η2 for variant of biochar 83.33%, η2 for time of incubation 10.21%,η2 for interaction 5.48%, η2 for error 0.976% | ||||
| Variant * | Time of Incubation | |||
|---|---|---|---|---|
| 5 Days | 10 Days | 30 Days | 60 Days | |
| S | 0.90 bcA **± 0.02 | 0.95 bcA ± 0.069 | 0.73 cB ± 0.029 | 0.47 cC ± 0.024 |
| S + MC | 0.87 cB ± 0.024 | 1.02 bA ± 0.044 | 0.90 bB ± 0.074 | 0.61 bC ± 0.020 |
| S + MSS | 1.66 aB ± 0.089 | 1.33 aC ± 0.031 | 1.82 aA ± 0.056 | 1.31 aC ± 0.017 |
| S + PS | 0.94 bA ± 0.29 | 0.90 cAB ± 0.009 | 0.84 bB ± 0.015 | 0.40 cC ± 0.010 |
| S + SS | 0.69 eA ± 0.03 | 0.61 dB ± 0.025 | 0.65 cAB ± 0.06 | 0.30 dC ± 0.012 |
| S + OL | 0.74 dC ± 0.05 | 0.82 cB ± 0.020 | 0.89 bA ± 0.023 | 0.55 bcD ± 0.010 |
| η2 for variant of biochar 72.33%, η2 for time of incubation 17.05%η2 for interaction 6.89%, η2 for error 3.733% | ||||
| Variant * | Time of Incubation | |||
|---|---|---|---|---|
| 5 Days | 10 Days | 30 Days | 60 Days | |
| S | 2.86 bC **± 0.05 | 3.09 aA ± 0.099 | 3.01 bB ± 0.103 | 2.53 aD ± 0.050 |
| S + MC | 1.83 dA ± 0.06 | 1.66 cB ± 0.148 | 1.40 dC ± 0.083 | 1.42 dC ± 0.026 |
| S + MSS | 3.06 aB ± 0.03 | 3.17 aA ± 0.050 | 3.21 aA ± 0.034 | 2.41 bC ± 0.032 |
| S + PS | 2.41 cB ± 0.03 | 2.35 bB ± 0.061 | 2.58 cA ± 0.160 | 1.81 cC ± 0.012 |
| S + SS | 1.44 eA ± 0.04 | 1.18 dC ± 0.036 | 1.29 eB ± 0.049 | 1.14 eC ± 0.025 |
| S + OL | 1.10 fB ± 0.05 | 1.11 dB ± 0.037 | 0.74 fC ± 0.030 | 1.21 fA ± 0.016 |
| η2 for variant of biochar 91.03%, η2 for time of incubation 3.417%η2 for interaction 4.89%, η2 for error 0.665% | ||||
Publisher’s Note: MDPI stays neutral with regard to jurisdictional claims in published maps and institutional affiliations. |
© 2022 by the authors. Licensee MDPI, Basel, Switzerland. This article is an open access article distributed under the terms and conditions of the Creative Commons Attribution (CC BY) license (https://creativecommons.org/licenses/by/4.0/).
Share and Cite
Wojewódzki, P.; Lemanowicz, J.; Debska, B.; Haddad, S.A. Soil Enzyme Activity Response under the Amendment of Different Types of Biochar. Agronomy 2022, 12, 569. https://doi.org/10.3390/agronomy12030569
Wojewódzki P, Lemanowicz J, Debska B, Haddad SA. Soil Enzyme Activity Response under the Amendment of Different Types of Biochar. Agronomy. 2022; 12(3):569. https://doi.org/10.3390/agronomy12030569
Chicago/Turabian StyleWojewódzki, Piotr, Joanna Lemanowicz, Bozena Debska, and Samir A. Haddad. 2022. "Soil Enzyme Activity Response under the Amendment of Different Types of Biochar" Agronomy 12, no. 3: 569. https://doi.org/10.3390/agronomy12030569
APA StyleWojewódzki, P., Lemanowicz, J., Debska, B., & Haddad, S. A. (2022). Soil Enzyme Activity Response under the Amendment of Different Types of Biochar. Agronomy, 12(3), 569. https://doi.org/10.3390/agronomy12030569