Abstract
Monogalactosyldiacylglycerol (MGDG) is the most abundant lipid on earth and constitutes about 50% of the polar lipids in the thylakoid membrane of higher plants. MGDG synthase (MGD) is the key enzyme responsible for MGDG synthesis in plants. However, so far, the function of the MGD gene in plant stress responses is still unknown, especially in crop plants. In this study, the performances of wild-type rice (Oryza sativa L. Nipponbare), OsMGD overexpression, and RNA interference lines were analyzed under salt stress to clarify the role of OsMGD in rice under salt stress. The results showed that, after 6 days of NaCl treatment, OsMGD-overexpressing rice seedlings had higher biomass than the wild-type rice, with significantly lower Na+ content and Na+ to K+ ratio in the shoots. Meanwhile, overexpression lines showed a significant increase in the contents of chlorophyll a and carotenoid and photosynthetic capabilities, including the net photosynthetic rate, maximal quantum yield (Fv/Fm), effective PSII quantum yield (ΦPSII), electron transport rate (ETR), and coefficient of photochemical quenching (qP), compared with the wild-type line. Also, OsMGD overexpression lines contained higher MGDG and 18:3 unsaturated fatty acid levels under salt stress. These results indicate that OsMGD participates in the regulation of improving salt tolerance through protecting photosynthetic capabilities and ion balance in rice.
1. Introduction
Salt stress inhibits crop growth and restrains agricultural production worldwide [1]. Salt stress causes plant growth inhibition mainly through affecting plant metabolism by osmotic stress, ion toxicity, and oxidative stress [2]. During the first phase of salt stress, soil salinity reduces soil and leaf water potential and affects plant water balance [3]; then, plants absorb salt from the soil through ion transporters, produce ion toxicity, and disrupt mineral absorption and ion homeostasis [4]. At the same time, salt stress also increases the production of plant reactive oxygen species (ROS), leads to membrane lipid oxidative damage, and affects membrane function and fluidity [3,5]. Plant photosynthesis is highly sensitive to salt stress. The photosystems of plants can be seriously damaged with the extension of salt stress duration and the increase of stress intensity, resulting in plant dehydration and death [6].
The thylakoid membrane, also known as the photosynthetic membrane, is the main place where photosynthesis occurs. Unlike other biomembranes, the thylakoid membrane is mainly composed of glycolipids [7]. Among them, monogalactosyldiacylglycerol (MGDG) and digalactosyldiacylglycerol (DGDG) are the main lipids of the thylakoid membrane, accounting for about 52% and 26% of the chloroplast lipids, respectively [8]. Under the catalysis of MGDG synthase (MGD), the galactose molecule in uridine diphosphate galactose (UDP-galactose) is transferred to the sn-3 (carbon number position 3) position of the DAG molecule to synthesize MGDG. MGDG further generates DGDG under the catalysis of DGDG synthase (DGD) [7,9,10]. Therefore, MGD is a key enzyme for galactolipid synthesis. The inhibition of MGDG biosynthesis restrains plant growth seriously. It was shown that the Arabidopsis mgd1 mutant, which lacks the galactolipids MGDG and DGDG, could only germinate as small albinos in the presence of sucrose, and its photosynthetic membranes were severely disrupted, leading to the complete impairment of photosynthetic ability [11]. The strong suppression of Arabidopsis MGD1 also caused a substantial decrease in the galactolipid content in cotyledons, which led to severe defects in the formation of thylakoid membranes and photosynthetic electron transport [12]. Moreover, knockout rice mutants of MGD2 showed that the MGDG and DGDG contents were reduced with the decrease in chlorophyll a content and, as a result, affected photosynthesis [13]. On the contrary, overexpression of OsMGD maintained higher chlorophyll levels in tobacco (Nicotiana tabacum), which has higher MGDG and DGDG contents and DGDG to MGDG ratios than wild-type rice under both control and salt stress conditions [14]. In addition, Zhang et al. [15] found that both the content of MGDG and the ratio of MGDG to DGDG in OsMGD-overexpressing lines were unchanged when plants were exposed to Al treatment, which contributed to maintaining the membrane stability and permeability under Al stress.
Under salt stress, plants respond to salinity by changing their membrane lipid compositions. Exposure of Catharanthus roseus suspension cells to increasing salinity significantly enhanced the total lipid content, which was mainly due to the increased levels of phosphatidylcholine (PC) and phosphatidylethanolamine (PE), whereas the MGDG and DGDG were reduced [16]. However, Sui et al. [17] found that the proportions of MGDG, DGDG, sulfoquinovosyldiacylglycerol (SQDG), and PC decreased, while the proportions of phosphatidylglycerol (PG) and unsaturated fatty acid content increased, which contributed to enhanced tolerance of the photosystem II to salt stress in Suaeda salsa L. In maize (Zea mays), it was shown that the membranes of bundle sheath cell (BSC) chloroplasts were more resistant to salinity stress than those of mesophyll cell (MC) chloroplasts, due to the low MGDG content in BSC chloroplasts [18]. Fatma et al. [19] found that the MGDG to DGDG ratio maintained no change, and the increase of unsaturation levels in MGDG, DGDG, and PG may decrease the ultrastructural damage caused by salinity and may contribute to protecting the chloroplast membrane integrity of Sulla coronaria under salt stress. In peanuts (Arachis hypogaea L.), the linolenic acid (18:3) and linoleic acid (18:2) of MGDG, DGDG, SQDG, and PG and the ratio of DGDG to MGDG increased under a 150 mM NaCl condition, which verified that increased unsaturated fatty acid content in membrane lipids could improve salt tolerance [20]. Moreover, Liu et al. [21] found that, after salt exposure, the concentrations of MGDG, DGDG, and phospholipid lipids + sulfoquinovosyldiacylglycerol (PL + SQDG) decreased significantly; however, gibberellic acid treatment prior to salt exposure led to the maintenance of these lipids at high levels and also preserved a high DGDG to MGDG ratio, which contributed to reduced salt sensitivity in rice (Oryza sativa L.) Taken together, these studies suggest that plants could respond to salt stress by changing their lipid and fatty acid compositions, and such alteration in lipid and fatty acid contents could contribute to salt tolerance.
However, whether the regulation of lipid biosynthesis could improve salt stress tolerance in crop plants is still largely unknown. Rice (Oryza sativa L.) is the most important human food crop in the world and sustains about two-thirds of the global population [22]. It is also a premiere model crop species in plant biology. In order to test the hypothesis that the regulation of lipid biosynthesis could lead to improved salt tolerance in crops, we used wild-type rice (Oryza sativa L. Nipponbare), OsMGD overexpression, and RNA interference (RNAi) lines as materials. The plant growth, ion content, photosynthetic responses, and lipid composition were investigated in both wild-type and transgenic rice plants under salt stress, and the function of OsMGD in salt stress response was discussed. Our study provides a useful approach to facilitating the molecular breeding of salt-tolerant crop cultivars.
2. Materials and Methods
2.1. Plant Materials and Growth Conditions
Wild-type rice (Oryza sativa L. Nipponbare), its overexpression lines (OE18, OE22, OE28), and RNA interference lines (RNAi7, RNAi8, RNAi13) were used in this study. The OsMGD gene (Os02g0802700, https://www.ncbi.nlm.nih.gov/protein/937906375/, accessed on 4 January 2022) was either overexpressed or interfered. It is known that, in rice, three OsMGD genes have been identified [13]. Before this study, we tested the roles of all three OsMGD genes under salt stress, and the Os02g0802700 gene showed better performance than the others. Also, the transcript levels of OsMGD were tested before the experiment, and they were approximately 6–10-fold higher in the overexpression lines and about 0.2–0.4-fold higher in the RNAi lines compared to wild-type rice.
Rice seeds were sterilized with 70% (w/v) ethanol for 20 s and soaked in 2.5% (w/v) sodium hypochlorite for 25 min with shaking. After that, seeds were washed with sterile water 3 times and germinated on an MS medium (Murashige and Skoog) [23] at 25 °C. Six days after germination, the seedlings were transferred to a half-strength Yoshida solution at pH 5.5 [24]. All experiments were carried out in an environmentally controlled growth chamber with 500 μmol m−2 s−1 photosynthetically active radiation, 25 °C for day and night temperature, and a 14 h:10 h of light:dark photoperiod. The culture solution was changed every 3 days. After 25 days of hydroponic culture, 0 or 100 mM NaCl was added. After 6 days of NaCl treatments, leaves were collected, frozen in liquid nitrogen, and stored at −80 °C for further analysis.
2.2. Biomass and Ion Content Measurement
After 6 days of salt treatment, seedlings of rice were washed 3 times with deionized water, and the excess moisture was removed with filter paper. The fresh weight (FW) of the shoots and roots was measured, and then the samples were put into an oven set at 80 °C and dried to constant weight. The dry weight (DW) of the shoots and roots was then recorded.
Dried materials were milled to a powder for ion analysis. An amount of 0.1 g plant powder was digested in a mixture of perchloric acid and nitric acid (v:v = 1:4) in a glass tube at 185 °C on a hot stove for 1.5 h. The Na+ and K+ contents were determined by an atomic absorption spectrometer (PE 900T, PerkinElmer Inc., Beijing, China) [25].
2.3. Chlorophyll Content Estimation
The fully expanded upper fresh leaves (0.1 g) were used for measuring the chlorophyll concentration. The leaves were cut into small pieces and extracted with 10 mL of 80% acetone at room temperature until the leaves were completely bleached. The supernatant was gathered for absorbance measurement at 646, 663, and 470 nm by a UV-2550 spectrophotometer (Shimadzu, Kyoto, Japan). The chlorophyll a, chlorophyll b, and carotenoid contents were calculated according to the equation described by Lichtenthaler [26], and the total chlorophyll content was then calculated.
2.4. Photosynthesis Measurement
The net photosynthetic rate (Pn), stomatal conductance (Gs), transpiration rate (Tr), and intercellular CO2 concentration (Ci) of the fully expanded upper leaf were measured using a portable photosynthesis system (Li-6400; LI-COR Biosciences, Lincoln, NE, USA). The photon flux density was 500 μmol m−2 s−1, the external CO2 concentration was 370 μmol CO2 mol−1, the flow rate was 500 μmol s−1, and the leaf temperature was 25 °C.
2.5. Chlorophyll Fluorescence Analysis
For fluorescence analysis, seedlings were dark-incubated for 30 min before measurement. Maximum quantum yield (Fv/Fm), effective PSII quantum yield (ΦPSII), PSII electron transport rate (ETRII), photochemical quenching (qP), and non-photochemical quenching (NPQ) were measured in a batch of leaves at room temperature under a saturating pulse with a Dual-PAM-100 measuring system (Heinz Walz, Effeltrich, Germany).
2.6. Determination of Electrolyte Leakage and Malondialdehyde
The method of Lutts et al. [27] was followed to determine electrolyte leakage (EL). The 0.1 g leaves were cut into 1 cm segments. The samples were each placed in a stoppered vial with 10 mL distilled water and incubated at 25 °C on a shaker (100 rpm) for 24 h. After incubation, the electrical conductivity (EC1) was measured with a B-173 conductivity meter (Horiba, Ltd., Kyoto, Japan). We then placed the same samples in boiling water for 30 min, and a reading of the EC (EC2) was obtained. The EL was measured as EC1/EC2 × 100%.
The content of malondialdehyde (MDA) was measured as described by Zhao et al. [28]. About 0.1 g of plant leaves was homogenized in 0.8 mL of 10% trichloroacetic acid (TCA). The homogenate was centrifuged at 12,000 g for 10 min. Then, 0.5 mL of the supernatant was added with 0.5 mL of thiobarbituric acid (TBA) made in 10% TCA. It was boiled for 30 min and then quickly cooled on ice. After centrifugation of the mixture at 12,000 g for 5 min, the absorbance of the supernatant was read at 532,600 and 450 nm. The content of MDA was determined on a fresh-weight basis as follows: μmol MDA g−1 FW = 6.452 (A532 − A600) − 0.560A450. Finally, data were recorded as μmol per gram fresh weight.
2.7. Lipid Analysis
Lipids were extracted and measured according to the methods of Bligh and Dyer [29] and Wewer et al. [30]. The leaves were cut into small pieces, extracted with 3 mL of a methanol/chloroform/formic acid mixture (2:1:0.1, v/v/v), and vigorously shaken. Then, 1.5 mL of 1 M KCl mixed with 0.2 M H3PO4 was added and vortexed briefly. After centrifugation at 1500 g for 3 min, the lower chloroform layer was transferred to a new vial and evaporated with a stream of nitrogen, and 100 μL of chloroform was added.
Lipids were separated on G60 silica gel plates (Merck, Darmstadt, Germany) by the thin layer chromatography (TLC) methods described by Wang and Benning [31] and Zhang et al. [15]. The silica gel plates were activated with 0.15 mol·L−1 (NH4)2SO4 and then dried at 120 °C for 2.5 h before use. After separation with an acetone/toluene/water mixture (91:30:7, v/v/v) for 1 h, the lipid bands identified by primuline (0.01% w/v in 80% acetone) were scraped off with a small blade, placed into tubes, and methylated with 1 M HCl in methanol. Then, the lipids were quantified by gas chromatography (GC-2010; Shimadzu, Japan) with a flame ionization detector. Pentadecanoic acid (15:0) was used as an internal standard.
2.8. Statistical Analyses
Statistical analyses for all the experiments were carried out according to one-way ANOVA using SPSS 26 (SPSS Inc., Chicago, IL, USA). Differences between the means of the wild-type and transgenic lines were compared by an LSD test at p < 0.05 and p < 0.01.
3. Results
3.1. Effects of Salt Stress on the Growth of OsMGD Transgenic Rice Seedlings
Under normal conditions, there was no significant difference in the growth of both overexpression and RNAi rice plants (Figure 1). After 6 days of NaCl treatment, the growth of all seedlings was inhibited, but the RNAi lines showed significantly more reduction in biomass accumulation compared with the wild-type and overexpression lines (Figure 1a). Under salt stress, the shoot fresh weights of OE18, OE22, and OE28 increased by 16.8%, 18.4%, and 27.2%, respectively, compared with wild-type shoots (Figure 1b). The root fresh weights in the overexpression lines also increased by 12.1%, 26.8%, and 19.8% in OE18, OE22, and OE28 lines, respectively (Figure 1c). Similarly, the shoot dry weights were significantly higher in the overexpression lines than in the wild-type shoots, which showed 12.5% and 14.9% increases in the OE22 and OE28 lines, respectively (Figure 1d). Meanwhile, the root dry weights of the overexpression lines also showed increase, while in the RNAi lines, they showed a significant decrease, which reduced by 15.1% in RNAi7 and 16.6% in the RNAi8 line compared with the wild type (Figure 1e). These results showed that regulation in the expression of the OsMGD gene could affect rice plant growth in response to salt stress.
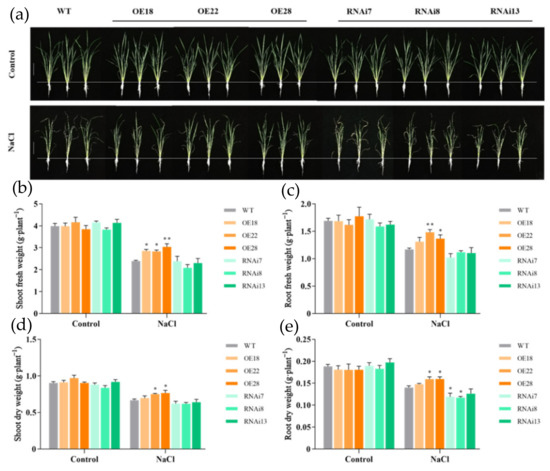
Figure 1.
Effects of NaCl treatment on growth of the wild-type line (WT), overexpression lines (OE18, OE22, and OE28), and RNAi lines (RNAi7, RNAi8, and RNAi13). Rice seedlings grown for 25 days were treated with 0 or 100 mM NaCl for 6 days. (a) Photos were taken on the sixth day after NaCl treatment; (b) shoot fresh weight, (c) root fresh weight, (d) shoot dry weight, and (e) root dry weight were measured after NaCl treatment. The experiment was repeated three times, and each treatment included four replications. Data are means ± SE (n = 5). An asterisk indicates a significant difference (LSD test, * p < 0.05 and ** p < 0.01) between wild-type, overexpression, and RNAi lines.
3.2. Effects of Salt Stress on Ion Content in OsMGD Transgenic Rice Seedlings
To test whether the different responses of the overexpression and RNAi lines under salt stress were due to different abilities in ion accumulation, the Na+ and K+ ion contents in both shoots and roots were determined in all lines. Under salt stress, the content of Na+ in rice seedlings increased significantly compared with the control treatment, while the content of K+ decreased significantly (Figure 2). However, the Na+ content in the shoots of the overexpression lines was significantly lower than in the wild-type and RNAi lines under salt stress. The Na+ content in the shoots of OE18, OE22, and OE28 decreased by 24.2%, 24.1%, and 27.1%, respectively, compared with wild-type rice, while in the RNAi7, RNAi8, and RNAi13 lines, it increased by 19.1%, 21.7%, and 25.2%, respectively (Figure 2a). The content of K+ showed no significant differences in the shoots between the wild-type line and overexpression or RNAi lines under NaCl treatment, but the overexpression lines still maintained relatively higher K+ contents (Figure 2c). In roots, there were no significant differences in Na+ contents among all lines, except a significant decrease in the OE28 line (Figure 2b). By contrast, the K+ contents were significantly higher in the OE22 and OE28 lines than in the wild-type line (Figure 2d). Moreover, we also calculated the Na+ to K+ ratios in the shoots and roots; the results showed that overexpression lines exhibited reduced Na+ to K+ ratios both in shoots and roots compared with the wild-type line (Figure 2e,f), which indicated that the ion balance may be well-maintained in the overexpression seedlings under salt stress.
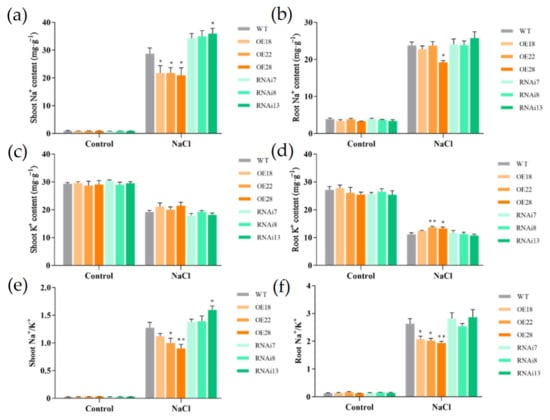
Figure 2.
Effects of NaCl treatment on the ion content of wild-type (WT), overexpression (OE18, OE22, and OE28), and RNAi lines (RNAi7, RNAi8, and RNAi13). (a) Shoot Na+ content, (b) root Na+ content, (c) shoot K+ content, (d) root K+ content, (e) shoot Na+ to K+ ratio, and (f) root Na+ to K+ ratio were sampled from control or 6 d salt-treated rice seedlings. The experiment was repeated three times, and each treatment included four replications. Data are means ± SE (n = 4). An asterisk indicates a significant difference (LSD test, * p < 0.05 and ** p < 0.01) between wild-type, overexpression and RNAi lines.
3.3. Effects of Salt Stress on Photosynthetic Pigment Content in OsMGD Transgenic Rice Seedlings
The chlorophyll a and carotenoid contents decreased greatly under salt treatment in the wild-type line and RNAi lines, but it only showed a slight reduction in the overexpression lines (Figure 3a, c and e). Under salt stress, the overexpression lines had significantly higher chlorophyll a and carotenoid contents than in the wild-type line, while the RNAi lines showed a reduction in pigment contents, especially in RNAi7. In contrast, there was no significant change in chlorophyll b content both under salt stress and among the wild-type and transgenic lines (Figure 3b). The ratio of chlorophyll a to b was significantly higher in the overexpression lines than in the wild-type and RNAi lines under salt treatment (Figure 3d).
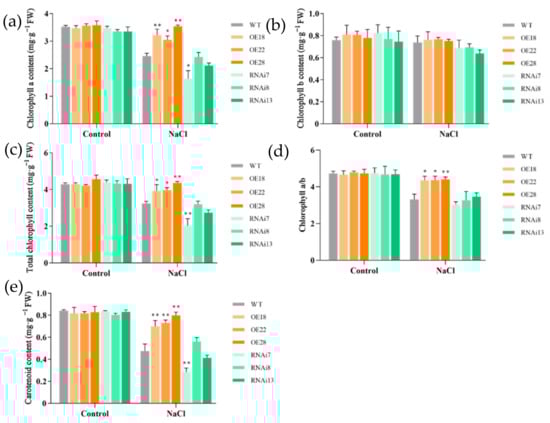
Figure 3.
Effects of NaCl treatment on the photosynthetic pigment content of wild-type (WT), overexpression (OE18, OE22, and OE28), and RNAi lines (RNAi7, RNAi8, and RNAi13). (a) Chlorophyll a content, (b) chlorophyll b content, (c) total chlorophyll content, (d) chlorophyll a and b, and (e) carotenoid content were determined after 6 d of NaCl treatment. The experiment was repeated three times, and each treatment included four replications. Data are means ± SE (n = 4). An asterisk indicates a significant difference (LSD test, * p < 0.05 and ** p < 0.01) between wild-type, overexpression, and RNAi lines.
3.4. Effects of Salt Stress on Photosynthetic Characteristics of OsMGD Transgenic Rice Seedlings
Under normal growth conditions, there were no differences in the photosynthetic parameters among wild-type, overexpression, and RNAi rice plants. Under salt stress, all seedlings showed a great decrease in the net photosynthetic rate, stomatal conductance, and transpiration rate (Figure 4). However, the overexpression lines still maintained a higher net photosynthetic rate, stomatal conductance, and transpiration rate, especially in the OE18 and OE22 lines compared with the wild-type line. In contrast, the net photosynthetic rates in the RNAi7 and RNAi8 lines were significantly inhibited and were much lower than the wild-type rate. Moreover, the intercellular CO2 concentration decreased in OE28, but it was maintained at a relatively high level in the RNAi lines (Figure 4d).
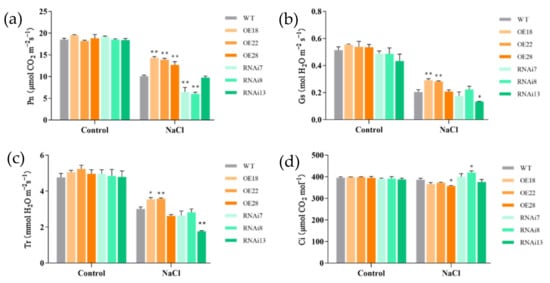
Figure 4.
Effects of NaCl treatment on the photosynthetic characteristics of wild-type (WT), overexpression (OE18, OE22, and OE28), and RNAi lines (RNAi7, RNAi8, and RNAi13). (a) Net photosynthetic rate (Pn), (b) stomatal conductance (Gs), (c) intercellular CO2 concentration (Ci), and (d) transpiration rate (Tr) were measured after 6 d of NaCl treatment. The experiment was repeated three times, and each treatment included four replications. Data are means ± SE (n = 4). An asterisk indicates a significant difference (LSD test, * p < 0.05 and ** p < 0.01) between wild-type, overexpression, and RNAi lines.
3.5. Effects of Salt Stress on Chlorophyll Fluorescence of OsMGD Transgenic Rice Seedlings
In order to further investigate the photosynthetic responses of wild-type and transgenic plants under salt stress, the chlorophyll fluorescence was measured. There was no significant difference in chlorophyll fluorescence responses among wild-type and transgenic rice seedlings without salt treatment. When the plants were exposed to salt stress, the maximum quantum yield (Fv/Fm), effective quantum yield of PSII (ΦPSII), electron transport rate of PSII (ETRII), photochemical quenching (qP), and non-photochemical quenching (NPQ) were all decreased in wild-type plants, but the overexpression lines were maintained at higher levels in the fluorescence parameters than in the wild-type plants (Figure 5), indicating less damage of photosynthetic abilities in the overexpression lines caused by salt treatment. For example, ΦPSII decreased by 17.3% in wild-type plants under salt stress compared with plants under control conditions, but the OE18, OE22, and OE28 overexpression lines only showed 4.9%, 3.7%, and 3.6% reductions, respectively. Also, salt stress had fewer inhibitory effects on NPQ in the overexpression lines but greater inhibition in the RNAi7 and RNAi13 lines, which decreased by 11.4% and 14.2%, respectively, compared with the wild-type line (Figure 5e). Moreover, 1-qP, an estimate of the proportion of closed PSII reaction centers that reflects the redox state of the QA electron acceptor of PSII, was also calculated in this study [32,33,34]. Under salt stress, the redox state of QA in the wild-type, overexpression, and RNAi lines increased by 23.1%, 3.4%, and 32.7%, respectively, indicating that a great proportion of PSII reaction centers were closed in response to salt stress in the rice seedlings (Figure 5f). However, the overexpression lines showed significant decreases of 1-qP compared with the wild-type and RNAi lines under salt stress, which suggests that a more-oxidized plastoquinone pool was maintained in the overexpression lines. These results suggest that the regulation of OsMGD expression significantly affected the photosynthetic activities of PSII under salt stress.
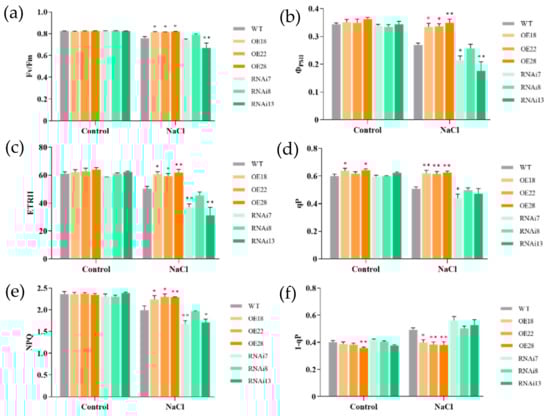
Figure 5.
Effects of NaCl treatment on chlorophyll fluorescence parameters of wild-type (WT), overexpression (OE18, OE22, and OE28), and RNAi lines (RNAi7, RNAi8, and RNAi13). (a) Maximum quantum yield (Fv/Fm), (b) effective quantum yield of PSII (ΦPSII), (c) electron transport rate of PSII (ETRII), (d) photochemical quenching (qP), (e) non-photochemical quenching (NPQ), and (f) redox state of the QA electron acceptor of PSII (1-qP) in dark-adapted seedlings for 30 min after 6 d of salt treatment. The experiment was repeated three times, and each treatment included four replications. Data are means ± SE (n = 4). An asterisk indicates a significant difference (LSD test, * p < 0.05 and ** p < 0.01) between wild-type, overexpression, and RNAi lines.
3.6. Effects of Salt Stress on EL and MDA of OsMGD Transgenic Rice Seedlings
The membrane injury and the oxidation of membrane lipids were evaluated by measuring electrolyte leakage (EL) and malondialdehyde (MDA) levels (Figure 6). There was no significant difference in the EL and MDA values between wild-type and transgenic rice seedlings under normal conditions. When plants were exposed to salt stress, the EL and MDA levels sharply increased. The RNAi7, RNAi8, and RNAi13 lines showed a marked increase in EL by 10.2%, 34.5%, and 29.8% compared with the wild-type line, respectively, indicating severe membrane damage in those lines. In contrast, the OE18, OE22, and OE28 overexpression lines maintained low EL (18.4%, 16.2%, and 21.1%, respectively) after 6 d of NaCl treatment (Figure 6a). MDA content was also markedly higher in the RNAi lines than in the wild-type line, while overexpression lines maintained lower levels of MDA under salt treatment (Figure 6b), indicating less damage in lipid peroxidation in the overexpression lines compared with the wild-type RNAi lines. These results suggest that overexpression plants had an enhanced tolerance for membrane damage under salt stress.
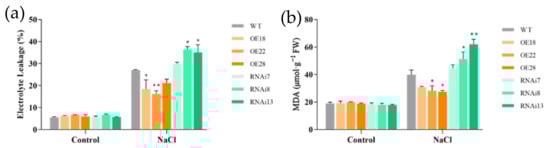
Figure 6.
Effects of NaCl treatment on relative electrolyte leakage and malondialdehyde levels of wild-type (WT), overexpression (OE18, OE22, and OE28), and RNAi lines (RNAi7, RNAi8, and RNAi13). (a) Electrolyte leakage and (b) malondialdehyde (MDA) levels were determined after 6 d of NaCl treatment. The experiment was repeated three times, and each treatment included four replications. Data are means ± SE (n = 3). An asterisk indicates a significant difference (LSD test, * p < 0.05 and ** p < 0.01) between wild-type, overexpression, and RNAi lines.
3.7. Effects of Salt Stress on Lipid and Fatty Acid Contents in Leaves of OsMGD Transgenic Rice Seedlings
Under normal conditions, there was no significant difference in the total lipids between the wild-type and transgenic rice lines, except a slight increase in MGDG content in the overexpression lines (Figure 7). Under salt stress, the overexpression lines showed significant increases in the contents of MGDG, DGDG, and PG in the rice leaves. The contents of MGDG in OE18 and OE22 increased by 32.5% and 27.1%, respectively, compared with the wild-type line; DGDG contents increased by 68.8% and 65.3% in OE18 and OE22, respectively; and PG contents increased by 32.5% in OE18 and 33.1% in OE28 compared to the wild-type line. According to the analysis of fatty acid content, linolenic acid (18:3) was the main fatty acid species in the rice leaves (Table 1). Under salt stress, the contents of oleic acid (18:1), linoleic acid (18:2), and linolenic acid (18:3) decreased, but the contents of 18:3 in the leaves of overexpression lines OE18, OE22, and OE28 increased by 8.0%, 12.9%, and 8.6%, respectively, compared with the wild-type line. On the contrary, under salt stress, the contents of palmitic acid (16:0), hexadecenoic acid (16:1), and hexadecanodienoic acid (16:2) increased, and the contents of 16:0 in the wild-type, overexpression, and RNAi lines increased by about 23.5%, 5.7%, and 37.5%, respectively, compared with the control. A high proportion of saturated fatty acids usually leads to a reduction of membrane fluidity ease [35]. These results suggest that the regulation of OsMGD overexpression could participate in regulating membrane fluidity through the alteration of membrane fatty acid composition under salt stress conditions.
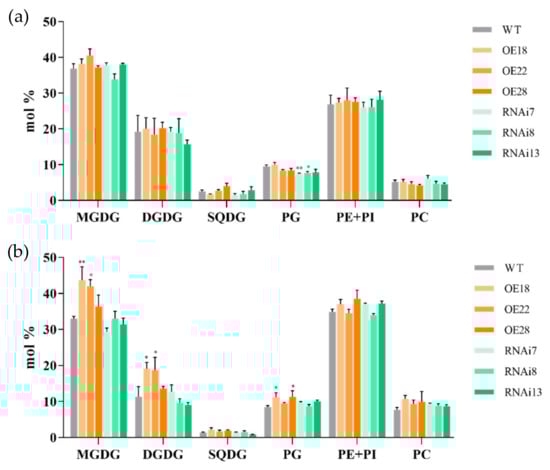
Figure 7.
Effects of NaCl treatment on the composition of lipid classes in wild-type (WT), overexpression (OE18, OE22, and OE28), and RNAi lines (RNAi7, RNAi8, and RNAi13). (a) Composition of lipid classes of rice seedlings in control and (b) composition of lipid classes of rice seedlings after 6 d of salt treatment. MGDG: monogalactosyldiacylglycerols; DGDG: digalactosyldiacylglycerols; SQDG: sulphoquinovosyldiacylglycerols; PG: phosphatidylglycerols; PE: phosphatidylethanolamine; PI: phosphatidylinositol; and PC: phosphatidylcholines. Data are means ± SE (n = 3). An asterisk indicates a significant difference (LSD test, * p < 0.05 and ** p < 0.01) between wild-type, overexpression, and RNAi lines.

Table 1.
Constituent fatty acids of total lipids in the leaves of rice seedlings of wild type (WT), overexpression (OE18, OE22, and OE28), and RNAi lines (RNAi7, RNAi8, and RNAi13).
4. Discussion
Rice is particularly sensitive to salt stress during the seedling stage, which leads to dry and wilted leaves due to water shortage [36,37]. In our study observing the growth responses of rice seedlings, we found that, under NaCl treatment, all seedlings, including wild-type, OsMGD overexpression, and RNAi lines, showed dry wilting, but the wilting degree in the overexpression lines was far lower than in the wild-type line, and the wilting degree of the RNAi lines was much higher than in the wild-type line (Figure 1a). In addition, the growth inhibition caused by salt stress was less severe in the overexpression lines but more obvious in the RNAi lines compared with the wild-type line (Figure 1b–e). These results indicated that the regulation of OsMGD expression could affect plant growth under salt stress, and the overexpression of OsMGD could lead to alleviation of the inhibitory effects of salt stress on the growth of rice seedlings.
Salt stress can lead to excessive Na+ accumulation in plants and inhibit the absorption of K+ ions, resulting in an increase in the proportion of Na+ to K+, destroying the ion balance and affecting normal metabolic responses [38]. Studies have shown that reducing the content of Na+ in shoots and maintaining the content of K+ in the whole plant can improve the salt tolerance of rice [39]. In our experiment, the Na+ content increased significantly under salt stress, but it was maintained at a significantly lower level in shoots of the OsMGD overexpression lines than in wild-type shoots (Figure 2a), indicating an increased salt tolerance in the overexpression plants. It was reported that overexpression of the Na+ transporter CmHKT1;1 led to significantly lower accumulated concentrations of Na+ in shoots and showed a better K+ to Na+ balance, which led to higher Fv/Fm, higher biomass, and enhanced plant growth in response to salt treatment [40]. Similar results were found in transgenic tobacco plants (Nicotiana tabacum) when the exogenous expression of the OsMGD gene led to a reduction in Na+ accumulation in shoots of tobacco in response to salt stress [14]. Meanwhile, there was no significant difference in K+ content in the shoots of the overexpression lines under salt stress (Figure 2c), resulting in a great reduction of the Na+ to K+ ratio (Figure 2e). Moreover, although the Na+ contents showed no significant difference in the roots of overexpression lines, the content of K+ in the roots was higher, and the Na+ to K+ ratio was significantly lower in the roots of overexpression lines than in the wild-type line (Figure 2f). In addition, the RNAi lines exhibited relatively higher Na+ to K+ ratios in both shoots and roots compared with wild-type plants, but they were not significant differences. These results suggest that the overexpression rice seedlings may improve their salt stress tolerance through reducing Na+ absorption and maintaining ion balance. It is widely known that salt stress causes damage in plant membrane integrity, which usually results in lipid peroxidation or an increase in ion leakage [41,42,43]. Therefore, it is important for plants to maintain membrane integrity under salt stress. In our study, the MDA content in the overexpression lines dramatically decreased under salinity, which might have facilitated a better maintenance in membrane integrity and reduced EL levels in the lines (Figure 6) torestrain the uptake of unwelcome Na+, especially the transportation of Na+ from root to shoot, thus, leading to less accumulation of Na+ in the shoot. However, this still needs to be further verified, at least, by investigating the activities of Na+ and K+ transporters in the future.
Salt stress leads to the decline of plant photosynthetic capacity [44,45]. Chlorophyll is an important component in light-harvesting complexes (LHCII) that participates in the collection of light energy and electron transfer [46]. Chlorophyll a plays an essential role in light capture, electron transfer, and energy conversion, while chlorophyll b is mainly active in light harvesting in the photosynthetic system [47,48]. Under salt stress, the contents of both chlorophyll a and b decreased obviously in many plants [49,50,51]. We found that no differences occurred in chlorophyll b levels between the wild-type and transgenic lines, but the chlorophyll a levels were well-maintained in the overexpression lines under salt treatment, which were significantly higher than the wild-type line, as well as the ratios of chlorophyll a to b (Figure 3). Meanwhile, the overexpression lines also maintained a higher photosynthetic rate under the same condition (Figure 4). These results suggest that the overexpression rice seedlings may improve their photosynthetic capability through improving light energy capture and conversion mediated by chlorophyll a [52,53]. In addition, the overexpression lines also maintained high levels of carotenoid compared with the wild-type line (Figure 3e). It is known that carotenoid plays an important role in scavenging free radicals, such as superoxide anion, produced in photosynthesis, in addition to its ability to absorb and transfer electrons [54]. Thus, the higher carotenoid content in the overexpression lines may play an important role in both reducing the oxidative damage to plant membranes by scavenging ROS and maintaining photosynthesis under salt stress.
For further understanding of photosynthesis process responses in the wild-type and transgenic plants, we also analyzed the chlorophyll fluorescence changes. Chlorophyll fluorescence mainly comes from PSII, which reflects the electron transfer of PSII and the redox state of other photosynthetic elements [55]. Under NaCl stress, the maximum quantum yield (Fv/Fm) and electron transfer rate of PSII in rice seedlings decreased significantly [56]. In this study, under salt stress, the overexpression lines had significantly higher Fv/Fm, reflecting the higher levels of potential maximum photosynthetic activity of plants and higher activity of the PSII complex (Figure 5a). Furthermore, the significantly high ΦPSII and ETRII levels in the overexpression lines and low levels in the RNAi lines compared to the wild-type line suggested that overexpression of OsMGD leads to less inhibition of electron transfer from the PSII donor side to the PSII reaction center, which decreases the loss of energy absorbance and maintains high PSII photochemical efficiency (Figure 5b,c). The change of qP, which was related to the PSII reaction center, had similar trends to that of ΦPSII and ETRII (Figure 5d), further confirming that more energy was used for photochemical reactions in overexpression seedlings under salt treatment compared with wild-type plants. Moreover, non-photochemical quenching (NPQ), which reflects the process of excess light energy dissipation into heat [57] and is related to plant light protection, was significantly higher in the overexpression lines but lower in the RNAi lines than in the wild-type line, indicating high photoprotection abilities in the overexpression lines under salt stress treatment. It was reported that salt-tolerant rice varieties had a higher NPQ under salt stress [58]. Thus, high NPQ may confer a salt tolerance ability in overexpression plants. In addition, the degree of PSII photoinhibition is closely related to the redox state of the primary electron receptor (QA) under certain stress conditions, and the relative redox state of QA can be estimated as 1-qP [32,34]. In our study, the overexpression lines showed lower 1-qP than the wild-type line under salt stress (Figure 5e,f), indicating a more-oxidized QA pool. In other words, the overexpression lines had a higher portion of PSII reaction centers in open state that could accept and transfer more electrons, which led to a reduction of photodamage in PSII. Taken together, the above results show that overexpression of OsMGD could reduce salt stress-induced injury to the PSII reaction center, increase photoprotection ability, and be conducive to maintaining the photosynthesis of rice seedlings under salt stress.
Salt stress can destroy photosynthesis, change the normal homeostasis of cells, lead to the production of ROS, and cause membrane lipid peroxidation [59]. Meanwhile, biofilms in plant tissues undergo membrane lipid remodeling under salt stress [60]. Our previous studies have found that overexpression of OsMGD in tobacco (Nicotiana tabacum) increased the ratio of DGDG to MGDG under salt stress, maintained the stability of chloroplast structure and function, and improved the salt tolerance of tobacco [14]. In this experiment, the content of MGDG in overexpression rice seedlings was significantly higher than in wild-type plants under salt stress, as well as the DGDG content (Figure 7). The maintenance of membrane lipid contents could facilitate the improvement of salt stress tolerance in the overexpression lines. As a defense system, unsaturated fatty acids (UFAs) can resist various biotic and abiotic stresses and have attracted extensive attention, now [35]. The change of unsaturated fatty acids is related to plant salt tolerance. Studies showed that the decrease of storage lipid content and the down-regulation of oleic acid (18:1) and linoleic acid (18:2) levels under salt stress were related to the large accumulation of Na+ in the achenes of salt-sensitive sunflowers (Helianthus annuus L.) [61]. In our study, the fatty acid contents of 18:1, 18:2, and 18:3 in rice leaves decreased (Table 1), but the decrease was less in the overexpression lines, which may be related to the significant decrease of Na+ content in the shoots of overexpression lines under salt stress. It was reported that salt stress resulted in the decrease of 18:3 content in peanut (Arachis hypogaea L.) leaves, which affected the stability and fluidity of the biofilm [62]. We found that the 18:3 fatty acid contents in OE22 and OE28 were significantly higher than in the wild-type line under salt stress (Table 1). Consistently, EL and MDA contents were also reduced in the overexpression lines (Figure 6), indicating less damage in the membranes of these lines. The above results suggest that overexpression of the OsMGD gene may be conducive to maintaining membrane fluidity, improving the membrane stability, and, finally, lead to the maintenance of photosynthetic capabilities.
5. Conclusions
Under salt stress, OsMGD overexpression maintained the content of membrane lipids and maintained membrane stability by affecting fatty acid constitution and facilitating the maintenance in plants of a low Na+ content and Na+–K+ balance. Concomitantly, the net photosynthetic rate, photosynthetic pigment content, and PSII activities were significantly improved, which led to an enhanced salt tolerance in rice seedlings.
Author Contributions
Conceptualization and methodology, L.Y. and S.W.; investigation and data curation, L.H.; writing—original draft preparation, L.H.; writing—review and editing, L.Y. and L.H.; project administration, S.L., Y.W. and D.L. All authors have read and agreed to the published version of the manuscript.
Funding
This research was funded by the Natural Science Basic Research Program of Shaanxi, grant number No. 2021JM-604.
Institutional Review Board Statement
Not applicable.
Informed Consent Statement
Not applicable.
Data Availability Statement
All data generated or analysed during this study are included in this published article. All the methods were carried out in accordance with relevant guidelines and regulations.
Conflicts of Interest
The authors declare no conflict of interest.
References
- Parihar, P.; Singh, S.; Singh, R.; Singh, V.P.; Prasad, S.M. Effect of salinity stress on plants and its tolerance strategies: A review. Environ. Sci. Pollut. Res. Int. 2015, 22, 4056–4075. [Google Scholar] [CrossRef]
- Munns, R.; Tester, M. Mechanisms of Salinity Tolerance. Annu. Rev. Plant Biol. 2008, 59, 651–681. [Google Scholar] [CrossRef] [PubMed]
- Arif, Y.; Singh, P.; Siddiqui, H.; Bajguz, A.; Hayat, S. Salinity induced physiological and biochemical changes in plants: An omic approach towards salt stress tolerance. Plant Physiol. Biochem. 2020, 156, 64–77. [Google Scholar] [CrossRef] [PubMed]
- van Zelm, E.; Zhang, Y.X.; Testerink, C. Salt Tolerance Mechanisms of Plants. Annu. Rev. Plant Biol. 2020, 71, 403–433. [Google Scholar] [CrossRef] [PubMed]
- Golldack, D.; Li, C.; Mohan, H.; Probst, N. Tolerance to drought and salt stress in plants: Unraveling the signaling networks. Front. Plant Sci. 2014, 5, 151. [Google Scholar] [CrossRef]
- Morton, M.J.L.; Awlia, M.; Al-Tamimi, N.; Saade, S.; Pailles, Y.; Negrao, S.; Tester, M. Salt stress under the scalpel—Dissecting the genetics of salt tolerance. Plant J. 2019, 97, 148–163. [Google Scholar] [CrossRef]
- Rocha, J.; Nitenberg, M.; Girard-Egrot, A.; Jouhet, J.; Marechal, E.; Block, M.A.; Breton, C. Do Galactolipid Synthases Play a Key Role in the Biogenesis of Chloroplast Membranes of Higher Plants? Front. Plant Sci. 2018, 9, 126. [Google Scholar] [CrossRef]
- Hoelzl, G.; Doermann, P. Chloroplast Lipids and Their Biosynthesis. Annu. Rev. Plant Biol. 2019, 70, 51–81. [Google Scholar] [CrossRef]
- Awai, K.; Kakimoto, T.; Awai, C.; Kaneko, T.; Nakamura, Y.; Takamiya, K.; Wada, H.; Ohta, H. Comparative genomic analysis revealed a gene for monoglucosyldiacylglycerol synthase, an enzyme for photosynthetic membrane lipid synthesis in cyanobacteria. Plant Physiol. 2006, 141, 1120–1127. [Google Scholar] [CrossRef][Green Version]
- Kobayashi, K. Role of membrane glycerolipids in photosynthesis, thylakoid biogenesis and chloroplast development. J. Plant Res. 2016, 129, 565–580. [Google Scholar] [CrossRef]
- Kobayashi, K.; Kondo, M.; Fukuda, H.; Nishimura, M.; Ohta, H. Galactolipid synthesis in chloroplast inner envelope is essential for proper thylakoid biogenesis, photosynthesis, and embryogenesis. Proc. Natl. Acad. Sci. USA 2007, 104, 17216–17221. [Google Scholar] [CrossRef] [PubMed]
- Fujii, S.; Kobayashi, K.; Nakamura, Y.; Wada, H. Inducible knockdown of MONOGALACTOSYLDIACYLGLYCEROL SYNTHASE1 reveals roles of galactolipids in organelle differentiation in Arabidopsis cotyledons. Plant Physiol. 2014, 166, 1436–1449. [Google Scholar] [CrossRef] [PubMed]
- Basnet, R.; Zhang, J.; Hussain, N.; Shu, Q. Characterization and Mutational Analysis of a Monogalactosyldiacylglycerol Synthase Gene OsMGD2 in Rice. Front. Plant Sci. 2019, 10, 992. [Google Scholar] [CrossRef]
- Wang, S.W.; Uddin, M.I.; Tanaka, K.; Yin, L.N.; Shi, Z.H.; Qi, Y.H.; Mano, J.; Matsui, K.; Shimomura, N.; Sakaki, T.; et al. Maintenance of Chloroplast Structure and Function by Overexpression of the Rice MONOGALACTOSYLDIACYLGLYCEROL SYNTHASE Gene Leads to Enhanced Salt Tolerance in Tobacco. Plant Physiol. 2014, 165, 1144–1155. [Google Scholar] [CrossRef] [PubMed]
- Zhang, M.J.; Deng, X.P.; Yin, L.N.; Qi, L.Y.; Wang, X.Y.; Wang, S.W.; Li, H.B. Regulation of Galactolipid Biosynthesis by Overexpression of the Rice MGD Gene Contributes to Enhanced Aluminum Tolerance in Tobacco. Front. Plant Sci. 2016, 7, 337. [Google Scholar] [CrossRef] [PubMed]
- Elkahoui, S.; Smaoui, A.; Zarrouk, M.; Ghrir, R.; Limam, H. Salt-induced lipid changes in Catharanthus roseus cultured cell suspensions. Phytochemistry 2004, 65, 1911–1917. [Google Scholar] [CrossRef]
- Sui, N.; Li, M.; Li, K.; Song, J.; Wang, B.S. Increase in unsaturated fatty acids in membrane lipids of Suaeda salsa L. enhances protection of photosystem II under high salinity. Photosynthetica 2010, 48, 623–629. [Google Scholar] [CrossRef]
- Omoto, E.; Iwasaki, Y.; Miyake, H.; Taniguchi, M. Salinity induces membrane structure and lipid changes in maize mesophyll and bundle sheath chloroplasts. Physiol. Plant 2016, 157, 13–23. [Google Scholar] [CrossRef]
- Bejaoui, F.; Salas, J.J.; Nouairi, I.; Smaoui, A.; Abdelly, C.; Martinez-Force, E. Changes in chloroplast lipid contents and chloroplast ultrastructure in Sulla carnosa and Sulla coronaria leaves under salt stress. J. Plant Physiol. 2016, 198, 32–38. [Google Scholar] [CrossRef]
- Liu, S.S.; Wang, W.Q.; Li, M.; Wan, S.B.; Sui, N. Antioxidants and unsaturated fatty acids are involved in salt tolerance in peanut. Acta Physiol. Plant. 2017, 39, 207. [Google Scholar] [CrossRef]
- Liu, X.X.; Wang, X.Y.; Yin, L.N.; Deng, X.P.; Wang, S.W. Exogenous application of gibberellic acid participates in up-regulation of lipid biosynthesis under salt stress in rice. Theor. Exp. Plant Physiol. 2018, 30, 335–345. [Google Scholar] [CrossRef]
- Muthayya, S.; Sugimoto, J.D.; Montgomery, S.; Maberly, G.F. An overview of global rice production, supply, trade, and consumption. Tech. Consid. Rice Fortif. Public Health 2014, 1324, 7–14. [Google Scholar] [CrossRef] [PubMed]
- Gamborg, O.L.; Murashige, T.; Thorpe, T.A.; Vasil, I.K. Plant tissue culture media. In Vitro 1976, 12, 473–478. [Google Scholar] [CrossRef]
- Yoshida, S.; Fomo, D.A.; Cock, J.H.; Gomez, K.A. Laboratory Manual for Physiological Studies of Rice, 3rd ed.; International Rice Research Institute: Manila, Philippines, 1976. [Google Scholar]
- Wolf, B. A comprehensive system of leaf analyses and its use for diagnosing crop nutrient status. Commun. Soil Sci. Plant Anal. 1982, 13, 1035–1059. [Google Scholar] [CrossRef]
- Lichtenthaler, H.K. Chlorophylls and carotenoids.Pigments of photosynthetic membranes. Methods Enzym. 1987, 148, 350–383. [Google Scholar]
- Lutts, S.; Kinet, J.M.; Bouharmont, J. Changes in plant response to NaCl during development of rice (Oryza sativa L.) varieties differing in salinity resistance. J. Exp. Bot. 1995, 46, 1843–1852. [Google Scholar] [CrossRef]
- Zhao, F.Y.; Guo, S.L.; Zhang, H.; Zhao, Y.X. Expression of yeast SOD2 in transgenic rice results in increased salt tolerance. Plant Sci. 2006, 170, 216–224. [Google Scholar] [CrossRef]
- Bligh, E.G.; Dyer, W.J. A rapid method of total lipid extraction and purification. Can. J. Biochem. Physiol. 1959, 37, 8. [Google Scholar] [CrossRef]
- Wewer, V.; Dörmann, P.; Hölzl, G. Analysis and quantification of plant membrane lipids by thin-layer chromatography and gas chromatography. Methods Mol. Biol. 2013, 1009, 69–78. [Google Scholar]
- Wang, Z.; Benning, C. Arabidopsis thaliana Polar Glycerolipid Profiling by Thin Layer Chromatography (TLC) Coupled with Gas-Liquid Chromatography (GLC). JoVE-J. Vis. Exp. 2011, 49, e2518. [Google Scholar] [CrossRef]
- Weng, X.Y.; Xu, H.X.; Jiang, D.A. Characteristics of gas exchange, chlorophyll fluorescence and expression of key enzymes in photosynthesis during leaf senescence in rice plants. J. Integr. Plant Biol. 2005, 47, 560–566. [Google Scholar] [CrossRef]
- Rosso, D.; Bode, R.; Li, W.Z.; Krol, M.; Saccon, D.; Wang, S.; Schillaci, L.A.; Rodermel, S.R.; Maxwell, D.P.; Huner, N.P.A. Photosynthetic Redox Imbalance Governs Leaf Sectoring in the Arabidopsis thaliana Variegation Mutants immutans, spotty, var1, and var2. Plant Cell 2009, 21, 3473–3492. [Google Scholar] [CrossRef] [PubMed]
- Herschbach, C.; Rizzini, L.; Mult, S.; Hartmann, T.; Busch, F.; Peuke, A.D.; Kopriva, S.; Ensminger, I. Over-expression of bacterial gamma-glutamylcysteine synthetase (GSH1) in plastids affects photosynthesis, growth and sulphur metabolism in poplar (Populus tremula × Populus alba) dependent on the resulting gamma-glutamylcysteine and glutathione levels. Plant Cell Environ. 2010, 33, 1138–1151. [Google Scholar] [PubMed]
- He, M.; Ding, N.Z. Plant Unsaturated Fatty Acids: Multiple Roles in Stress Response. Front. Plant Sci. 2020, 11, 562785. [Google Scholar] [CrossRef]
- Ganie, S.A.; Molla, K.A.; Henry, R.J.; Bhat, K.V.; Mondal, T.K. Advances in understanding salt tolerance in rice. Appl. Genet. 2019, 132, 851–870. [Google Scholar] [CrossRef] [PubMed]
- Zheng, C.K.; Zhou, J.J.; Zhang, F.; Yin, J.J.; Zhou, G.H.; Li, Y.P.; Chen, F.; Xie, X.Z. OsABAR1, a novel GRAM domain-containing protein, confers drought and salt tolerance via an ABA-dependent pathway in rice. Plant Physiol. Biochem. 2020, 152, 138–146. [Google Scholar] [CrossRef]
- Gupta, B.; Huang, B. Mechanism of salinity tolerance in plants: Physiological, biochemical, and molecular characterization. Int. J. Genom. 2014, 2014, 701596. [Google Scholar] [CrossRef]
- El Mahi, H.; Pérez-Hormaeche, J.; De Luca, A.; Villalta, I.; Espartero, J.; Gámez-Arjona, F.; Fernández, J.L.; Bundó, M.; Mendoza, I.; Mieulet, D.; et al. A Critical Role of Sodium Flux via the Plasma Membrane Na+/H+ Exchanger SOS1 in the Salt Tolerance of Rice. Plant Physiol. 2019, 180, 1046–1065. [Google Scholar] [CrossRef]
- Gao, Y.L.; Li, M.N.; Zhang, X.X.; Yang, Q.C.; Huang, B.R. Up-regulation of lipid metabolism and glycine betaine synthesis are associated with choline-induced salt tolerance in halophytic seashore paspalum. Plant Cell Environ. 2020, 43, 159–173. [Google Scholar] [CrossRef]
- Shah, T.; Latif, S.; Saeed, F.; Ali, I.; Ullah, S.; Alsahli, A.A.; Jan, S.; Ahmad, P. Seed priming with titanium dioxide nanoparticles enhances seed vigor, leaf water status, and antioxidant enzyme activities in maize (Zea mays L.) under salinity stress. J. King Saud Univ. Sci. 2021, 33, 101207. [Google Scholar] [CrossRef]
- Campo, S.; Baldrich, P.; Messeguer, J.; Lalanne, E.; Coca, M.; San Segundo, B. Overexpression of a Calcium-Dependent Protein Kinase Confers Salt and Drought Tolerance in Rice by Preventing Membrane Lipid Peroxidation. Plant Physiol. 2014, 165, 688–704. [Google Scholar] [CrossRef] [PubMed]
- Ahanger, M.A.; Mir, R.A.; Alyemeni, M.N.; Ahmad, P. Combined effects of brassinosteroid and kinetin mitigates salinity stress in tomato through the modulation of antioxidant and osmolyte metabolism. Plant Physiol. Biochem. 2020, 147, 31–42. [Google Scholar] [CrossRef] [PubMed]
- Yang, Z.; Li, J.L.; Liu, L.N.; Xie, Q.; Sui, N. Photosynthetic Regulation Under Salt Stress and Salt-Tolerance Mechanism of Sweet Sorghum. Front. Plant Sci. 2020, 10, 1722. [Google Scholar] [CrossRef] [PubMed]
- Rasouli, F.; Kiani-Pouya, A.; Tahir, A.; Shabala, L.; Chen, Z.H.; Shabala, S. A comparative analysis of stomatal traits and photosynthetic responses in closely related halophytic and glycophytic species under saline conditions. Environ. Exp. Bot. 2021, 181, 104300. [Google Scholar] [CrossRef]
- Liu, Z.F.; Yan, H.C.; Wang, K.B.; Kuang, T.Y.; Zhang, J.P.; Gui, L.L.; An, X.M.; Chang, W.R. Crystal structure of spinach major light-harvesting complex at 2.72 A resolution. Nature 2004, 428, 287–292. [Google Scholar] [CrossRef]
- Tanaka, R.; Tanaka, A. Chlorophyll cycle regulates the construction and destruction of the light-harvesting complexes. Biochim. Biophys. Acta-Bioenerg. 2011, 1807, 968–976. [Google Scholar] [CrossRef]
- Croce, R.; van Amerongen, H. Natural strategies for photosynthetic light harvesting. Nat. Chem. Biol. 2014, 10, 492–501. [Google Scholar] [CrossRef]
- Paiva, A.L.S.; Passaia, G.; Lobo, A.K.M.; Jardim-Messeder, D.; Silveira, J.A.G.; Margis-Pinheiro, M. Mitochondrial glutathione peroxidase (OsGPX3) has a crucial role in rice protection against salt stress. Environ. Exp. Bot. 2019, 158, 12–21. [Google Scholar] [CrossRef]
- Latef, A.A.H.A.; Abu Alhmad, M.F.; Kordrostami, M.; Abo-Baker, A.B.A.; Zakir, A. Inoculation with Azospirillum lipoferum or Azotobacter chroococcum Reinforces Maize Growth by Improving Physiological Activities Under Saline Conditions. J. Plant Growth Regul. 2020, 39, 1293–1306. [Google Scholar] [CrossRef]
- Zhang, Y.Q.; Kaiser, E.; Marcelis, L.F.M.; Yang, Q.C.; Li, T. Salt stress and fluctuating light have separate effects on photosynthetic acclimation, but interactively affect biomass. Plant Cell Environ. 2020, 43, 2192–2206. [Google Scholar] [CrossRef]
- Latef, A.A.H.A.; Abu Alhmad, M.F.; Abdelfattah, K.E. The Possible Roles of Priming with ZnO Nanoparticles in Mitigation of Salinity Stress in Lupine (Lupinus termis) Plants. J. Plant Growth Regul. 2017, 36, 60–70. [Google Scholar] [CrossRef]
- Abdelaal, K.A.A.; Mazrou, Y.S.A.; Hafez, Y.M. Silicon Foliar Application Mitigates Salt Stress in Sweet Pepper Plants by Enhancing Water Status, Photosynthesis, Antioxidant Enzyme Activity and Fruit Yield. Plants 2020, 9, 733. [Google Scholar] [CrossRef] [PubMed]
- Gitelson, A.A.; Anatoly, A.; Zur, Y.; Chivkunova, O.B.; Merzlyak, M.N. Assessing carotenoid content in plant leaves with reflectance spectroscopy. Photochem. Photobiol. 2002, 75, 272–281. [Google Scholar] [CrossRef]
- Ogawa, T.; Sonoike, K. Screening of mutants using chlorophyll fluorescence. J. Plant Res. 2021, 134, 653–664. [Google Scholar] [CrossRef] [PubMed]
- Faseela, P.; Sinisha, A.K.; Brestic, M.; Puthur, J.T. Chlorophyll a fluorescence parameters as indicators of a particular abiotic stress in rice. Photosynthetica 2020, 58, 293–300. [Google Scholar] [CrossRef]
- Murchie, E.H.; Ruban, A.V. Dynamic non-photochemical quenching in plants: From molecular mechanism to productivity. Plant J. 2020, 101, 885–896. [Google Scholar] [CrossRef]
- Tsai, Y.C.; Chen, K.C.; Cheng, T.S.; Lee, C.; Lin, S.H.; Tung, C.W. Chlorophyll fluorescence analysis in diverse rice varieties reveals the positive correlation between the seedlings salt tolerance and photosynthetic efficiency. BMC Plant Biol. 2019, 19, 403. [Google Scholar] [CrossRef]
- Miller, G.; Suzuki, N.; Ciftci-Yilmaz, S.; Mittler, R. Reactive oxygen species homeostasis and signaling during drought and salinity stresses. Plant Cell Environ. 2010, 33, 453–467. [Google Scholar] [CrossRef]
- Liu, X.X.; Ma, D.K.; Zhang, Z.Y.; Wang, S.W.; Du, S.; Deng, X.P.; Yin, L.N. Plant lipid remodeling in response to abiotic stresses. Environ. Exp. Bot. 2019, 165, 174–184. [Google Scholar] [CrossRef]
- Gogna, M.; Choudhary, A.; Mishra, G.; Kapoor, R.; Bhatla, S.C. Changes in lipid composition in response to salt stress and its possible interaction with intracellular Na+-K+ ratio in sunflower (Helianthus annuus L.). Environ. Exp. Bot. 2020, 178, 104147. [Google Scholar] [CrossRef]
- Sui, N.; Wang, Y.; Liu, S.S.; Yang, Z.; Wang, F.; Wan, S.B. Transcriptomic and Physiological Evidence for the Relationship between Unsaturated Fatty Acid and Salt Stress in Peanut. Front. Plant Sci. 2018, 9, 7. [Google Scholar] [CrossRef] [PubMed]
Publisher’s Note: MDPI stays neutral with regard to jurisdictional claims in published maps and institutional affiliations. |
© 2022 by the authors. Licensee MDPI, Basel, Switzerland. This article is an open access article distributed under the terms and conditions of the Creative Commons Attribution (CC BY) license (https://creativecommons.org/licenses/by/4.0/).