
Contribution of Road Transport to the Attainment of Ghana’s Nationally Determined Contribution (NDC) through Biofuel Integration


Abstract
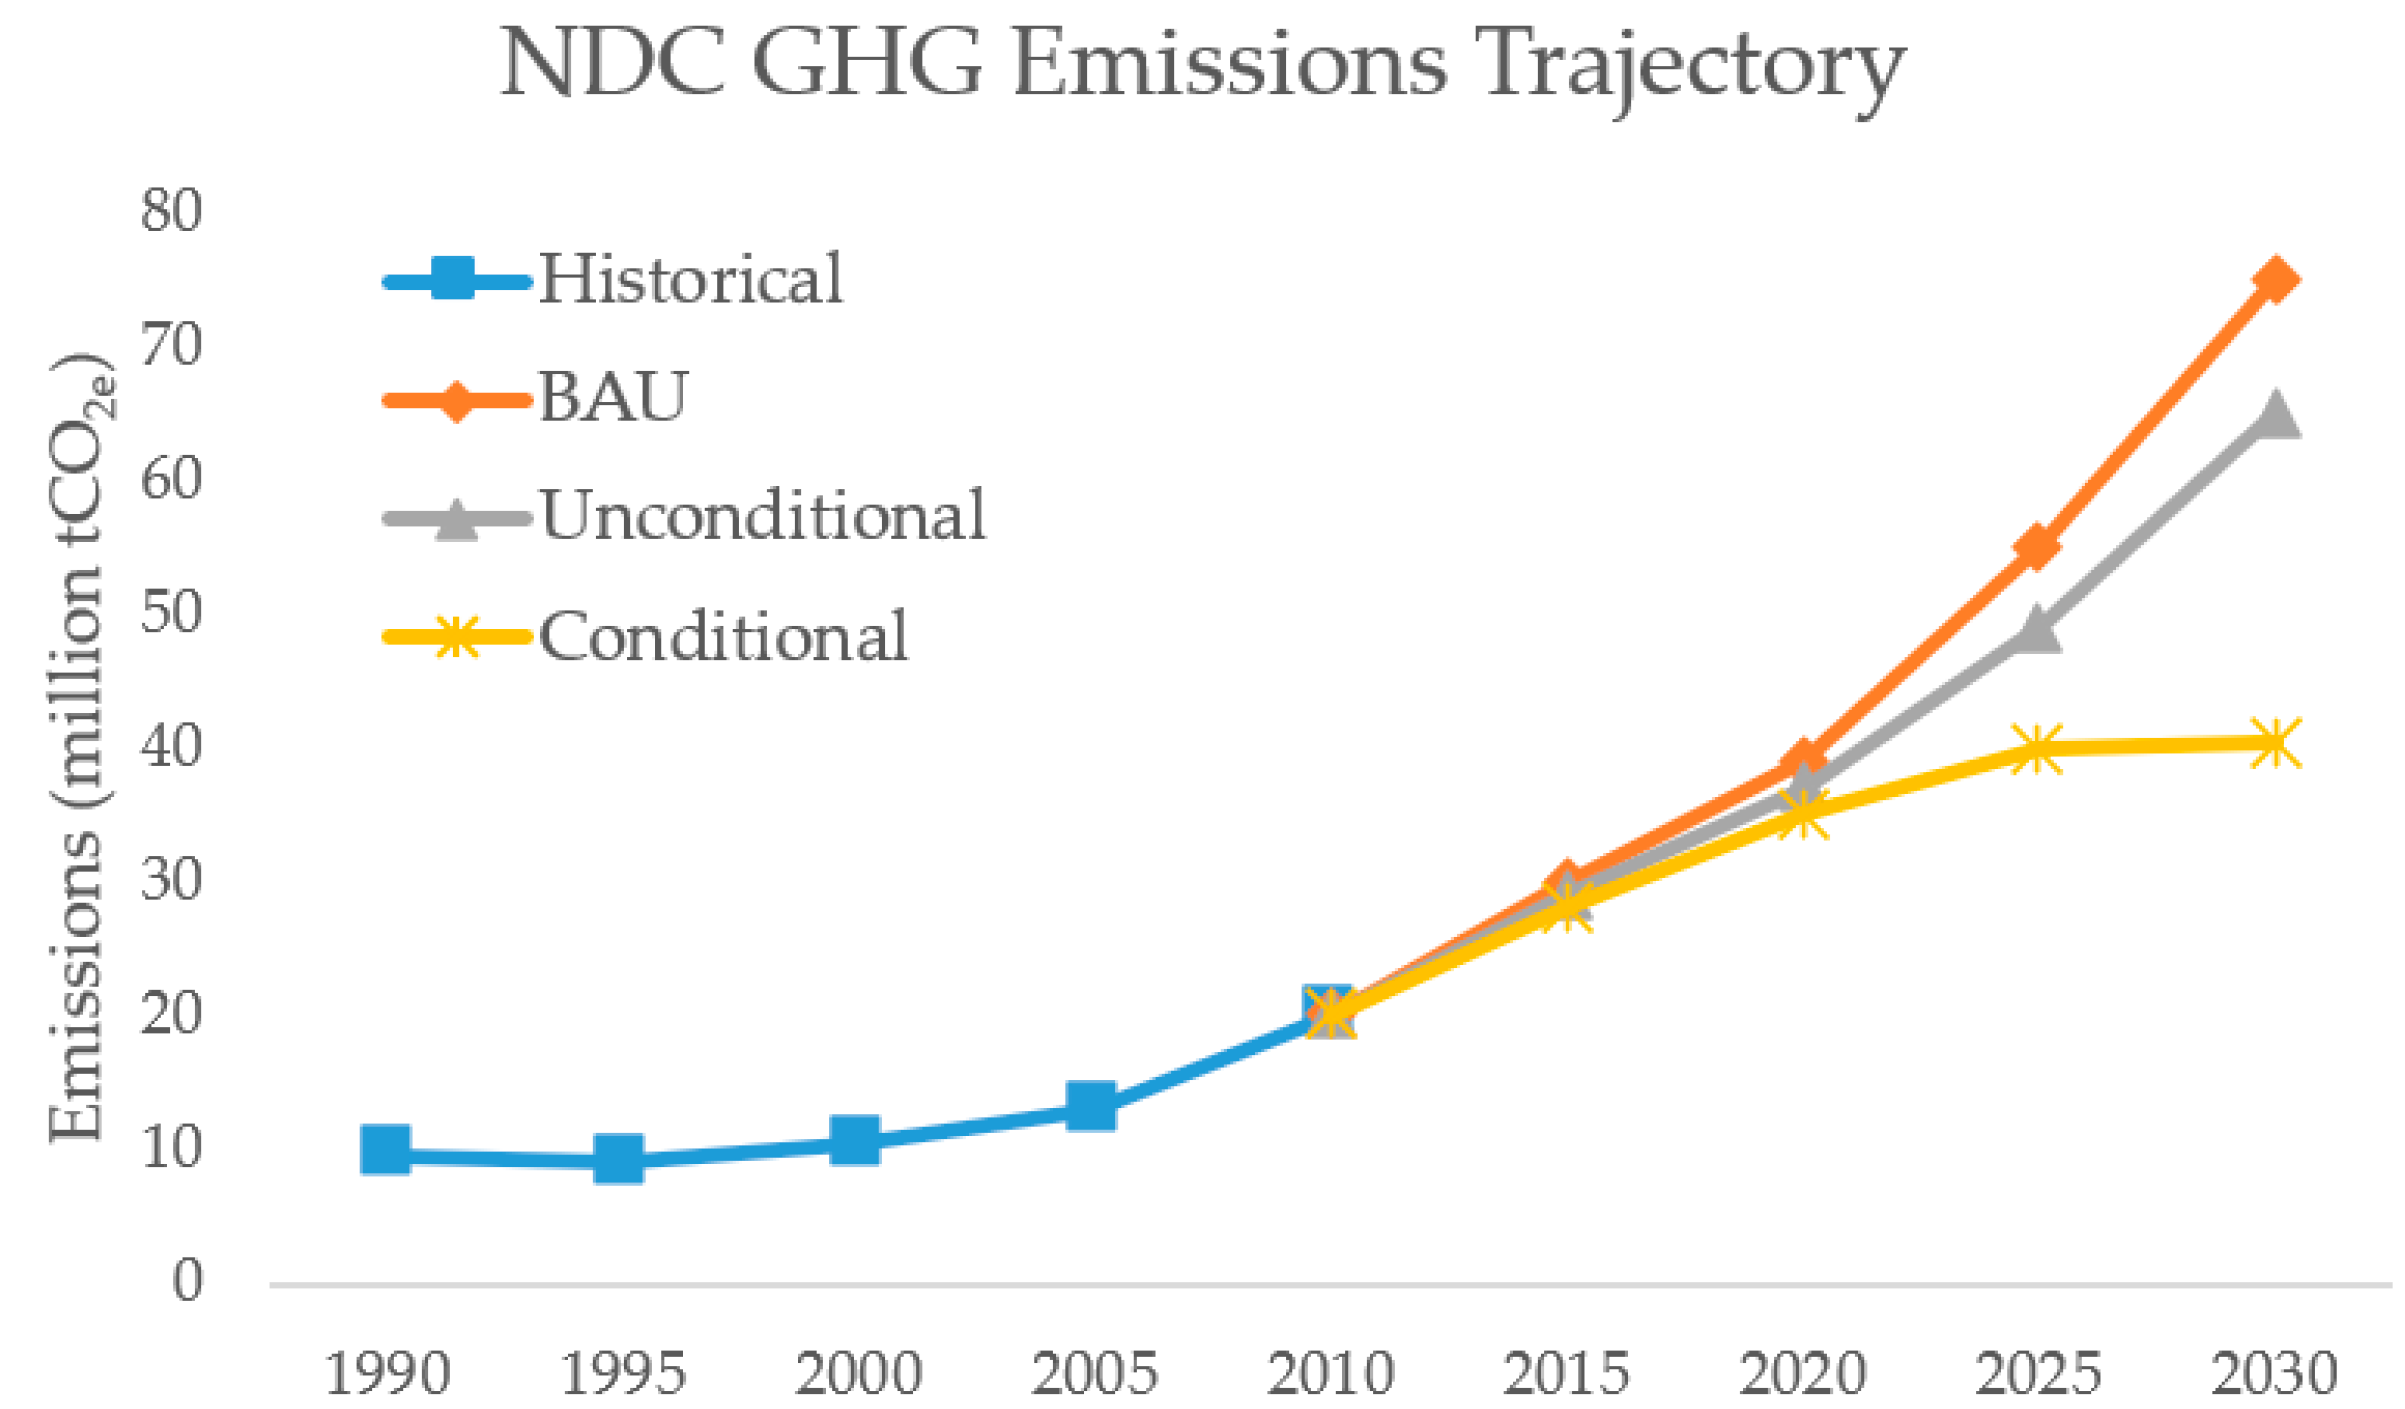
:1. Introduction
2. Methodology
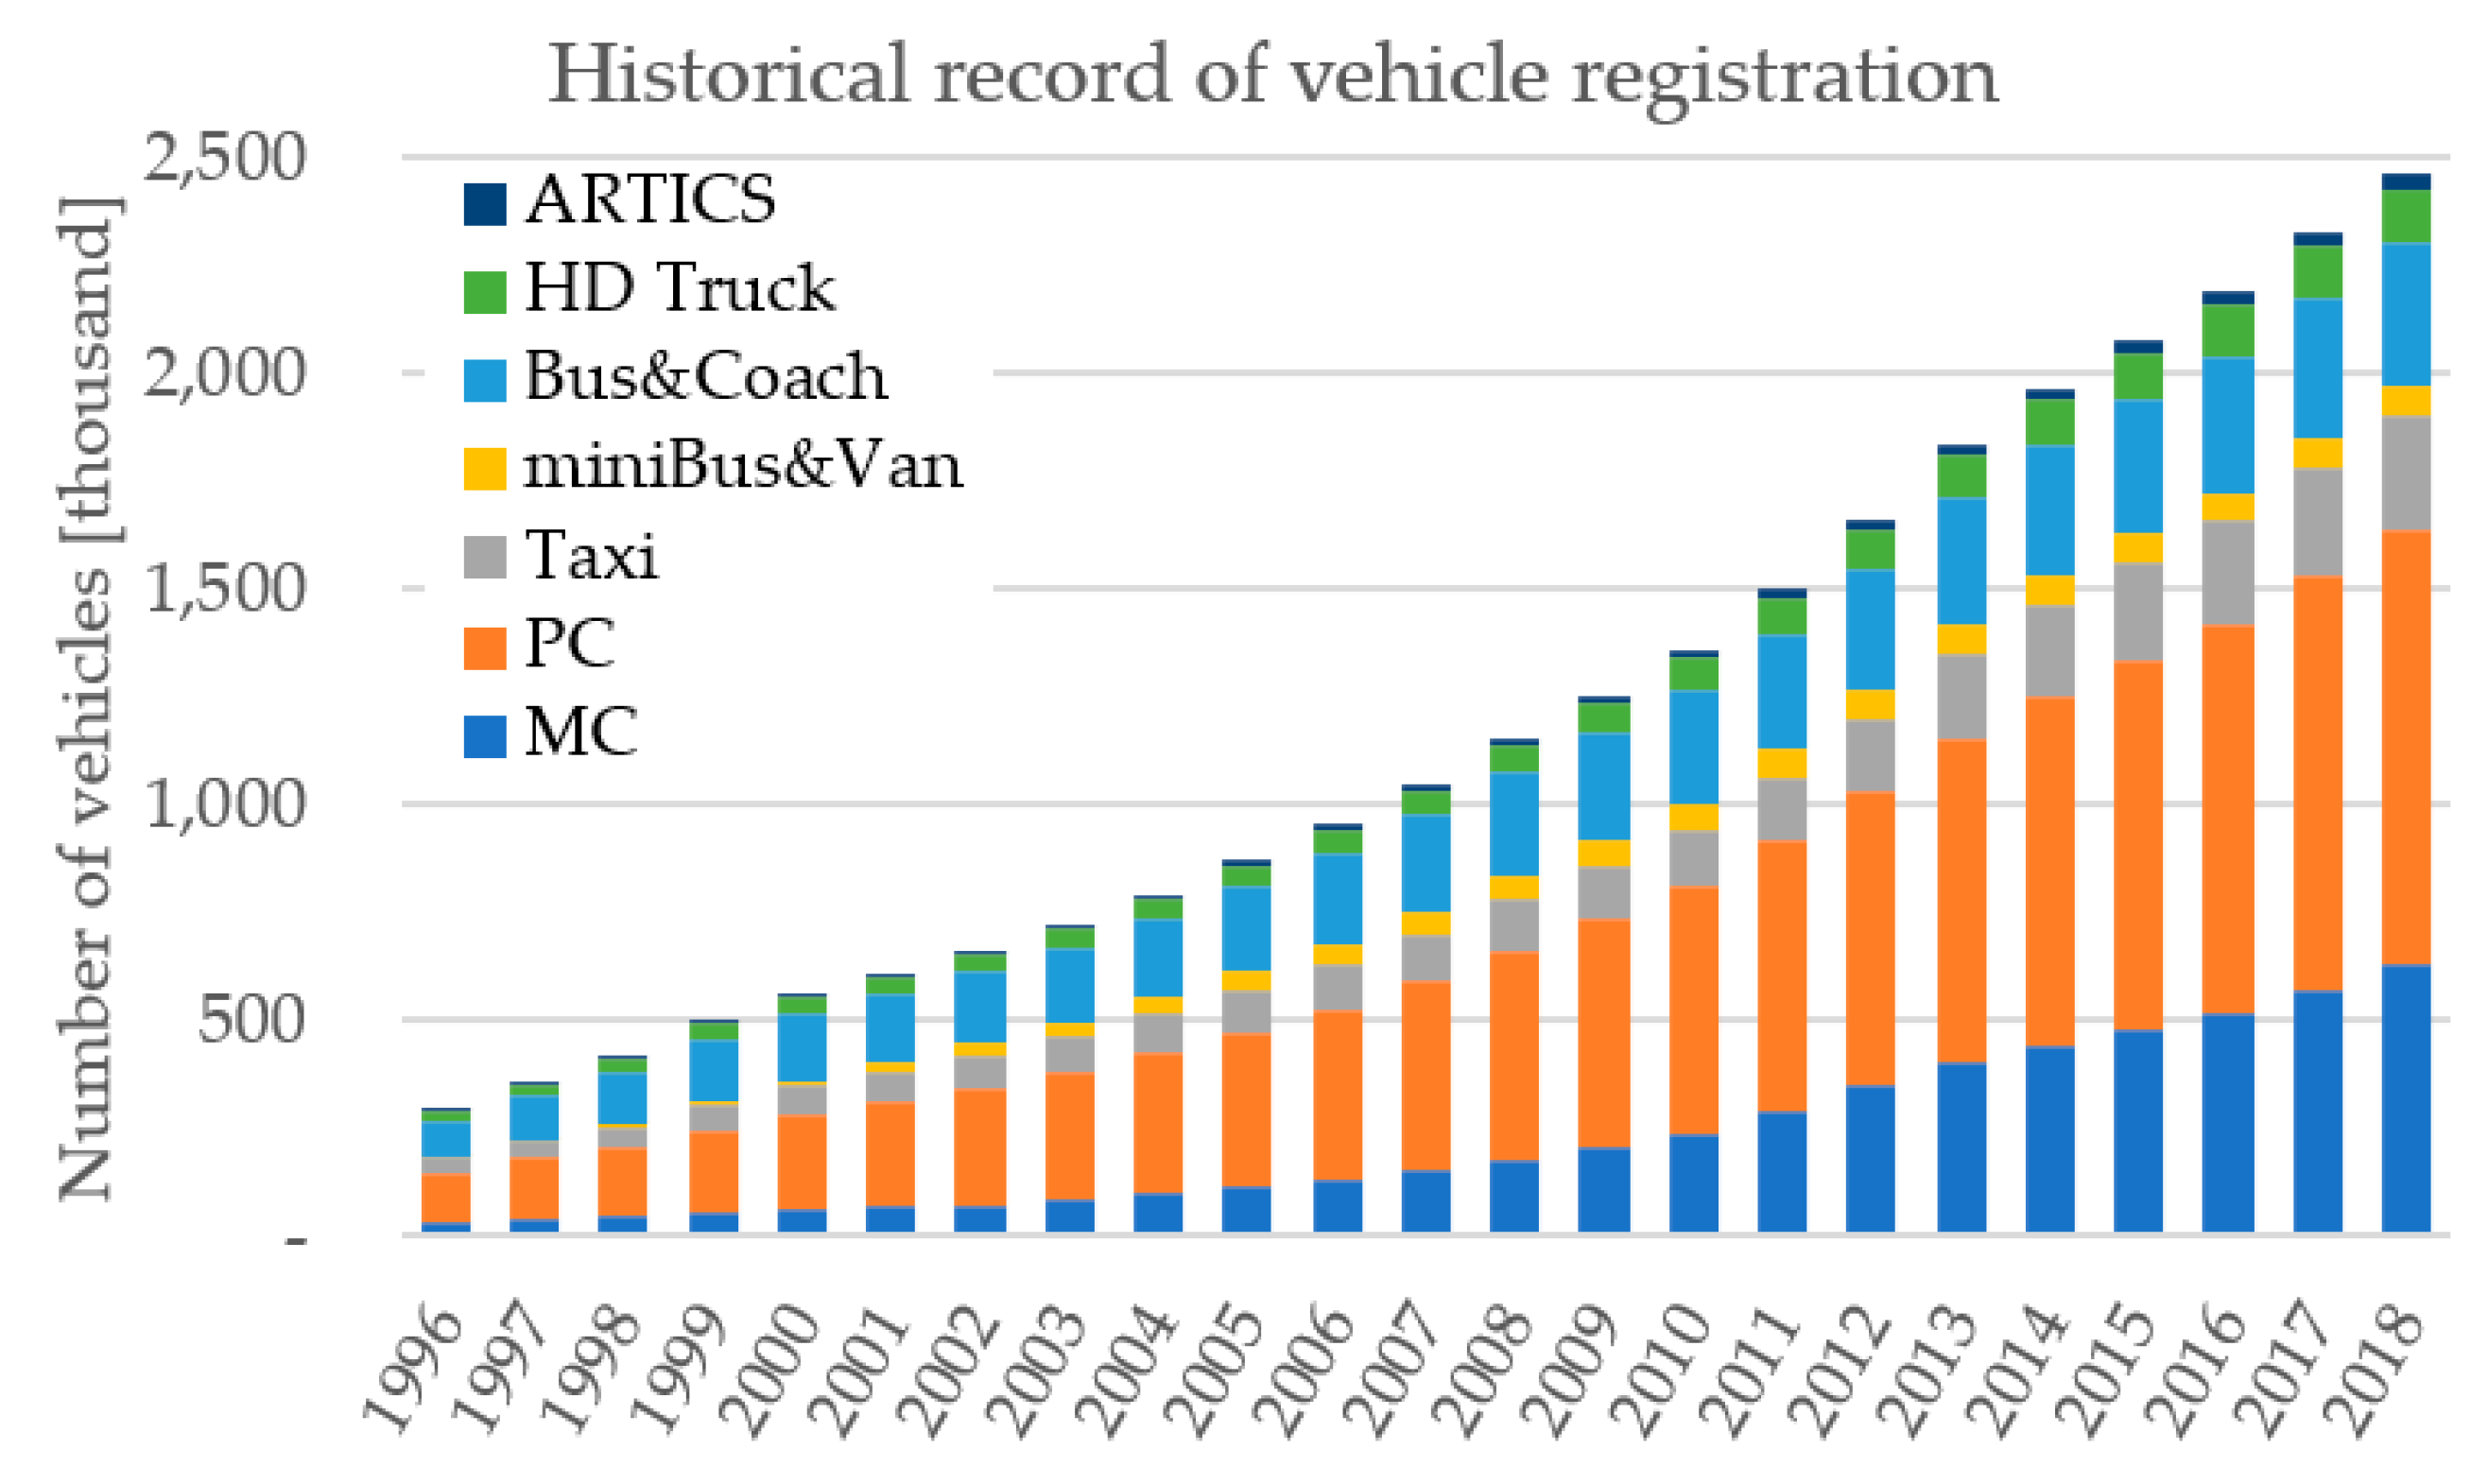
2.1. Data Collection
2.2. Model Development
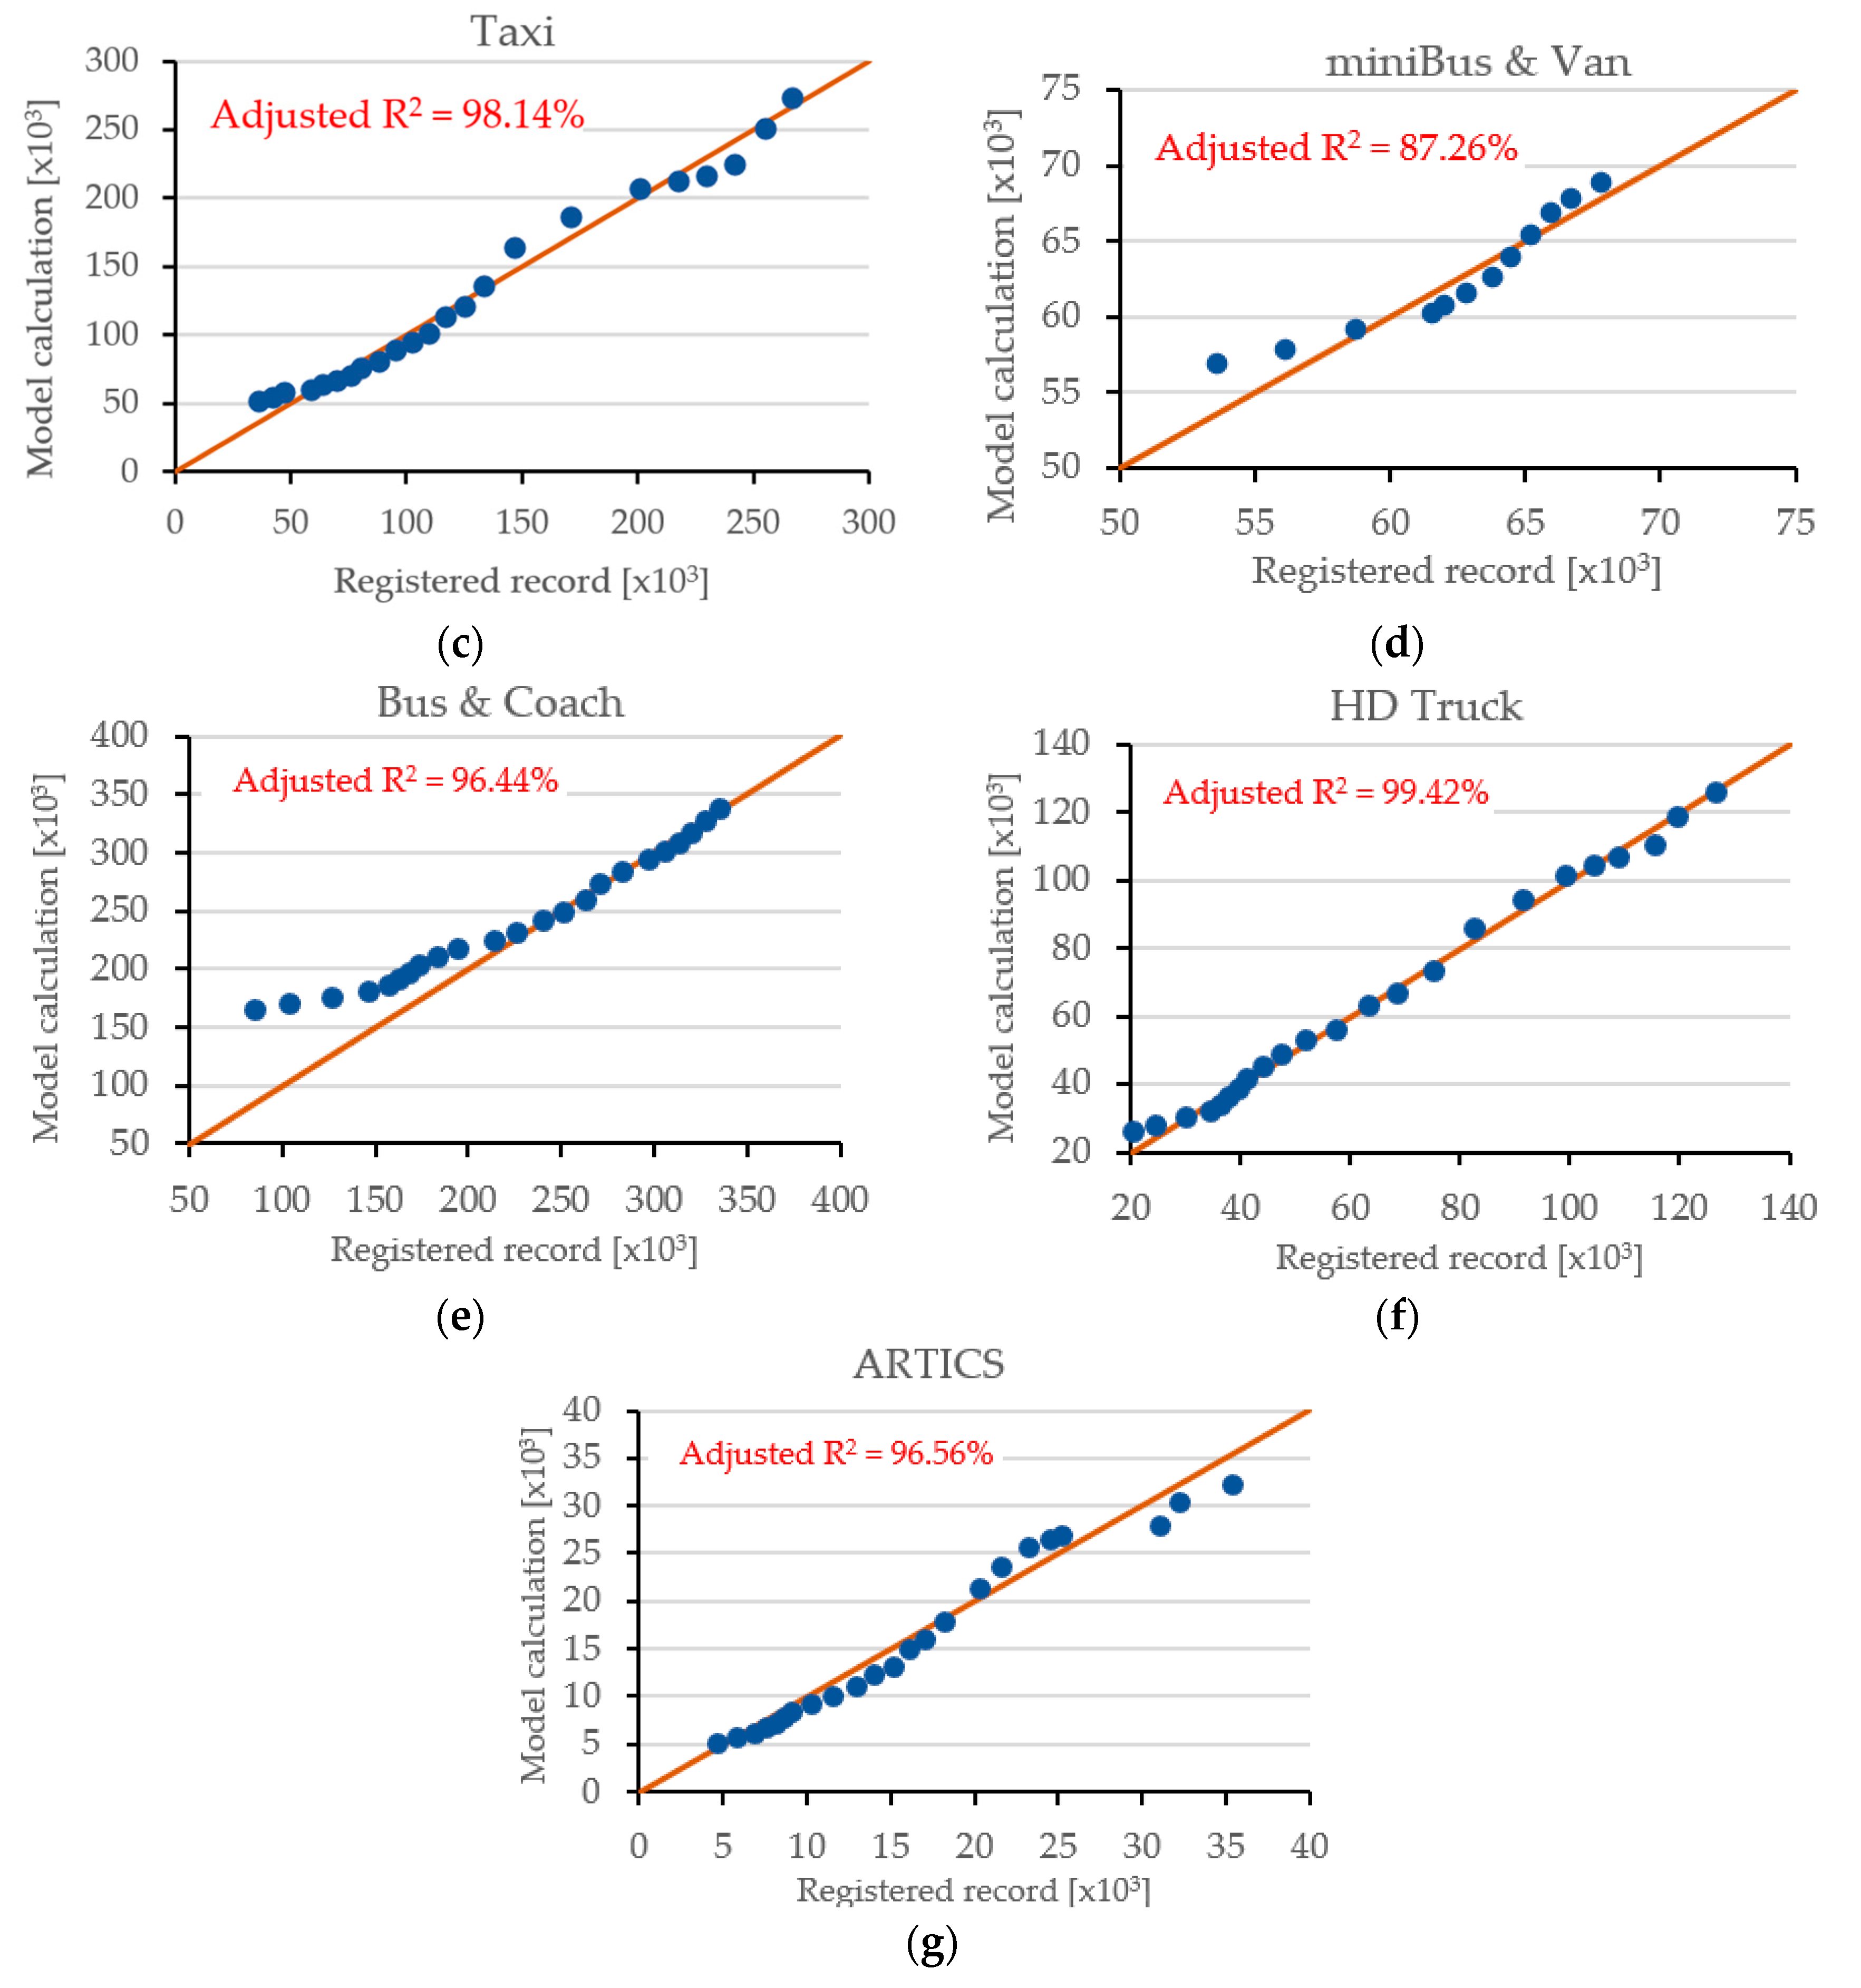
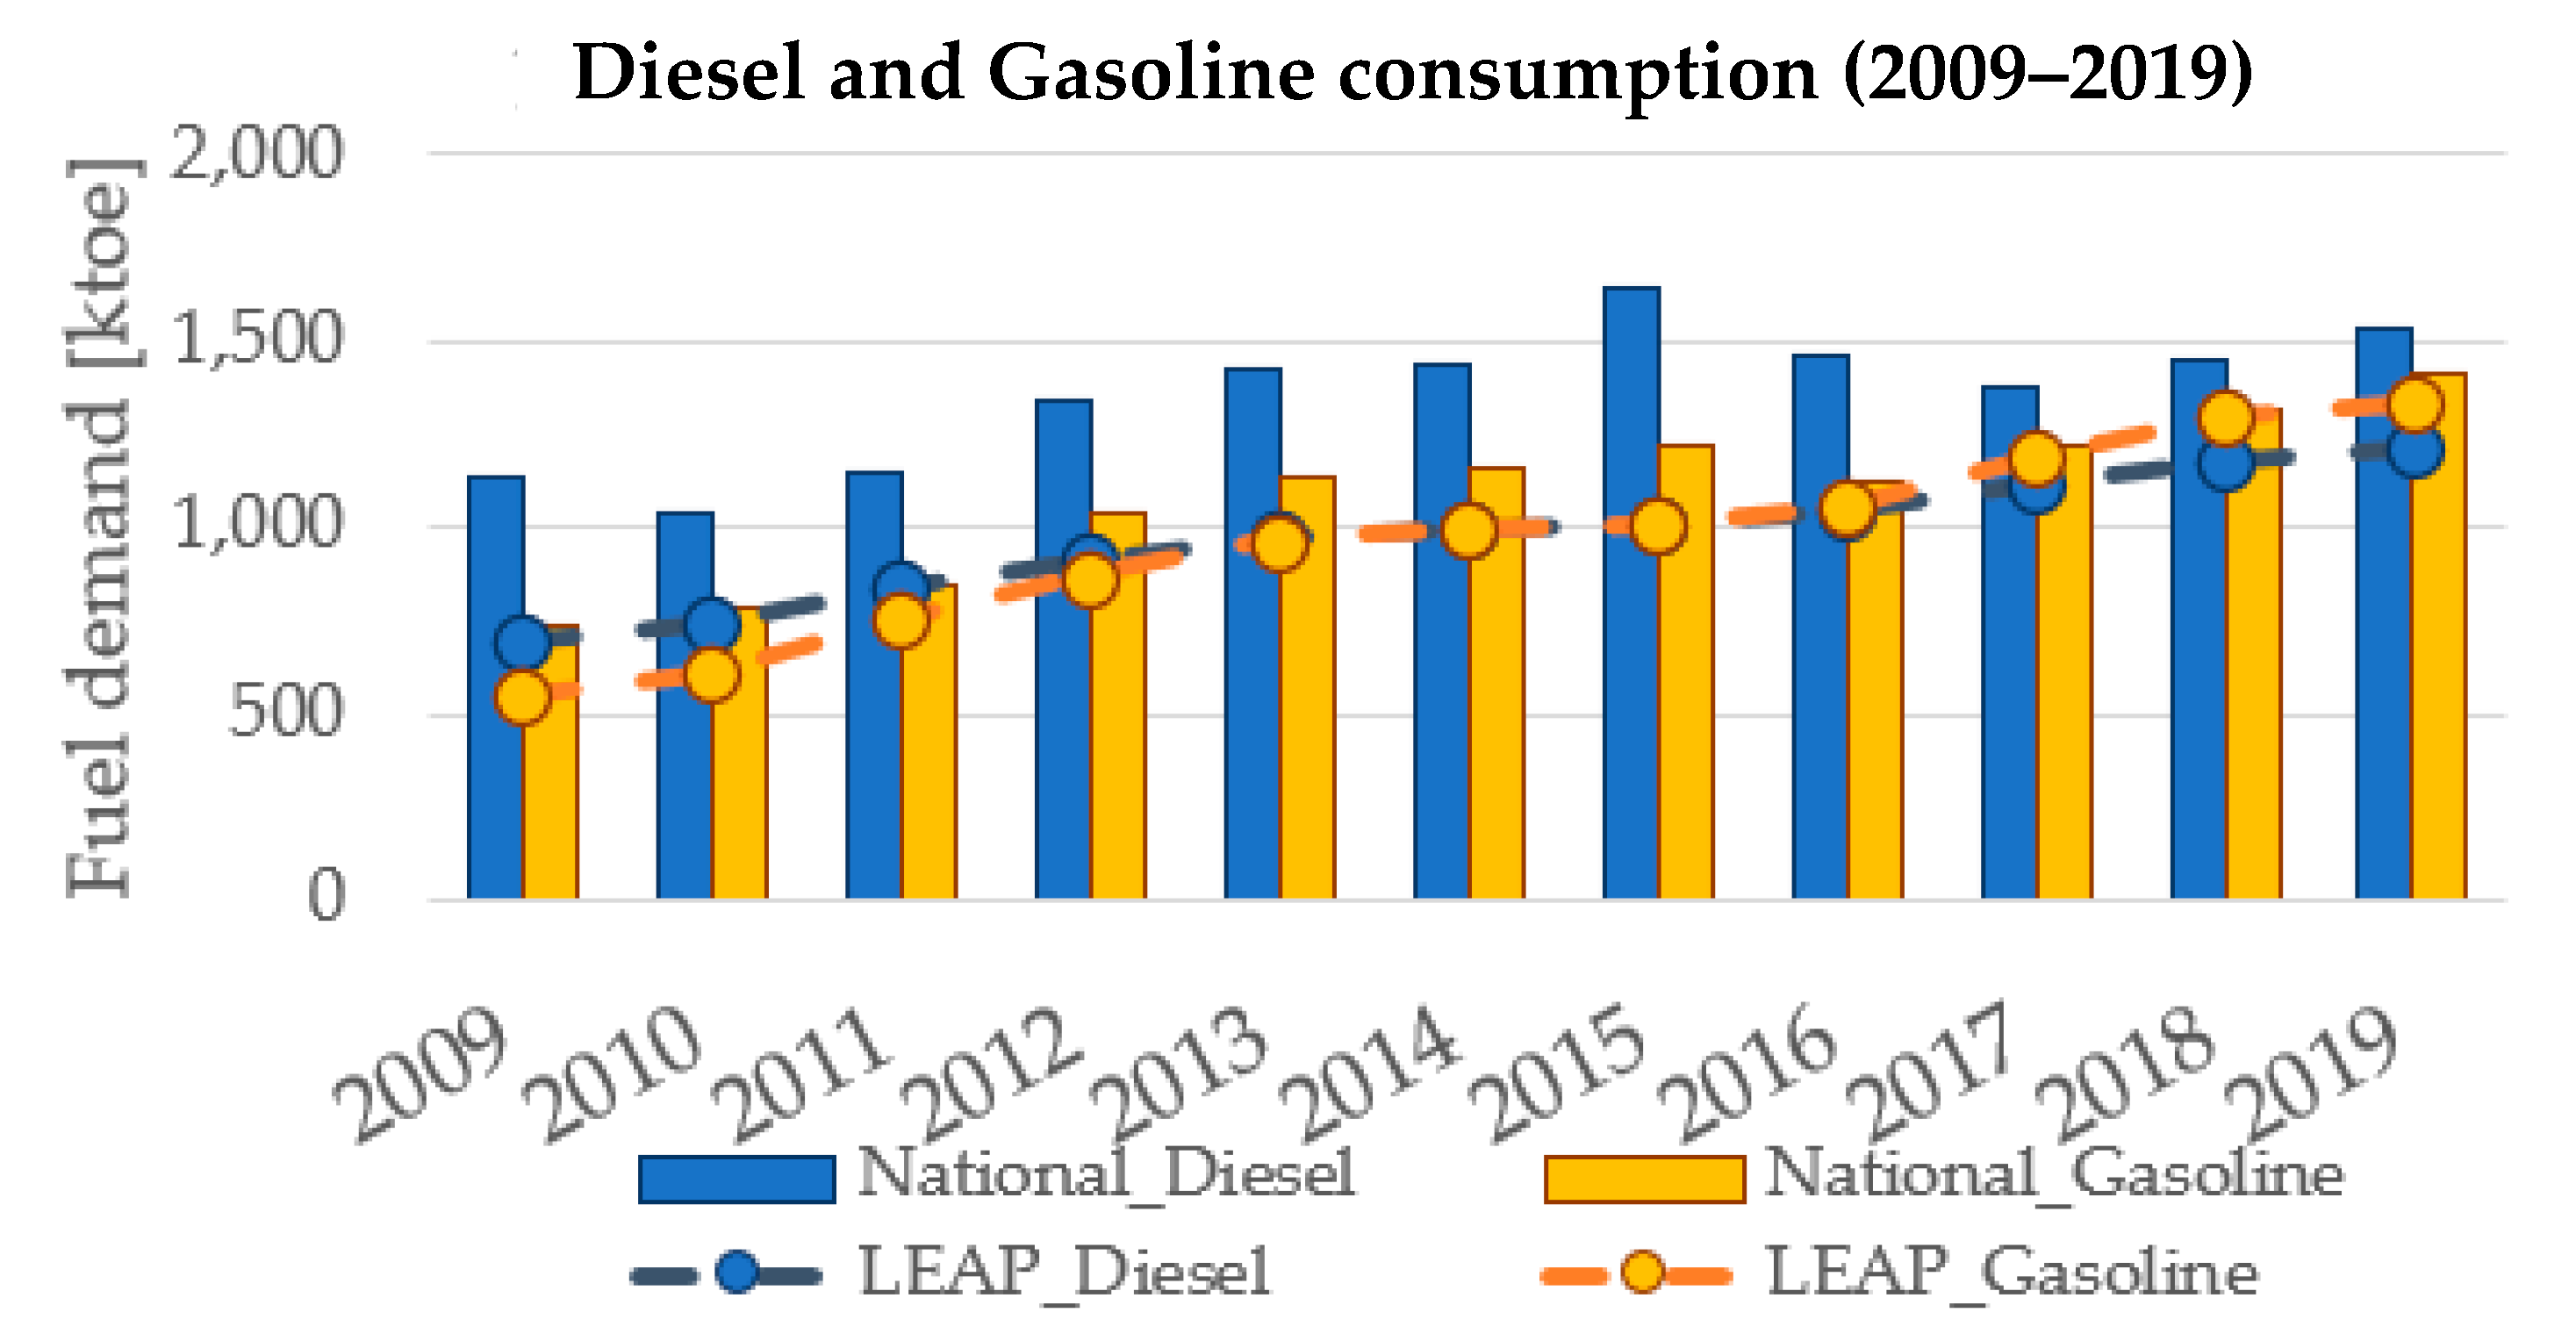
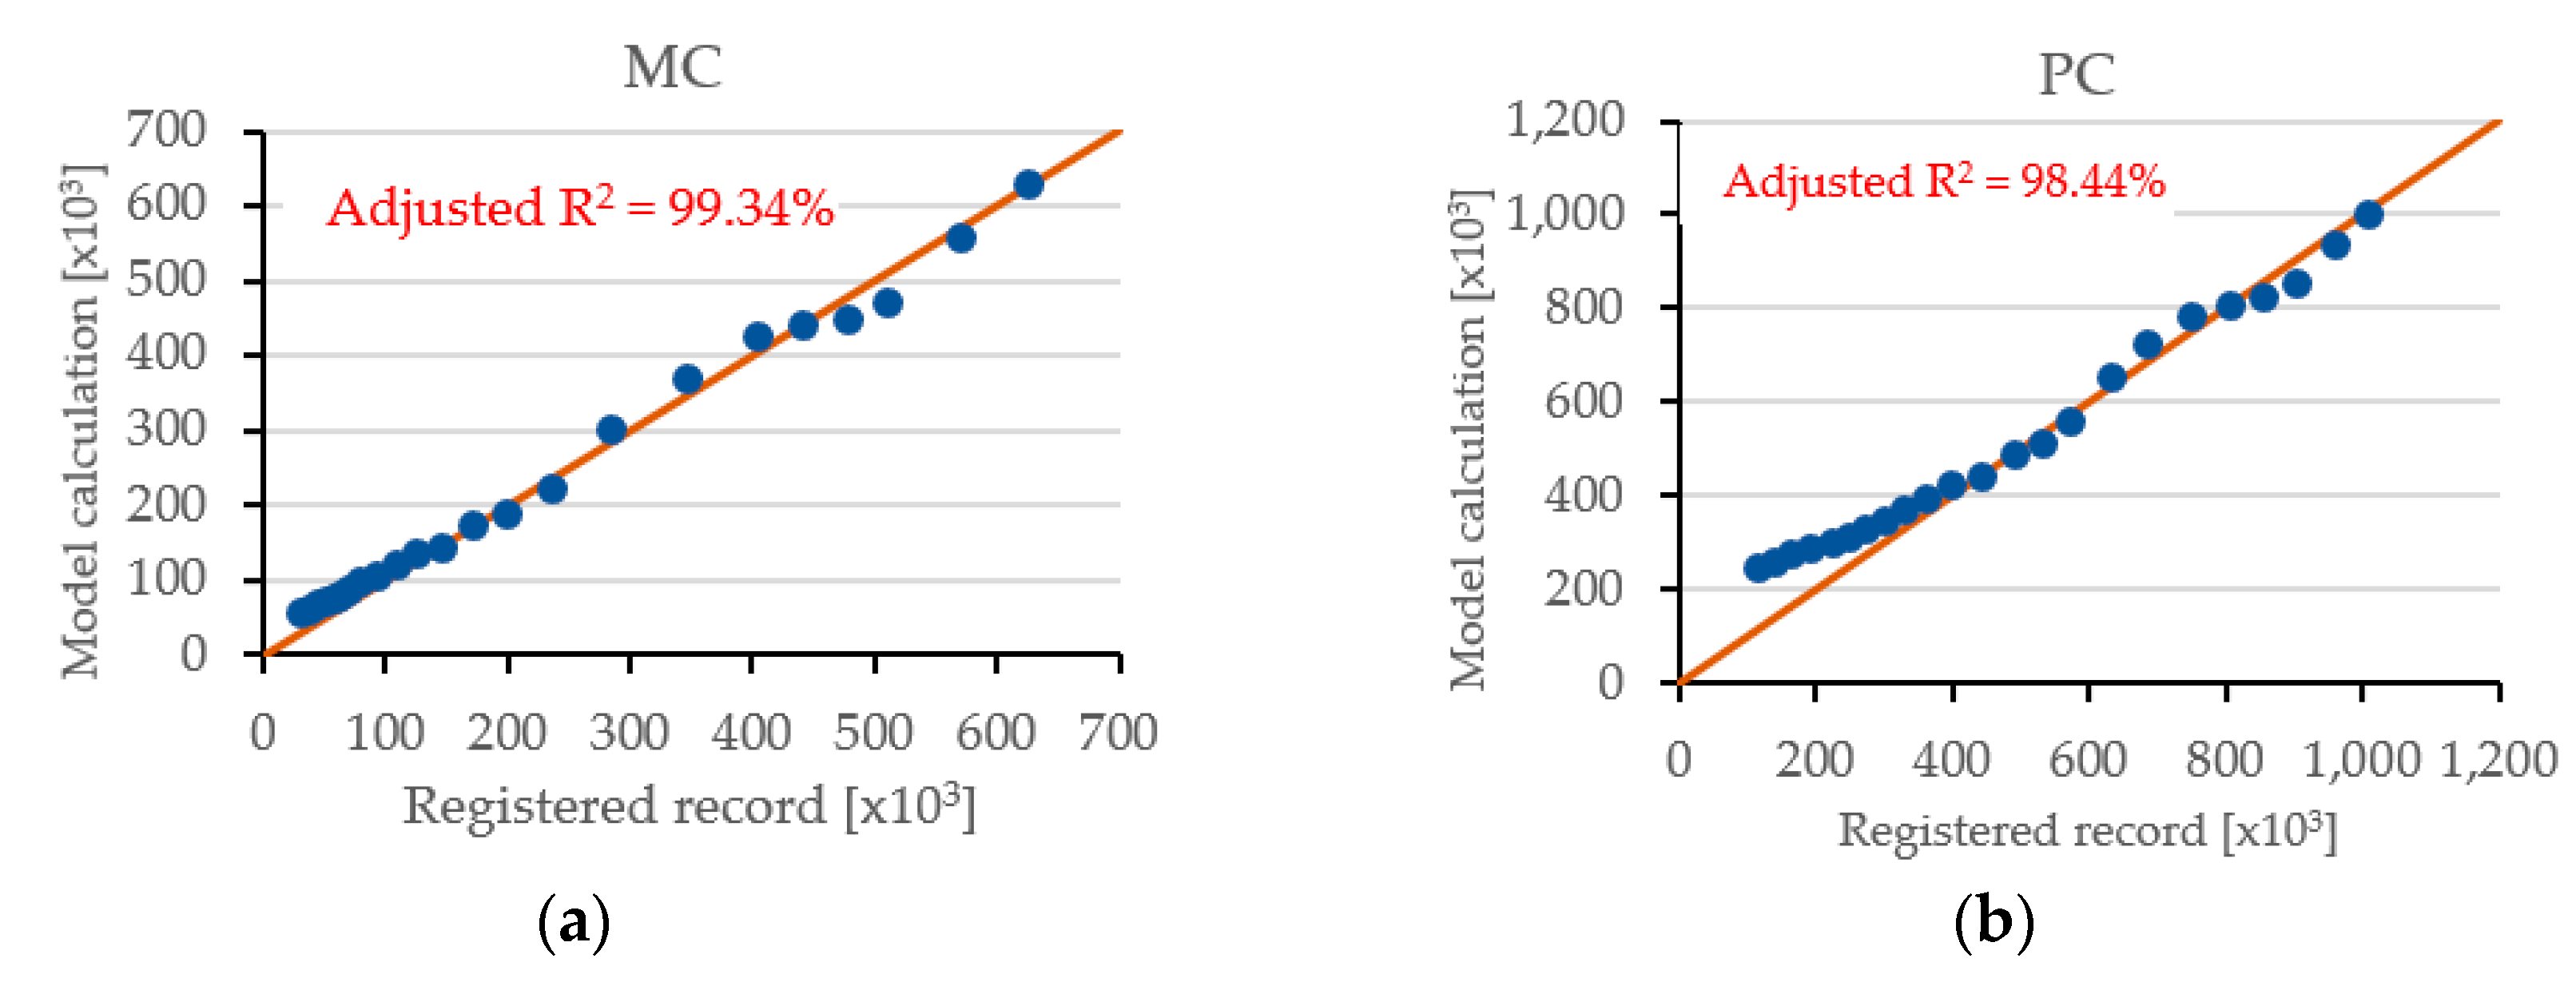
2.3. Validations
2.4. Greenhouse Gas Emission Calculation
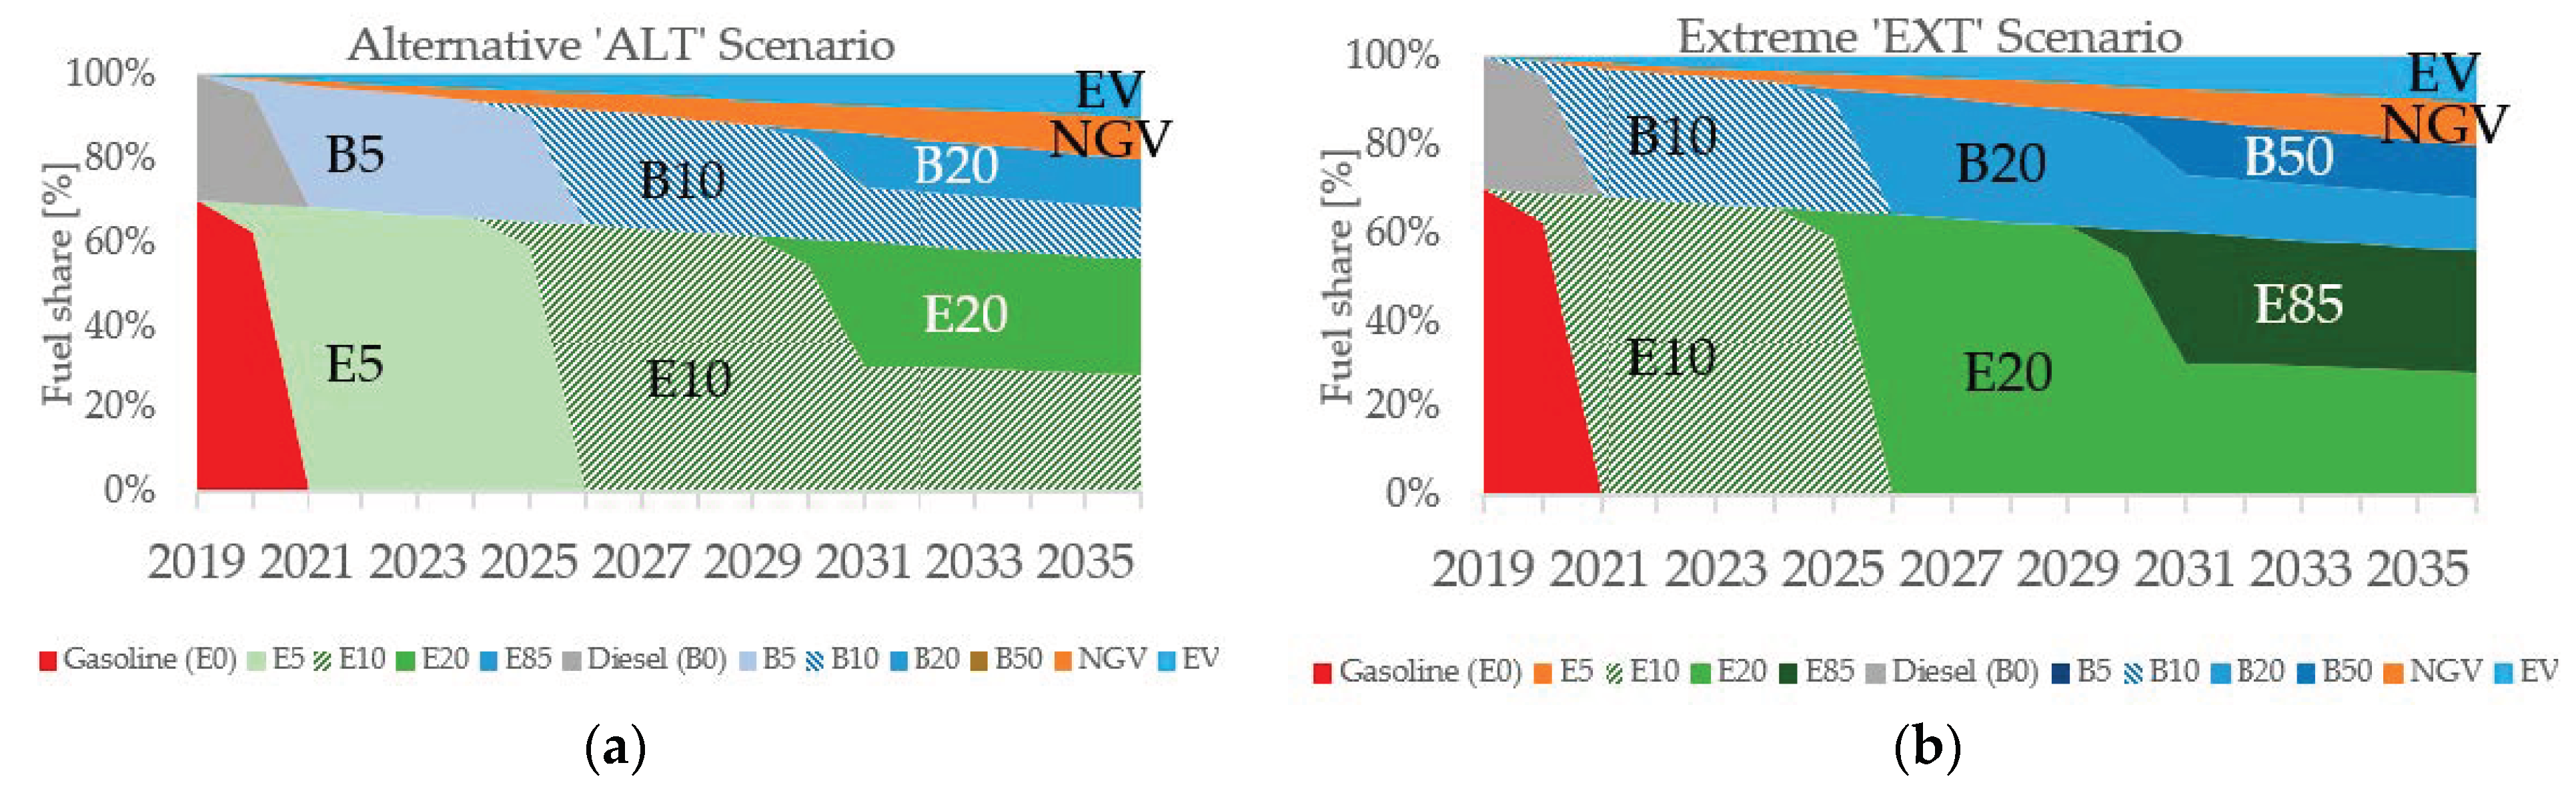
2.5. Scenario Definitions
3. Results and Analyses
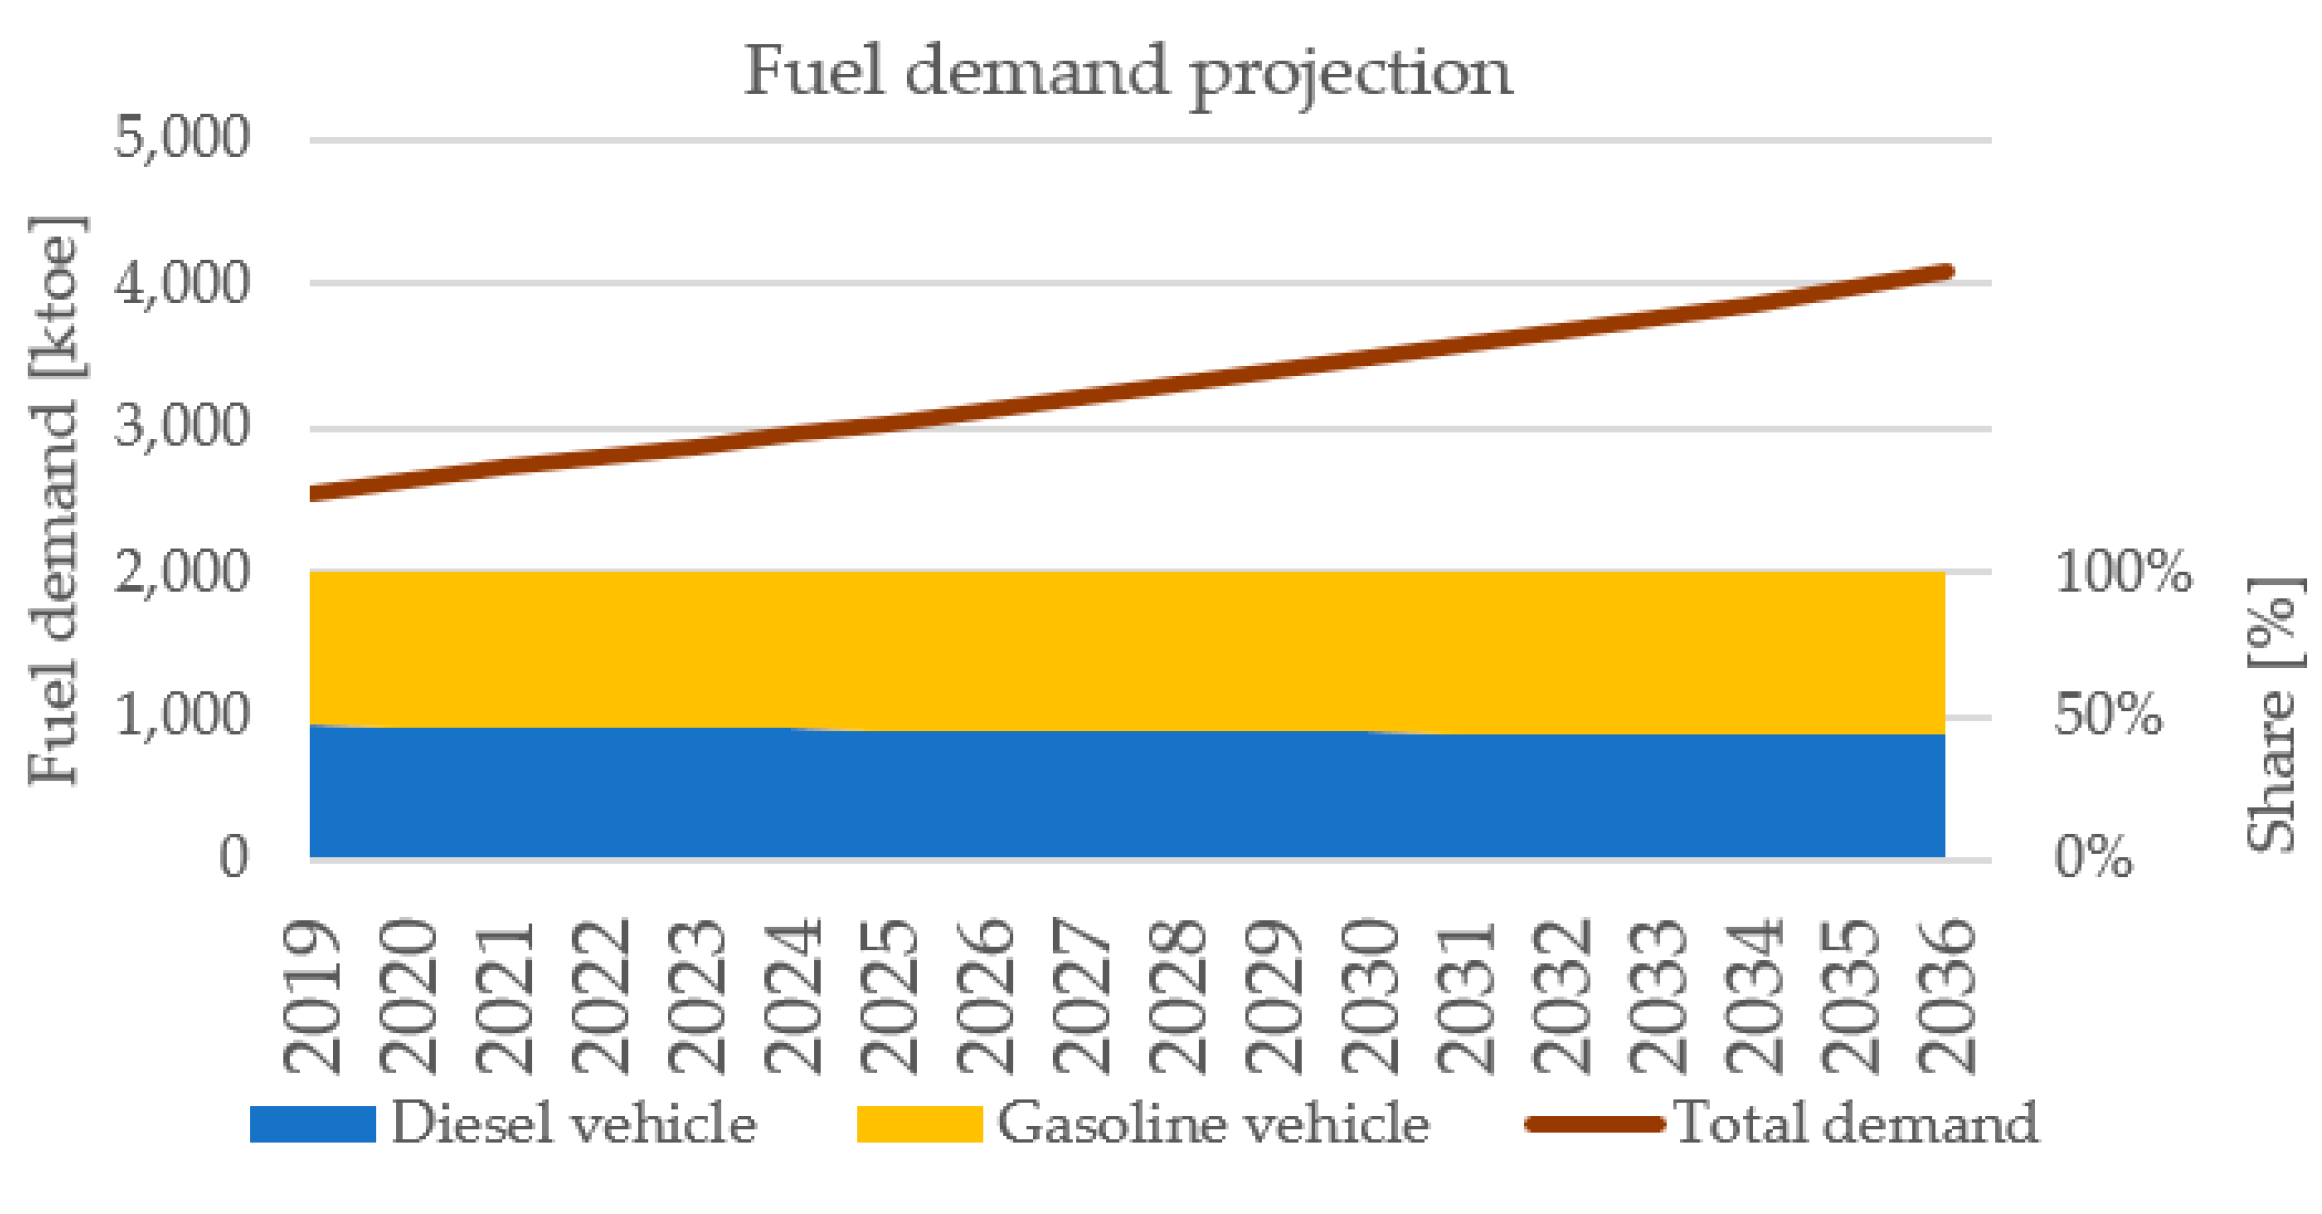
3.1. Impacts on Energy Demand
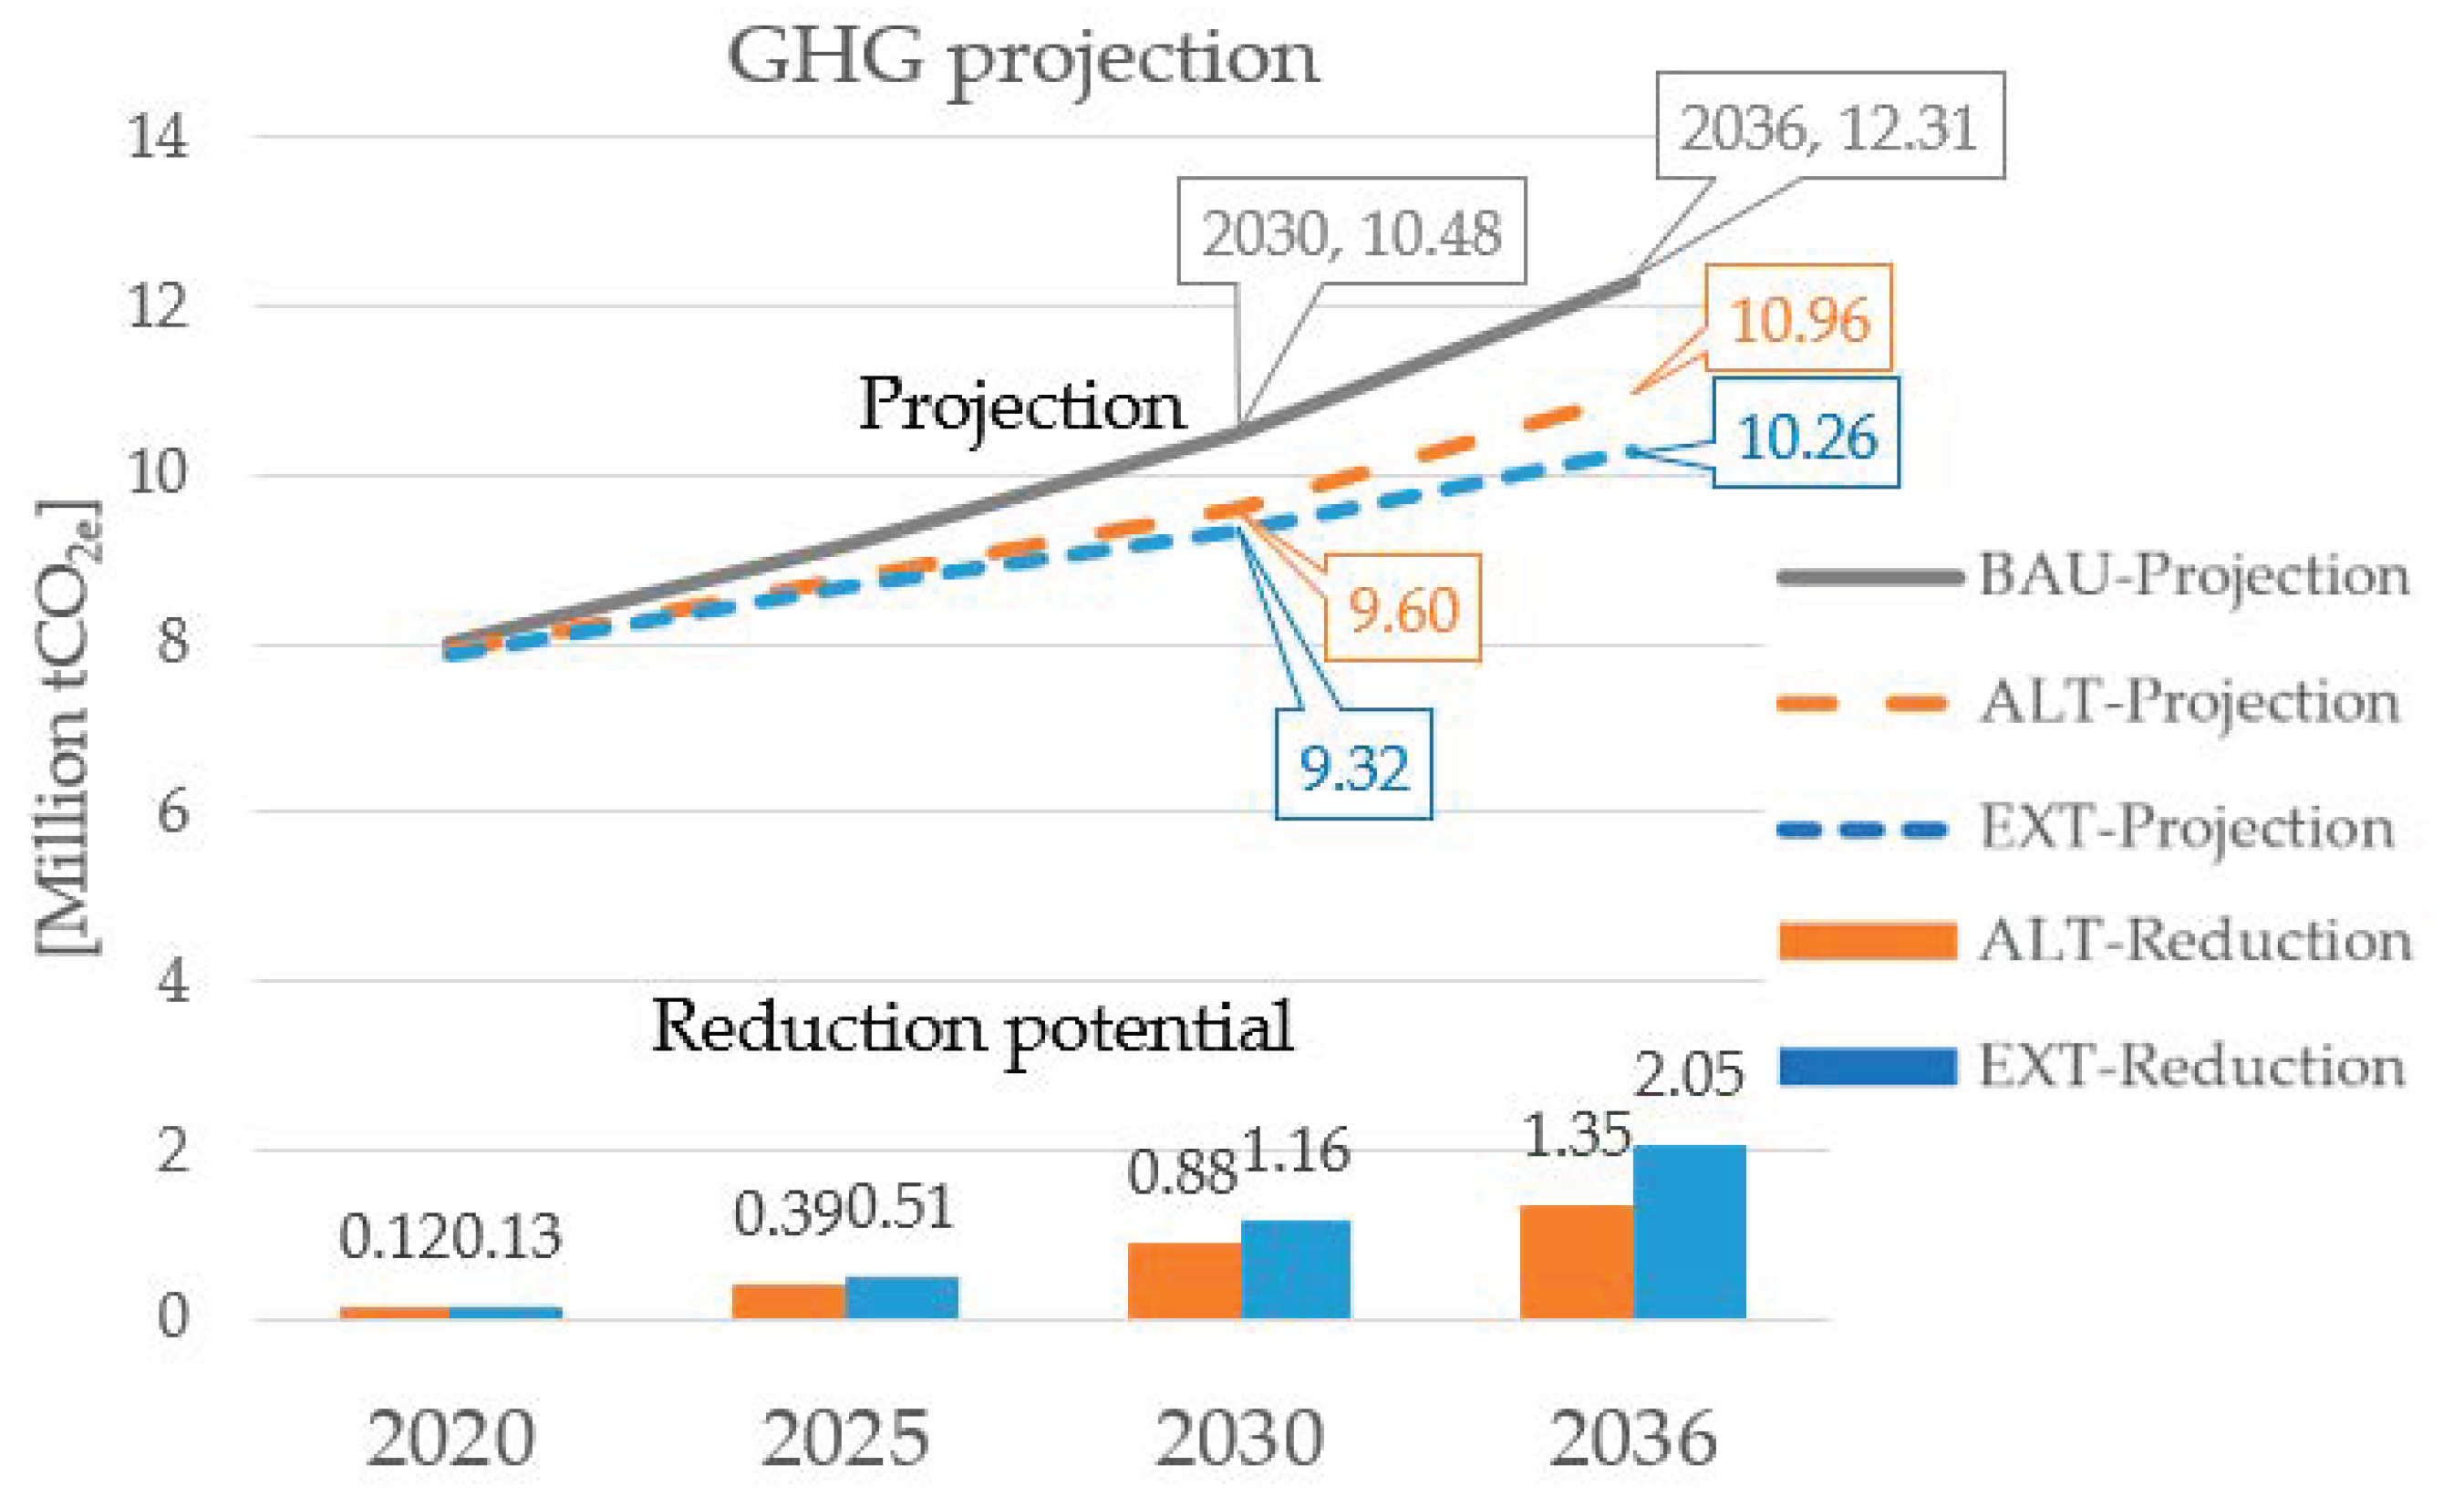
3.2. GHG Emission Mitigation
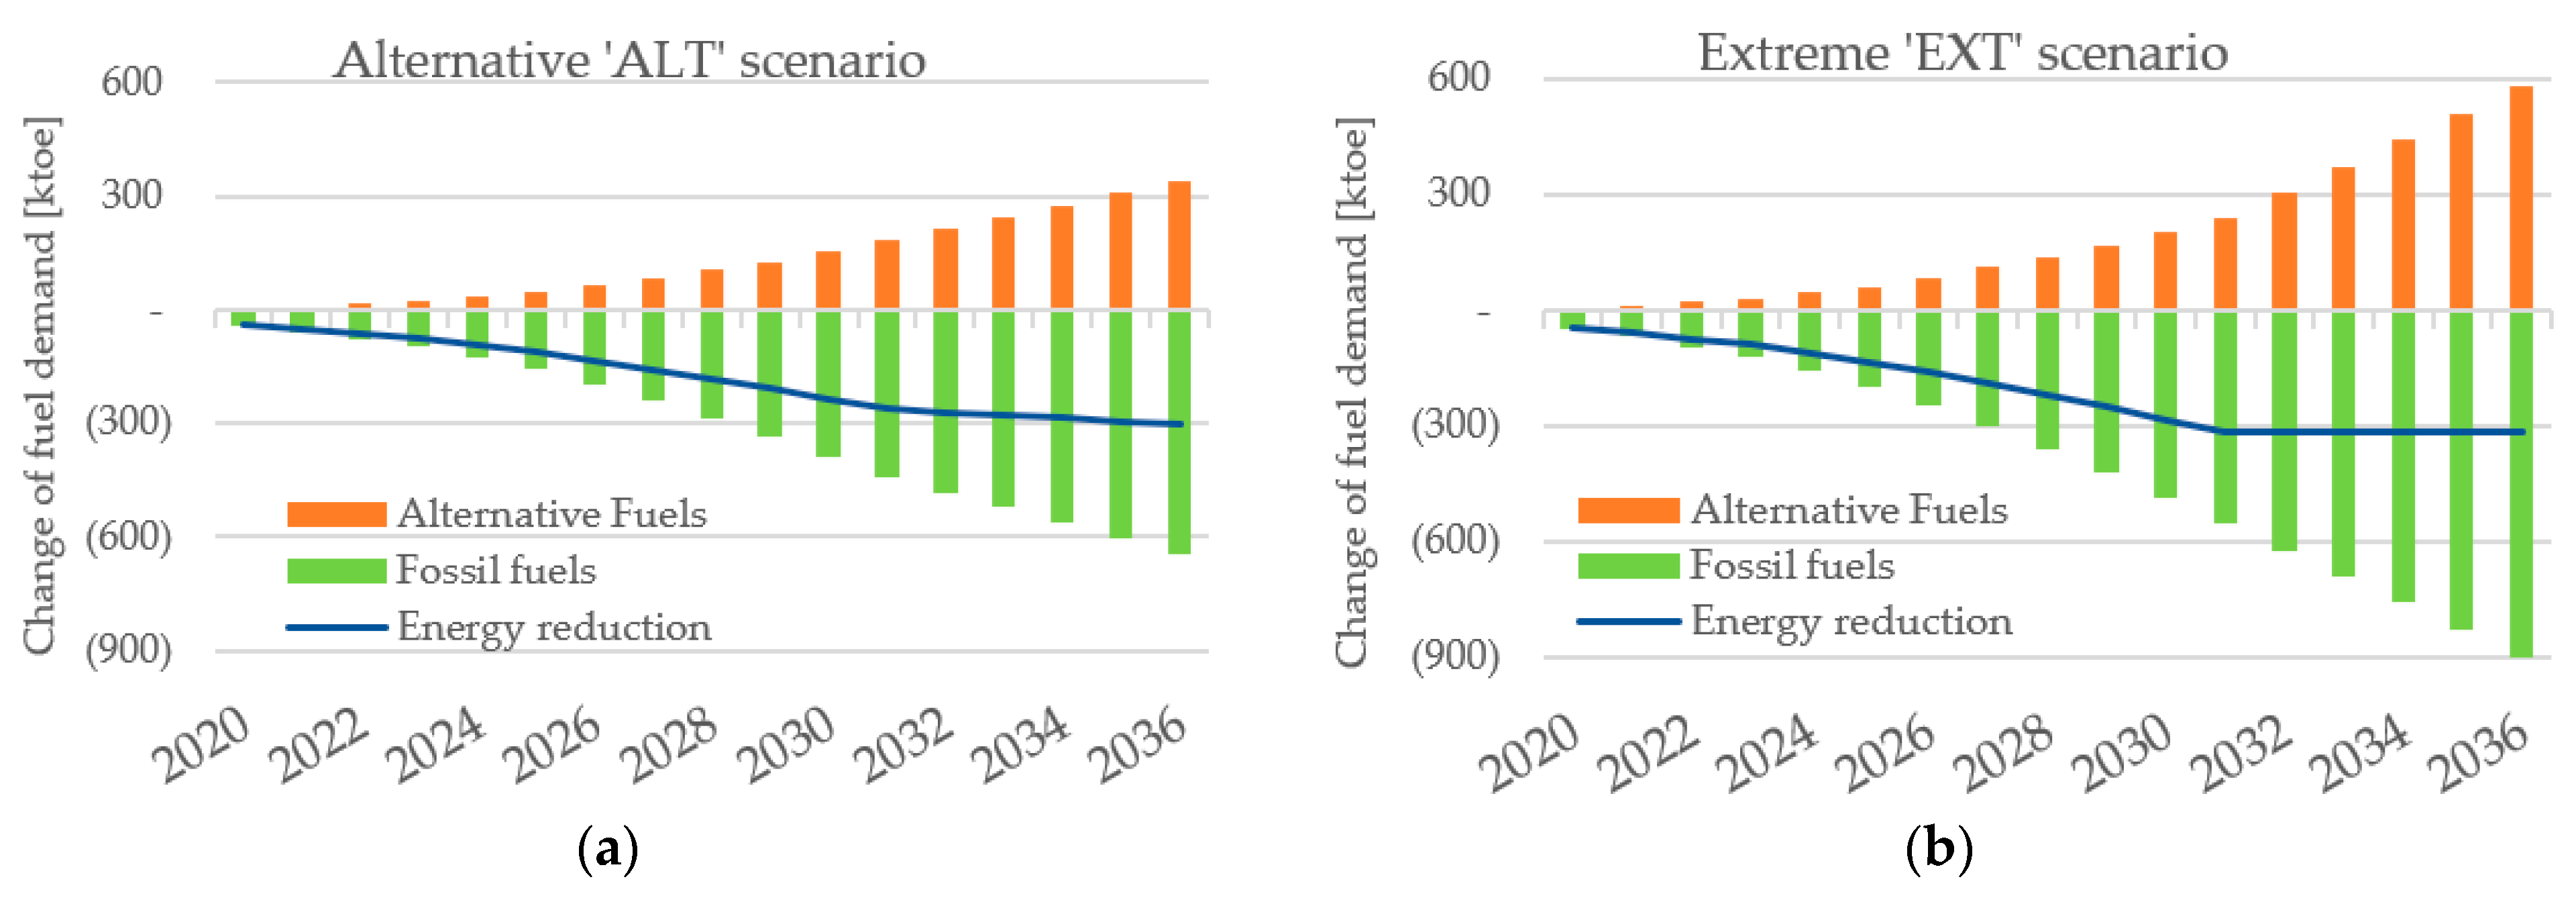
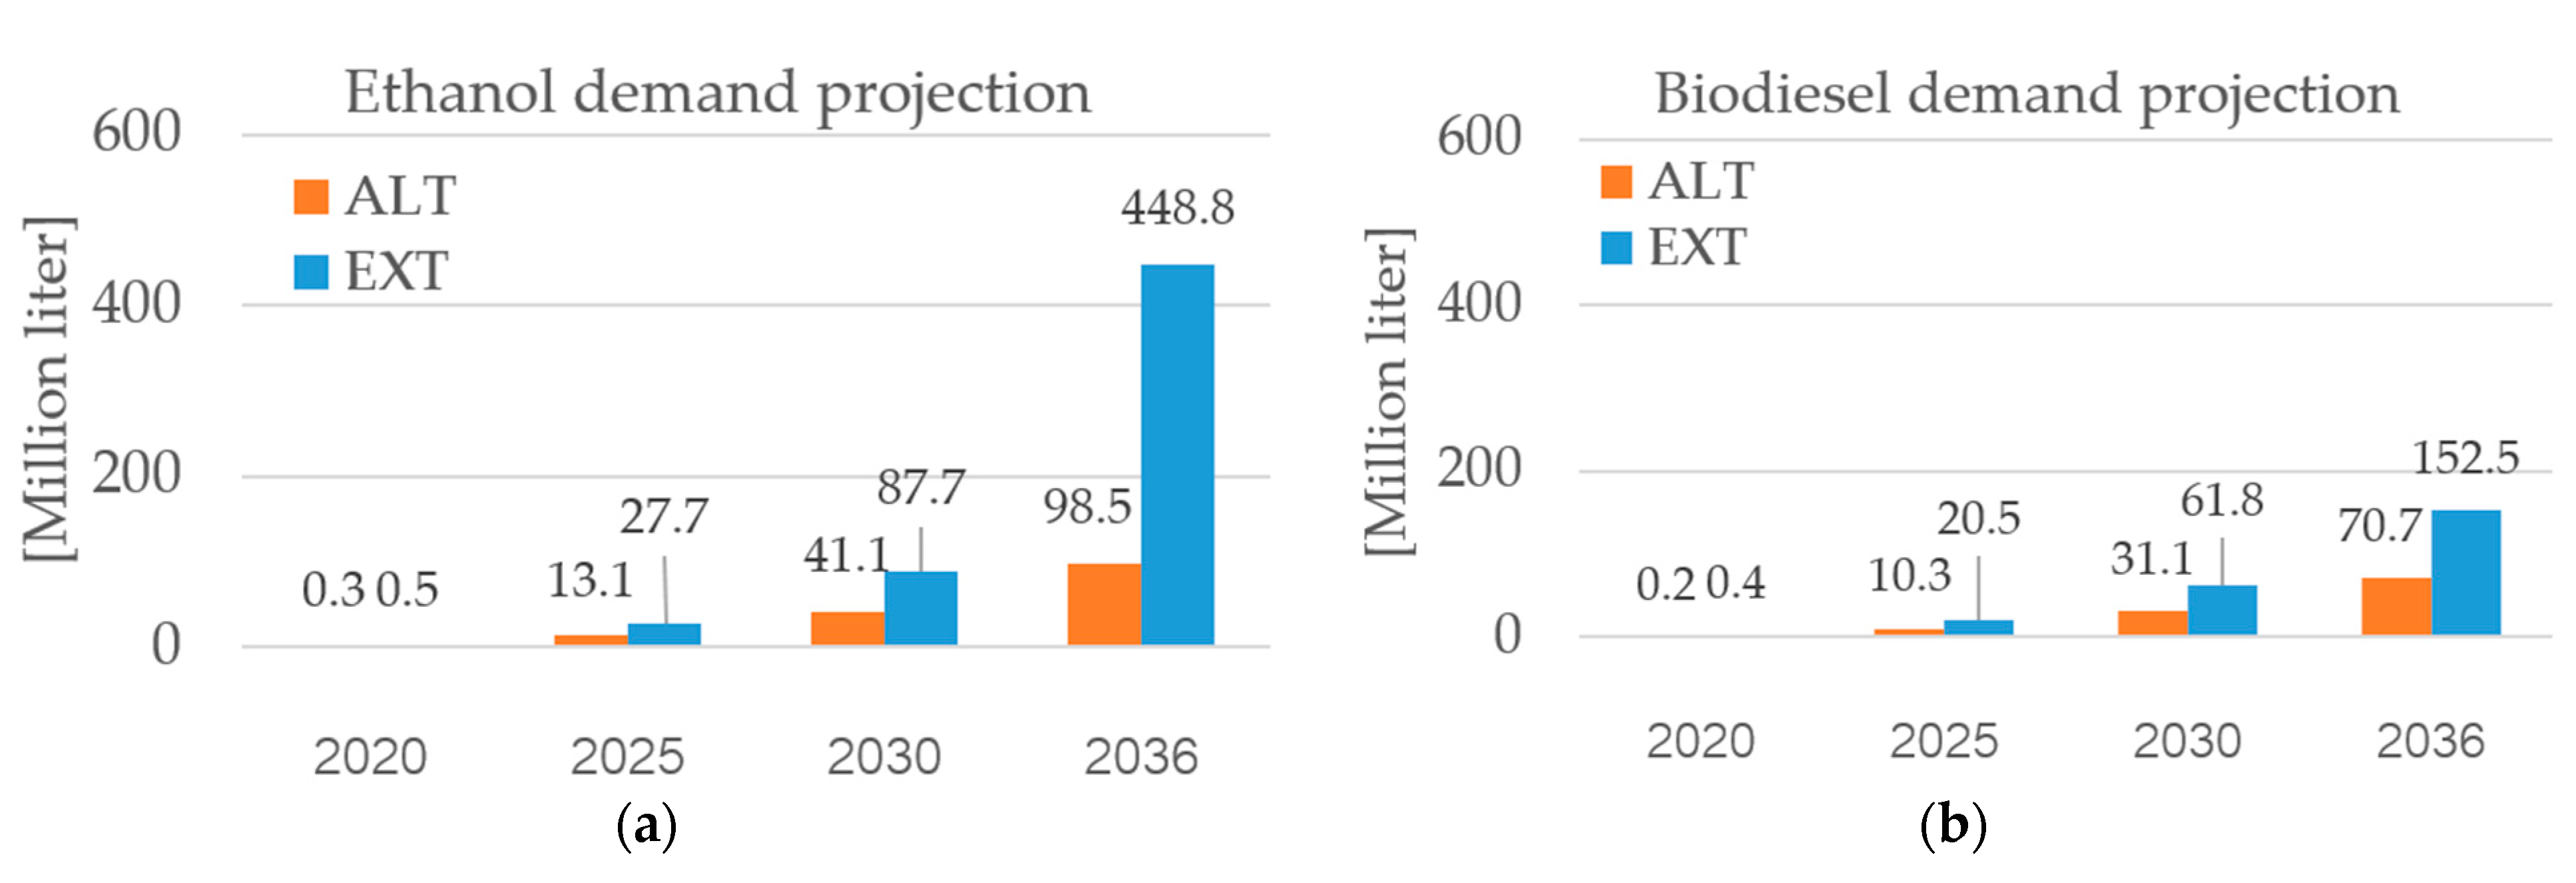
3.3. Change in Biofuel Demand
4. Discussion
4.1. Land Preparation for Biofuel Crop Cultivation
4.2. Policy Considerations for Biofuel Integration
4.3. Policy Considerations for NG Utilization and Vehicle Electrification
5. Conclusions
Author Contributions
Funding
Institutional Review Board Statement
Informed Consent Statement
Data Availability Statement
Conflicts of Interest
References
- Yearbook of Global Climate Action 2020: Marrakech Partnership for Global Climate Action. Available online: https://unfccc.int/sites/default/files/resource/2020_Yearbook_final_0.pdf (accessed on 21 November 2021).
- Breidenich, C.; Magraw, D.; Rowley, A.; Rubin, J.W. The Kyoto protocol to the United Nations framework convention on climate change. Am. J. Int. Law 1998, 92, 315–331. [Google Scholar] [CrossRef]
- UNFCCC. Adoption of the Paris Agreement. In Proceedings of the UNFCCC Conference 21st Session, Paris, France, 30 November–11 December 2015. [Google Scholar]
- Masson-Delmotte, V.; Zhai, P.; Pörtner, H.-O.; Roberts, D.; Skea, J.; Shukla, P.R.; Pirani, A.; Moufouma-Okia, W.; Péan, C.; Pidcock, R.; et al. Global Warming of 1.5 °C. An IPCC Special Report Impacts of Global Warming; IPCC: Geneva, Switzerland, 2018. [Google Scholar]
- Republic of Ghana. Ghana’s Intended Nationally Determined Contribution (INDC) and Accompanying Explanatory Note; GH-iNDC: Accra, Ghana, 2015; pp. 1–16.
- MESTI. Ghana: Updated Nationally Determined Contribution under the Paris Agreement (2020–2030); Environmental Protection Agency, Ministry of Environment, Science, Technology and Innovation: Accra, Ghana, UNFCCC; 2021; pp. 1–27.
- IPCC. Summary for policymakers. In Climate Change 2014, Mitigation of Climate Change. Contribution of Working Group III to the Fifth Assessment Report of the Intergovernmental Panel on Climate Change; IPCC: Geneva, Switzerland, 2014. [Google Scholar]
- EPA. Ghana’s Fourth National Greenhouse Gas Inventory Report; UNFCCC: Bonn, Germany, 2019; pp. 1–318.
- Owusu-Bio, M.; Frimpong, J.M.; Duah, G.P. The state of road transport infrastructure and ensuring passenger safety in Ghana. Eur. J. Logist. Purch. Supply Manag. 2016, 4, 79–85. [Google Scholar]
- UNEP. Roadmap for the Promotion of Cleaner Buses in Accra, Ghana. 2017. Available online: https://wedocs.unep.org/handle/20.500.11822/31213 (accessed on 21 November 2021).
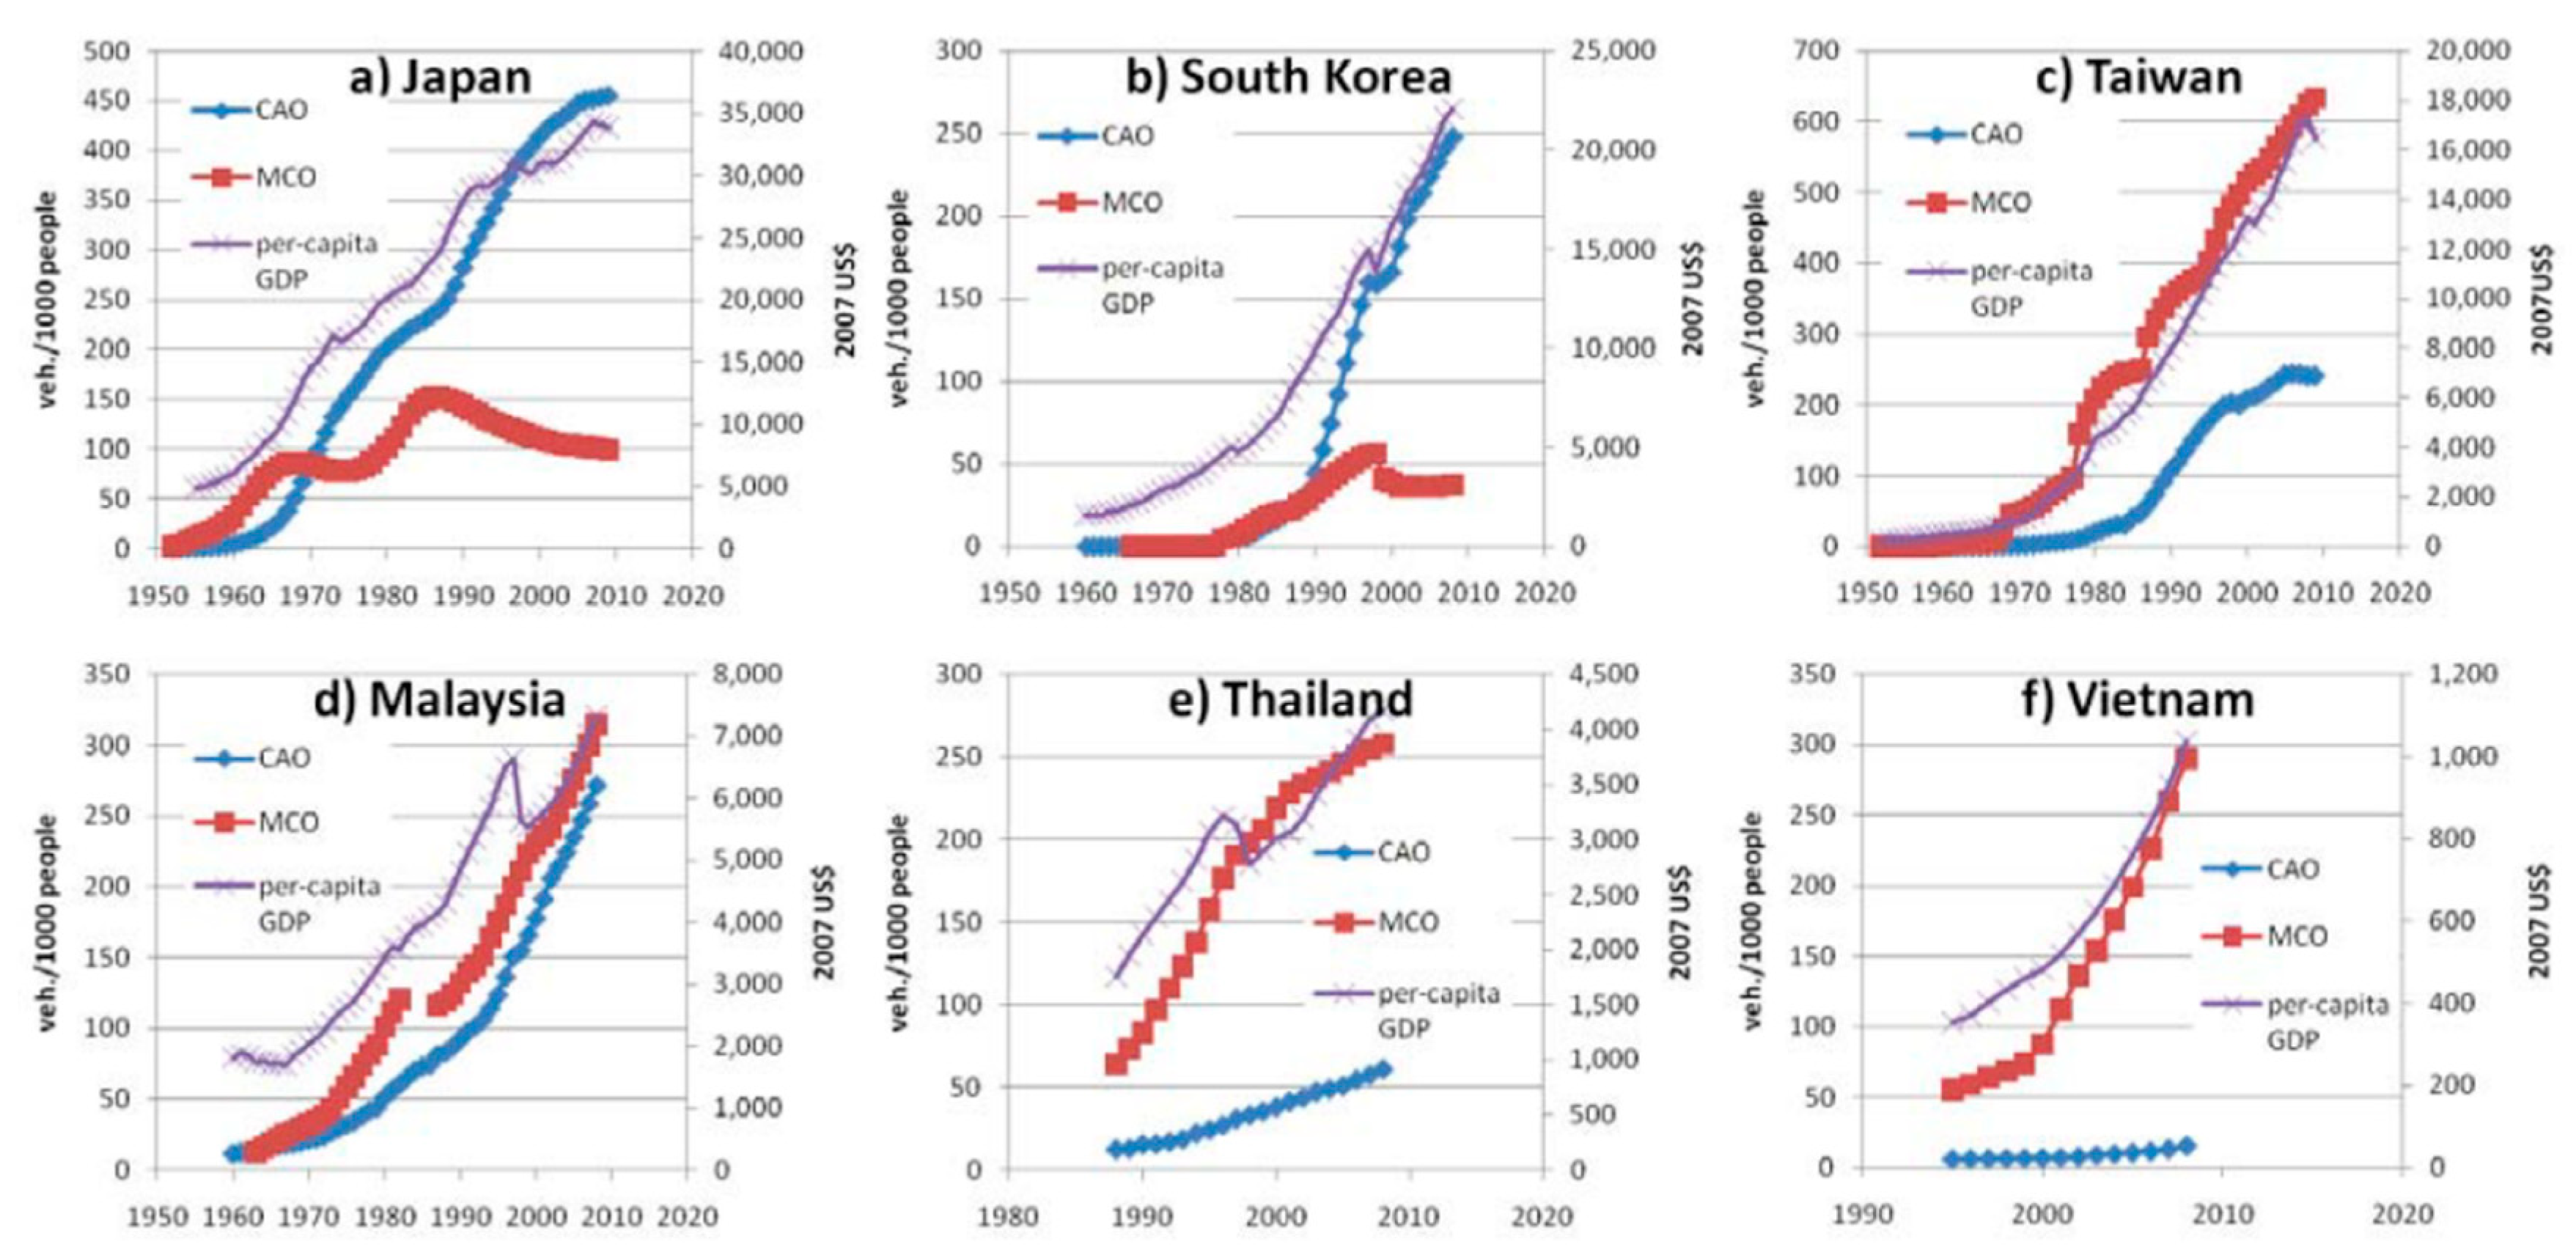
- Dargay, J.; Gately, D.; Sommer, M. Vehicle ownership and income growth, worldwide: 1960–2030. Energy J. 2007, 28, 143–170. [Google Scholar] [CrossRef] [Green Version]
- Tuan, V.A. Dynamic interactions between private passenger car and motorcycle ownership in Asia: A cross-country analysis. J. East Asia Soc. Transp. Stud. 2011, 9, 6. [Google Scholar]
- Annan, J.; Arthur, Y.; Quanah, E. Modelling Transport Energy Demand in Ghana: The Policy Implication on Ghanaian Economy. Br. J. Econ. Manag. Trade 2015, 10. [Google Scholar] [CrossRef]
- Agyemang-Bonsu, K.W.; Dontwi, I.K.; Tutu-Benefoh, D.; Bentil, D.E.; Boateng, O.G.; Asubonteng, K.; Agyemang, W. Traffic-data driven modelling of vehicular emissions using COPERT III in Ghana: A case study of Kumasi. Am. J. Sci. Ind. Res. 2010, 1, 32–40. [Google Scholar]
- Hossain, A.K.M.N.; Serletis, A. Biofuel substitution in the U.S. transportation sector. J. Econ. Asymmetries 2020, 22, e00161. [Google Scholar] [CrossRef]
- Drabik, D.; Venus, T. EU biofuel policies for road and rail transportation sector. In EU Bioeconomy Economics and Policies: Volume II; Palgrave Macmillan, Springer: Cham, Switzerland, 2019; pp. 257–276. [Google Scholar]
- Mekonnen, M.M.; Romanelli, T.L.; Ray, C.; Hoekstra, A.Y.; Liska, A.J.; Neale, C.M.U. Water, energy, and carbon footprints of bioethanol from the U.S. and Brazil. Environ. Sci. Technol. 2018, 52, 14508–14518. [Google Scholar] [CrossRef] [Green Version]
- Liu, H.; Huang, Y.; Yuan, H.; Yin, X.; Wu, C. Life cycle assessment of biofuels in China: Status and challenges. Renew. Sustain. Energy Rev. 2018, 97, 301–322. [Google Scholar] [CrossRef]
- Petinrin, J.; Shaaban, M. Renewable energy for continuous energy sustainability in Malaysia. Renew. Sustain. Energy Rev. 2015, 50, 967–981. [Google Scholar] [CrossRef]
- Gasparatos, A.; von Maltitz, G.; Johnson, F.; Lee, L.; Mathai, M.; de Oliveira, J.P.; Willis, K. Biofuels in sub-Sahara Africa: Drivers, impacts and priority policy areas. Renew. Sustain. Energy Rev. 2015, 45, 879–901. [Google Scholar] [CrossRef]
- Andwari, A.M.; Pesiridis, A.; Rajoo, S.; Martinez-Botas, R.; Esfahanian, V. A review of battery electric vehicle technology and readiness levels. Renew. Sustain. Energy Rev. 2017, 78, 414–430. [Google Scholar] [CrossRef]
- Soltani-Sobh, A.; Heaslip, K.; Stevanovic, A.; Bosworth, R.; Radivojevic, D. Analysis of the electric vehicles adoption over the United States. Transp. Res. Procedia 2017, 22, 203–212. [Google Scholar] [CrossRef]
- Tambo, E.; Duo-Quan, W.; Zhou, X.-N. Tackling air pollution and extreme climate changes in China: Implementing the Paris climate change agreement. Environ. Int. 2016, 95, 152–156. [Google Scholar] [CrossRef] [PubMed]
- Xue, M.; Lin, B.-L.; Tsunemi, K. Emission implications of electric vehicles in Japan considering energy structure transition and penetration uncertainty. J. Clean. Prod. 2020, 280, 124402. [Google Scholar] [CrossRef]
- Miotti, M.; Supran, G.J.; Kim, E.J.; Trancik, J.E. Personal vehicles evaluated against climate change mitigation targets. Environ. Sci. Technol. 2016, 50, 10795–10804. [Google Scholar] [CrossRef]
- Murshed, M.; Ali, S.R.; Banerjee, S. Consumption of liquefied petroleum gas and the EKC hypothesis in South Asia: Evidence from cross-sectionally dependent heterogeneous panel data with structural breaks. Energy Ecol. Environ. 2020, 6, 353–377. [Google Scholar] [CrossRef]
- Tseng, C.-H.; Chen, L.-L.; Shih, Y.-H. Quantifying the environment and health co-benefits of low-emission vehicles in Taiwan. J. Integr. Environ. Sci. 2014, 12, 39–48. [Google Scholar] [CrossRef] [Green Version]
- Kumar, S.; Salam, P.A.; Shrestha, P.; Ackom, E.K. An assessment of Thailand’s biofuel development. Sustainability 2013, 5, 1577–1597. [Google Scholar] [CrossRef] [Green Version]
- Department of Alternative Energy Development and Efficiency. Guidelines for development of renewable energy and alternative energy. In Alternative Energy Development Plan 2018-2037 (AEDP2018); DEDE: Bangkok, Thailand, 2020; pp. 15–22. [Google Scholar]
- Department of Alternative Energy Development and Efficiency. Guidelines for energy efficiency Plan 2018–2037. In Energy Efficiency Plan 2018-2037 (EEP2018); DEDE: Bangkok, Thailand, 2020; pp. 10–12. [Google Scholar]
- Electric Generating Authority of Thailand. Metropolitan electricity authority of Thailand, provincial electricity authority of Thailand, electric vehicle projection in Thailand. In Electrical Infrastructure Development Plan to Support Electric Vehicle in Thailand; EGAT: Bangkok, Thailand, 2016; pp. 57–68. [Google Scholar]
- Foster, N.; Bloyd, C. Thailand Alternative Fuels Update 2016; DE-AC05-76RL01830; Department of Energy US: Washington, DC, USA, 2016. Available online: https://www.pnnl.gov/main/publications/external/technical_reports/PNNL-25884.pdf (accessed on 29 December 2021).
- The UNdata – A World of Information. Available online: http://data.un.org/Host.aspx?Content=About (accessed on 29 December 2021).
- Arable Land (Hectares Per Person). The NationMaster 2003–2021. Available online: https://www.nationmaster.com/country-info/stats/Agriculture/Arable-land/Hectares-per-capita (accessed on 29 December 2021).
- Kemausuor, F.; Akowuah, J.O.; Ofori, E. Assessment of feedstock options for biofuels production in Ghana. J. Sustain. Bioenergy Syst. 2013, 3, 119–128. [Google Scholar] [CrossRef] [Green Version]
- Ayetor, G.; Quansah, D.A.; Adjei, E.A. Towards zero vehicle emissions in Africa: A case study of Ghana. Energy Policy 2020, 143, 111606. [Google Scholar] [CrossRef]
- Button, K.; Ngoe, N.; Hine, J. Modelling vehicle ownership and use in low income countries. J. Transp. Econ. Policy 1993, 27, 51–67. [Google Scholar]
- Heaps, C.G. Low Emission Alternative Planning; Stockholm Environment Institute: Somerville, MA, USA, 2020. [Google Scholar]
- Faah, G. Road Transportation Impact on Ghana’s Future Energy and Environment. Ph.D. Thesis, Freiberg University of Mining and Technology, Freiberg, Germany, 7 November 2008. [Google Scholar]
- National Petroleum Consumption from 1999–2019. Available online: http://www.npa.gov.gh/downloads (accessed on 21 November 2021).
- Estimation of Fuel Consumption and CO2 Emissions in Ghana. Methodology and Results. Available online: https://wedocs.unep.org/bitstream/handle/20.500.11822/25374/CalculationofFuelConsumptionandCO2Emissions.pdf (accessed on 21 November 2021).
- Ackom, G. United Nations Environment Programme, Vehicle Emission Enforcement, Driver and Vehicle Licensing Authority, Ghana. Available online: https://wedocs.unep.org/20.500.11822/21480 (accessed on 21 November 2021).
- Asante, K. Improving Fuel Economy in Ghana: A Socio-Economic Analysis of Policy Options, Global Fuel Economy Inisitative, 2018, 13 January. Available online: https://www.globalfueleconomy.org/media/596960/ghana-costbenefitanalysissocioeconomicanalysis.pdf (accessed on 21 November 2021).
- Nagai, Y.; Fukuda, A.; Okada, Y.; Hashino, Y. Two-wheeled vehicle ownership trends and issues in the ASIAN Region. J. East. Asia Soc. Transp. Stud. 2003, 5, 11. [Google Scholar]
- Pongthanaisawan, J.; Sorapipatana, C. Greenhouse gas emissions from Thailand’s transport sector: Trends and mitigation options. Appl. Energy 2013, 101, 10. [Google Scholar] [CrossRef]
- Chollacoop, N.; Saisirirat, P.; Sukkasi, S.; Tongroon, M.; Fukuda, T.; Fukuda, A.; Nivitchanyong, S. Potential of greenhouse gas emission reduction in Thai road transport by ethanol bus technology. Appl. Energy 2013, 102, 112–123. [Google Scholar] [CrossRef]
- Fuel Economy. All Electric Vehicles. Available online: https://www.fueleconomy.gov/feg/evtech.shtml (accessed on 29 December 2021).
- Mensah, J.; Annan, J.; Andoh-Baidoo, F. Assessing the impact of vehicular traffic on energy demand in the Accra metropolis. J. Manag. Policy Pract. 2014, 15, 10. [Google Scholar]
- Intergovernmental Panel on Climate Change (IPCC). Revised 1996 IPCC Guidelines for National Greenhouse Gas Inventories; IGES: Kanagawa, Japan, 1996. [Google Scholar]
- Urban Electric Mobility Initiative (UEMI). Ghana Policy Environment Paper. Available online: http://www.uemi.net/uploads/4/8/9/5/48950199/uemi_ca_ghana.pdf (accessed on 21 November 2021).
- Energy Commission, Ministry of Energy of Ghana. Drive Elecrtric Initiative (DEI). Available online: https://energycom.gov.gh/efficiency/drive-electric-initiative (accessed on 21 November 2021).
- Sorda, G.; Banse, M.; Kemfert, C. An overview of biofuel policies across the world. Energy Policy 2010, 38, 6977–6988. [Google Scholar] [CrossRef]
- Yusoff, M.N.A.M.; Zulkifli, N.W.M.; Sukiman, N.L.; Chyuan, O.H.; Hassan, M.H.; Hasnul, M.H.; Zulkifli, M.S.A.; Abbas, M.M.; Zakaria, M.Z. Sustainability of palm biodiesel in transportation: A review on biofuel standard, policy and international collaboration between Malaysia and Colombia. Bioenergy Res. 2020, 14, 43–60. [Google Scholar] [CrossRef]
- Indonesian Palm Oil. Indonesia Leading in Biodiesel Production. Available online: https://thepalmscribe.id/indonesia-to-start-testing-biodiesel-mixtures-higher-than-b30/ (accessed on 21 November 2021).
- SAWIT. President Wants B50 in Use by End 2020. Available online: https://www.bpdp.or.id/en/President-Wants-B50-in-Use-by-End-2020 (accessed on 21 November 2021).
- The World Bank. World Bank Open Data: Historical Record of Arable Land (sq.km)—Ghana 1961–2018. Available online: https://data.worldbank.org/ (accessed on 21 November 2021).
- Savvanidou, E.; Zervas, E.; Tsagarakis, K.P. Public acceptance of biofuels. Energy Policy 2010, 38, 3482–3488. [Google Scholar] [CrossRef]
- Silalertruksa, T.; Bonnet, S.; Gheewala, S.H. Life cycle costing and externalities of palm oil biodiesel in Thailand. J. Clean. Prod. 2012, 28, 225–232. [Google Scholar] [CrossRef]
- Vagliasindi, M. Implementaing Energy Subsidy Reforms: Evidence from Developing Countries: Ghana; World Bank Group—e-Library: Washingon, DC, USA, 2012; pp. 39–56. [Google Scholar]
- Crawford, G. Ghana’s Fossil-Fuel Subsidy Reform. Available online: https://www.ids.ac.uk/download.php?file=files/dmfile/LHcasestudy09-FossilfuelsGhana.pdf (accessed on 21 November 2021).
- Energy Commission. National Energy Statistics 2006–2015. Available online: http://energycom.gov.gh/files/National%20Energy%20Statistics_2016.pdf (accessed on 21 November 2021).


| Vehicle Category | Abbreviation | Description | Uses |
|---|---|---|---|
| Motorcycle and tricycle | MC | 2- and 3-wheelers | Private passenger (lately tricycles) used for commercial purposes |
| Private Vehicles | PC | Include all sedan, SUVs, and Vans. Engine size up to 3.5 L | For personal/private passenger and freight non-commercial. |
| Taxi-Commercial vehicles up to 2 L | Taxi | All sedans with engine capacity up to 2 L | Used as Taxi for public commercial passenger transport |
| Mini-Buses and Vans-Commercial vehicles above 2 L | miniBus & Van | Smaller capacity vans and buses. | For commercial passenger and freight transport |
| Buses & Coaches | Bus & Coach | Larger capacity vehicles | Passenger and freight |
| Heavy-duty trucks | HD Truck | Without trailers (Capacity 16–22 tons) | For fright and construction purposes |
| Articulated trucks * | ARTICS | Mostly with trailers (Capacity from 24–32 tons) | Freight transport |
| Vehicle Category | Model | |
|---|---|---|
| MC | 0.993 | |
| PC | 0.984 | |
| TAXI | 0.981 | |
| miniBus & Van | 0.873 | |
| Bus & Coach | 0.964 | |
| HD Truck | 0.994 | |
| ARTICS | 0.966 |
| Vehicle Category | Average VKT (km) | Average FE (Lge */100 km) | ||
|---|---|---|---|---|
| Gasoline | Diesel | NG | ||
| Motorcycle and tricycle | 12,500 | 3.7 | - | - |
| Private Vehicle | 25,000 | 9.7 | 8.8 | 10.2 |
| Taxi-Commercial vehicle | 30,000 | 9.7 | 8.8 | 10.2 |
| Mini-Bus and Van | 30,000 | 9.8 | 9.2 | 11 |
| Bus & Coach | 15,000 | - | 30.1 | - |
| Heavy-duty truck | 15,000 | - | 33.1 | - |
| Articulated truck | 12,000 | - | 33.1 | - |
| GHG Emission | GWPk (kg CO2-Equivalent/kg of Emission ‘k’) |
|---|---|
| CO2 | 1 |
| CH4 | 25 |
| N2O | 298 |
| 2020 (Base-Year) | 2021 | 2025 | 2026 | 2030 | 2031 | ||
|---|---|---|---|---|---|---|---|
| BAU | There are no gasohol or biodiesel measures (E0 & B0). | ||||||
| ALT | Ethanol (gasoline replacement) | E0: E5 = [90%:10%] | E5 [100%] | E5: E10 [90%:10%] | E10 [100%] | E10: E20 [90%:10%] | E10: E20 [50%:50%] |
| Biodiesel (diesel replacement) | B0: B5 = [90%:10%] | B5 [100%] | B5: B10 [90%:10%] | B10 [100%] | B10: B20 [90%:10%] | B10: B20 [50%:50%] | |
| EXT | Ethanol (gasoline replacement) | E0: E10 = [90%:10%] | E10 [100%] | E10: E20 [90%:10%] | E20 [100%] | E20: E85 [90%:10%] | E20: E85 [50%:50%] |
| Biodiesel (diesel replacement) | B0: B10 = [90%:10%] | B10 [100%] | B10: B20 [90%:10%] | B20 [100%] | B20: B50 [90%:10%] | B20: B50 [50%:50%] | |
| Ethanol | Biodiesel | Summary | ||||||
|---|---|---|---|---|---|---|---|---|
| Year | Demand [Million liter] | Feed Stock [Million ton] | Land Required [ha] | Demand [Million liter] | Feed Stock [Million ton] | Land Required [ha] | Required Arable Area [ha] | Percentage of Total Arable Land [%] |
| 2020 | 0.25 | 1562.5 | 83.3 | 0.20 | 133.3 | 33.3 | 116.66 | 0.00% |
| 2025 | 13.13 | 82,062.5 | 4376.7 | 10.30 | 6866.0 | 1716.5 | 6093.16 | 0.04% |
| 2030 | 41.12 | 257,000.0 | 13,706.7 | 31.09 | 20,724.6 | 5181.1 | 18,887.82 | 0.13% |
| 2036 | 98.54 | 615,875.0 | 32,846.7 | 70.69 | 47,122.0 | 11,780.5 | 44,627.16 | 0.30% |
| Ethanol | Biodiesel | Summary | ||||||
|---|---|---|---|---|---|---|---|---|
| Year | Demand [Million liter] | Feed Stock [Million ton] | Land Required [ha] | Demand [Million liter] | Feed Stock [Million ton] | Land Required [ha] | Required Arable Area [ha] | Percentage of Total Arable Land [%] |
| 2020 | 0.52 | 3250.0 | 173.3 | 0.39 | 260.0 | 65.0 | 238.33 | 0.00% |
| 2025 | 27.70 | 173,125.0 | 9233.3 | 20.53 | 13,685.3 | 3421.3 | 12,654.66 | 0.09% |
| 2030 | 87.73 | 548,312.5 | 29,243.3 | 61.79 | 41,189.2 | 10,297.3 | 39,540.64 | 0.27% |
| 2036 | 448.80 | 2,805,000.0 | 149,600.0 | 152.51 | 101,663.2 | 25,415.8 | 175,015.79 | 1.18% |
Publisher’s Note: MDPI stays neutral with regard to jurisdictional claims in published maps and institutional affiliations. |
© 2022 by the authors. Licensee MDPI, Basel, Switzerland. This article is an open access article distributed under the terms and conditions of the Creative Commons Attribution (CC BY) license (https://creativecommons.org/licenses/by/4.0/).
Share and Cite
Saisirirat, P.; Rushman, J.F.; Silva, K.; Chollacoop, N. Contribution of Road Transport to the Attainment of Ghana’s Nationally Determined Contribution (NDC) through Biofuel Integration. Energies 2022, 15, 880. https://doi.org/10.3390/en15030880
Saisirirat P, Rushman JF, Silva K, Chollacoop N. Contribution of Road Transport to the Attainment of Ghana’s Nationally Determined Contribution (NDC) through Biofuel Integration. Energies. 2022; 15(3):880. https://doi.org/10.3390/en15030880
Chicago/Turabian StyleSaisirirat, Peerawat, Johannex Fefeh Rushman, Kampanart Silva, and Nuwong Chollacoop. 2022. "Contribution of Road Transport to the Attainment of Ghana’s Nationally Determined Contribution (NDC) through Biofuel Integration" Energies 15, no. 3: 880. https://doi.org/10.3390/en15030880
APA StyleSaisirirat, P., Rushman, J. F., Silva, K., & Chollacoop, N. (2022). Contribution of Road Transport to the Attainment of Ghana’s Nationally Determined Contribution (NDC) through Biofuel Integration. Energies, 15(3), 880. https://doi.org/10.3390/en15030880