Article

Development of Integrated Electrocoagulation-Sedimentation (IECS) in Continuous Mode for Turbidity and Color Removal

1
Faculty of Hydrology and Water Resources Engineering, Institute of Technology of Cambodia, Phnom Penh 12156, Cambodia
2
Research Unit on Technology for Oil Spill and Contamination Management, Chulalongkorn University, Bangkok 10330, Thailand
3
Research Program in Remediation Technologies for Petroleum Contamination, Center of Excellence on Hazardous Substance Management (HSM), Bangkok 10330, Thailand
4
Department of Environmental Engineering, Faculty of Engineering, Chulalongkorn University, Bangkok 10330, Thailand
5
Department of Environmental Design, Faculty of Natural Science and Technology, Kanazawa University, Ishikawa 920-1192, Japan
6
Water and Environment Research Unit, Research and Innovative Center, Institute of Technology of Cambodia, Phnom Penh 12156, Cambodia
*
Author to whom correspondence should be addressed.
ChemEngineering 2022, 6(1), 3; https://doi.org/10.3390/chemengineering6010003
Submission received: 22 November 2021 / Revised: 24 December 2021 / Accepted: 28 December 2021 / Published: 4 January 2022
(This article belongs to the Special Issue Chemical Engineering and Multidisciplinary)

Abstract

:
The present work focused on the development and evaluation of a compact electrocoagulation (EC) reactor, combined between EC and clarifier processes in continuous modes for decolorization and turbidity removal, named the integrated electrocoagulation-sedimentation reactor (IECS). The experiments were firstly conducted in the four-liter batch column in order to optimize the EC configuration and operation condition. The removal kinetics were also investigated and predicted for kinetic correlations. After various optimization steps, the IECS reactor was conducted, consisting of EC and clarifier compartments. Liquid flow pattern in EC compartment was examined through resident time distribution technique for defining the number of EC units and divided baffles. In summary, four units of EC were placed in the EC compartment of the IECS reactor with 90% in the width of three baffles. Each EC unit had two pairs of aluminum electrode plats in monopolar arrangement with a 1.5 cm gap and required a current density of 13.5 mA/cm2. For the clarifier compartment, it was mainly designed based on the batch settling test for separating the precipitated particles. The treatment performance of the IECS reactor was tested at different liquid flows in order to reduce the pollutant to a certain level. For the individual condition, liquid flow rates of 3 and 1 L/min were defined for turbidity and color, respectively. If both pollutants are presented simultaneously, a liquid flow rate of 1–2 L/min can be used for decreasing turbidity from 250 to <20 NTU and color from 6000 to <300 ADMI.

1. Introduction

Industry is one of the key development sectors for a country’s economic growth. At the same time, it also discharges pollution into the environment. Consequently, environmental pollution has been considered one of the major current problems being faced worldwide [1]. Most of the industrial wastewater effluence contains a high amount of color and turbidity as the contaminants. Discharged untreated wastewater from industries, i.e., textile and dyeing operation, pulp and paper production, food processing, mining and coal processing operation, refinery, and slaughterhouse operation, is the main source of substantial coloration to water. Recent studies reported that color-causing substances are micro-toxic to aquatic biota [2]. Strong colored wastewater from dyeing operations has not only unfavorable aesthetic effects but is also carcinogenic, mutagenic, and generally detrimental to the environment [3]. Thus, a highly colored body of water cannot sustain aquatic life, which could lead to the long-term impairment of the ecosystem. Therefore, removal of turbidity and color from wastewater is occasionally required.
Various technologies have been employed for dye effluent treatment, including conventional biological processes (aerobic and anaerobic), coagulation with aluminum, ferric chloride, and magnesium chloride, and adsorption [4]. Since the effluence contains toxic dyes in nature, it may also impact the development of bacteria in the biological process. Furthermore, chemical coagulation requires the addition of chemicals, which leads to a huge quantity of sludge. In recent years, the electrocoagulation (EC) process has been of interest in regards to studying different types of effluents from industries. EC involves electrolytic reactions at the surface of the electrodes by applying direct current (DC) to the system and then the dissolution of the anode sides to the in-situ formation of coagulants in the aqueous phase. The soluble and colloid contaminants are adsorbed on the coagulant and can then be removed by sedimentation. The flotation process was occurred at the same time in the system on the cathode’s side after generating a gas bubble to carry the light particles to the surface of the reactor [5,6].
Even EC has been applied on the industrial scale for over a century, the limitation on the fundamental mechanistic level is still the main challenge. In addition, the development of a compact system of EC and sedimentation still remains to date [7]. Therefore, the objective of this present study is to develop and evaluate the new electrocoagulation reactor, combining EC and sedimentation units in terms of design criteria and operating conditions in both batch and continuous modes for decolorization and turbidity removal. The new reactor is named integrated electrocoagulation-sedimentation reactor (IECS).

2. Materials and Methods

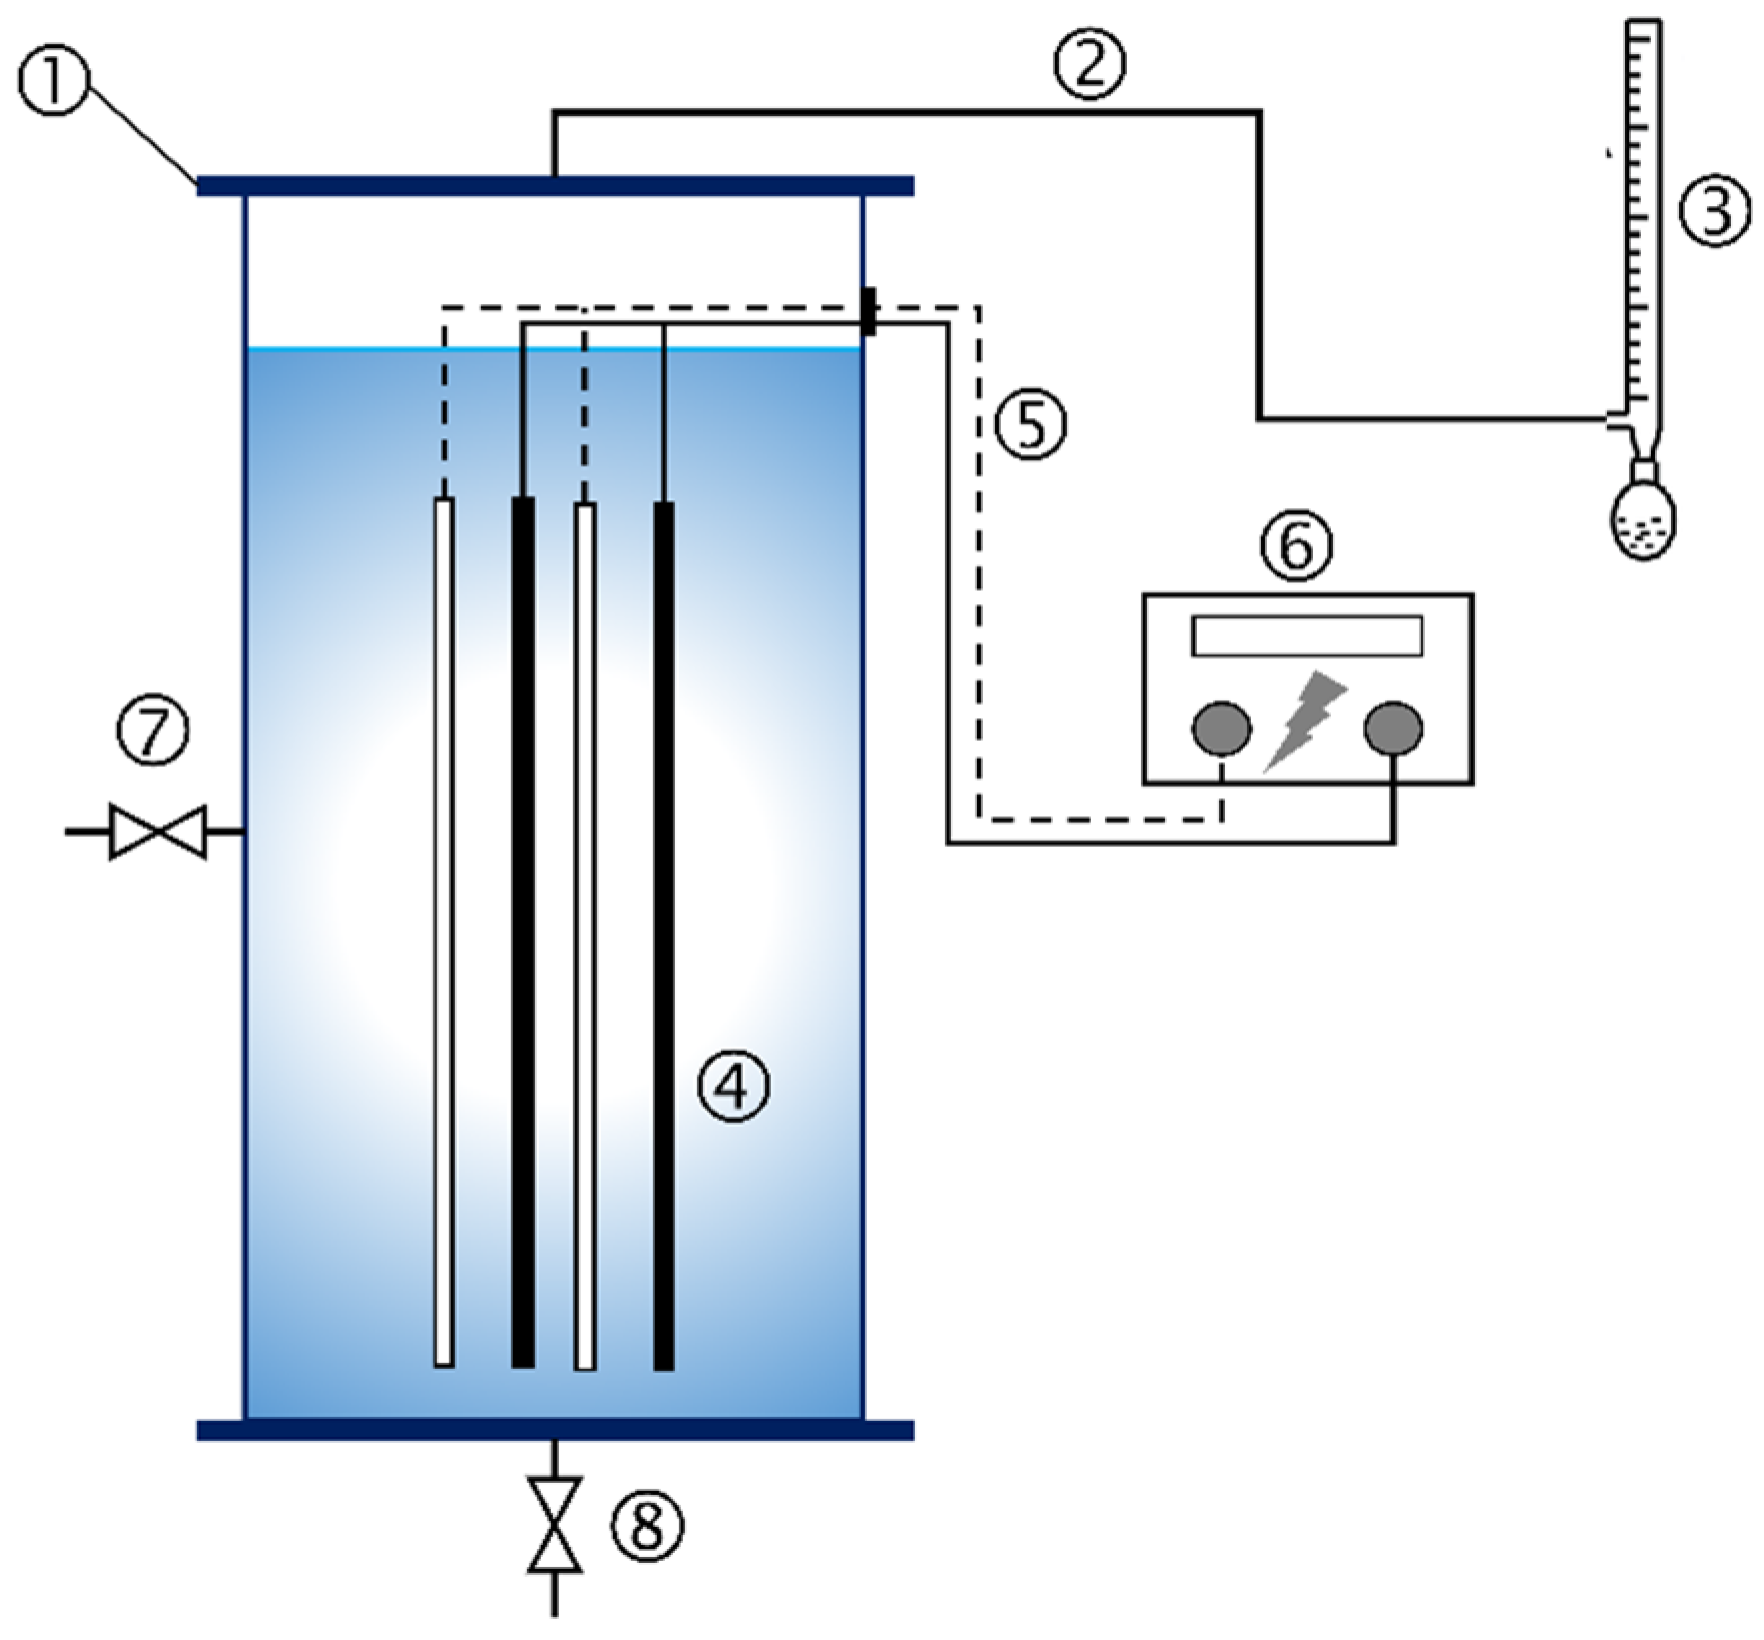
2.1. Experimental Set-Up

The batch column was constructed from clear acrylic material in a cylinder shape with a 3 cm diameter in order to contain 4 L of water, as illustrated in Figure 1. At the bottom, it was connected to the drainage port for discharging the sludge and the water sample after conducting the experiments.
The electrode plates (20 cm × 5 cm × 0.2 cm) were installed in the reactor and connected to the DC generator for supplying the current. Four aluminum electrode plates installed in a monopolar arrangement were used in this study. At the top, an acrylic cap was covered for collecting the generated gas from the system to the soap film meter. Tap water was firstly used in the liquid phase at room temperature (25 ± 3 °C) to study the optimized EC configuration and operating conditions.

2.2. Synthetic Wastewater

To synthesize turbidity and color wastewater, bentonite and reactive dye were prepared with tap water. For synthetic turbidity, bentonite was rapidly mixed with water at 300 rpm for 5 min, followed by slow mixing at 40 rpm for 30 min, and then we let it settle down for 35 min (see Figure 2a) [8]. Moreover, synthetically colored wastewater was prepared by dissolving the reactive dye in tap water for 5 min at 300 rpm (see Figure 2b) [8]. pH and TDS were measured using a pH meter (model Hanna HI 991300) and conductivity meter (model Lutron CD-4317SD), respectively. Chemical oxygen demand (COD) and total suspended solids (TSS) were analyzed following the Standard Methods of Examination of Water and Wastewater [9]. Table 1 shows the main parameters of the synthetic wastewater used in this study.

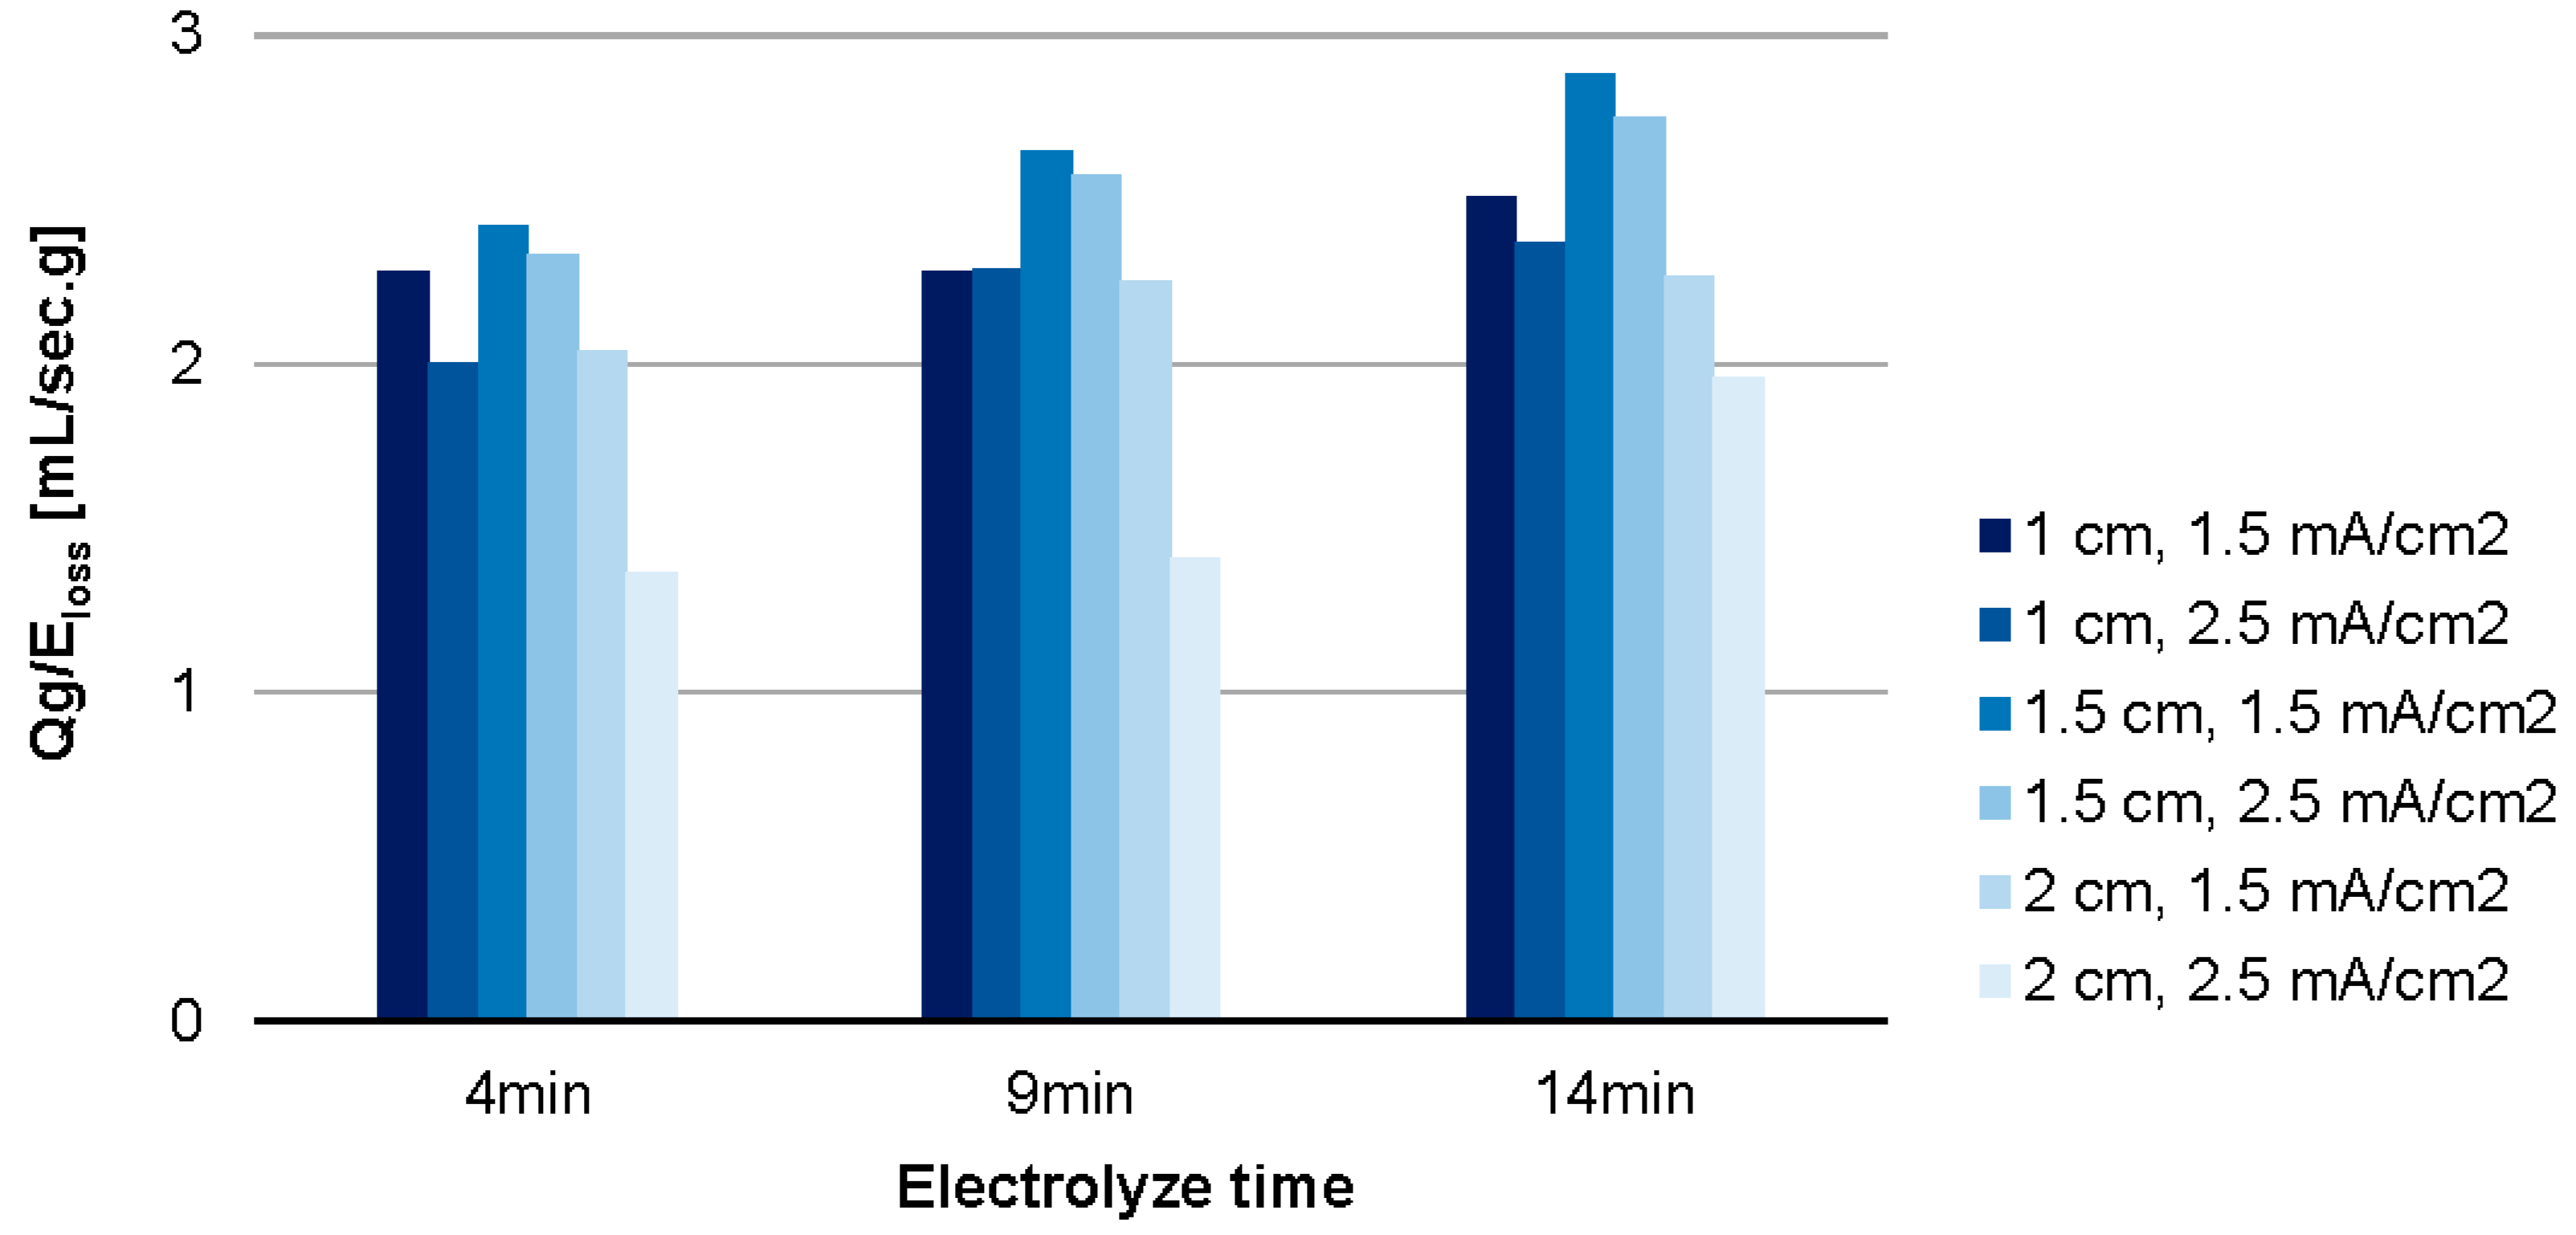
2.3. Electrode Optimization

Configuration and operation conditions of electrodes were initially investigated to define the optimum conditions for the batch column experiment in terms of the generated gas flow and electrode corrosive loss ratio (Qg/Eloss). Generated gas flow (Qg) was directly measured using the soap film meter captured from the reactor cap covering (see Figure 1), as detailed by Nawadol et al. (2017) [10]. It can be estimated using Equation (1), where Qg is the gas flow rate (mL/s), ΔV = V2 − V1 is the different volume of gas (mL), and Δt = t2 − t1 is the different time of gas moved (sec.). Electrode loss (Eloss), presented as a percentage, was defined by the different weights of the electrode before and after the experimental work, as expressed in Equation (2). Electrode configuration and operation condition parameters included electrode gap (1–2 cm) and current density (1.5–2.5 mA/cm2). The initial turbidity and color concentration in this part were 250 NTU and 6000 ADMI, respectively.
Q g = Δ V Δ t .
E loss = initial   weight     final   weight initial   weight .  

2.4. Kinetic of Turbidity and Color Removal

After defining the optimum conditions of the electrode used in terms of Qg/Eloss value, the removal kinetics of turbidity and color under optimum conditions were examined with different initial concentrations (turbidity: 50–500 NTU and color: 2500–15,000 ADMI) in the batch column test. The turbidity and color values were measured by turbidity and color meters. A five-minute time step was designed for sampling the water samples.
η = η stable 1 + e k ( t t 50 )
The kinetic models were constructed in simple expression and s-curve models. Simple kinetic models, including zero, first, and second orders, were employed to describe the removal rate of each pollutant [11]. Moreover, the treatment efficiency of the s-curve can be derived by Equation (3), where η is the removal efficiency and t50 is the time for 50% removal efficiency.

2.5. Settling Column Test

The setting test was examined in the batch column to determine the over flow rate (OFR) as the design criteria of settling performance in order to design the sedimentation tank for the separation process after the EC treatment. This sedimentation experiment was conducted within 100 min with 4 ports, i.e., 13, 18, 23 and 28 cm from the water surface for water sampling. The initial concentration of turbidity and color prepared for this part were 250 NTU and 6000 ADMI, respectively. A detailed description of the settling test can be found in Reynolds et al. (1995) [12].

2.6. Liquid Flow Pattern Analysis

After optimizing the electrode configuration and operation condition, defining the treatment kinetics, and obtaining the settling over flow, the new reactor integrated between EC and sedimentation operated in continuous condition was therefore constructed. Hence, the liquid flow pattern was analyzed in order to understand the internal flow characteristics using the pulse injection method of residence time distribution (RTD) concept [13]. NaCl was used as a tracer and detected by conductivity meter model Lutron® CD-4317SD, while the inlet and outlet flows were controlled by flow meters. Age distribution (E(t)) was estimated from the tracer concentration, as expressed by Equation (4) [14], where C is the concentration of salt tracer. It should be noted that tap water was used for this experimental analysis.
E ( t ) = C ( t ) 0 C ( t )   dt

2.7. Treatment Performance of Integrated Reactor

The treatment performance of the newly developed reactor was therefore evaluated in three different cases, including turbidity, color, and both turbidity and color removals with a varying liquid flow rate (1–3 L/min). The initial concentration of turbidity and color in this part were 250 NTU and 6000 ADMI, respectively. The experiments were conducted in continuous flow with flow rate control at the feeding and effluent using flow rate meters. Feeding was flowed to the EC tank and continuously flowed to the sedimentation tank before flowing out as the effluent. Turbidity and color concentration were analyzed for assessing treatment performance.

3. Results and Discussion

In this work, the results are mainly separated into two parts: the batch column and newly developed reactors. In the batch column, the optimization of EC configuration and operation condition was investigated, followed by studying the treatment kinetic and settling performance of turbidity and color. The flow pattern and treatment performance in the continuous IECS reactor were therefore analyzed as a compact treatment system for industrial wastewater.

3.1. Batch Column Test

3.1.1. Optimize Electrode Gap and Current Density

To optimize EC performance, the electrode configuration and operation conditions, including electrode gap and current density, were studied at different electrolyze times. The system performance was evaluated in terms of the Qg/Eloss ratio value as it could optimize the system by maximizing the amount of gas production and minimizing the number of corrosive electrodes since higher electrode plate corrosion required the replacement frequently. Notice that the generated gases from the system are hydrogen and a certain amount of oxygen released from the cathode and anode sides, respectively. The electrode gap is expected to exhibit a strong influent on the power consumption of the system since the voltage will require more after the inner gap is enlarged. On the other hand, as the inter-electrode distance increases, the dye’s interaction with the hydroxyl polymers decreases, resulting in lower local concentrations and electrostatic attraction, as well as lower dye removal efficiency [15]. Therefore, the inner gaps of electrodes between 1.0 to 2.0 cm with current densities between 1.5 and 2.5 mA/cm2 were selected to investigate the effect of EC.
Figure 3 showed the Qg/Eloss value at different electrode gaps, current densities, and electrolyze times. Overall, Qg/Eloss value increased with electrolyze time, regardless of electrode gap and current. It is possibly because a partial amount of current was initially consumed for heating the electrodes, and only the remaining amount was used for electrolysis, which resulted in a limited amount of hydrogen gas generated. At a longer operation time, electrodes were better heated, and a higher amount of hydrogen and oxygen gas were generated into the solution [16]. Furthermore, among the examined ranges, a 1.5 mA/cm2 current density with a 1.5 cm electrode gap provided the highest Qg/Eloss ratio. This condition provided ratio values up to 2.42, 2.65 and 2.88 mL/g.s at 4, 9, and 14 min of electrolyzing time, respectively. Hence, in terms of Qg/Eloss, the inner gap of 1.5 cm with a current density of 1.5 mA/cm2 was selected as the optimum condition.
Current density plays an important role in the EC process. The cell current defines the rate of coagulant generation, bubble production rate and size, and distribution in the reactor with different electrode configurations [17]. The amount of coagulant is commonly increased when the current density is increased [18,19]. In this study, it was varied in five conditions, i.e., 1.5, 2.5, 3.5, 4.5 and 5.5 mA/cm2, for turbidity and color removal from wastewater for depth optimization. To evaluate the treatment performance in various EC operation conditions, the initial concentrations of turbidity and color were prepared for 250 NTU and 6000 ADMI, respectively. The results of turbidity and color removals with different current densities are shown in Figure 4. At the first stage, the greatest removal efficiency was achieved at a higher current density, 5.5 mA/cm2, for both turbidity and color removals, which is comparable with the study of Aoudj et al. (2010) [20]. However, at ≥20 min, the removal efficiencies are indistinguishable under current densities ≥2.5 mA/cm2 for turbidity and current densities ≥4.5 mA/cm2 for color removals. Therefore, the current density of 4.5 mA/cm2 was selected as the optimum condition for turbidity and color removal, while the steady stage operation time is about 20–30 min. Since this optimization was conducted under the constant initial condition, a kinetic study was then required in order to define the range of electrolyzing time at different initial concentrations.
After examining each condition, it can be summarized that installing aluminum electrodes in a monopolar arrangement with an electrode gap of 1.5 cm, a current density of 4.5 mA/cm2, and 30 min of electrolyzing time are the optimum conditions for turbidity and color removal with initial concentrations of 250 NTU and 6000 ADMI, respectively. These findings will be used for the next section of removal kinetics and IECS reactor design.

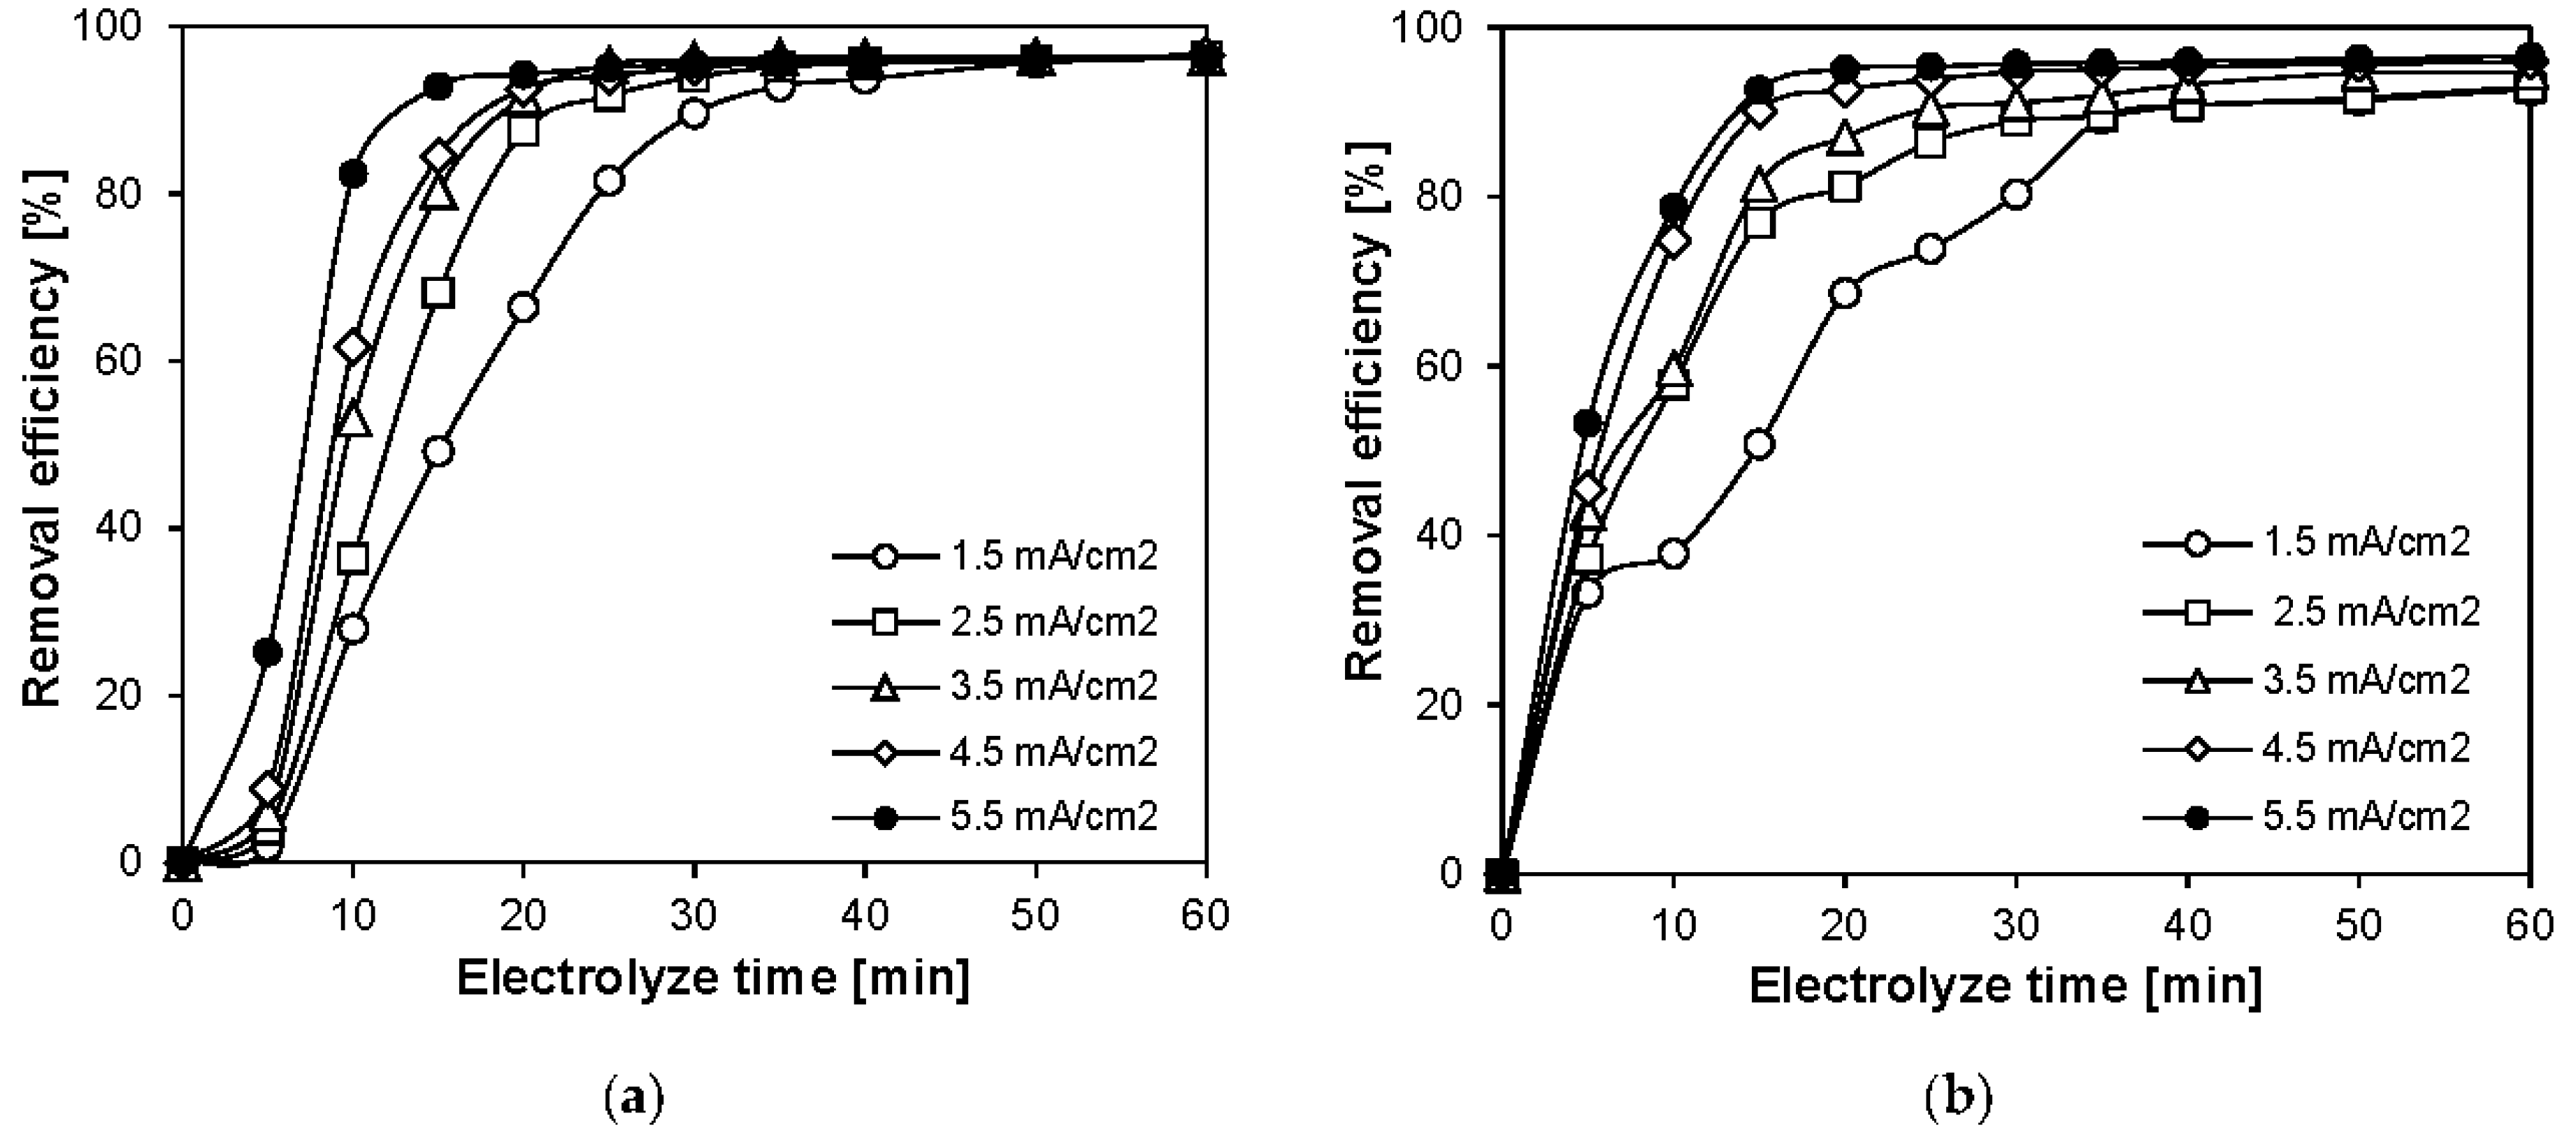
3.1.2. Turbidity and Color Removal Kinetics

In order to achieve the targeted removal condition, kinetic studies of treatment procedures are required to determine removal performance in the operation of any reactor system. Moreover, it is important to understand the types of reaction rates in order to design a treatment unit. The change of reactant concentration per unit time is known as the reaction rate [21]. The initial concentrations of turbidity and color were varied from 50 to 500 NTU and 2500 to 15,000 ADMI, respectively. The results of turbidity removal are shown in Figure 5a,b. It should be noted that aquatic pH is another significant factor for this coagulation process [22]. The pH value in the cell increased with time from approximately 7.1–7.7 to 8.0–8.2 due to the hydrogen ion production during electrolysis. These pH values are in an effective range of the sweep floc coagulation mechanism, which is beneficial for the electrochemical process [23]. According to the results, after 30 min electrolysis, the residual turbidity was decreased to <20 NTU for all three conditions and <10 NTU if it was allowed to settle down for another 30 min. Furthermore, the lag stage for the low concentration (50 NTU) was longer than that of higher concentrations (≥250 NTU) (see Figure 5a). The 50 NTU needed about 25 min of electrolyzing time to dissolve the aluminum ion into a cell and reach a stable stage, which provided a removal efficiency of around 75%. For higher turbid conditions, 250 NTU and 500 NTU required about 20 min to achieve 96% and 98% removal efficiency, respectively. In addition, 15 min are required to remove turbidity from 50 and 250 NTU to lower than 20 NTU and 20 min for 500 NTU (see Figure 5b).
For color, it required more electrolyze and treatment time for the molecule or colloid to attach to a coagulant to precipitate, which is followed by the sweep flocculation mechanism [11]. After precipitation, it will be captured by Al(OH)3 or polymeric aluminum hydroxide flocs before floating to a gel state [24]. Figure 5c,d shows the color removal kinetics. At 20 min, a 95% removal efficiency was achieved for the investigated color conditions. However, under the highest color level (15,000 ADMI), the reactive stage period required a longer time by about 5 min compared to the lower color level (2500–6000 ADMI), ranging from 15 to 20 min of electrolyzing time. This condition might require more aluminum coagulant and, consequently, need a longer time for dissolving ions and the reaction. However, there is no significant effect on the decolorization performance after reaching the steady state at 20 min (see Figure 5c). A similar trend was also found by Kobya et al., 2011 [25]. In terms of residual color, 56, 34, and 435 ADMI were measured after 30 min of EC operation for initial color levels of 2500, 6000, and 15,000 ADMI, respectively. However, in order to remove the highest initial color level (15,000 ADMI) until it was lower than 300 ADMI, Thailand’s effluent standard of color, a treatment time of up to 60 min is required (data not shown). Based on the aquatic pH level of the wastewater, it changed from 7.1–7.3 to 8.1–8.5 before and after conducting the experiments, which is a proper condition for destabilization mechanisms, as reported in a previous study [26]. Overall, it can be noted that a faster removal efficiency was obtained for a higher initial concentration for turbidity, which is in contrast to color, where a faster removal efficiency was achieved for a lower initial concentration.

3.1.3. Kinetic Models

In this section, the kinetic models of color and turbidity were investigated in a batch reactor. Initial color and turbidity concentrations of about 6000 ADMI and 250 NTU were selected for the experiment, respectively. The kinetic study of the removal of each pollutant was considered with different current densities of 1.5, 2.5, 3.5, 4.5 and 5.5 mA/cm2. In this work, the expressions of simple removal kinetics, i.e., zero, first, and second orders, and sigmoid curve correlations were constructed for both turbidity and color removal. The most fitted models were selected as the kinetic models. Comparing among the investigated expressions, sigmoid curve and second-order correlations were found as the most accurate ones for turbidity and color, respectively.
For turbidity removal, the sigmoid curve correlation was fitted as expressed in Figure 3, where η and t are removal efficiency (%) and electrolyze time (min), respectively. After fitting the experimental results, the variables achieved are ηstable ≈ 97%, k ≈ 0.085 CD + 0.075, and t50 ≈ −2.081 CD + 18.168, where k is sigmoid steepness (min−1) and CD is current density (mA/cm2). In addition, the second-order correlation of decolorization, (1/[Color]) = kt + (1/[Color]0) was fitted from the experimental results, where [Color] and t are the level of color (ADMI) and electrolyze time (min), respectively. The kinetic constant, k (as ADMI−1 min−1), was empirically constructed in terms of current density (CD as mA/cm2), k ≈ (1.1CD + 1.95) 10−5. In order to evaluate the prediction performance of the constructed correlations, the experimental and predicted results of turbidity and color removal under 4.5 mA/cm2, the optimum condition previously found, were plotted in Figure 6. It can be observed that the predicted values were in good agreement with the experimental results. The constructed correlations for turbidity and color under the operation of 4.5 mA/cm2 current density are also shown in Figure 6a,b, respectively.

3.1.4. Settling Performance

In order to design the IECS clarifier compartment, the settling test was studied in a batch column containing a 4-L sample with a 33 cm height. Four sampling ports 13, 18, 23, and 28 cm from the water surface were used for collecting the samples. It was investigated after operating EC under the optimum condition previously found with 250 NTU and 6000 ADMI as initial concentrations. The sample was measured every 3 min. The results of the settling test of turbidity and color after EC were shown in Figure 7. Overall, it can be noted that the precipitated color particles required lower OFR than turbidity due to the smaller size and lower density of color particles. In order to achieve 90% separation performance of turbidity and color, 1.89 and 1.54 m/hr of OFR are, respectively, required. It can be summarized that the fraction removal of color should be used as a design criterion for IECS for the simultaneous presence of both pollutants.

3.2. Characteristics of IECS Reactor

3.2.1. Design Configurations

Again, the integrated electrocoagulation-sedimentation (IECS) reactor was investigated as a combination of the electrocoagulation and the sedimentation compartments for continuous operation in order to remove turbidity and color from synthetic textile wastewater. Based on the previous study in the batch column test, the design parameters for both EC and clarifier compartments were summarized in Table 2. The laboratory-scale IECS reactor was constructed by clear acrylic material and consisted of two compartments, as illustrated in Figure 8. Various design criteria of the sedimentation tank were the same as in Kawamura (2000) [27]. Therefore, the EC compartment has the dimension of 26 cm in width, 100 cm in length, and 40 cm in height in order to contain 90 L of wastewater. For the clarifier compartment (34 L), its width, length, and height are 16, 70, and 33–40 cm (sludge collection slop, as shown in point 5 of Figure 8), respectively. The mentioned height included a 5 cm freeboard. A small compartment, 17 L, between EC and clarifier compartments was considered flocculation (see point 4 of Figure 8) before flowing to the clarifier tank.

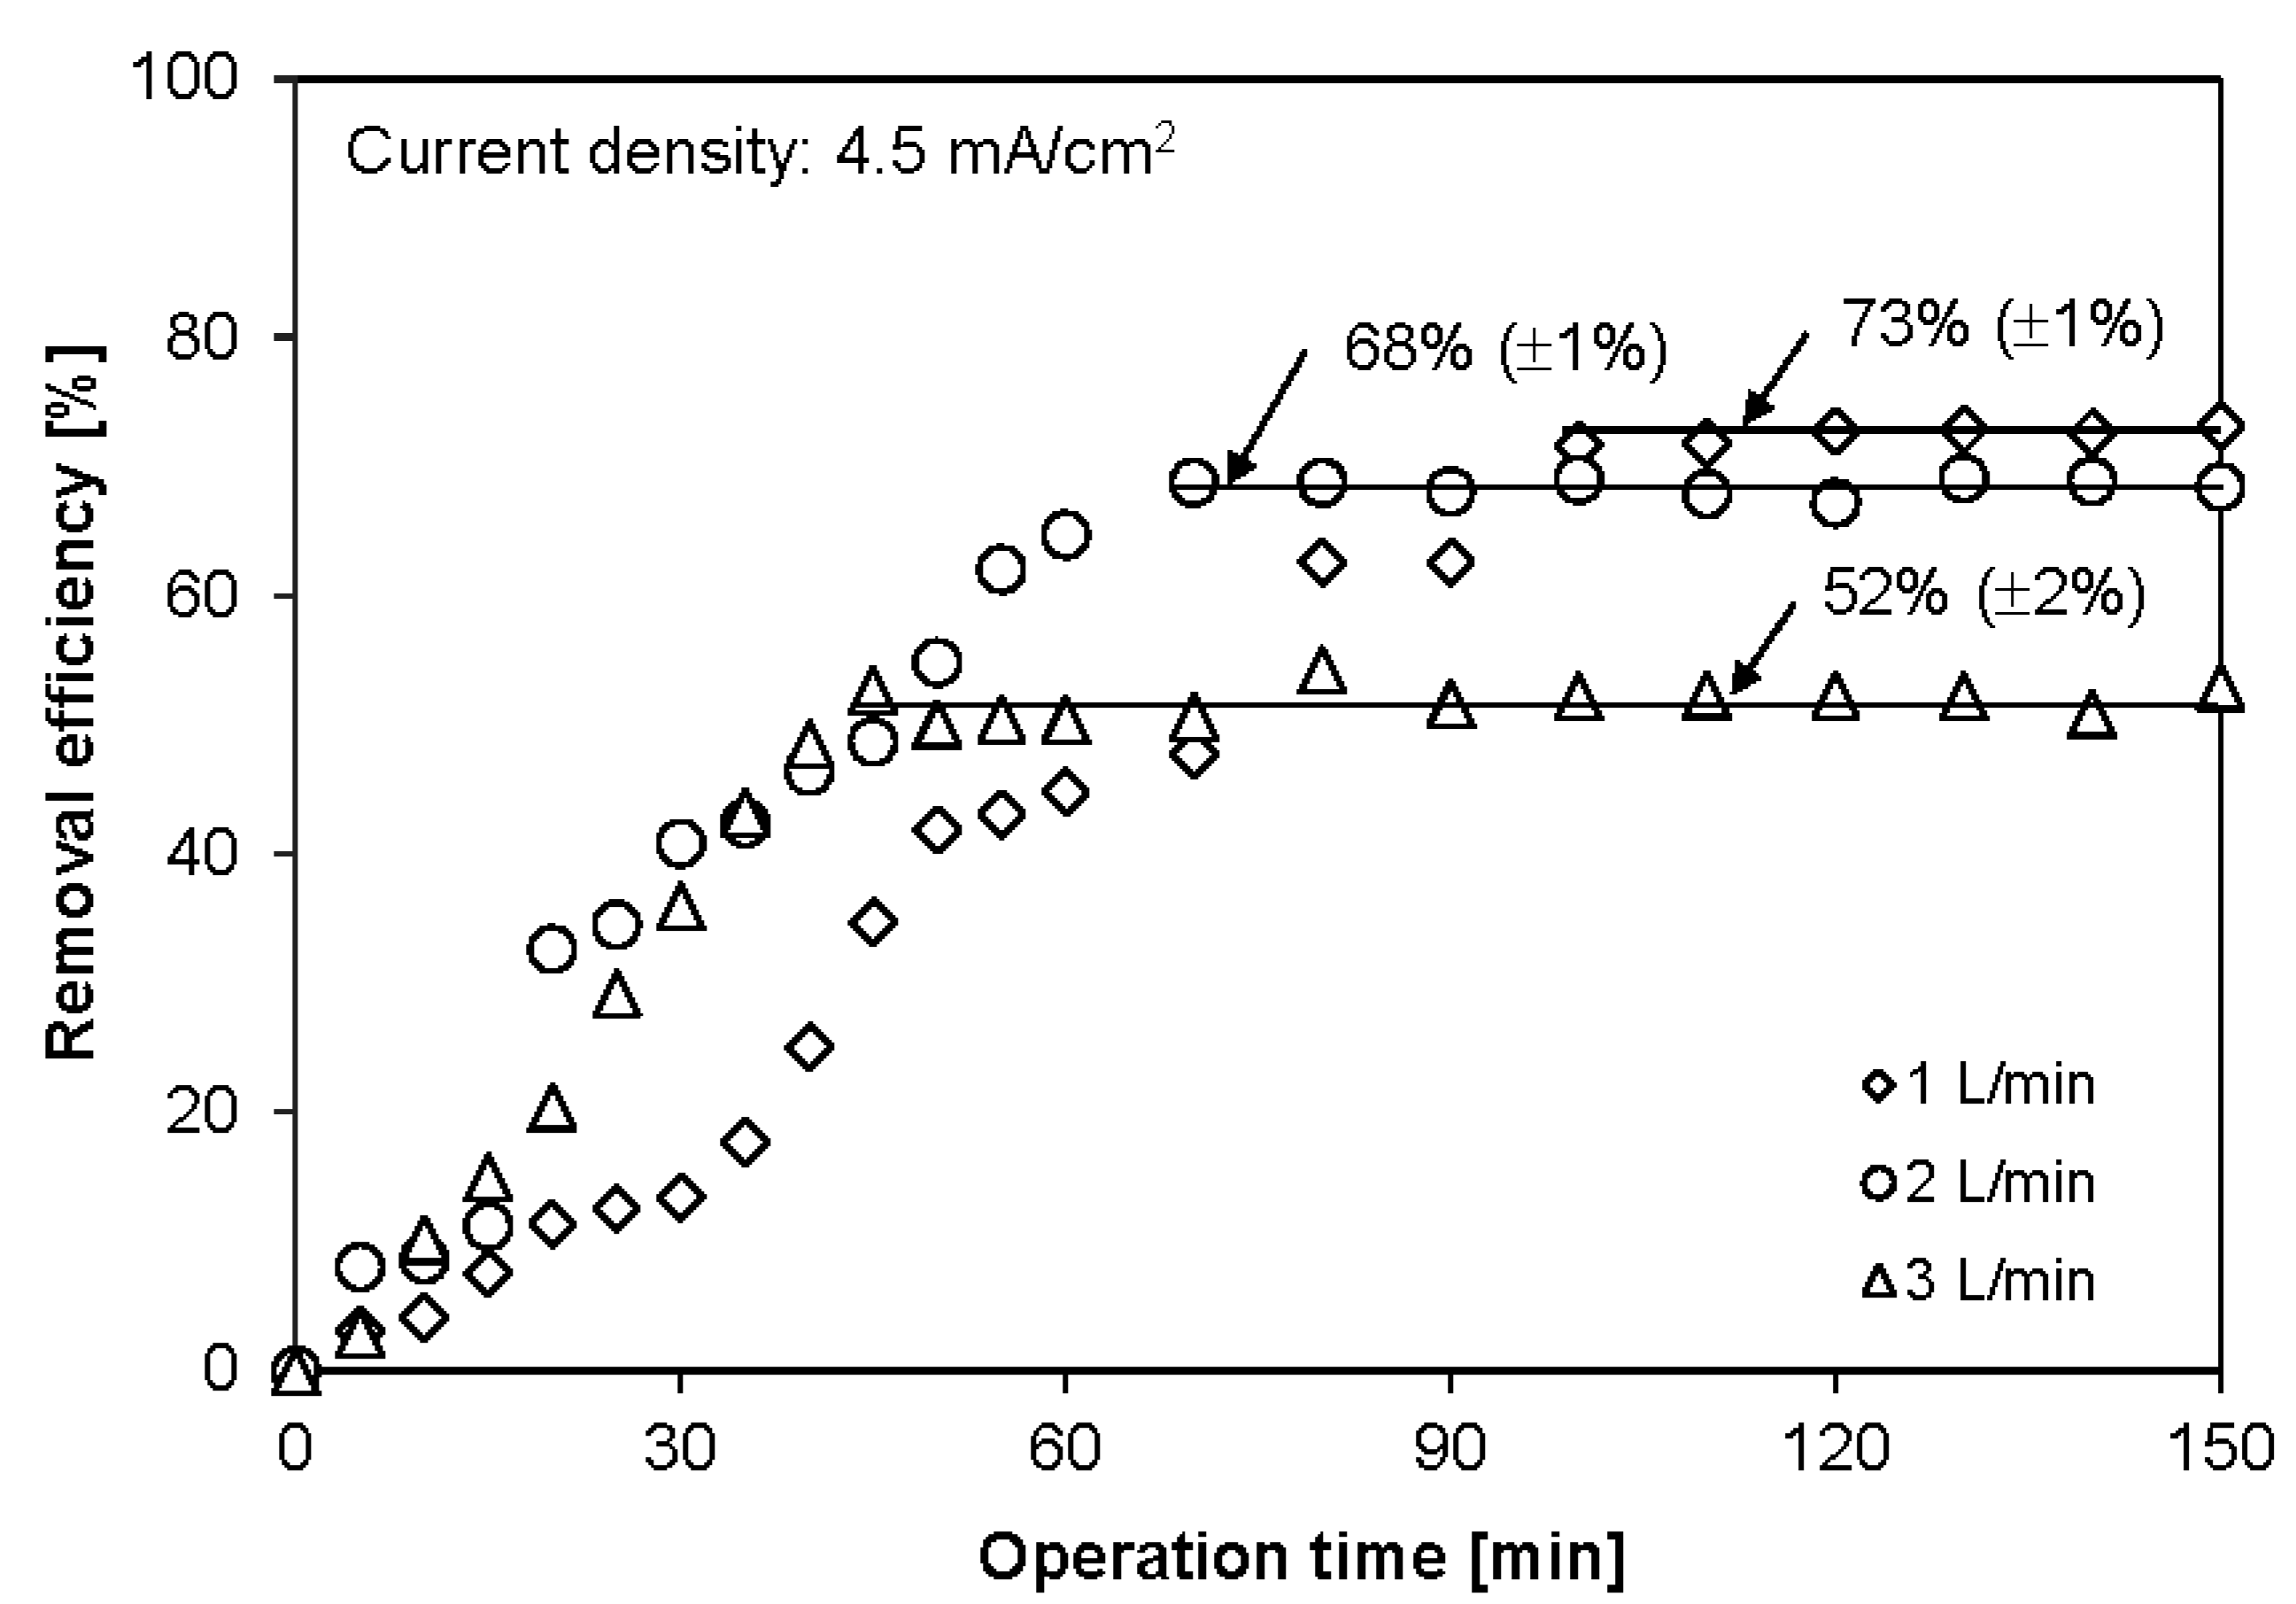
3.2.2. Flow Pattern Analysis

Varying from 1 to 4 EC units were installed in the EC compartment. Consequently, 0 to 3 vertical baffles had been added to improve the liquid flow pattern. Therefore, different conditions of baffles were examined in terms of hydrodynamic behaviors. E(t) function and mean time (τ) parameters of the resident time distribution (RTD) technique were used to define their flow patterns. The number of baffles (0–3 baffles) and length of baffles (50–90% of compartment width, which is equivalent to 13–23.4 cm) were investigated under the same conditions, i.e., tap water with a liquid flow rate of 6 L/min. The results for each condition are illustrated in Figure 9 compared to the condition without baffle addition.
For every condition, E(t) curves showed a trend similar to a plug flow reactor model. The E(t) function (see Figure 9a) indicated that when even a single baffle was added with different lengths, the performance was not much different from the non-additional case. There is also no significant difference for 50% and 70% widths for two baffles added, while a 90% condition provided a longer retention time (see Figure 9b). In the case of three baffles used, 90% width showed the longest hydraulic retention time, followed by 50% and 70%, compared to no added baffles (see Figure 9c). Figure 9d illustrates the mean time distribution of different conditions compared to the non-additional and theoretical conditions. Adding baffles(s) showed an improvement in the mean time, regardless of the baffle’s length. Moreover, a comparable performance was observed after installing 50% and 70% baffles. However, the 90% case provided a significantly longer retention time compared to 50–70% and no baffle addition. In conclusion, three baffles with 90% width resulted in better mixing by reducing the bypass mechanism. This condition was then selected for the IECS reactor in order to reduce the bypass and dead zone in the system.

3.3. Treatment Performance of IECS Reactor

Based on the literature review [28] and results found (Section 3.1.2), the turbidity can be easily precipitated and clarified by EC, followed by gravity separation processes compared to color. Therefore, the treatment performance under continued operation was first applied for decolorization and expected to remove turbidity successfully. Validated experiments will be conducted for individual turbidity and both pollutants.

3.3.1. Decolorization Performance

In continuous operation, the liquid flow rate is important to examine. Therefore, the color removal using the IECS reactor under the optimum condition found was tested by varying the liquid flow from 1 to 3 L/min. The results are plotted in Figure 10, where two zones, reactive and steady stages, were clearly separated. Based on the removal efficiency trends, liquid flows of 1, 2 and 3 L/min reached the steady stage at different times, i.e., approximately 100, 70 and 45 min, respectively. The reactive stage observed in this continuous mode is due to the reactor’s first start-up before operating. However, the treatment performance at the steady stage was evaluated and analyzed. On average, 1, 2 and 3 L/min resulted in color removal efficiencies of 73 ± 1%, 68 ± 1%, and 52 ± 2%, respectively (see Figure 10) [15]. From this result, the treatment performance of IECS is lower than that of a batch reactor by about 20–40%. In terms of electrolyzing time, it should be sufficiently compared to the batch results. A low dissolution rate and slow mixing might be the reasons for the limited precipitation rate as well as the lower decolorization efficiency. A batch column has a smaller cross-sectional area than each EC unit in the IECS reactor, providing better mixing characteristics and benefitting the coagulation reaction more than an integrated reactor. To enhance the removal efficiency reaching the target level, the current density should be increased to provide higher coagulants and a higher precipitation rate.
Figure 11 illustrates the color removal efficiency after increasing the current density with a 1 L/min flow rate by two and three times. It can be observed that the treatment performance using 9.0 and 13.5 mA/cm2 were significantly increased compared to the 4.5 mA/cm2 case. Using 4.5 mA/cm2 could remove around 73% of color after 100 min, whereas the current density of 9.0 and 13.5 mA/cm2 could remove color more than 95% (see Figure 11a). The decolorization performance was significantly enhanced. Under 9 mA/cm2, the color level decreased to less than 300 ADMI within 100 min, while it required only 70 min after increasing the current density to 13.5 mA/cm2 (see Figure 11b). Noted that the aquatic pH increased from 7.4–7.6 to 7.7–7.9 after treatment, which is in the effective range for the destabilization mechanism.

3.3.2. Turbidity Removal Validation

This part aimed to validate the treatment conditions of decolorization for turbidity removal, e.g., a current density of 13.5 mA/cm2 and a liquid flow rate of 1 L/min. However, it is also investigated under higher flow rates of 2 and 3 L/min to evaluate the removal efficiency. The removal performance and residual turbidity results are plotted in Figure 12. It can be observed that the removal efficiency is comparable, regardless of operating flows, as shown in Figure 12a. Therefore, the dissolved aluminum coagulant and operation time should be sufficient for coagulation-flocculation and clarification. To reduce turbidity to less than 20 NTU, only 45 min was required for every condition (see Figure 12b), which is much faster than color. As a result, it can be concluded that the treatment condition found for decolorization is sufficient for turbidity removal even earlier.

3.3.3. Simultaneous Removal of Turbidity and Color

The condition of a liquid flow rate of 1 L/min with a current density of 13 mA/cm2 was applied for treating the synthetic wastewater containing both turbidity and color. However, the result is not significantly different from the individual pollutant conditions of turbidity and color. The required treatment time to reach the steady stage with turbidity < 20 NTU and color < 300 ADMI is 70 min (data not shown). Moreover, the treatment efficiency was also observed at a higher liquid flow rate of 2 L/min under the simultaneous removal condition. As expected, the treatment time required to reach the steady stage with the residual target levels for both pollutants is 140 min. Table 3 presents the liquid flow rate conditions for different synthetic wastewater characteristics, i.e., individual turbidity and color, and both. The required treatment time to decrease the pollutant(s) to the target level (turbidity < 20 NTU and color < 300 ADMI) was also summarized.

4. Conclusions

This study aimed to optimize the electrocoagulation and clarification processes for developing an integrated electrocoagulation-sedimentation (IECS) reactor in order to remove turbidity and color from synthetic textile wastewater as a compact system. The experiments were mainly divided into three main parts, including the optimization of the EC process, followed by the estimation of settling parameters for the clarifier tank design. Based on the result, the optimum conditions of the EC process, i.e., electrode gap, current density, and electrolyze time, have been obtained together with the kinetic study and models. Secondly, the IECS reactor on a laboratory scale was constructed with the proper internal configuration in terms of liquid flow analysis. As a result, four units of EC were placed in the EC compartment of the IECS reactor with 90% in width of three baffles. Each unit of EC has two pairs of aluminum electrode plats in a monopolar arrangement with a 1.5 cm gap and required a current density of 13.5 mA/cm2. Another part of the IECS reactor was designed for precipitated separation, following the batch settling test result. Under the continuous mode, the liquid flow rate was defined for treating turbidity and color to the target levels. It can be summarized that in the case of the individual turbidity and color, the liquid flow rates are 3 and 1 L/min, respectively. In the case of the simultaneous presence of both pollutants, a liquid flow rate of 1–2 L/min provided a treatment capacity that reached the desired levels. Moreover, the start-up period required to reach a steady stage was also defined as an operation guideline.

Author Contributions

Conceptualization, S.B., N.C. and P.P.; methodology, S.B., N.C. and P.P.; validation, S.B., P.H. (Penghour Hong) and P.H. (Phaly Ham); formal analysis, S.B., P.H. (Penghour Hong), N.C. and P.H. (Phaly Ham); investigation, S.B., P.H. (Penghour Hong), S.P. and S.V.; resources, N.C. and R.C.; writing—original draft preparation, S.B., P.H. (Penghour Hong), S.P. and S.V.; writing—review and editing, S.B, P.H. (Penghour Hong), N.C., P.H. (Phaly Ham), R.C. and P.P.; visualization, S.B., P.H. (Penghour Hong), S.P. and S.V.; supervision, N.C. and P.P.; project administration, N.C. and R.C.; funding acquisition, N.C. and R.C. All authors have read and agreed to the published version of the manuscript.

Funding

This research was funded by the Laboratory-Based Education (LBE) Project of the Japan International Cooperation Agency (JICA) in the Institute of Technology of Cambodia (ITC). It is also supported by the ASEAN University Network/Southeast Asia Engineering Education Development Network (AUN/SEED-Net) Program of JICA through the Collaborative Research (CR) Program.

Institutional Review Board Statement

Not applicable.

Informed Consent Statement

Not applicable.

Acknowledgments

Authors would like to acknowledge the Water Environment Laboratory (WE Lab) of ITC for laboratory support and data analysis.

Conflicts of Interest

The authors declare no conflict of interest.

References

  1. Paul, S.; Chavan, S.; Khambe, S. Studies on characterization of textile industrial waste water in Solapur city. Int. J. Chem. Sci. 2012, 10, 635–642. [Google Scholar]
  2. Kadirvelu, K.; Kavipriya, M.; Karthika, C.; Radhika, M.; Vennilamani, N.; Pattabhi, S. Utilization of various agricultural wastes for activated carbon preparation and application for the removal of dyes and metal ions from aqueous solutions. Bioresour. Technol. 2003, 87, 129–132. [Google Scholar] [CrossRef]
  3. Papić, S.; Koprivanac, N.; Božić, A.L.; Meteš, A. Removal of some reactive dyes from synthetic wastewater by combined Al (III) coagulation/carbon adsorption process. Dyes Pigments 2004, 62, 291–298. [Google Scholar] [CrossRef]
  4. Verma, A.K.; Bhunia, P.; Dash, R.R. Reclamation of wastewater using composite coagulants: A sustainable solution to the textile industries. Chem. Eng. Trans. 2014, 42, 175–180. [Google Scholar]
  5. Akbal, F.; Kuleyin, A. Decolorization of levafix brilliant blue E-B by electrocoagulation method. Environ. Prog. Sustain. Energy 2011, 30, 29–36. [Google Scholar] [CrossRef]
  6. Chafi, M.; Gourich, B.; Essadki, A.; Vial, C.; Fabregat, A. Comparison of electrocoagulation using iron and aluminium electrodes with chemical coagulation for the removal of a highly soluble acid dye. Desalination 2011, 281, 285–292. [Google Scholar] [CrossRef]
  7. Holt, P.K.; Barton, G.W.; Mitchell, C.A. The future for electrocoagulation as a localised water treatment technology. Chemosphere 2005, 59, 355–367. [Google Scholar] [CrossRef] [PubMed]
  8. Mukheled, A.-S. A novel water pretreatment approach for turbidity removal using date seeds and pollen sheath. J. Water Resour. Prot. 2012, 2012, 17425. [Google Scholar]
  9. Baird, R.B.; Eaton, A.D.; Rice, E.W.; Bridgewater, L. Standard Methods for the Examination of Water and Wastewater, 23rd ed.; American Public Health Association: Washington, DC, USA, 2017. [Google Scholar]
  10. Nawadol, T.; Nattawin, C.; Pisut, P. Effects of electrode configuration on electrocoagulation-flotation for oily wastewater treatment. In Proceedings of the 23rd Thailand-Korea Conference on Environmental Engineering, Bangkok, Thailand, 3–5 July 2017. [Google Scholar]
  11. Crittenden, J.C.; Trussell, R.R.; Hand, D.W.; Howe, K.; Tchobanoglous, G. MWH’s Water Treatment: Principles and Design; John Wiley & Sons: Hoboken, NJ, USA, 2012. [Google Scholar]
  12. Reynolds, T.D.; Richards, P.A.C. Unit Operations and Processes in Environmental Engineering; PWS Publishing Company: Boston, MA, USA, 1995. [Google Scholar]
  13. Romphophak, P.; Wongwailikhit, K.; Chawaloesphonsiya, N.; Samornkraisorakit, P.; Painmanakul, P. Study of flow pattern in jet clarifier for removal of turbidity by residence time distribution approach. Eng. J. 2016, 20, 17–27. [Google Scholar] [CrossRef] [Green Version]
  14. Fogler, H.S. Elements of Chemical Reaction Engineering, 4th ed.; Pearson Education: London, UK, 2006. [Google Scholar]
  15. Song, S.; He, Z.; Qiu, J.; Xu, L.; Chen, J. Ozone assisted electrocoagulation for decolorization of CI Reactive Black 5 in aqueous solution: An investigation of the effect of operational parameters. Sep. Purif. Technol. 2007, 55, 238–245. [Google Scholar] [CrossRef]
  16. Hashim, K.; Shaw, A.; Al Khaddar, R.; Pedrola, M.O.; Phipps, D. Influence of electrodes spacing on internal temperature of electrocoagulation (EC) cells during the removal (Fe II) from drinking water. In Proceedings of the International Conference for Doctoral Research, Dubai, United Arab Emirates, 13 May 2017. [Google Scholar]
  17. Golder, A.K.; Samanta, A.N.; Ray, S. Removal of Cr3+ by electrocoagulation with multiple electrodes: Bipolar and monopolar configurations. J. Hazard. Mater. 2007, 141, 653–661. [Google Scholar] [CrossRef] [PubMed]
  18. Daneshvar, N.; Ashassi-Sorkhabi, H.; Tizpar, A. Decolorization of orange II by electrocoagulation method. Sep. Purif. Technol. 2003, 31, 153–162. [Google Scholar] [CrossRef]
  19. Yılmaz, A.E.; Boncukcuoğlu, R.; Kocaker, M.M.; Kocadağistan, E. An empirical model for kinetics of boron removal from boroncontaining wastewaters by the electrocoagulation method in a batch reactor. Desalination 2008, 230, 288–297. [Google Scholar] [CrossRef]
  20. Aoudj, S.; Khelifa, A.; Drouiche, N.; Hecini, M.; Hamitouche, H. Electrocoagulation process applied to wastewater containing dyes from textile industry. Chem. Eng. Processing Process. Intensif. 2010, 49, 1176–1182. [Google Scholar] [CrossRef]
  21. Dalvand, A.; Gholami, M.; Joneidi, A.; Mahmoodi, N.M. Dye removal, energy consumption and operating cost of electrocoagulation of textile wastewater as a clean process. Clean–Soil Air Water 2011, 39, 665–672. [Google Scholar] [CrossRef]
  22. Ching, H.-W.; Tanaka, T.S.; Elimelech, M. Dynamics of coagulation of kaolin particles with ferric chloride. Water Res. 1994, 28, 559–569. [Google Scholar] [CrossRef]
  23. Abuzaid, N.S.; Bukhari, A.A.; Al-Hamouz, Z.M. Removal of bentonite causing turbidity by electro-coagulation. J. Environ. Sci. Health Part A 1998, 33, 1341–1358. [Google Scholar] [CrossRef]
  24. Bazrafshan, E.; Alipour, M.R.; Mahvi, A.H. Textile wastewater treatment by application of combined chemical coagulation, electrocoagulation, and adsorption processes. Desalination Water Treat. 2016, 57, 9203–9215. [Google Scholar] [CrossRef]
  25. Kobya, M.; Ulu, F.; Gebologlu, U.; Demirbas, E.; Oncel, M.S. Treatment of potable water containing low concentration of arsenic with electrocoagulation: Different connection modes and Fe–Al electrodes. Sep. Purif. Technol. 2011, 77, 283–293. [Google Scholar] [CrossRef]
  26. Lin, S.H.; Peng, C.F. Treatment of textile wastewater by electrochemical method. Water Res. 1994, 28, 277–282. [Google Scholar] [CrossRef]
  27. Kawamura, S. Integrated Design and Operation of Water Treatment Facilities; John Wiley & Sons: Hoboken, NJ, USA, 2000. [Google Scholar]
  28. Yusoff, M.S.; Azwan, A.M.; Zamri, M.F.M.A.; Aziz, H.A. Removal of colour, turbidity, oil and grease for slaughterhouse wastewater using electrocoagulation method. In Proceedings of the AIP Conference Proceedings, Bikaner, India, 24–25 November 2017; p. 040012. [Google Scholar]
Figure 1. Experimental set-up in the batch column reactor: (1) column test, (2) gas collection pipe, (3) soap film meter, (4) electrode plates, (5) electrical wire, (6) DC generator, (7) sampling port, and (8) waste drainage port.
Chemengineering 06 00003 g001
Figure 2. Image of synthetic wastewater: (a) turbidity using bentonite and (b) color using dye.
Chemengineering 06 00003 g002
Figure 3. Qg/Eloss value at different electrolyze times (4–14 min), electrode gaps (1–2 cm), and current densities (1.5–2.5 mA/cm2).
Chemengineering 06 00003 g003
Figure 4. Effect of current density on removal efficiency of (a) turbidity and (b) color.
Chemengineering 06 00003 g004
Figure 5. Kinetic removal at different initial concentrations: (a) turbidity removal efficiency, (b) residual turbidity, (c) color removal efficiency, and (d) residual color (current density 4.5 mA/cm2).
Chemengineering 06 00003 g005aChemengineering 06 00003 g005b
Figure 6. Removal efficiency from experimental and predicted values under 4.5 mA/cm2 of (a) turbidity and (b) color.
Chemengineering 06 00003 g006
Figure 7. Fraction removal with OFR after EC process for (a) turbidity and (b) color.
Chemengineering 06 00003 g007
Figure 8. Three-dimensional drawing of IECS: (1) inlet port, (2) electrode set, (3) compartment baffle, (4) de-sludge port, (5) bottom slop of clarifier compartment, and (6) outlet port.
Chemengineering 06 00003 g008
Figure 9. E (t) curve under a flow rate of 6 L/min measured at the outlet port of IECS using different compartment baffle conditions: (a) one baffle, (b) two baffles, (c) three baffles with different length percentages compared to EC width, and (d) their mean time distributions comparison.
Chemengineering 06 00003 g009
Figure 10. Decolorization efficiency using IECS reactor at different liquid flow rates.
Chemengineering 06 00003 g010
Figure 11. Color removal at different current densities: (a) removal efficiency, and (b) residual color.
Chemengineering 06 00003 g011
Figure 12. Turbidity removal at different liquid flows: (a) removal efficiency and (b) residual turbidity.
Chemengineering 06 00003 g012
Table 1. Characteristics of synthetic wastewater used in the present work.
ParametersUnitBentonite
(50–500 NTU)
Reactive Dye
(2500–15,000 ADMI)
Analytical
Method
pH-7.1–7.77.1–7.4pH meter
CODmg/L12–8032–1845220D
TDSmg/L95–240182–214Conductivity meter
TSSmg/L280–550188–2242540D
Table 2. Summary the design criteria for each compartment used to design IECS reactor.
TermsOptimum Level forRemark
TurbidityColor
EC compartment:
Electrode typeAluminumReview previous studies
Number of electrodes2 pairsReview previous studies
Electrode arrangementMonopolarReview previous studies
Electrode gap1.5 cmStudied range: 1–2 cm
Current density4.5 mA/cm2Studied range: 1.5–5.5 mA/cm2
Electrolyze time15–20 min15–60 minStudied range: 0–60 min
Clarifier compartment:
Settling overflow 1.89 m/h1.54 m/hFor 90% fraction removal
Table 3. Summary the treatment condition requirement to reduce to the target levels.
ConditionLiquid Flow RateRequired Time for Steady Stage
Turbidity (250 NTU)3 L/min45 min
Color (6000 ADMI)1 L/min70 min
Simultaneous presence 1 L/min70 min
2 L/min140 min
Publisher’s Note: MDPI stays neutral with regard to jurisdictional claims in published maps and institutional affiliations.

