Correlation between the Serum Pepsinogen I Level and the Symptom Degree in Proton Pump Inhibitor-Users Administered with a Probiotic

Abstract
:1. Introduction
2. Experimental Section
2.1. Subjects
2.2. Study Protocol
2.3. The Questionnaire
2.4. Laboratory Assays
2.5. Statistical Analysis
3. Results
3.1. Basal Relationships between the Biomarker Values and FSSG Scores According to Gender and Age

| Gender | Age | |||||
|---|---|---|---|---|---|---|
| Male | Female | <70 years | 70+ years | |||
| N = 16 | N = 8 | N = 13 | N = 11 | |||
| Median [IQR] | Median [IQR] | Test b) | Median [IQR] | Median [IQR] | Test c) | |
| Biomarker values | ||||||
| Gastrin pg/mL | 235.0 [120.0–470.0] | 275.0 [180.0–660.0] | NS | 200.0 [110.0–450.0] | 430.0 [230.0–840.0] | p < 0.05 |
| Ghrelin pg/mL | 138.5 [77.0–188.0] | 375.0 [170.5–599.0] | NS | 160.0 [79.0–195.0] | 195.0 [73.0–438.0] | NS |
| PGI ng/mL | 126.0 [73.6–253.5] | 144.0 [71.4–191.0] | NS | 116.0 [74.7–179.0] | 136.0 [68.0–266.0] | NS |
| PGI/II ratio | 5.70 [5.15–7.25] | 6.80 [5.95–8.50] | NS | 6.30 [5.60–8.20] | 5.60 [5.20–7.20] | NS |
| FSSG scores | ||||||
| Total symptoms | 6.5 [3.0–15.5] | 12.5 [5.5–16.5] | NS | 12.0 [8.0–19.0] | 4.0 [2.0–14.0] | p < 0.05 |
| Reflux symptoms | 3.0 [1.0–8.5] | 8.5 [3.0–11.0] | NS | 8.0 [4.0–11.0] | 2.0 [0.0–7.0] | p < 0.05 |
| Dysmotility symptoms | 3.5 [1.0–7.5] | 3.5 [2.0–6.5] | NS | 5.0 [3.0–8.0] | 3.0 [2.0–5.0] | p < 0.05 |
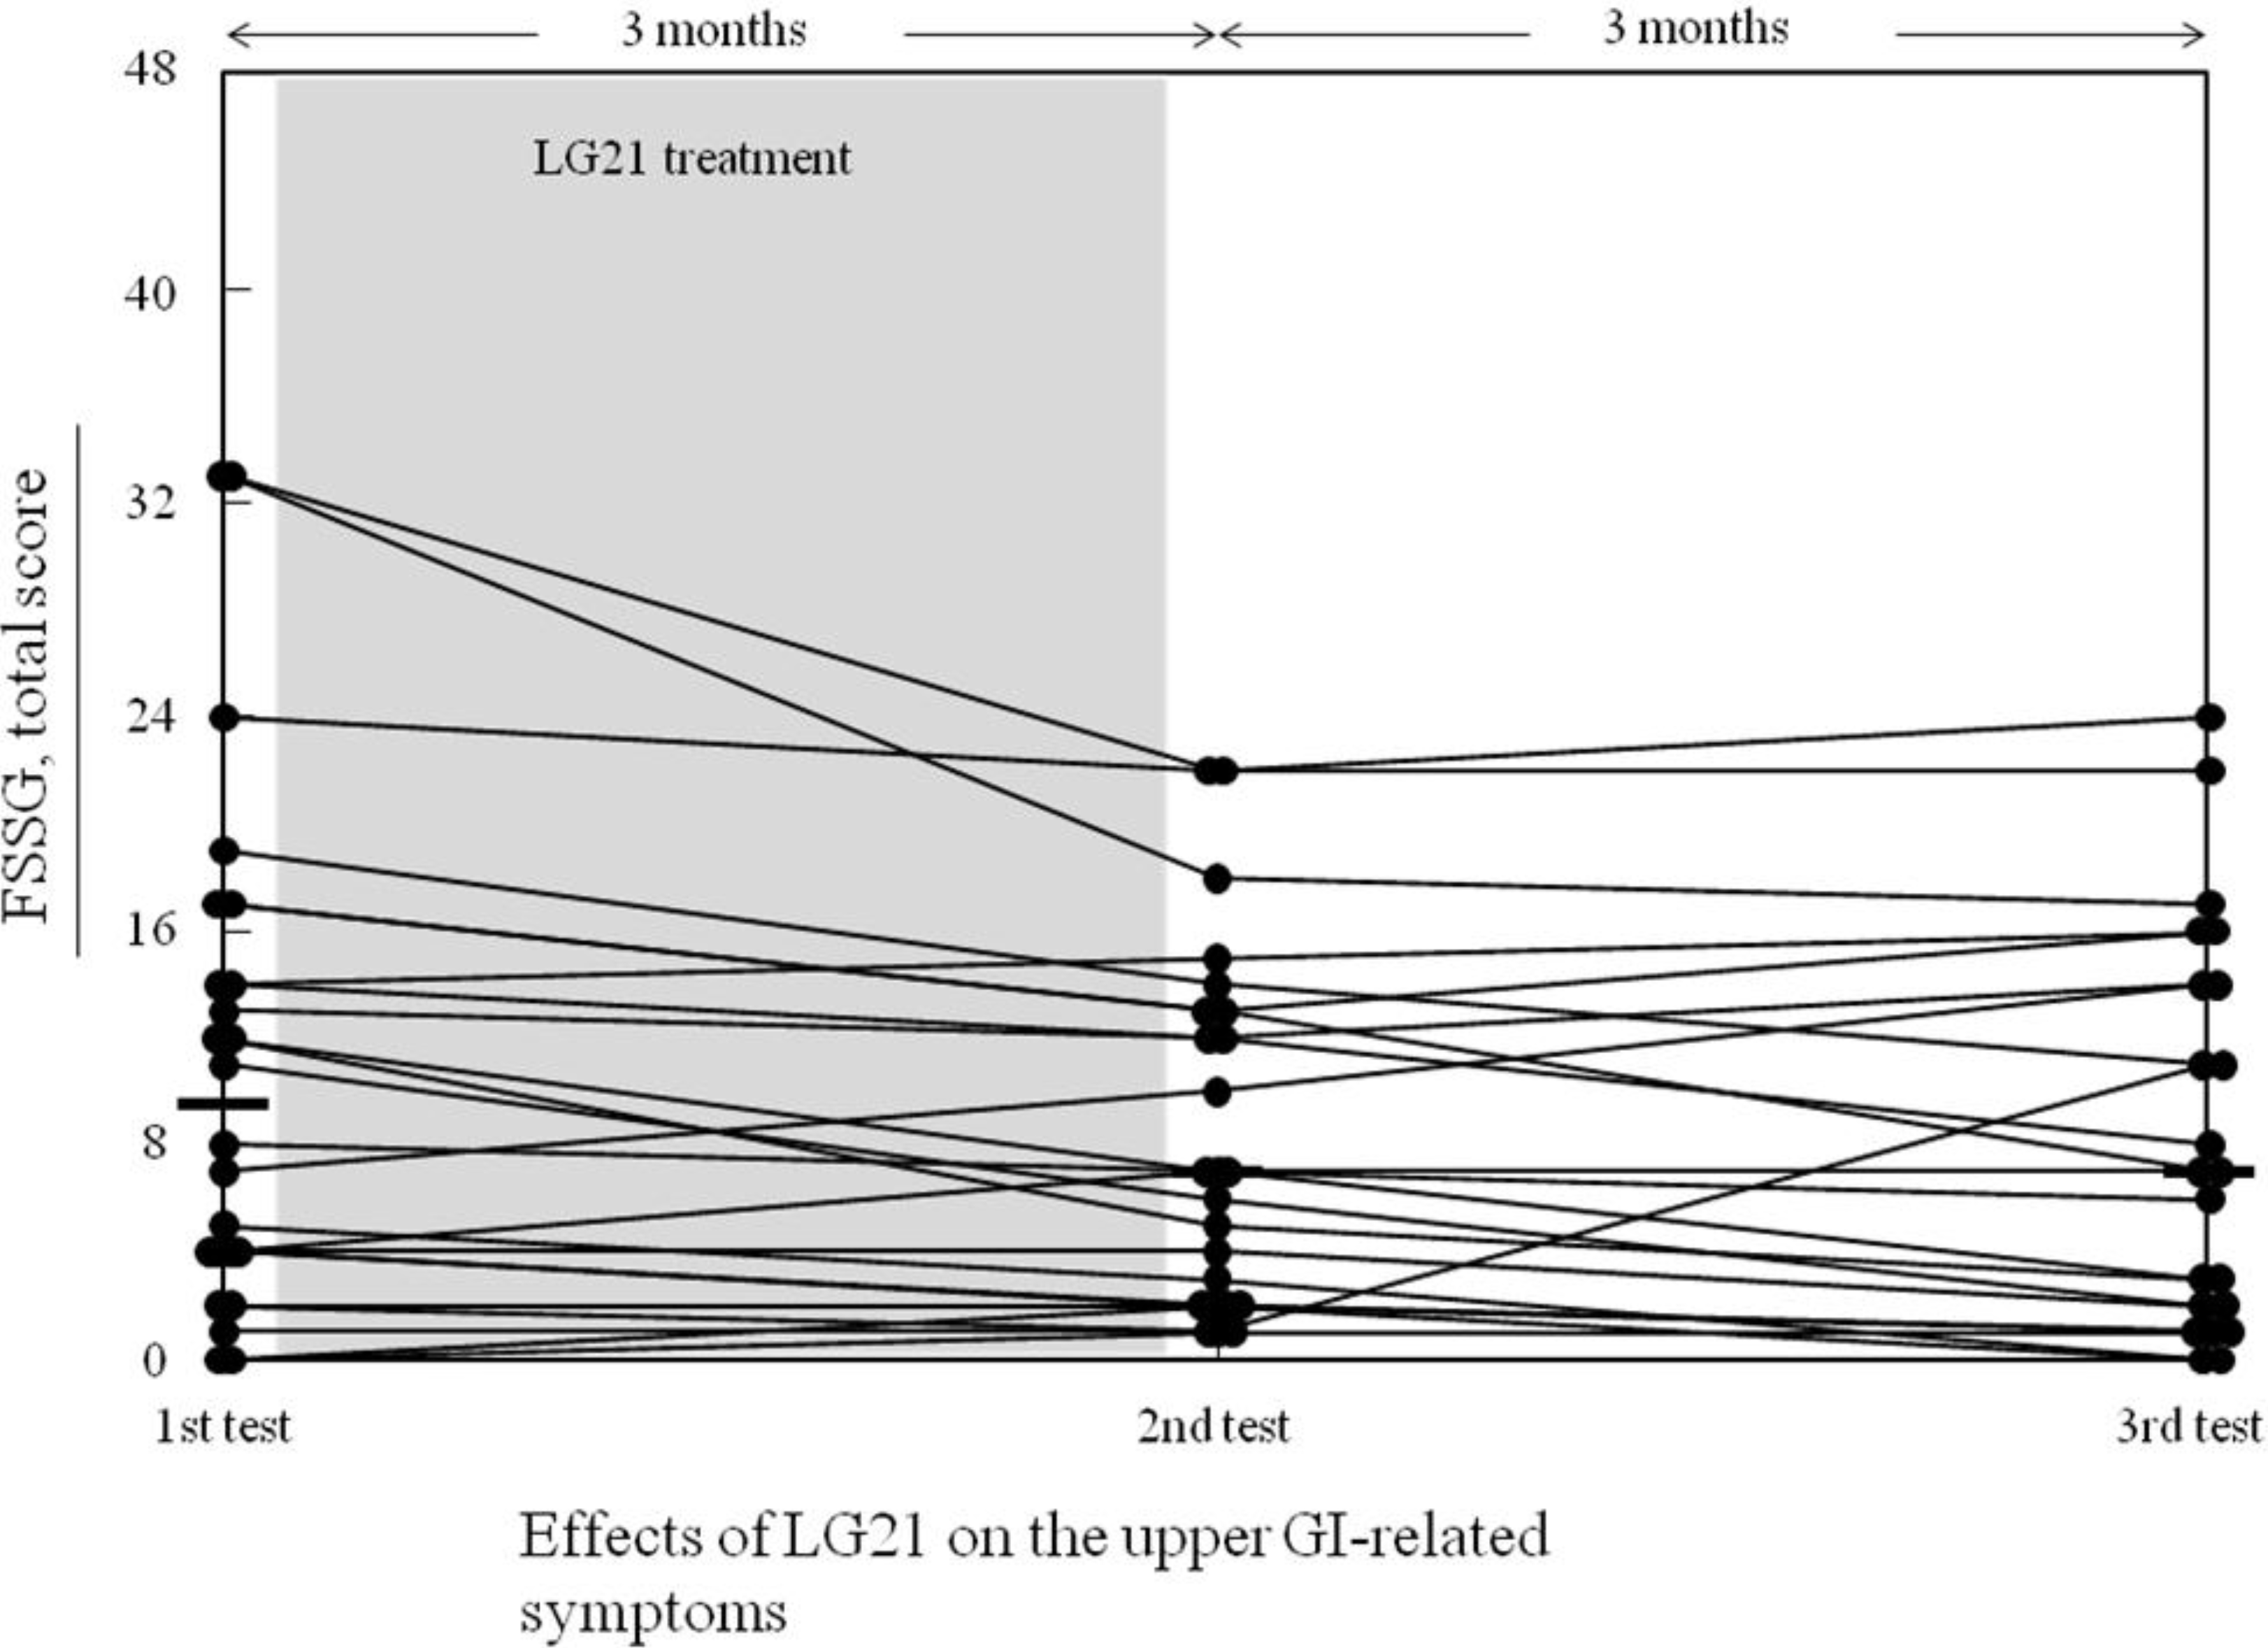
3.2. Effects of the LG21 Treatment on the Biomarker Values and the FSSG Score

| 1st Examination (Before LG21 Treatment) N = 24 | 2nd Examination (After LG21 Treatment) N = 24 | Test a) | |
|---|---|---|---|
| Biomarkers | |||
| Gastrin, pg/mL | 250.0 [140.0–485.0] b), 388.6 (365.7) | 250.0 [125.0–585.0] b), 359.6 (273.4) | p = 0.67 |
| Ghrelin, pg/mL | 169.5 [77.0–375.0] b), 268.3 (271.8) | 172.0 [74.0–260.0] b), 233.2 (212.0) | p = 0.25 |
| PGI, ng/mL | 126.0 [71.4–208.5] b), 145.9 (90.0) | 139.5 [75.0–201.5] b), 155.6 (105.5) | p = 0.27 |
| PG-I/II, ratio | 6.4 (1.6) c) | 6.2 (1.7) c) | p = 0.21 |
| FSSG scores | |||
| Total, 0–48 | 9.5 [4.0–15.5], 10.8 (0.5) c) | 7.0 [2.0–13.0], 8.4 (6.6) c) | p = 0.005 |
| Reflux, 0–28 | 4.0 [1.0–10.5], 6.2 (6.2) c) | 3.0 [1.0–8.0], 4.8 (4.7) c) | p = 0.008 |
| Dysmotility, 0–20 | 3.5 [2.0–7.5], 4.6 (3.8) c) | 4.0 [2.0–5.5], 3.6 (2.5) c) | p = 0.021 |
3.3. Relationships between the Symptoms and the Biomarkers
| Exam. No.a) | Symptoms | Biomarker | t | p | Adjusted R2 |
|---|---|---|---|---|---|
| 1st | Reflux | Gastrin | −0.70 | 0.49 | 0.29 |
| PGI | −1.48 | 0.15 | |||
| Dysmotility | Gastrin | 0.53 | 0.61 | 0.30 | |
| PGI | −2.40 | 0.027 | |||
| 2nd | Reflux | Gastrin | −1.14 | 0.27 | 0.26 |
| PGI | −0.85 | 0.41 | |||
| Dysmotility | Gastrin | −0.06 | 0.95 | 0.32 | |
| PGI | −2.45 | 0.024 | |||
| 3rd | Reflux | Gastrin | −1.49 | 0.15 | 0.30 |
| PGI | −0.77 | 0.45 | |||
| Dysmotility | Gastrin | −0.14 | 0.89 | 0.21 | |
| PGI | −0.72 | 0.48 | |||
| 4th | Reflux | Gastrin | −1.02 | 0.32 | 0.13 |
| PGI | −1.66 | 0.12 | |||
| Dysmotility | Gastrin | 0.45 | 0.66 | −0.13 | |
| PGI | −1.26 | 0.23 |
| Biomarkers | N | FSSG symptoms score | ||
|---|---|---|---|---|
| Total | Reflux | Dysmotility | ||
| Gastrin | 91 | −0.32 a)** | −0.36 *** | −0.22 * |
| Ghrelin | 93 | −0.01 | 0.01 | −0.06 |
| PGI | 93 | −0.35 *** | −0.26 * | −0.30 ** |
| PGI/II | 93 | 0.04 | 0.16 | −0.08 |
| Upper GI symptoms | Model | |||
|---|---|---|---|---|
| Biomarkers only | Sex and age adjusted | |||
| t | p | t | p | |
| Total symptoms | ||||
| Gastrin | −3.03 | 0.003 | −1.06 | 0.29 |
| PGI | −2.85 | 0.005 | −3.74 | <0.001 |
| Female sex | 1.31 | 0.19 | ||
| Age | −3.85 | <0.001 | ||
| R2 = 0.168 | R2 = 0.331 | |||
| Adjusted R2 = 0.150 | Adjusted R2 = 0.300 | |||
| Reflux symptoms | ||||
| Gastrin | −3.38 | 0.001 | −1.27 | 0.21 |
| PGI | −1.60 | 0.11 | −2.47 | 0.015 |
| Female sex | 1.45 | 0.15 | ||
| Age | −4.23 | <0.001 | ||
| R2 = 0.139 | R2 = 0.334 | |||
| Adjusted R2 = 0.120 | Adjusted R2 = 0.304 | |||
| Dysmotility symptoms | ||||
| Gastrin | −2.02 | 0.046 | −0.14 | 0.89 |
| PGI | −2.72 | 0.008 | −3.44 | <0.001 |
| Female sex | 0.13 | 0.89 | ||
| Age | −3.50 | <0.001 | ||
| R2 = 0.118 | R2 = 0.237 | |||
| Adjusted R2 = 0.099 | Adjusted R2 = 0.202 | |||
4. Discussion
5. Conclusions
Acknowledgments
Author Contributions
Conflicts of Interest
References
- Fass, R. Epidemiology and pathophysiology of symptomatic gastroesophageal reflux disease. Am. J. Gastroenterol. 2003, 98, S2–S7. [Google Scholar] [CrossRef]
- Tack, J.; Talley, N.J.; Camilleri, M.; Holtmann, G.; Hu, P.; Malagelada, J.-R.; Stanghellini, V. Functional gastroduodenal disorders. Gastroenterology 2006, 130, 1466–1479. [Google Scholar] [CrossRef]
- Monkemuller, K.; Neumann, H.; Nocon, M.; Vieth, M.; Labenz, J.; Willich, S.N.; Stolte, M.; Hocker, M.; Jaspersen, D.; Lind, T.; et al. Serum gastrin and pepsinogens do not correlate with the different grades of severity of gastro-esophageal reflux disease: A matched case-control study. Aliment. Pharmacol. Ther. 2008, 28, 491–496. [Google Scholar] [CrossRef]
- Germana, B.; di Mario, F.; Cavallaro, L.G.; Moussa, A.M.; Lecis, P.; Liatoupolou, S.; Comparato, G.; Carloni, C.; Bertiato, G.; Battiestel, M.; et al. Clinical usefulness of serum pepsinogens I and II, gastrin-17 and anti-Helicobacter pylori antibodies in the management dyspeptic patients in primary care. Dig. Liver Dis. 2005, 37, 501–508. [Google Scholar] [CrossRef]
- Vaananen, H.; Vauhkonen, M.; Helske, T.; Kaariainen, I.; Rasmussen, M.; Tunturi-Hihnala, H.; Koskenpato, J.; Sotka, M.; Turunen, M.; Sandström, R.; et al. Non-endoscopic diagnosis of atrophic gastritis with a blood test. Correlation between gastric histology and serum level of gastrin-17 and pepsinogen I: A multicenter study. Eur. J. Gastroenterol. Hepatol. 2003, 15, 885–891. [Google Scholar] [CrossRef]
- Kusano, M.; Shimoyama, Y.; Sugimoto, S.; Kawamura, O.; Maeda, M.; Minashi, K.; Kuribayashi, S.; Higuchi, T.; Zai, H.; Ino, K.; et al. Development and evaluation of FSSG: Frequency scale for the symptoms of GERD. J. Gastroenterol. 2004, 39, 888–891. [Google Scholar] [CrossRef]
- Iinuma, K.; Ikeda, I.; Takai, Y.; Yanagawa, Y.; Kurata, K. Radioimmunoassay of gastin by polyethyrenglycol method. Radioisotopes (Japanese) 1982, 31, 350–356. [Google Scholar] [CrossRef]
- Miki, K.; Urita, Y.; Moriyama, K.; Kitajima, S. Evaluation of peosinogen I and pepsinogen II assay reagents on fully automated chemiluminescent enzyme immunoassay system, Lumipulse Presto II. Jpn. J. Med. Pharm. Sci. (Japanese) 2006, 56, 889–896. [Google Scholar]
- Honma, T.; Ishizuka, M.; Takada, M.; Hosoda, H.; Kangawa, K. Development of high sensitive ELISA for ghrelin. BIO Clin. (Japanese) 2003, 18, 532–535. [Google Scholar]
- Takagi, A.; Uemura, N.; Inoue, K.; Nakajima, S.; Kawai, T.; Ohtsu, T.; Koga, Y. Effect of L. gasseri on dyspeptic symptoms in subjects with H. pylori infection. Gastroenterology 2013, 144, S-679. [Google Scholar]
- Rees, W.D.W.; Brown, C.M. Physiology of the stomach and duodenum. In Bockus Gastroenterology, 5th ed.; Haubrich, W.S., Schaffner, F., Berk, J.E., Eds.; W. B. Saunders Company: Philadelphia, PA, USA, 1995; pp. 582–614. [Google Scholar]
- Agreus, L.; Storskrubb, T.; Aro, P.; Ronkainen, J.; Talley, N.J.; Sipponen, P. Clinical use of proton-pump inhibitors but not H2-blockers or antacid/alginates raises the serum levels of amidated gastrin-17, pepsinogen I and pepsinogen II in a radom adult population. Scand. J. Gastroenterol. 2009, 44, 564–570. [Google Scholar] [CrossRef]
- Uchida, M.; Kurakazu, K. Yogurt containing Lactobacillus gasseri OLL2716 exerts gastroprotective action against acute gastric lesion and antral ulcer in rats. J. Pharmacol. Sci. 2004, 96, 84–90. [Google Scholar] [CrossRef]
- Defize, J.; Hunt, R.H. Effect of hydrochloric acid and prostaglandins on pepsinogen synthesis and secretion in canine gastric chief cell monolayer cultures. Gut 1989, 30, 774–781. [Google Scholar] [CrossRef]
- Graham, D.Y.; Genta, R.M. Long-term proton pump inhibitor use and gastrointestinal cancer. Curr. Gastroenterol. Rep. 2008, 10, 543–547. [Google Scholar] [CrossRef]
© 2014 by the authors; licensee MDPI, Basel, Switzerland. This article is an open access article distributed under the terms and conditions of the Creative Commons Attribution license (http://creativecommons.org/licenses/by/3.0/).
Share and Cite
Igarashi, M.; Nagano, J.; Tsuda, A.; Suzuki, T.; Koike, J.; Uchida, T.; Matsushima, M.; Mine, T.; Koga, Y. Correlation between the Serum Pepsinogen I Level and the Symptom Degree in Proton Pump Inhibitor-Users Administered with a Probiotic. Pharmaceuticals 2014, 7, 754-764. https://doi.org/10.3390/ph7070754
Igarashi M, Nagano J, Tsuda A, Suzuki T, Koike J, Uchida T, Matsushima M, Mine T, Koga Y. Correlation between the Serum Pepsinogen I Level and the Symptom Degree in Proton Pump Inhibitor-Users Administered with a Probiotic. Pharmaceuticals. 2014; 7(7):754-764. https://doi.org/10.3390/ph7070754
Chicago/Turabian StyleIgarashi, Muneki, Jun Nagano, Ayumi Tsuda, Takayoshi Suzuki, Jun Koike, Tetsufumi Uchida, Masashi Matsushima, Tetsuya Mine, and Yasuhiro Koga. 2014. "Correlation between the Serum Pepsinogen I Level and the Symptom Degree in Proton Pump Inhibitor-Users Administered with a Probiotic" Pharmaceuticals 7, no. 7: 754-764. https://doi.org/10.3390/ph7070754
APA StyleIgarashi, M., Nagano, J., Tsuda, A., Suzuki, T., Koike, J., Uchida, T., Matsushima, M., Mine, T., & Koga, Y. (2014). Correlation between the Serum Pepsinogen I Level and the Symptom Degree in Proton Pump Inhibitor-Users Administered with a Probiotic. Pharmaceuticals, 7(7), 754-764. https://doi.org/10.3390/ph7070754