AQbD-Driven RP-HPLC Method for Rapid Dissolution Monitoring of Amiodarone Hydrochloride Tablets Without Sample Dilution

Abstract
1. Introduction
2. Results and Discussion
2.1. Method Development and Optimization
2.1.1. Assessment of the Legacy Compendial Method
2.1.2. Stepwise Optimization of the Separation Conditions
2.1.3. Practical Advantages and Sustainable Application of the Final Method
2.2. Analytical QbD Approach: ATP, CAA, and PHA
2.2.1. Definition of ATP and CAAs
2.2.2. Preliminary Hazard Analysis
2.3. Failure Mode and Effects Analysis
2.3.1. Risk Priority Number Calculation via FMEA
2.3.2. Selection of Critical Parameters for Robustness Testing
2.4. Method Validation
2.4.1. System Suitability
2.4.2. Specificity
2.4.3. Linearity and Range
2.4.4. Limit of Detection and Limit of Quantitation
2.4.5. Accuracy
2.4.6. Precision
2.4.7. Robustness
2.4.8. Stability in Dissolution Medium
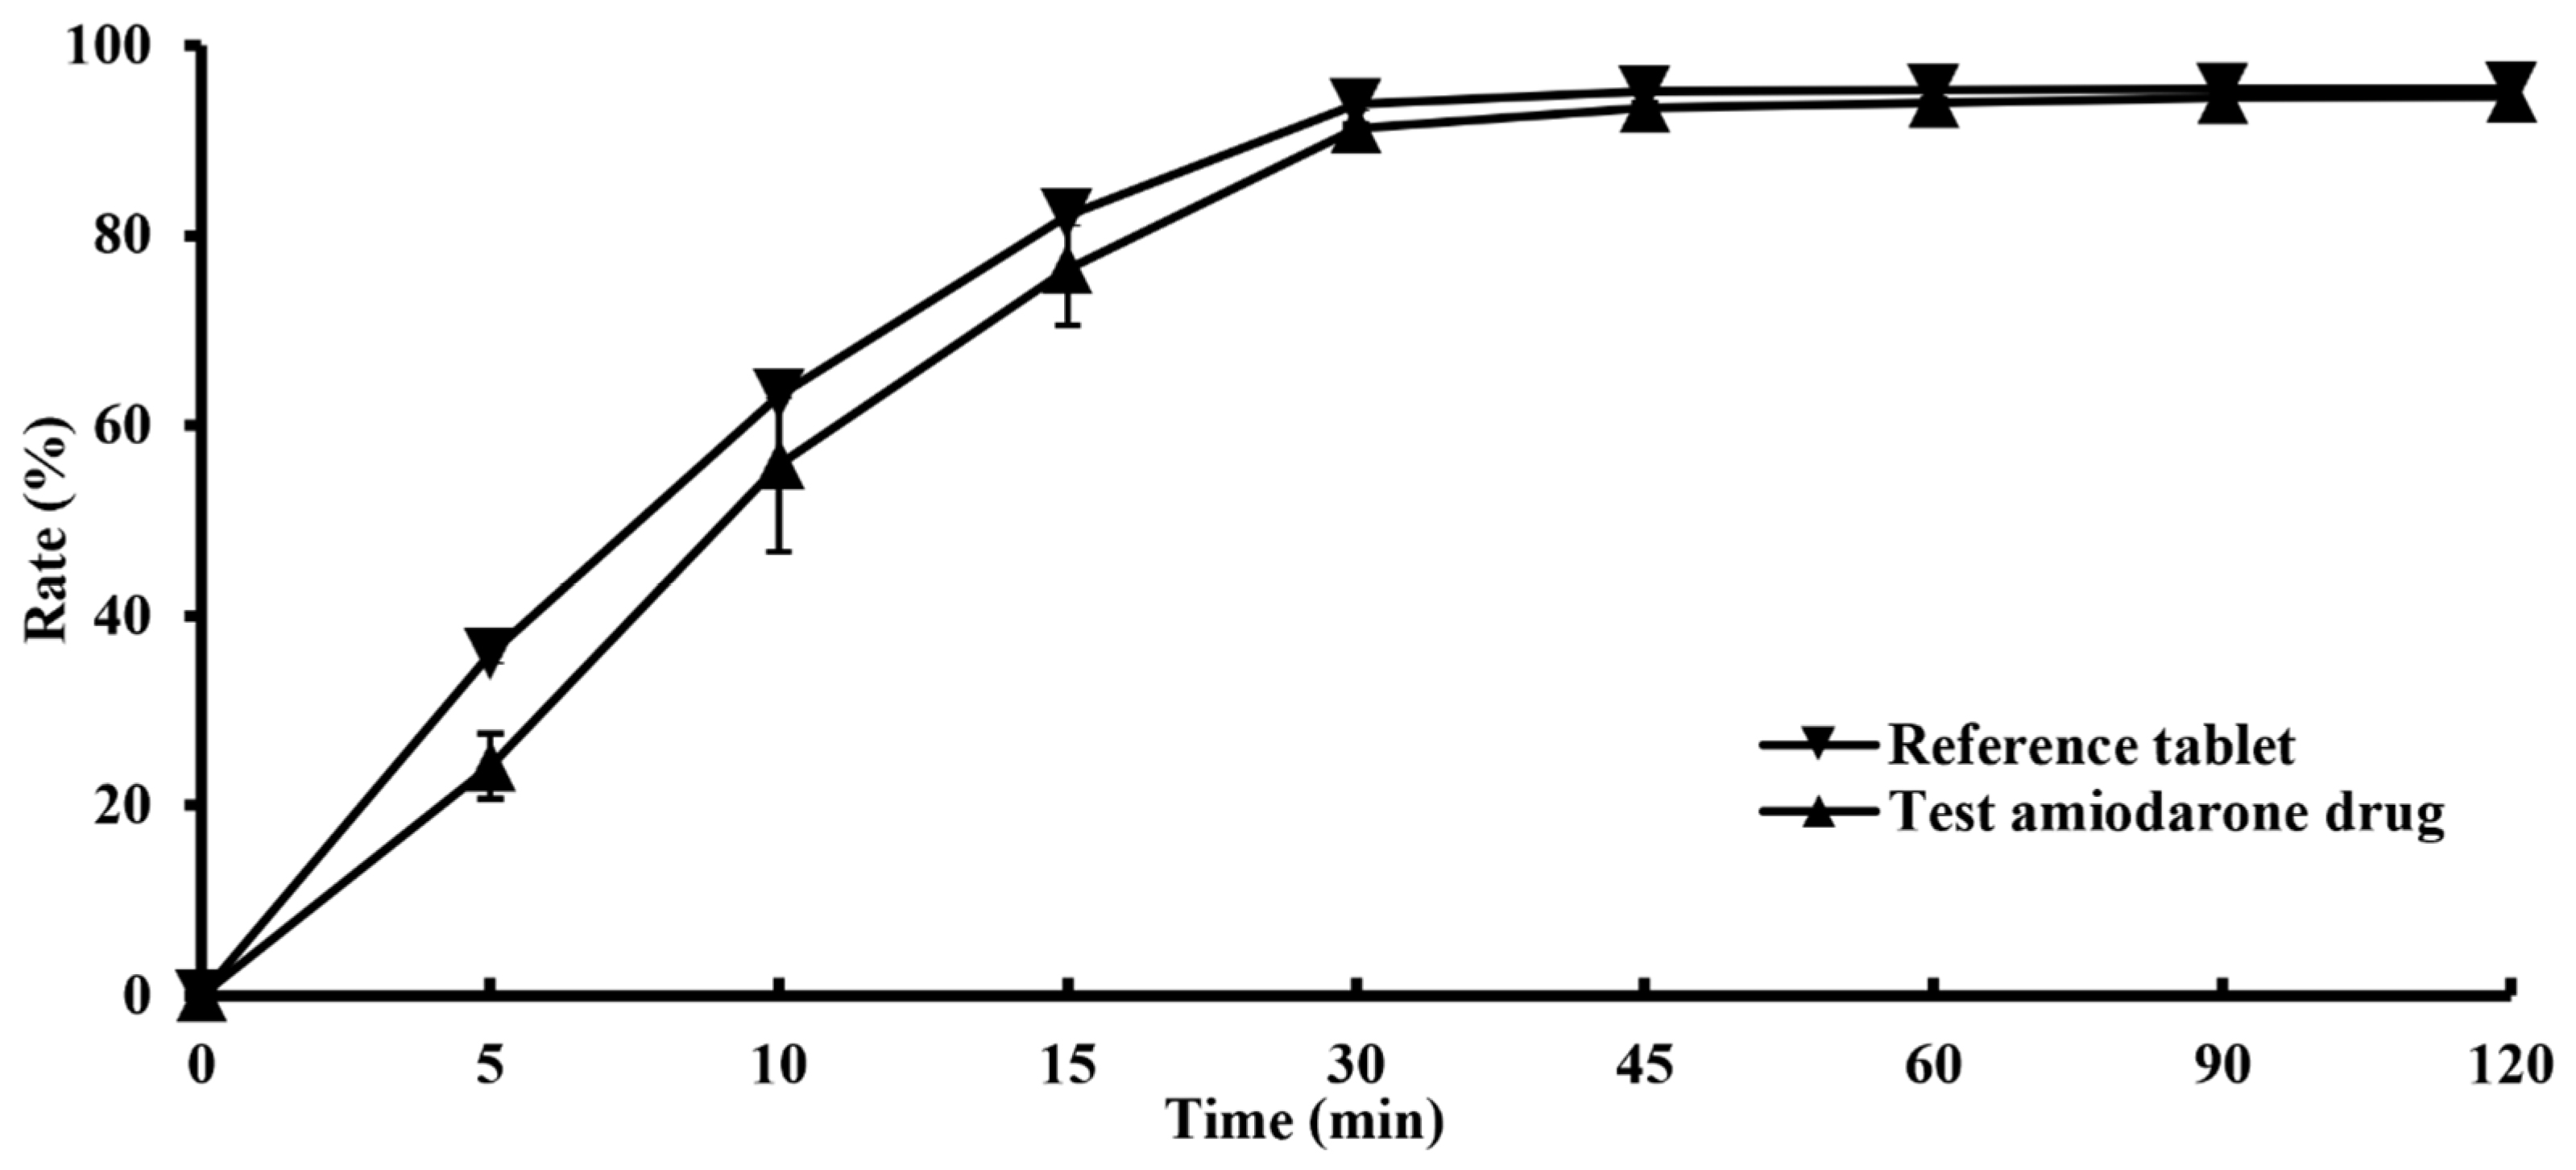
2.5. Application to Dissolution Studies
3. Materials and Method
3.1. Chemicals and Reagents
3.2. ATP and Risk Assessment Approach
3.3. Instrumentation and Chromatographic Conditions
3.4. Preparation of Dissolution Medium
3.5. Preparation of Analytical Solutions
3.5.1. Standard and QC Solutions
3.5.2. Placebo and Matrix Solutions
3.5.3. Dissolution Samples
3.6. Method Validation
3.6.1. System Suitability
3.6.2. Specificity
3.6.3. Linearity and Range
3.6.4. Limit of Detection and Limit of Quantitation
3.6.5. Accuracy
3.6.6. Precision
3.6.7. Robustness
3.6.8. Stability in Dissolution Medium
4. Conclusions
Supplementary Materials
Author Contributions
Funding
Institutional Review Board Statement
Informed Consent Statement
Data Availability Statement
Conflicts of Interest
Abbreviations
| USP | United States Pharmacopeia |
| QC | quality control |
| AQbD | analytical quality by design |
| ICH | International Council for Harmonisation |
| ATP | analytical target profile |
| CAAs | critical analytical attributes |
| PHA | preliminary hazard analysis |
| FMEA | failure mode and effects analysis |
| RP-HPLC | reversed-phase high-performance liquid chromatography |
| LOD | limit of detection |
| LOQ | limit of quantitation |
| RSD | relative standard deviation |
| S | severity |
| O | occurrence |
| D | detectability |
| RPN | risk priority number |
| CMPs | critical method parameters |
| SD | standard deviation |
| σ | standard deviation of the response |
| S | the slope of the calibration curve |
| TEA | triethylamine |
| RH | relative humidity |
| API | active pharmaceutical ingredient |
| UV-Vis | ultraviolet–visible |
| RC | regenerated cellulose |
References
- Jadhav, C.M.; Bairagi, V. Detection & Classification of Cardiac Arrhythmia. Int. J. Inform. Commun. Technol. 2017, 6, 31–36. [Google Scholar] [CrossRef][Green Version]
- Esmail, M.; Nilufar, D.; Majid, G.-E.; Reza, T.-N.M.; Abolfazl, M. Prophylactic effect of amiodarone in atrial fibrillation after coronary artery bypass surgery; a double-blind randomized controlled clinical trial. J. Cardiovasc. Dis. Res. 2015, 6, 12–17. [Google Scholar] [CrossRef]
- Kodama, I.; Kamiya, K.; Toyama, J. Amiodarone: Ionic and cellular mechanisms of action of the most promising class III agent. Am. J. Cardiol. 1999, 84, 20–28. [Google Scholar] [CrossRef] [PubMed]
- Kodama, I.; Kamiya, K.; Toyama, J. Cellular electropharmacology of amiodarone. Cardiovasc. Res. 1997, 35, 13–29. [Google Scholar] [CrossRef] [PubMed]
- Yoon, J.-H.; Jeon, C.-W.; Kim, J.-E. Transitioning Amiodarone Tablet Manufacturing: A Comparative Study of Batch and Continuous Wet Granulation. Pharmaceuticals 2026, 19, 850. [Google Scholar] [CrossRef] [PubMed]
- Essebag, V. Class I and class III antiarrhythmic agents: Mechanisms of action and the problem of proarrhythmic activity. McGill J. Med. 1995, 1. [Google Scholar]
- de Lima Conceição, M.R.; Teixeira-Fonseca, J.L.; Marques, L.P.; Souza, D.S.; Roman-Campos, D. Interaction of the antiarrhythmic drug Amiodarone with the sodium channel Nav1. 5 depends on the extracellular pH. Eur. J. Pharmacol. 2023, 960, 176127. [Google Scholar] [CrossRef] [PubMed]
- Gelman, I.; Sharma, N.; Mckeeman, O.; Lee, P.; Campagna, N.; Tomei, N.; Baranchuk, A.; Zhang, S.; El-Diasty, M. The ion channel basis of pharmacological effects of amiodarone on myocardial electrophysiological properties, a comprehensive review. Biomed. Pharmacother. 2024, 174, 116513. [Google Scholar] [CrossRef] [PubMed]
- Mujović, N.; Dobrev, D.; Marinković, M.; Russo, V.; Potpara, T.S. The role of amiodarone in contemporary management of complex cardiac arrhythmias. Pharmacol. Res. 2020, 151, 104521. [Google Scholar] [CrossRef] [PubMed]
- Jeon, C.-W.; Yoon, J.-H.; Kim, J.-E. Comparative evaluation and improvement of the analytical method for amiodarone hydrochloride: Replacing the pharmacopeial method with a validated RP-HPLC technique. Appl. Sci. 2026, 16, 1920. [Google Scholar] [CrossRef]
- Dispas, A.; Sacré, P.-Y.; Ziemons, E.; Hubert, P. Emerging analytical techniques for pharmaceutical quality control: Where are we in 2022? J. Pharm. Biomed. Anal. 2022, 221, 115071. [Google Scholar] [CrossRef] [PubMed]
- Al-Rimawi, F. Validation of an HPLC-UV method for the determination of amiodarone impurities in tablet formulations. Pharm. Anal. Acta 2010, 1, 1000105. [Google Scholar] [CrossRef]
- Dai, J.; Carr, P.W.; McCalley, D.V. A new approach to the determination of column overload characteristics in reversed-phase liquid chromatography. J. Chromatogr. A 2009, 1216, 2474–2482. [Google Scholar] [CrossRef] [PubMed]
- Buckenmaier, S.M.; McCalley, D.V.; Euerby, M.R. Overloading study of bases using polymeric RP-HPLC columns as an aid to rationalization of overloading on silica-ODS phases. Anal. Chem. 2002, 74, 4672–4681. [Google Scholar] [CrossRef] [PubMed]
- Hussen, A.A. High-Performance Liquid Chromatography (HPLC): A review. Ann. Adv. Chem. 2022, 6, 010–020. [Google Scholar] [CrossRef]
- Marson, B.M.; Concentino, V.; Junkert, A.M.; Fachi, M.M.; Vilhena, R.O.; Pontarolo, R. Validation of Analytical Methods in a Pharmaceutical Quality System: An Overview Focused on HPLC Methods. Quím. Nova 2020, 43, 1190–1203. [Google Scholar] [CrossRef]
- Patel, K.Y.; Dedania, Z.R.; Dedania, R.R.; Patel, U. QbD approach to HPLC method development and validation of ceftriaxone sodium. Future J. Pharm. Sci. 2021, 7, 141. [Google Scholar] [CrossRef]
- Jeon, C.-W.; Yoon, J.-H.; Kim, J.-E. QbD-Based Formulation Development of Amiodarone Hydrochloride Tablet. Pharmaceutics 2026, 18, 264. [Google Scholar] [CrossRef] [PubMed]
- Guideline, I.H.T. Validation of analytical procedures: Text and methodology. Q2 (R1) 2005, 1, 05. [Google Scholar]
- Kokilambigai, K.S.; Lakshmi, K.S. Analytical quality by design assisted RP-HPLC method for quantifying atorvastatin with green analytical chemistry perspective. J. Chromatogr. Open 2022, 2, 100052. [Google Scholar] [CrossRef]
- Kim, D.-H.; Lee, S.-E.; Kim, J.-E. Development and Validation of RP-HPLC Method for Simultaneous Assay and Dissolution Quantitative Analysis of Pitavastatin-Fenofibrate Complex Dual-Layered Tablets. Appl. Sci. 2026, 16, 2962. [Google Scholar] [CrossRef]
- Yoon, J.-H.; Kim, D.-H.; Kim, J.-E. Quality by Design-Based Formulation Development of an Oral Semaglutide Tablet. Pharmaceutics 2026, 18, 440. [Google Scholar] [CrossRef] [PubMed]
- Damjanoska, A.; Mitreska, K.; Petrova, M.; Acevska, J.; Brezovska, K.; Nakov, N. Dimethyl Isosorbide: An Innovative Bio-Renewable Solvent for Sustainable Chromatographic Applications. Molecules 2025, 30, 2713. [Google Scholar] [CrossRef] [PubMed]
- de Souza, G.L.R.; de Paula Oliveira, A.; Neto, P.S.; de Oliveira, J.B.; Costa, C.L.D.S.; de Souza, P.P.; Silveira, M.B.; Binatti, I. Strategies for the development and optimization of green acetonitrile-free HPLC methods for application in pharmaceutical analysis. Microchem. J. 2025, 213, 113659. [Google Scholar] [CrossRef]
- Kowalska, M.; Woźniak, M.; Kijek, M.; Mitrosz, P.; Szakiel, J.; Turek, P. Management of validation of HPLC method for determination of acetylsalicylic acid impurities in a new pharmaceutical product. Sci. Rep. 2022, 12, 1. [Google Scholar] [CrossRef] [PubMed]
- Demurtas, A.; Pescina, S.; Nicoli, S.; Santi, P.; de Araujo, D.R.; Padula, C. Validation of a HPLC-UV method for the quantification of budesonide in skin layers. J. Chromatogr. B 2021, 1164, 122512. [Google Scholar] [CrossRef] [PubMed]
- Borman, P. Selection of Analytical Technology and Development of Analytical Procedures Using the Analytical Target Profile. Anal. Chem. 2021, 94, 1. [Google Scholar] [CrossRef] [PubMed]
- Chadha, H.D. Application of Box–Behnken Design and Green Analytical Chemistry Principles in Development of HPLC Method to Simultaneously Analyze Combination of Chlorthalidone, Bisoprolol Fumarate, and Cilnidipine. Sep. Sci. Plus 2025, 8, 5. [Google Scholar] [CrossRef]
- Koilpillai, J. Development and characterization of novel surface engineered Depofoam: A QbD coupled failure modes and effects analysis risk assessment-based optimization studies. J. Liposome Res. 2024, 34, 1. [Google Scholar] [CrossRef] [PubMed]
- Mastoras, S. Strategic method development for praziquantel impurity analysis using analytical QbD framework. J. Pharm. Biomed. Anal. 2026, 268, 117206. [Google Scholar] [CrossRef] [PubMed]



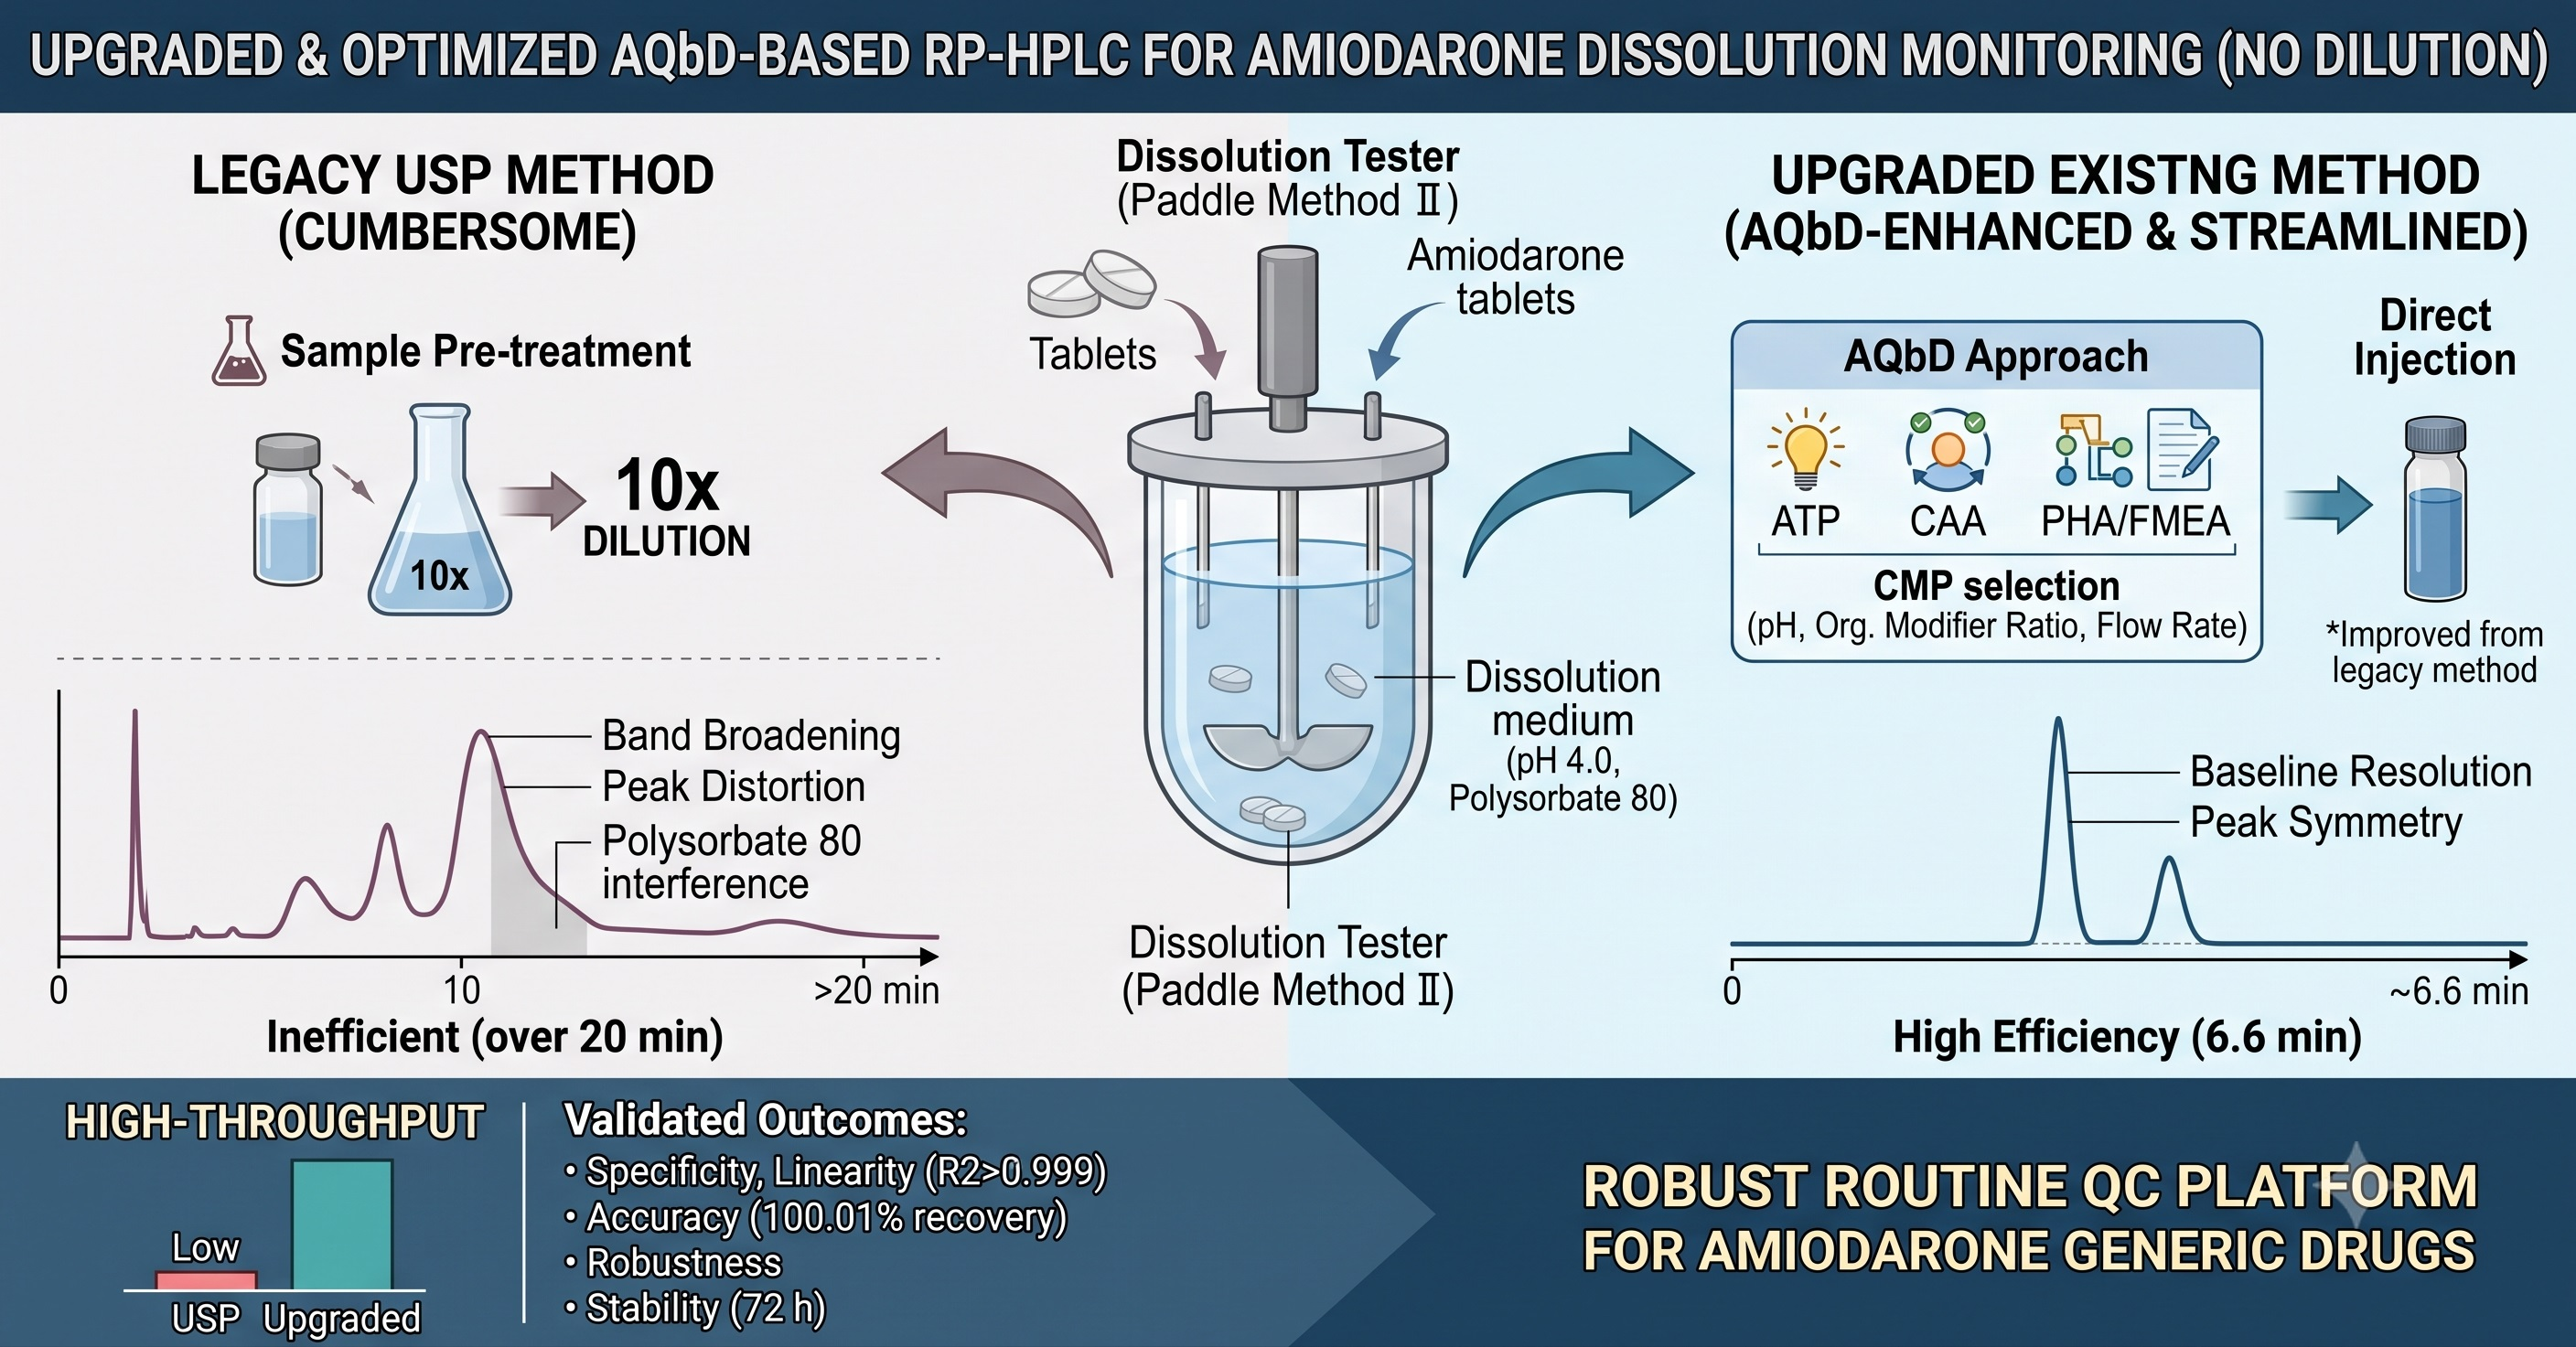
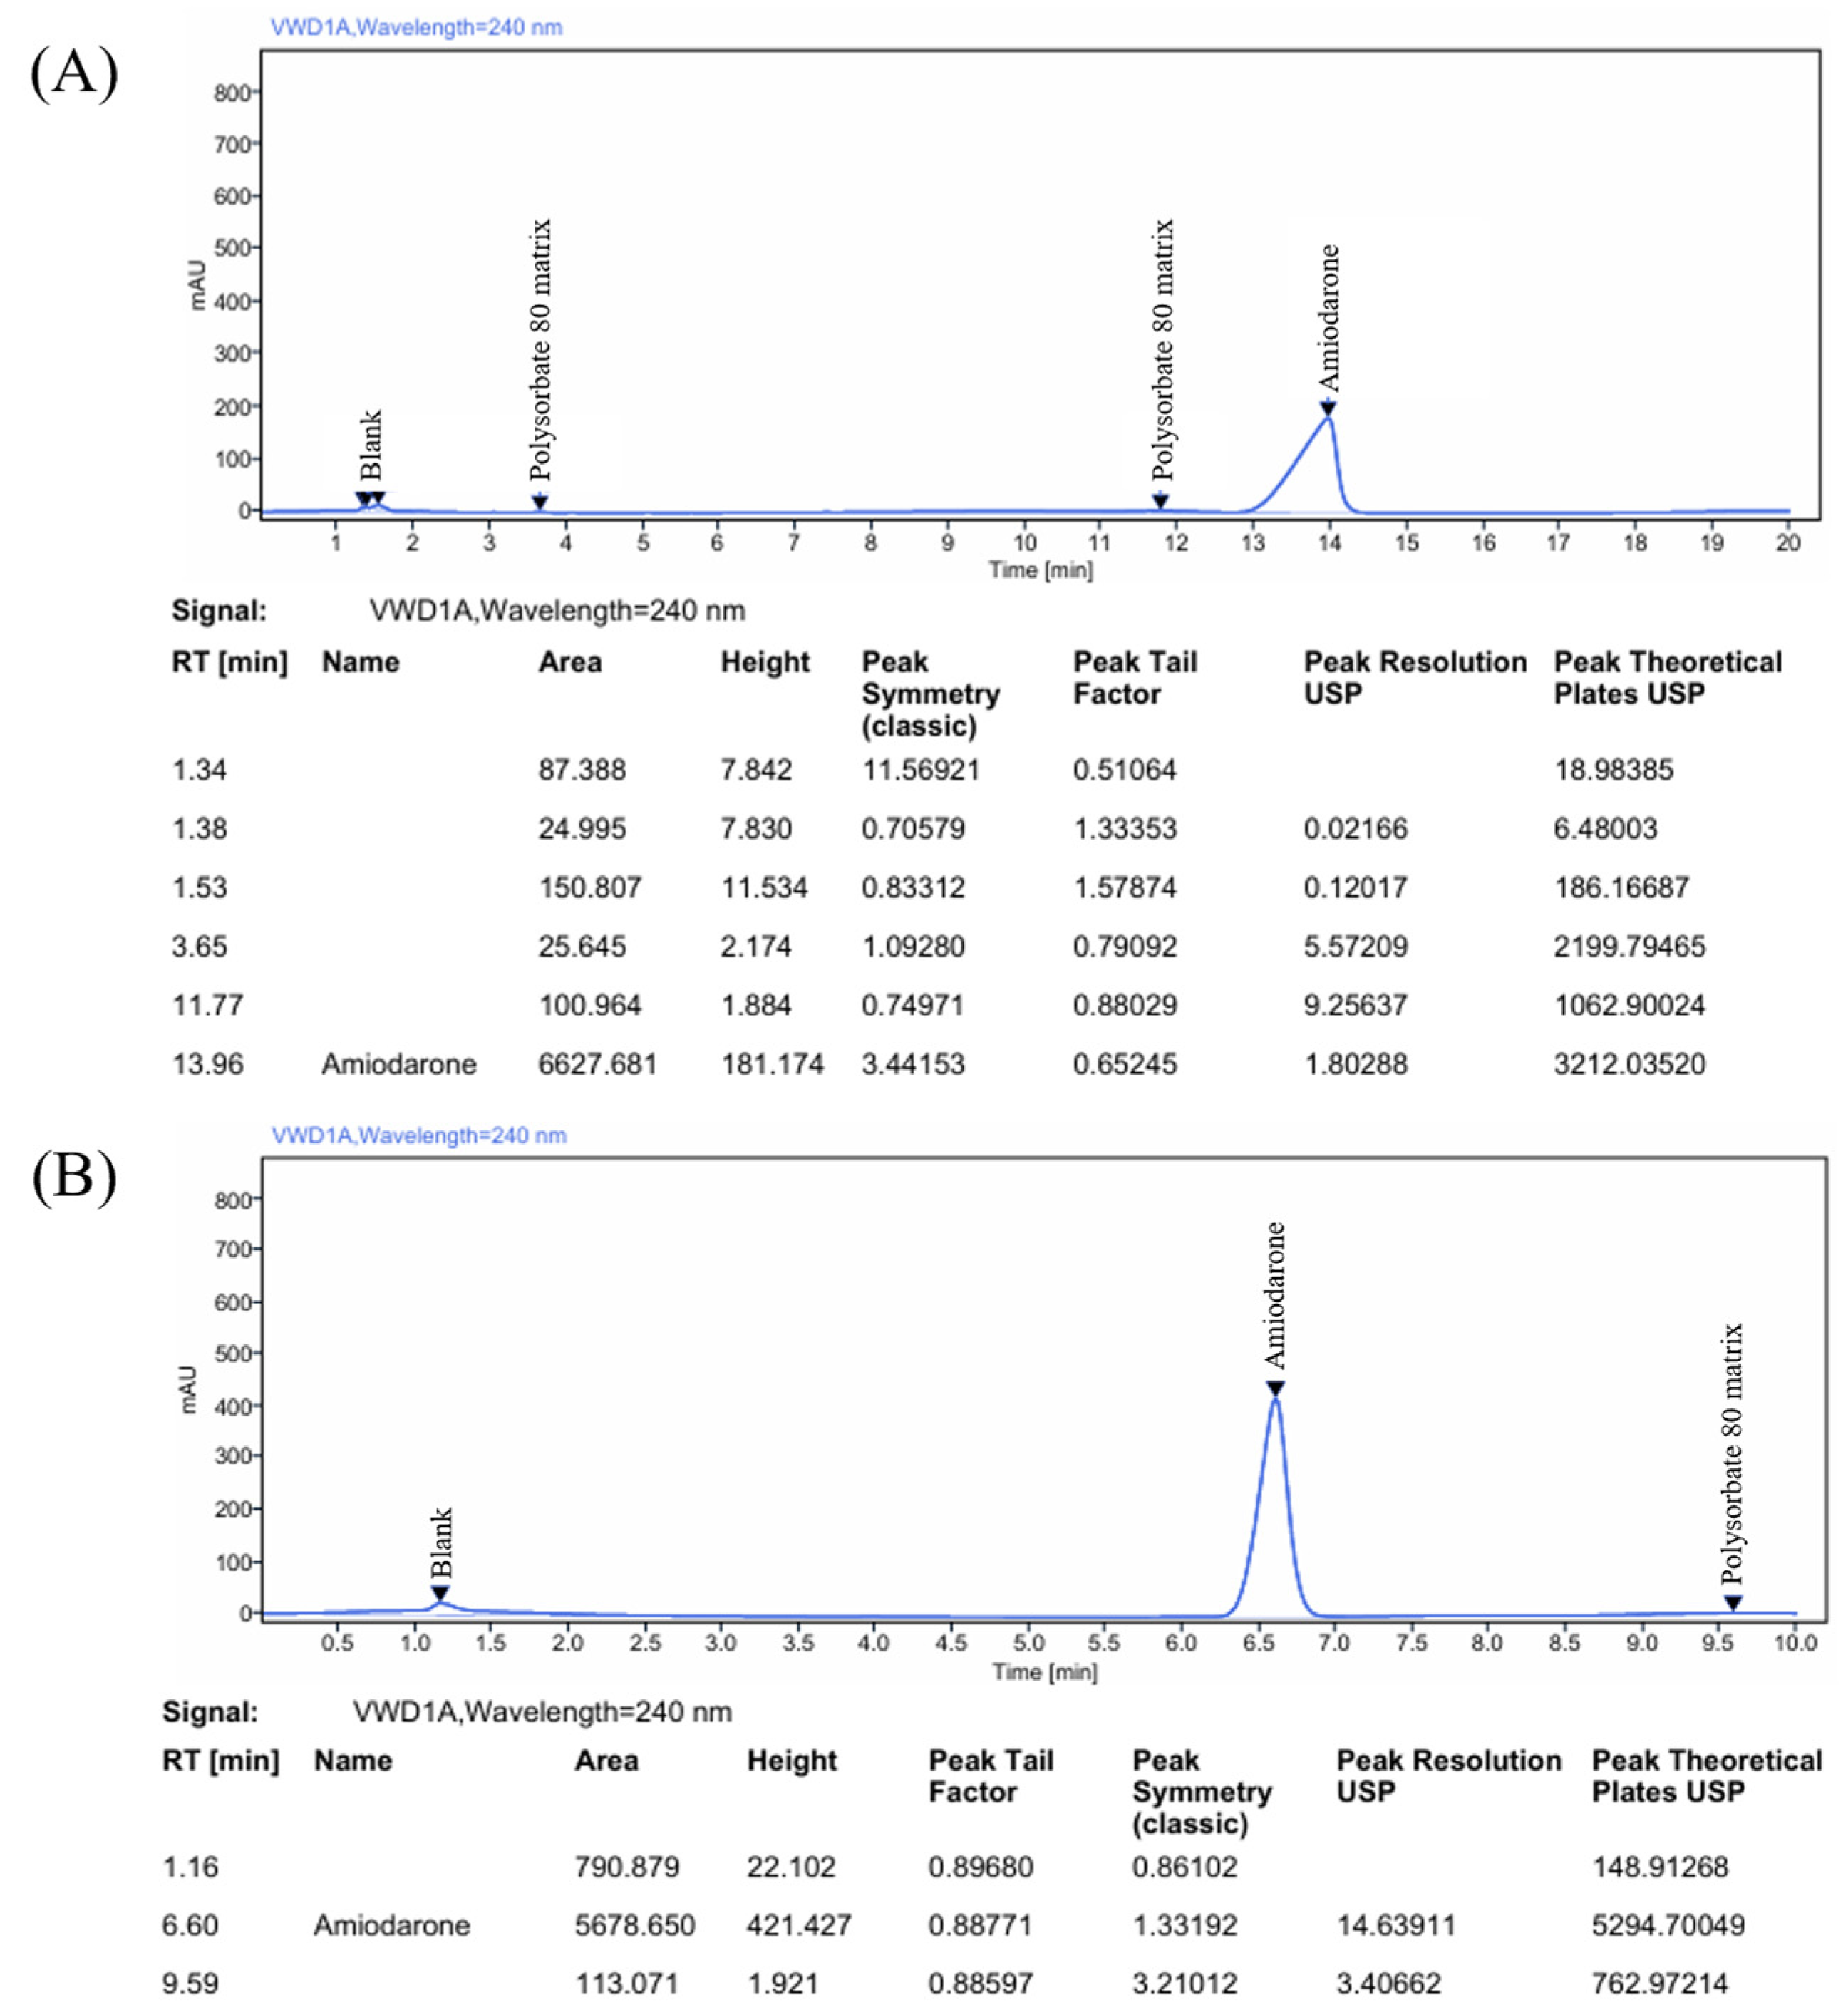
| Analytical Parameter | Legacy USP Method | Proposed RP-HPLC Method | Improvement/Advantage |
|---|---|---|---|
| Sample Preparation | 10-fold dilution required | Direct injection | Eliminates pre-treatment step, reduces potential dilution errors |
| Run Time | 20 min | 10 min | ~50% reduction, enables high-throughput routine QC |
| Tailing Factor | 0.65 | 0.88 | Resolves severe peak fronting |
| Symmetry Factor | 3.44 | 1.33 | Ensures normal, symmetrical peak elution |
| Resolution (from matrix) | 1.80 | 14.6 | Complete baseline isolation from polysorbate 80 |
| Theoretical Plates | 3212 | 5294 | Improved column efficiency |
| ATP Elements | Target | Is This a CAA? | Justification |
|---|---|---|---|
| Resolution | Baseline resolution (≥1.5) from adjacent impurity/degradation peaks. | Yes | Ensures accurate quantification of amiodarone without mutual interference. |
| Retention time | Consistent retention time (RSD ≤ 1.0%) for proper peak identification. | Yes | Demonstrates system consistency and ensures accurate identification of the analyte. |
| Tailing factor | Tailing factor for the amiodarone peak ≤ 2.0. | Yes | Limits peak asymmetry to reduce integration errors and ensure accuracy. |
| Symmetry factor | Peak symmetry factor maintained within 0.8–1.5. | Yes | Verifies normal column condition and symmetrical peak elution. |
| Theoretical plate number | Theoretical plate number for the amiodarone peak ≥ 3000. | Yes | Verifies sufficient column efficiency for routine analytical operation. |
| Quantitative response | Linear response with R2 ≥ 0.99 across the dissolution testing range. | Yes | Ensures a proportional relationship between concentration and detector response. |
| Accuracy of quantification | Recovery of 95.0–105.0% relative to the nominal concentration. | Yes | Ensures closeness between measured and true values within dissolution limits. |
| Precision of measurement | Peak area RSD ≤ 2.0% for repeatability and intermediate precision. | Yes | Demonstrates reproducibility during serial analysis of sample batches. |
| Analytical sensitivity | LOD and LOQ sufficiently lower than the earliest dissolution timepoints. | Yes | Ensures reliable quantification across the entire dissolution profile. |
| Sample solution stability | Standard and sample solutions stable for ≥72 h at room temperature. | Yes | Ensures analyte integrity during sequence runs and autosampler wait times. |
| CAAs | Organic Modifier Ratio | Mobile Phase pH | Flow Rate | Column Temperature | Buffer Concentration |
|---|---|---|---|---|---|
| Resolution | High | High | Medium | Medium | Medium |
| Retention time | High | High | High | Medium | Low |
| Tailing factor | High | High | Low | Medium | Medium |
| Symmetry factor | High | High | Low | Medium | Medium |
| Theoretical plate number | Medium | Medium | High | Medium | High |
| Quantitative response | High | Medium | Low | Low | Low |
| Accuracy of quantification | Medium | Medium | Low | Low | Medium |
| Precision of measurement | Medium | Medium | Medium | Medium | Medium |
| Analytical sensitivity | Medium | Low | Low | Low | Low |
| Sample solution stability | Low | Low | Low | Low | Low |
| Process Variables | Failure Mode | Potential Failure Effects on CAAs | S | O | D | RPN |
|---|---|---|---|---|---|---|
| Organic modifier ratio | Incorrect ratio of aqueous and organic components | Changes in organic modifier ratio directly shift elution strength, potentially leading to baseline overlap between amiodarone and Polysorbate 80 peaks. | 4 | 4 | 4 | 64 |
| Mobile phase pH | Inaccurate pH adjustment of buffer solution | Incorrect pH alters the ionization state of amiodarone, leading to critical peak distortion, severe fronting, and failure in symmetry criteria. | 5 | 4 | 3 | 60 |
| Flow rate | Deviation from optimal flow rate | Flow rate variations shift the retention time of the target analyte and compromise chromatographic efficiency and theoretical plate numbers. | 4 | 3 | 4 | 48 |
| Buffer concentration | Inappropriate buffer salt concentration | Incorrect ionic strength fails to mask residual silanol interactions, potentially degrading peak resolution and theoretical plates. | 3 | 3 | 4 | 36 |
| Column temperature | Temperature fluctuation | Column temperature changes slightly affect analyte–stationary phase interactions, leading to minor shifts in peak shape and retention consistency. | 3 | 2 | 4 | 24 |
| Standard Solution Number | Retention Time (min) | Area | Tailing Factor | Symmetry Factor | Resolution | Theoretical Plate Number |
|---|---|---|---|---|---|---|
| 1 | 6.61 | 5670.289 | 0.88 | 1.34 | 14.3 | 5224 |
| 2 | 6.60 | 5678.650 | 0.89 | 1.33 | 14.6 | 5094 |
| 3 | 6.61 | 5677.002 | 0.88 | 1.33 | 14.8 | 5247 |
| 4 | 6.61 | 5673.994 | 0.89 | 1.34 | 14.6 | 5195 |
| 5 | 6.61 | 5671.526 | 0.88 | 1.34 | 15.0 | 5186 |
| 6 | 6.61 | 5665.621 | 0.88 | 1.34 | 15.2 | 5193 |
| Average (%) | 6.61 | 5672.847 | 0.88 | 1.34 | 14.7 | 5190 |
| Standard deviation (SD) | 0.00 | 4.75 | 0.00 | 0.00 | 0.33 | 52.21 |
| RSD (%) | 0.06 | 0.08 | 0.31 | 0.25 | 2.22 | 1.01 |
| Concentration (%) | Peak Area | 95% CI | |||
|---|---|---|---|---|---|
| Test 1 | Test 2 | Test 3 | Average | ||
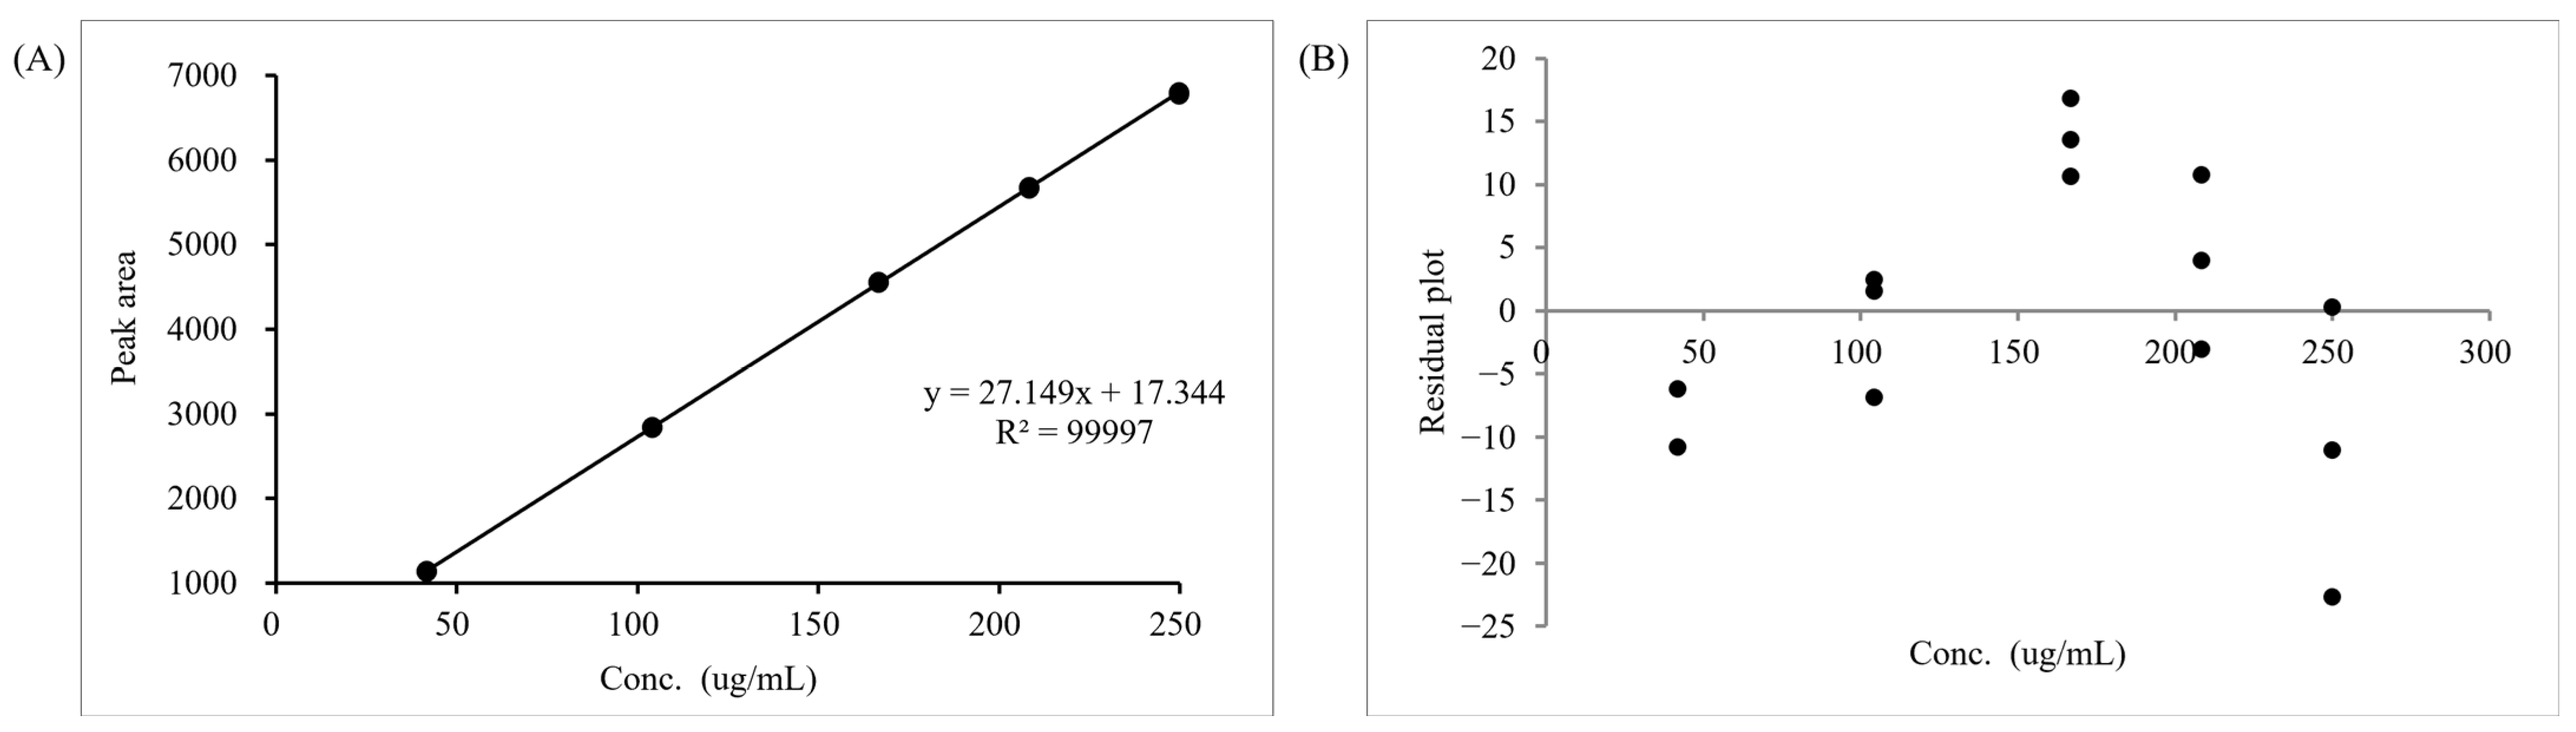
| 20 | 1139.799 | 1144.176 | 1139.600 | 1141.192 | - |
| 50 | 2847.986 | 2847.101 | 2838.648 | 2844.578 | |
| 80 | 4551.274 | 4557.500 | 4554.231 | 4554.335 | |
| 100 | 5674.697 | 5681.488 | 5667.658 | 5674.614 | |
| 120 | 6778.110 | 6789.766 | 6801.116 | 6789.664 | |
| Slope | 27.107 | 27.148 | 27.193 | 27.149 | 27.039 to 27.229 |
| Y-intercept | 21.331 | 20.700 | 10.002 | 17.344 | 3.471 to 37.074 |
| R2 | 0.99997 | 0.99997 | 0.99999 | 0.99997 | - |
| API | σ | S | LOD (μg/mL) | LOQ (μg/mL) |
|---|---|---|---|---|
| Amiodarone Hydrochloride | 6.366 | 27.149 | 0.774 | 2.345 |
| Level (%) | Corrected Concentration (μg/mL) | Found Concentration (μg/mL) | Accuracy (%) | Average (%) |
|---|---|---|---|---|
| 80 | 166.59 | 166.66 | 100.04 | 100.11 |
| 166.69 | 100.06 | |||
| 166.96 | 100.22 | |||
| 100 | 208.23 | 207.90 | 99.84 | 100.03 |
| 208.37 | 100.07 | |||
| 208.61 | 100.18 | |||
| 120 | 249.88 | 249.64 | 99.90 | 99.90 |
| 249.50 | 99.85 | |||
| 249.73 | 99.94 | |||
| Grand average (%) | 100.01 | |||
| Grand RSD (%) | 0.139 | |||
| Number of Determinations (n) | Repeatability | Intermediate Precision |
|---|---|---|
| 1 | 99.96 | 99.32 |
| 2 | 100.23 | 99.28 |
| 3 | 100.24 | 99.62 |
| 4 | 100.12 | 98.66 |
| 5 | 99.42 | 98.45 |
| 6 | 99.40 | 99.42 |
| Average (%) | 99.90 | 99.13 |
| RSD (%) | 0.39 | 0.47 |
| Inter-analyst RSD (%) | 0.43 | |
| Parameter | Standard (45:27:28) | Condition 1 (47:25:28) | Condition 2 (43:29:28) | Condition 3 (46:28:26) | Condition 4 (44:26:30) | |
|---|---|---|---|---|---|---|
| Recovery (%) | 1 | 99.99 | 101.68 | 99.46 | 100.48 | 99.22 |
| 2 | 100.14 | 100.96 | 97.84 | 100.22 | 99.40 | |
| 3 | 100.11 | 101.13 | 97.86 | 100.17 | 99.82 | |
| Average (%) | 100.08 | 101.26 | 98.39 | 100.29 | 99.48 | |
| Standard deviation (SD) | 0.08 | 0.37 | 0.93 | 0.17 | 0.31 | |
| RSD (%) | 0.08 | 0.37 | 0.94 | 0.17 | 0.31 | |
| Difference (%) | - | 1.18 | 1.69 | 0.21 | 0.60 | |
| Retention time (min) | 6.61 | 6.62 | 7.04 | 6.17 | 7.44 | |
| Tailing factor | 0.89 | 1.07 | 1.02 | 0.88 | 1.18 | |
| Symmetry factor | 1.34 | 0.94 | 1.01 | 0.88 | 0.80 | |
| Resolution | 14.6 | 13.6 | 13.4 | 8.1 | 14.0 | |
| Theoretical plate number | 5189 | 5357 | 5044 | 4269 | 4872 | |
| Parameter | Standard (pH 4.0) | pH 3.8 | pH 4.2 | |
|---|---|---|---|---|
| Recovery (%) | 1 | 99.99 | 99.98 | 100.28 |
| 2 | 100.14 | 99.77 | 100.13 | |
| 3 | 100.11 | 99.64 | 100.23 | |
| Average (%) | 100.08 | 99.80 | 100.21 | |
| Standard deviation (SD) | 0.08 | 0.17 | 0.08 | |
| RSD (%) | 0.08 | 0.17 | 0.07 | |
| Difference (%) | - | 0.28 | 0.13 | |
| Retention time (min) | 6.61 | 5.83 | 8.49 | |
| Tailing factor | 0.89 | 1.31 | 0.75 | |
| Symmetry factor | 1.34 | 0.69 | 2.14 | |
| Resolution | 14.6 | 9.0 | 7.6 | |
| Theoretical plate number | 5189 | 4214 | 3742 | |
| Parameter | Standard (1.2 mL/min) | 1.1 mL/min | 1.3 mL/min | |
|---|---|---|---|---|
| Recovery (%) | 1 | 99.99 | 99.33 | 98.79 |
| 2 | 100.14 | 99.65 | 98.80 | |
| 3 | 100.11 | 99.60 | 99.03 | |
| Average (%) | 100.08 | 99.53 | 98.87 | |
| Standard deviation (SD) | 0.08 | 0.18 | 0.14 | |
| RSD (%) | 0.08 | 0.18 | 0.14 | |
| Difference (%) | - | 0.55 | 1.21 | |
| Retention time (min) | 6.61 | 7.37 | 6.21 | |
| Tailing factor | 0.89 | 1.01 | 1.08 | |
| Symmetry factor | 1.34 | 1.03 | 0.93 | |
| Resolution | 14.6 | 13.8 | 7.2 | |
| Theoretical plate number | 5189 | 5349 | 4552 | |
| Parameter | Standard (50 °C) | 45 °C | 55 °C | |
|---|---|---|---|---|
| Recovery (%) | 1 | 99.99 | 100.23 | 98.23 |
| 2 | 100.14 | 100.22 | 100.22 | |
| 3 | 100.11 | 100.42 | 100.60 | |
| Average (%) | 100.08 | 100.29 | 99.68 | |
| Standard deviation (SD) | 0.08 | 0.12 | 1.28 | |
| RSD (%) | 0.08 | 0.12 | 1.28 | |
| Difference (%) | - | 0.21 | 0.84 | |
| Retention time (min) | 6.61 | 6.95 | 6.73 | |
| Tailing factor | 0.89 | 1.30 | 0.94 | |
| Symmetry factor | 1.34 | 0.81 | 1.20 | |
| Resolution | 14.6 | 6.3 | 2.1 | |
| Theoretical plate number | 5189 | 4934 | 5043 | |
| Parameter | Standard (TEA Volume 5.0 mL) | TEA Volume 4.5 mL | TEA Volume 5.5 mL | |
|---|---|---|---|---|
| Recovery (%) | 1 | 99.99 | 98.73 | 99.35 |
| 2 | 100.14 | 98.59 | 99.83 | |
| 3 | 100.11 | 98.50 | 99.79 | |
| Average (%) | 100.08 | 98.61 | 99.66 | |
| Standard deviation (SD) | 0.08 | 0.12 | 0.27 | |
| RSD (%) | 0.08 | 0.12 | 0.27 | |
| Difference (%) | - | 1.47 | 0.42 | |
| Retention time (min) | 6.61 | 6.70 | 6.52 | |
| Tailing factor | 0.89 | 0.95 | 0.97 | |
| Symmetry factor | 1.34 | 1.17 | 1.12 | |
| Resolution | 14.6 | 13.8 | 13.6 | |
| Theoretical plate number | 5189 | 5211 | 5180 | |
| Parameter | Initial | 12 h | 24 h | 48 h | 72 h | |
|---|---|---|---|---|---|---|
| Standard Peak area | 1 | 5683.162 | 5640.830 | 5635.859 | 5519.935 | 5451.775 |
| 2 | 5680.443 | 5629.122 | 5627.855 | 5526.779 | 5480.521 | |
| 3 | 5681.195 | 5616.914 | 5658.175 | 5504.308 | 5446.549 | |
| Average | 5681.600 | 5628.955 | 5640.630 | 5517.007 | 5459.615 | |
| Sample Peak area | 1 | 5672.978 | 5595.115 | 5626.865 | 5582.120 | 5546.575 |
| 2 | 5670.865 | 5610.450 | 5628.418 | 5591.904 | 5543.336 | |
| 3 | 5649.230 | 5598.185 | 5648.904 | 5585.957 | 5544.622 | |
| Average | 5664.358 | 5601.250 | 5634.729 | 5586.660 | 5544.844 | |
| Recovery (%) | 1 | 99.85 | 99.40 | 99.76 | 101.18 | 101.59 |
| 2 | 99.81 | 99.67 | 99.78 | 101.36 | 101.53 | |
| 3 | 99.43 | 99.45 | 100.15 | 101.25 | 101.56 | |
| Mean recovery (%) | 99.70 | 99.51 | 99.90 | 101.26 | 101.56 | |
| Standard deviation (SD) | 0.23 | 0.14 | 0.22 | 0.09 | 0.03 | |
| RSD (%) | 0.23 | 0.14 | 0.22 | 0.09 | 0.03 | |
| Difference (%) | - | 0.19 | 0.20 | 1.57 | 1.87 | |
| The Sample Concentration Level (%) | Stock Solution (mL) | Total Volume (mL) | Concentration (µg/mL) |
|---|---|---|---|
| 20 | 2 | 100 | 44.0 |
| 50 | 5 | 100 | 110.0 |
| 80 | 8 | 100 | 176.0 |
| 100 | 10 | 100 | 220.0 |
| 120 | 12 | 100 | 264.0 |
| The Sample Concentration Level (%) | Stock Solution (mL) | Placebo Stock Solution (mL) | Total Volume (mL) | Concentration (µg/mL) |
|---|---|---|---|---|
| 80 | 8 | 11 | 100 | 176.0 |
| 100 | 10 | 11 | 100 | 220.0 |
| 120 | 12 | 11 | 100 | 264.0 |
Disclaimer/Publisher’s Note: The statements, opinions and data contained in all publications are solely those of the individual author(s) and contributor(s) and not of MDPI and/or the editor(s). MDPI and/or the editor(s) disclaim responsibility for any injury to people or property resulting from any ideas, methods, instructions or products referred to in the content. |
© 2026 by the authors. Licensee MDPI, Basel, Switzerland. This article is an open access article distributed under the terms and conditions of the Creative Commons Attribution (CC BY) license.
Share and Cite
Yoon, J.-H.; Kim, J.-E. AQbD-Driven RP-HPLC Method for Rapid Dissolution Monitoring of Amiodarone Hydrochloride Tablets Without Sample Dilution. Pharmaceuticals 2026, 19, 1255. https://doi.org/10.3390/ph19081255
Yoon J-H, Kim J-E. AQbD-Driven RP-HPLC Method for Rapid Dissolution Monitoring of Amiodarone Hydrochloride Tablets Without Sample Dilution. Pharmaceuticals. 2026; 19(8):1255. https://doi.org/10.3390/ph19081255
Chicago/Turabian StyleYoon, Ju-Hyun, and Joo-Eun Kim. 2026. "AQbD-Driven RP-HPLC Method for Rapid Dissolution Monitoring of Amiodarone Hydrochloride Tablets Without Sample Dilution" Pharmaceuticals 19, no. 8: 1255. https://doi.org/10.3390/ph19081255
APA StyleYoon, J.-H., & Kim, J.-E. (2026). AQbD-Driven RP-HPLC Method for Rapid Dissolution Monitoring of Amiodarone Hydrochloride Tablets Without Sample Dilution. Pharmaceuticals, 19(8), 1255. https://doi.org/10.3390/ph19081255